Vol. 8, Issue 1, pp: (91-97), Month: April 2020 - September 2020, Available at: www.researchpublish.com
Comparison of knee instability in normal and diabetic patients
Sivaprasad Durai1 ,Sherine Susanna.J2 , Yugendhar.R3 ,S.Krishnakumar4 Anna University Rajalakshmi Engineering College,Tamil Nadu, IndiaAbstract: This article is to depict the difference between the force applied by normal and diabetic patients having knee instability and to plot a graph to show the deviation between them. Diabetic patients suffer from many potential complications. One of the major complications is muscle degeneration due to protein imbalance caused by decreased amount of insulin production. This leads to knee weakness and inability to walk normally. This is a main setback in old patients since they are more prone to fall and there is no permanent treatment as of now. Our aim is to determine the deviation of the force applied by the patients with knee instability from the normal population.
Keywords: Diabetes mellitus, knee instability, muscle degeneration, force, deviation.
I. INTRODUCTION
The disease diabetes mellitus in which the body’s ability to produce or respond to the hormone insulin is impaired, resulting in abnormal metabolism of carbohydrates and elevated levels of glucose in the blood. It causes various complications like retinopathy, cardiovascular diseases, neuropathy, foot damage, muscle degeneration and knee instability. Knee buckling is when one or both the knees give out. It is also referred to as knee instability or weak knees. While it is often accompanied by pain, this isn’t always the case. Frequent knee buckling also raises the risk of falling and seriously injury. In one study, 11.8 percent of adults aged 39-94 reported at least one episode of knee buckling in the past 3 months. It can affect people of all ages and levels of fitness especially when they have diabetes. This knee instability is due to the weakness of muscles known as quadriceps muscles that hold the knee cap in position. There is no proper method to diagnose the level of knee instability in diabetic patients in order to give them the necessary support for it.
II. CAUSESFOR KNEEBUCKLING IN DIABETES MELLITUS
Knee buckling in diabetes is due to the degeneration of muscles in other terms known as muscle atrophy. Muscle atrophy refers to the condition in which there is a decrease in mass of the muscle, it can be a partial or complete wasting away of muscle. When muscle atrophies, this leads to muscle weakness, since the ability to exert force is related to mass. Due to diabetic condition, there is imbalance in the protein synthesis and protein degradation where the latter occurs more which leads to atrophy of muscle. Muscle atrophy occurs in the quadriceps muscle which leads to knee buckling in diabetic patients since quadriceps muscle is present in the front thigh and is responsible for the stability for the knee cap. Due to muscle atrophy there is a decrease in muscle tonicity which is the continuous and passive partial contraction of the muscles or the muscle’s resistance to passive stretch during resting state. The tonicity of muscles decreases when there is a decrease in the protein level which is linked to muscle atrophy. This muscle atrophy in the quadriceps muscle which surrounds the knee joint makes it difficult for the muscle to hold the patella in place contributing to knee instability.
III. DEVICE DEVELOPMENT
A. Software
Arduino IDE is used to create the algorithm of the system. All the parameters, flow process and the calculations are preset before the system could be operated. The programming code needs to be uploaded through the Arduino to Zigbee module to transmit the data. The program codes are written in C languages and it needs to be programmed first in order to obtain
International Journal of Healthcare Sciences ISSN 2348-5728 (Online)
Vol. 8, Issue 1, pp: (91-97), Month: April 2020 - September 2020, Available at: www.researchpublish.com
the data from force sensor. The data obtained from the FSR are read as analog reading. Arduino is basically a voltage reference and a 5 volt it will read 1023 and at 0 using the analog read. The force reading is measured based on how much voltage is on the FSR using the analog read. A stable connection will be needed for continuous transmission of data. The readings will be displayed live on the laptop.
B. Hardware
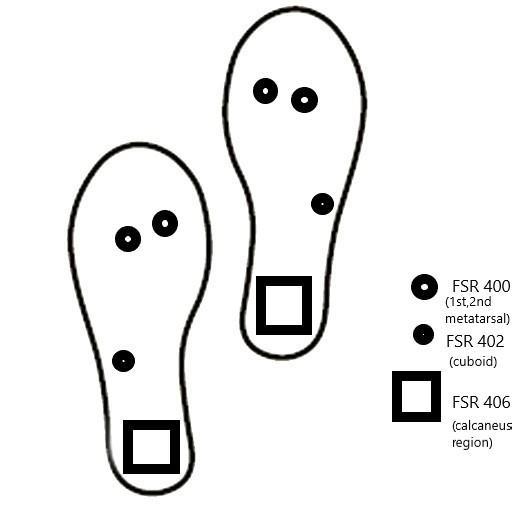
In developing this device a few equipment were needed such as microcontroller (Arduino), circuit board, jumper wires, resistors, USB cable, force sensitive resistor and power supply. For the measurement of force, force sensitive resistor is chosen due to its simplicity, commercial availability and better electronic interfacing capability. The FSR sensor is the sensor that is used to sense the pressure applied by foot during walking. The ranges of the sensing area of each of the sensors are 5.1mm for FSR 400, 14.7mm for FSR 402 to 39.6mm for FSR 406. Before the sensor can be integrated in the system, it needs some calibration process to ensure the obtained results are in small errors. The calibration have been conducted to prove the FSR reading is accurate and best resistor suitable for FSR that could measure force in wide reading range. In validation process, the resistor that has been used is best suited for that particular FSR sensor. An instrumented insole with four FSR located under the slipper insole on each side of the shoes. The FSR are attached to the slipper using tape. The sensor placements are at 1st metatarsal, 2nd metatarsal, cuboid and calcaneus region.
FIG 1: PLACEMENT OF SENSORS IV. METHODOLOGY
a. The sensors are fixed in the shoe in correct positions. For the signal conditioning process, a voltage divider circuit is used where the desirable resistors for the corresponding sensors are connected in series with the FSR sensors.

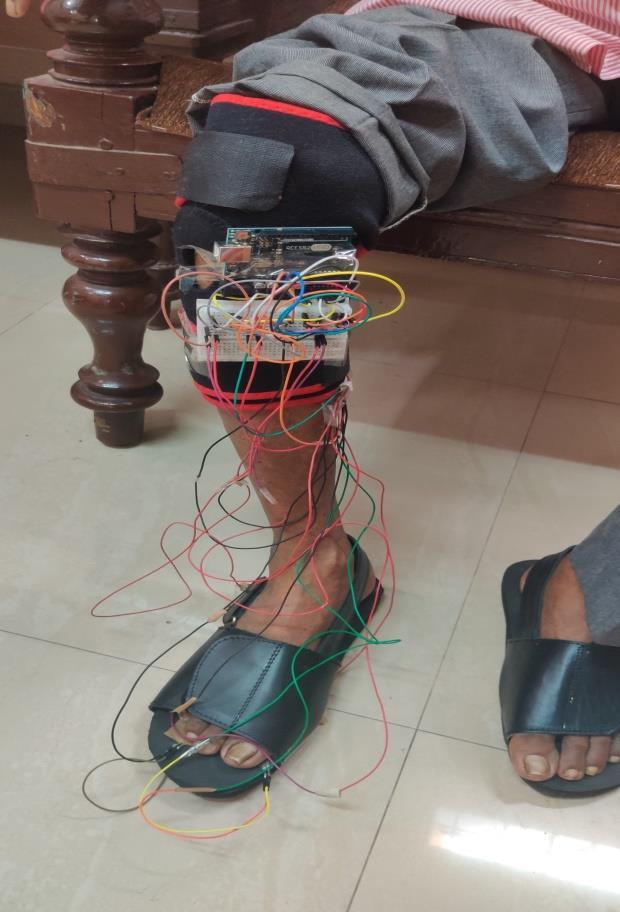
b. The complete circuit which is the Arduino and the circuit board is placed in a control box. This control box is fixed in the knee brace. This prevents any loose wires.
c. The patient is made to walk wearing the slippers and the readings are transmitted to the laptop via Zigbee module. They are made to walk for 20 steps at a stretch for one complete set of readings.
d. The microcontroller first provides the analog voltage reading which is converted to normal voltage and then to resistance value which is then converted to conductance value in order to finally gets the formulated force value. This is all calculated in the coding by executing the formulas in the program.
e. The force readings are compared for normal and abnormal patients and interpreted using a graph in order to find the deviation of the diabetic patients with knee instability from the normal patients.
Vol. 8, Issue 1, pp: (91-97), Month: April 2020 - September 2020, Available at: www.researchpublish.com
FIG 2: SYSTEM SETUP ON PATIENT V. READINGS

The mean values of the readings taken are mentioned below
TABLE I: CALCANEUS REGION
Subject Left Right Normal 161 138 Patient 1 537 351 Patient 2 323 281
TABLE 2: 1ST METATARSAL REGION
Subject Left Right Normal 32 27 Patient 1 12 20 Patient 2 19 17
TABLE 3: 2ND METATARSAL REGION
Subject Left Right Normal 27 28 Patient 1 11 20 Patient 2 18 13
TABLE 4: CUBOID REGION
Subject Left Right Normal 13 11 Patient 1 2 6 Patient 2 5 4
VI. GRAPH


CALCANEUS
CALCANEUS
1ST METATARSAL
RIGHT 1ST METATARSAL
International Journal of Healthcare Sciences ISSN 2348-5728 (Online)
Vol. 8, Issue 1, pp: (91-97), Month: April 2020 - September 2020, Available at: www.researchpublish.com
LEFT 2ND METATARSAL
50


0
100 1 2 3 4 5 6 7 8 9 10 11 12 13 14 15
NORMAL
RIGHT 2ND METATARSAL
NORMAL
LEFT CUBOID
NORMAL
RIGHT CUBOID
NORMAL PATIENT 1 PATIENT 2
VII. RESULTS AND DISCUSSIONS
The mean for all the values are taken to find out the range of deviation. The best fifteen readings out of the total values obtained are taken for the graph to be plotted and the mean is also obtained. The patients are made to walk about twenty steps for a complete set of readings.
International Journal of Healthcare Sciences ISSN 2348-5728 (Online)
Vol. 8, Issue 1, pp: (91-97), Month: April 2020 - September 2020, Available at: www.researchpublish.com
While analysing the graph and the mean values obtained we come to a conclusion that the values in the calcaneus region are high for the diabetic patients when compared to normal person. The other three regions show a relatively lower value than normal. The diabetic patients tend to put a lot of force on the left foot especially in the calcaneus region while walking in order to gain stability. Thus they do not give enough pressure on the other three regions specified. The findings provide insights that can be useful for therapists when monitoring their patients’ improvement after treatment given.
VIII. CONCLUSION
As a conclusion, this project has fulfilled the main objective which is to design and develop a wearable system using Zigbee module and FSR sensors to detect the force distribution on the normal and diabetic patient’s foot. We have been able to deduce which area of the foot the diabetic patients apply more pressure to due to their instability. There were some issues that lead to inconsistency in the data collected by the system. Thus it is suggested to use a marker circuit with conductive ink instead of using jumper cable. Thus it may improve the efficiency together with the aesthetic appearance.
IX. FUTURE WORK
To provide electrical stimulation at a very low frequency and current range (mA) in order to give rise to new muscle fibres and increases the mass of the muscle. Increase in mass also results in the increase in tonicity of muscle. This helps in the contraction of the thighs and brings back the stability to the knee cap. This is a treatment done to cure knee instability after analysing the degree of instability by our experiment.
ACKNOWLEDGMENT
The authors appreciate the extensive guidance from their professors, Department of Biomedical Engineering, Rajalakshmi Engineering College. They would like to acknowledge Rajalakshmi engineering college for their help and for allowing us to make use of the lab facilities during the research.
REFERENCES
[1] Tao W, Zheng R,(2012). Gait analysis using wearable sensors.
[2] https://www.healthline.com/health/knee-buckling
[3] Patrick W. Cawley(1991). The current state of functional knee bracing research: A review of the literature.
[4] https://www.researchgate.net/publication/314157078_Satellite_cells_in_skeletal_muscle_atrophy_and_hypertrophy
[5] https://en.wikipedia.org/wiki/Muscle_atrophy
[6] Frontiers in physiology(Nov 2016)- Effects of neuromuscular electrical stimulation training on endurance performance.
[7] M.S.M Dris(May 2019 IJRTE)-Design and development of insole monitoring system for runner
[8] Zulkifi Ahmed(mar 2015)- A low cost foot plantar shoes forGait monitoring system.
[9] Salpavaara T, Verho J(Sept 2009). Wireless insole sensor system for plantar force measurements during sports events.
[10] M.F. Shaikh, Z. Salcic(2009). Analysis and selection of force sensitive resistors for gait characterization.
[11] M.F. Shaikh, Z. Salcic(2009). Analysis and selection of force sensitive resistors for gait characterization
[12] David V, Jagos H, Litzenberger S, Reichel M. 2012. Instrumented insole for mobile and long distance motion pattern measurement. Procedia Engineering, 34, 760-5.
[13] Hanlon M, Anderson R. 2006. Real-time gait event detection using wearable
[14] Sazonov E, Bumpus T, Zeigler S, Marocco S. Classification of plantar pressure and heel acceleration patterns using neural networks.
[15] Neural Networks, 2005 IJCNN'05 Proceedings 2005 IEEE International Joint Conference on, 5.Schwesig R, Leuchte S, Fischer D, Ullmann R, Kluttig A. 2011.
International Journal of Healthcare Sciences ISSN 2348-5728 (Online)
Vol. 8, Issue 1, pp: (91-97), Month: April 2020 - September 2020, Available at: www.researchpublish.com
AUTHOR INDEX
[1] Sivaprasad Durai – Under graduate student of Rajalakshmi engineering college under bio medical engineering stream. orcid.org/0000-0003-3842-694X (Researcher id).
[2] Sherine Susanna.J – Under graduate student of Rajalakshmi engineering college under bio medical engineering stream. orcid.org/0000-0002-9083-1232(Researcher id)
[3] Yugendhar.R- Under graduate student of Rajalakshmi engineering college under bio medical engineering stream.
[4] Krishnakumar.S- Assistant professor, Biomedical department, Rajalakshmi engineering college
