International Journal of Civil and Structural Engineering Research ISSN 2348-7607 (Online) www.researchpublish.com March 2022, Available at: - ), Month: October 2021 -67
Effect of SHEAR SPAN-TO DEPTH RATIO of Concrete Beams Reinforced with GFRPbars on Shear under fire Exposure
M.A. OSMAN1 , Hala Mamdouh2, Ahmed H. Ali3 , Hamdy. M. Mohamed4 , and T.S.kamal5
1 Professor of Civil Engineering, Helwan University, Cairo, Egypt. E-mail:m_osman62@yahoo.com
2Assoc. Professor of Civil Engineering, Helwan University, Cairo, Egypt. E-mail: dr_hala_mamdoh@yahoo.com
3Assistant. Professor of Civil Engineering, Helwan University , Cairo, Egypt E-mail: Ahmed.Ali@usherbrooke.ca
4Assoc. Professor of Civil Engineering, Helwan University , Cairo, Egypt. E-mail: Hamdy.Mohamed@usherbrooke.ca 5Lecturer assistant, Civil Engineering, Helwan University, Cairo, Egypt E-mail: taher.sayed030@gmail.com
Abstract: Glass bars for concrete reinforcement, known as glass fiber-reinforced polymers (GFRPs), are new natural inorganic materials with distinct mechanical properties that have been used recently in the construction field. Generally, the FRPs bars have no yield before the brittle failure as steel bars and their behavior, when exposed to fire, is still under investigation, this paper presents an experimental study to get more knowledge about the characteristics and the fire resistance of a concrete beam reinforced using GFRPs. Three-scale concrete beams were constructed and tested up to failure under direct fire at 500 ◦C for an hour. Shear span-to depth ratio is the main parameter of this study. Beam (B1) had distance from face of support 670 mm ,beam (B2) had distance from face of support 250 mm and beam (B3) had distance from face of support 500 mm .All beams had 30 mm concrete cover , exposed to fire for an hour and three GFRPs reinforcement bars were used. The results are discussed in terms of load capacity, cracking behaviour, and failure modes. Moreover, the experimental results are compared with theoretical calculations according to the ACI code and other codes. The results show that when distance from face of support over effective depth greater than 2.5 the beams act as slender beams while distance from face of support over effective depth less than 2.5 the beams act as arch action. Our results also showed that when distance from face of support over effective depth 2.02 the failure load incress by percent 60.3% and beam failure as shear failure while distance from face of support over effective depth 1.01 the failure load incress by percent 221.7% and beam failure as flexural failure . More studies are needed to justify our observations in details and determine their applicabilities under different conditions.
Keywords: Shear span, Concrete Beams, Depth ratio, GFRP bars.
1. INTRODUCTION
The development of Fiber Reinforced Polymer (FRP) materials began in the 1940s for military and aerospace applications (C. Ballinger, 1) .FRP are be-coming increasingly popular in the engineering applications as alternative to conventional engineering materials. The unique characteristics of FRP such as their light weight, their resistance to corrosion, and the lower cost of construc-tion and maintenance, are very promising in the application of FRP in civil engineering (Z. M. Lin, 2). A fiber is a material made into a long filament. According to (Zobel, 3), a single fiber usually has a diameter up to 15 um. Bigger diameters generally increase the probability of surface defects. The aspect ratio of length and di-ameter can be ranging from thousand to infinity in continuous fibers. They usually occupy 30-70% of the volume of the composite and
International Journal of Civil and Structural Engineering Research ISSN 2348-7607 (Online) www.researchpublish.com March 2022, Available at: - ), Month: October 2021 -67 Vol. 9, Issue 2, pp: (60
50% of its weight. The main functions of fibers are to carry the load and provide stiff-ness, strength, thermal stability and other structural properties to the FRP (Tuakta, 4). To perform these functions, the fibers in FRP composite must have high modulus of elasticity, high ultimate strength, low variation of strength among fibers, high stability of their strength during handling and high uniformity of diameter and surface dimension among fibers. The type of fibers used as the reinforcement is the basics for classification of FRP composites. There are three types of fibers dominating civil engineering industry: glass, carbon and aramid fibers. The glass fiber strands and woven fabrics are the forms most commonly used in civil engineering application. Relatively low cost compar-ing to other kinds of fibers makes E-glass fibers the most commonly used fi-bers available in the construction industry. The disadvantages of glass fibers are a relatively low young´s modulus, the low humidity and alkaline re-sistance as well as low long term strength due to stress rupture Six reinforced concrete beams were cast at the Construction TechnologyLaboratories of the Portland Cement Association were tested by Bruce Ellingwood' and T. D. Lin,2 Members [5]. All beams were designed according to ACI Standard 318 {Building 1983). Beams were fabricated using normal-weight concrete (Type I portland cement, sand, and carbonate gravel aggregate) with a specified compressive strength of 4,000 psi (2.8 MPa) and Grade 60 deformed reinforcing bars.They found that thickness of concrete cover has little effect on the deflection of beams during the first 3 hr of the fire if the beams are designed in accordance with ACI Standard 318. Kodur et al. [6] tested a series of concrete slabs reinforced internally with either steel or FRP reinforcing bars and subjected to a standard fire. Several parameters were varied between the slabs, including the reinforcement type (steel, glass FRP, or carbon FRP), the concrete aggregate type (siliceous or carbonate), the concrete cover thickness, and the overall slab thickness. The slabs were tested under self weight only and exposed to the ASTM E119 [7] standard fire.He found that The deterioration of bond properties for FRP bars (which has been shown to be much more severe than the bond deterioration of conventional steel reinforcement at elevated temperatures [8]) is not well-known and may vary depending on the fibre type, matrix type, any matrix fillers used in the manufacture of the bars, the surface treatment and deformations on the bars, and the presence of bar splices and/or bends. Studying experimentally the effects of using different ratios of steel bars with basalt bars in the same beam at the normal temperature (25 ◦C) and under fire exposure (500 ◦C for 2 h) on the load capacity, crack pattern, and failure type is provided by Hend Elsayed [9]. Eight reinforced concrete beam specimens were tested in this study. The beam specimens were classified into two groups (G1, G2) according to the fire degree. The effect of high temperatures was evident from the continuous decrease in the load capacity of the beams. This decay was relative to the BFRP bar ratio in the reinforced beams as the load capacity of the steel-reinforced beam was more pronounced than those obtained with 33%, 67%, and 100% of BFRP bars. Consequently, the decrease in failure load was 6–23% compared with that of normal beams at 25 ◦C, owing to the lower thermal conductivity of the BFRP bars as well as BFRP bars have almost the same thermal coefficient of expansion as concrete [10].
2. RESEARCH OBJECTIVE
In this research the chosen rate of fire is (500 ◦C for an hour) as it high enough to represent a fire event, also the concrete has a lower coefficient of thermal conductivity so the movement of heat through it is slow and thus the reinforcement inside it is protected, this rate ensures reaching this temperature to the core of concrete and the internal reinforcement. The main purposes of this research are:
• Studying experimentally the effects of distance from face of support over effective depth ratio under fire exposure (500 ◦C for an hour) on the load capacity, crack pattern, and failure type.
• Theoretical calculations for beam specimens under fire sexposure at 500 ◦C for an hour
Throughout this research, the results may provide fundamental information about the performance of beams reinforced using glass bar as a flexural reinforcement and be able to predict their response under fire exposure.
3. EXPERIMENTAL WORK
3.1. Materials
Experimental concrete mixes were prepared to yield a design compressive strength (fcu) of 31.19 MPa after 28 days. Concrete was produced by adjusting the size of thin and rough aggregates and increasing the quantity of cement paste to achieve high workability and reduce the risk of separation during the placing of concrete. After many attempts of producing the concrete mixes, the final ratios of the contents used for the mixing concrete are as shown in Table 1. The components were mixed using a cylinder tilting rotary mixer. The coarse aggregates, fine aggregates, and cement were dry mixed. Subsequently, water was added at regular intervals into the concrete blend after measuring the amount of
International Journal of Civil and Structural Engineering Research ISSN 2348-7607 (Online) www.researchpublish.com March 2022, Available at: - ), Month: October 2021 -67 Vol. 9, Issue 2, pp: (60
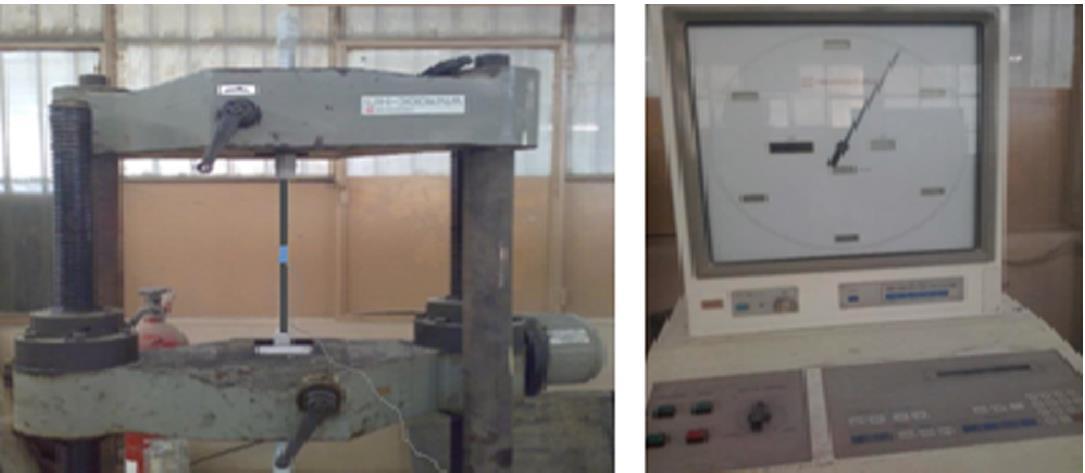
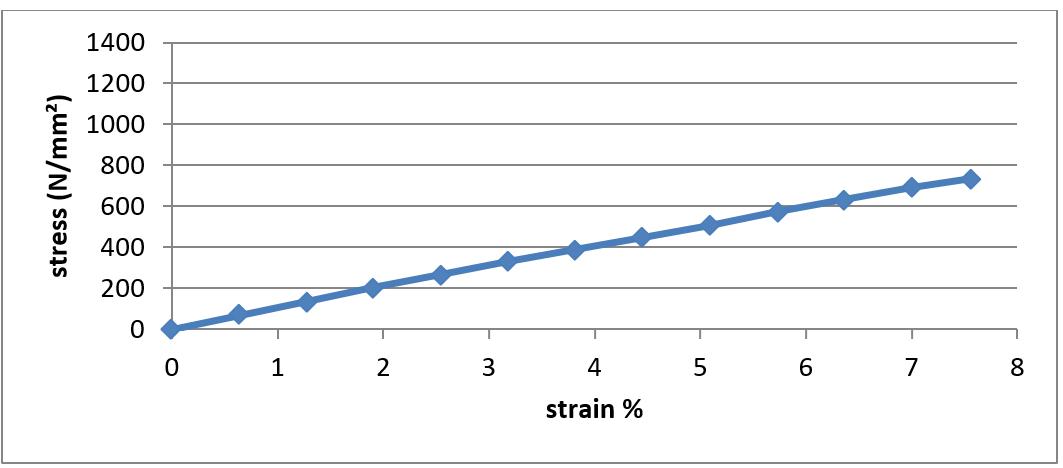
cement, and the cement–water ratio was 0.5. The concrete mix was blended for two more minutes, resulting in a homogeneous concrete mixture. From the concrete mixture, ten cubes measuring 150 mm × 150 mm × 150 mm were cast to determine the compressive strength The casting and curing processes were performed according to the procedures stipulated in the ECP standard specification [11,12]. 12 mm diameter were used as bottom GFRPs reinforcement for all beams. To evaluate the axial tensile strength, at least three samples of bar 12 mm diameter were tested. Electrical strain gauges were bonded at the middle of bar to measure the strain in the bars during the test. As shown in Fig. 1, the test was performed using a Shimadzu machine at the strength of the materials laboratory at Helwan University. The stress-strain curves of the tested bars are shown in Fig. 2. Glass Fiber Reinforced Polymer wrap used in this research was provided by the national center for quality supervision and test of building engineering (BETC-CL2-2014–311(A)).
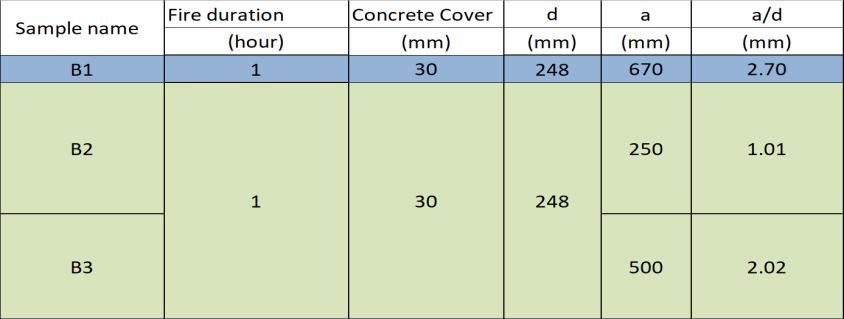
Table 1: Proportions of Components in Concrete Mixture Fig.1.ShimadzuMachine. Fig. 2. Stress-Strain Curve for Glass Bar Table 2: Details of
International Journal of Civil and Structural Engineering Research ISSN 2348-7607 (Online) www.researchpublish.com March 2022, Available at: - ), Month: October 2021 -67 Vol. 9, Issue 2, pp: (60
3.2. Preparing test specimens
Three reinforced concrete beam specimens measuring 150 mm × 300 mm were tested in this study, with a total span of 1650 mm. beams were constructed and tested up to failure under direct fire at 500 ◦C for an hour. Beam (B1) had distance from face of support 670 mm ,beam (B2) had distance from face of support 250 mm and beam (B3) had distance from face of support 500 mm .All beams had 30 mm concrete cover , exposed to fire for an hour and three GFRPs reinforcement bars were used, as shown in Table 2. For the top reinforcement, two 8-mm steel bars for the top reinforcement and three 12-mm GFRPs bars for the bottom reinforcement. The details of the reinforcement and the crosssection of the tested beams are illustrated in Fig. 3. Reinforcement cages were prepared and thirteen clean smooth wooden forms were used for casting all the test specimens as shown in Fig. 4. All beam specimens were cured regularly by a sprinkling of water and covered by sackcloth to prevent moisture release from the concrete surface until the date of testing. Cubes were curing by immersing them in water.
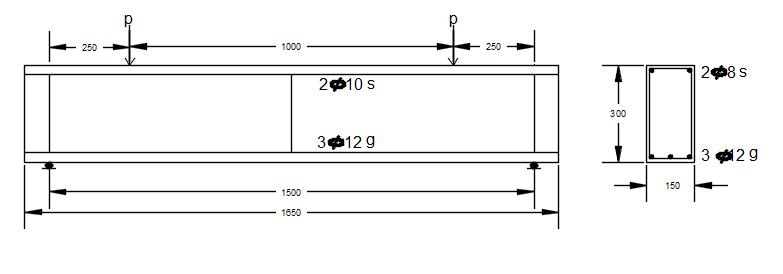
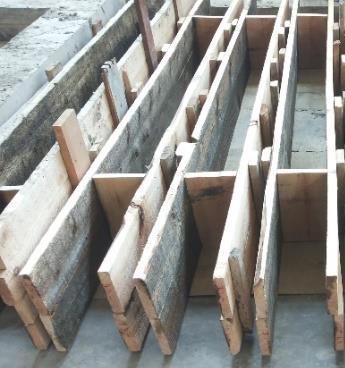

Fig. 3. Details of Tested Beams.

Fig. 4. Details of Reinforcement and Wooden Forms.

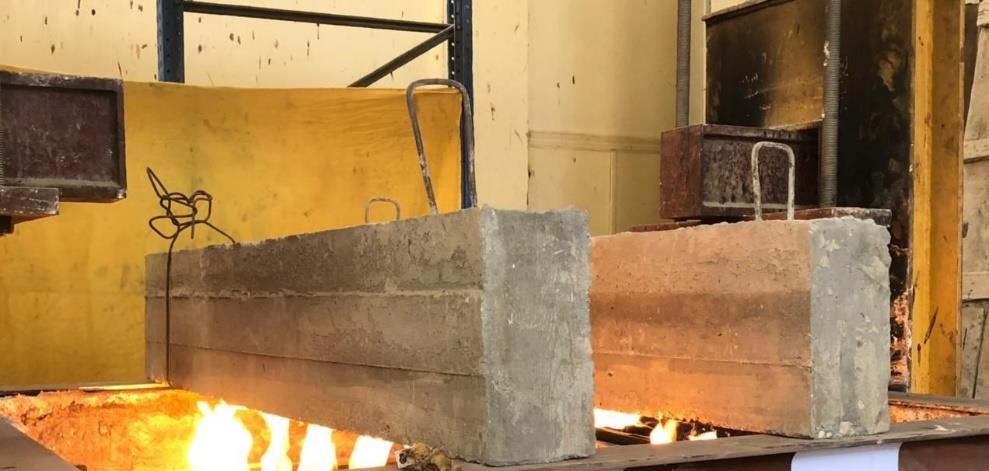
Fig. 5. Beams subjected to Fire
3.3. Fire exposure system
A steel furnace with seven burners lined parallel to each other was used with dimension 2000 mm × 2000 mm × 600 mm; the furnace was heated to the required temperature, i.e. (500 ◦C) and then kept at this temperature for an hour. The beams subjected to direct fire are shown in Fig. 5. The used regime for cooling the fire beams was air.
3.4. Experimental setup and testing
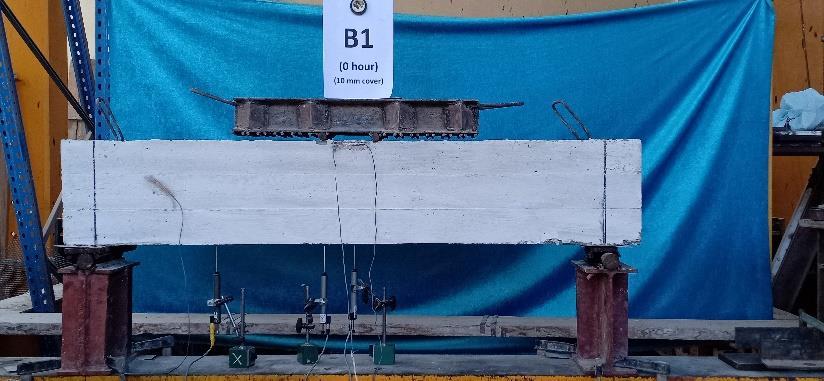
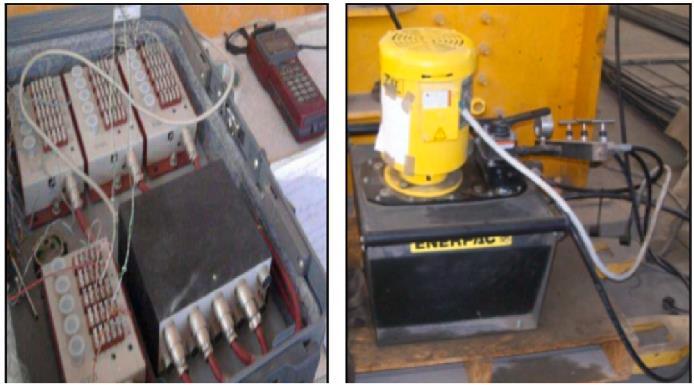
All the beam specimens were subjected to two-point loading under an incremental force control which increased by 2kN per grade until cracks appearing, and then 4kN per grade up to the failure load. During the loading tests, load cells were used to measure the applied load, three linear variable differential transducers (LVDT) were used to measure the deflection (the first one at mid-span, the second under loading point and the third mid between loading point and support, sensors were used to prevent damage during the tests, electrical strain gauges (60 mm length) were attached to measure the concrete strain. The strain gauges were fixed on the at top surfaces of the mid span. The digital load cell of capacity 550kN was adopted to measure the applied load, the load increments, and the displacements were read directly from the data recorder. The crack growth of the specimens during loading and at the time of failure was observed. The test setup and instrumentation are illustrated in Fig. 6.
4. RESULTS AND DISCUSSION
4.1. Cracking load and ultimate load
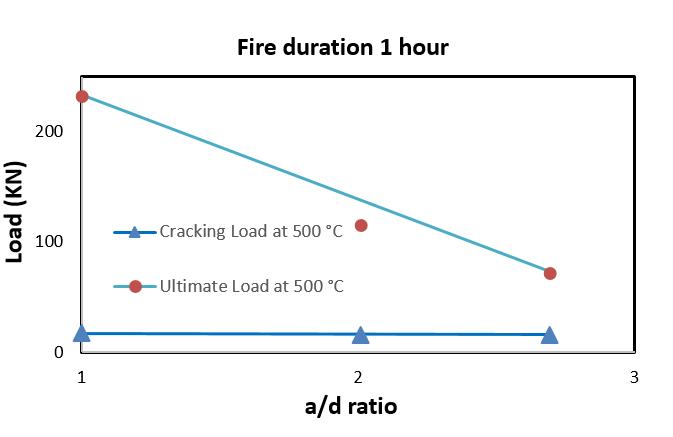
Table 3 shows the results of all tested beams, including the cracking load and its corresponding deflections (Pcr and Δcr) as well as the ultimate load and its corresponding deflection (Pf and Δf). Furthermore, the failure patterns of the GFRP tested beams were observed. Fig. 7 illustrates the effect a/d ratio on the cracking and ultimate loads for all specimens at 500 ◦C. Overall, the quick glance of Table 3 and Fig. 7 reveal that there is a direct relation between a/d ratio and corresponding load capacity values at 500 ◦C for an hour Turning to details, when distance from face of support over effective depth greater than 2.5 the beams act as slender beams while distance from face of support over effective depth less than 2.5 the beams act as arch action. Our results also showed that when distance from face of support over effective
Vol. 9, Issue 2, pp: (60
International Journal of Civil and Structural Engineering Research ISSN 2348-7607 (Online) www.researchpublish.com March 2022, Available at: - ), Month: October 2021 -67
depth 2.02 the failure load incress by percent 60.3% and beam failure as shear failure while distance from face of support over effective depth 1.01 the failure load incress by percent 221.7% and beam failure as flexural failure
Table 3: Summarised Results for Beams Reinforced Using GFRP Bars at 500 ◦C.

Fig. 7. Effect a/d ratio on Cracking and Failure load
4.2. Crack pattern and failure mode
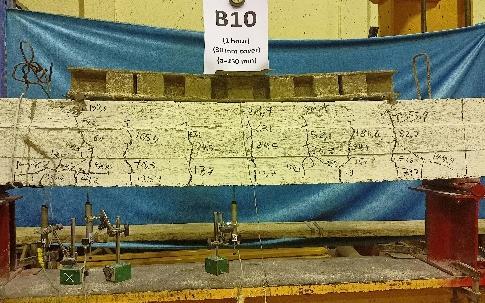
Fig. 8 shows the crack development and failure type for all tested beams. The crack patterns at both faces of all beams were recorded at several load stages up to failure. Comparing the load patterns at both faces revealed that both patterns are largely similar. The specimen remained with no visible cracks until flexural cracking took place. Flexural cracking at first took place at mid-span of the tested beams then flexure-shear cracking and flexural cracking extended over the beam. As loading increased, more flexural and diagonal cracks were formed and cracks became wider. As clearly, the failure mode depend on a/d ratio Due to fire exposure, wider and fewer flexural cracks developed, owing to the reduced strength of concrete and the susceptibility of the resin on the surface of the GFRPs to soften, thereby resulting in a lower bond between reinforcement and surrounding concrete [13], concrete in the compression zone crushed and the concrete cover spalled, the concrete spalling behaviour occurs in the condition of fire due to the low permeability of concrete, which limits the ability of water vapor to escape from the pores, this results in inducing internal pore pressure and thermal stresses [14].
4.3. Load deflection curve
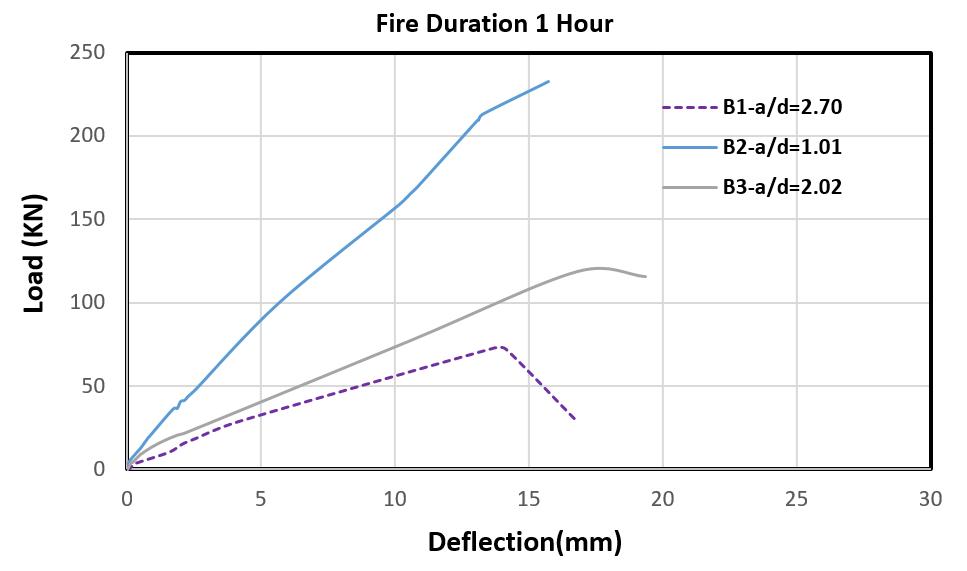
Fig. 9 shows the relationship between the applied load and mid-span deflection for the studied beams, most of the tested beams failed in a ductile manner with large mid-span deflection thus absorbing more energy during failure. The deflections of all beams increased uniformly during loading. As shown, the behaviour of the load–deflection curve of the GFRP reinforced beam was linear before cracking and slightly nonlinear up to failure with lack of yielding. the GFRPs beams with a/d 2.02 the incresse percentage in deflection 15.25%, while the GFRPs beams with a/d 1.01 the incresse percentage in deflection 35.4% The increased deflection will lead to extensive cracking along the length of the beam, thereby significantly reducing its flexural and shear stiffness. So the stiffness of the GFRP RC beam obviously decreased after cracking.The effect of high temperatures was evident from the continuous decrease in the load capacity of the beams.
4.4.
Fig. 8. Crack pattern and Failure Mode of Tested Beams.
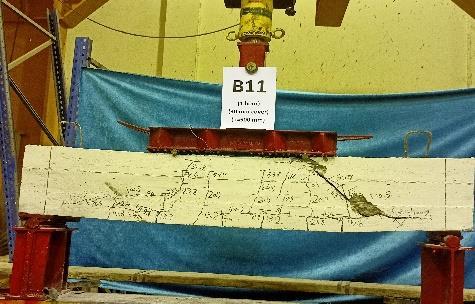
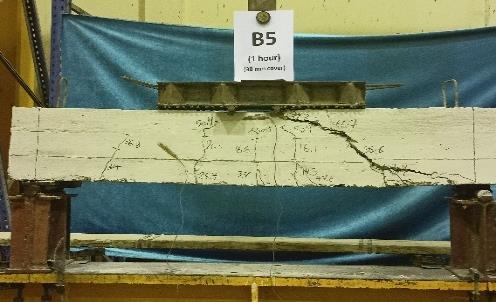
Fig. 9: Load–Deflection Curves at Mid Span for Beams Tested.
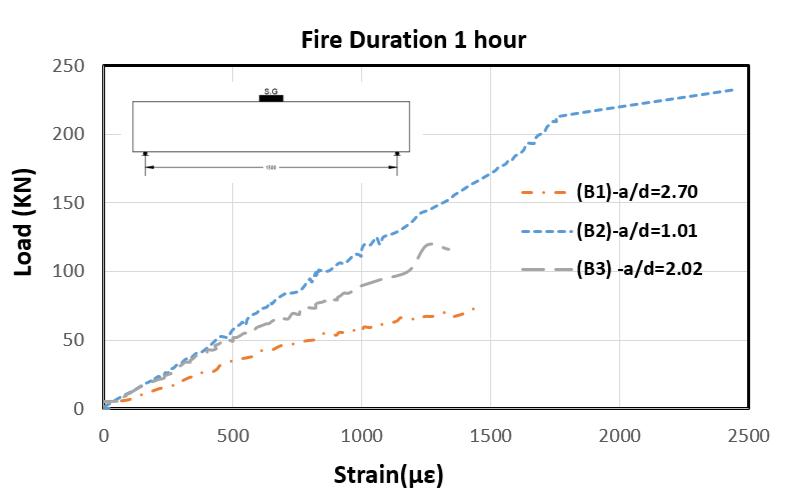
Strain of Concrete
The relation between the concrete at compression zone and the applied load is shown in Figure (10). The strain gauge located at top surfaces of the mid span.
Fig. 10. Load-strain relationship for the concrete at top compression zone.
5. CONCLUSIONS
The conclusions of this study are as follows:
When shear span-to depth ratio greater than 2.5 the beams act as slender beams while shear span-to depth ratio less than 2.5 the beams act as arch action.


When shear span-to depth ratio 2.02 the failure load incress by percent 60.3% and beam failure as shear failure while shear span-to depth ratio 1.01 the failure load incress by percent 221.7% and beam failure as flexural failure.
By controlling shear span-to depth ratio (a/d) ratio, a reasonable deflection and crack width could be achieved and accordingly satisfying serviceability requirements.
The GFRPs beams with shear span-to depth ratio (a/d) 2.02 the incresse percentage in deflection 15.25%, while the GFRPs beams with shear span-to depth ratio (a/d) 1.01 the incresse percentage in deflection 35.4%
Vol. 9, Issue 2, pp: (60
International Journal of Civil and Structural Engineering Research ISSN 2348-7607 (Online) www.researchpublish.com March 2022, Available at: - ), Month: October 2021 -67
REFERENCES
[1] C. Ballinger, "Structural FRP Composites", ASCE Civil Engineering, vol. 60, pp. 63-66, July (1990).
[2] Z. M. Lin, "Analysis of pole-type structure of fiber-reinforced plastics by finite element method", Ph. D. thesis, University of Manitoba, Manitoba, Canada, (1995).
[3] Zobel H.: Mosty kompozytowe,50. Jubileuszowa Konferencja Naukowa Kiliw pan i KN PZITB, Krynica, (2004)
[4] Tuakta C.: Use of Fiber Reinforced Polymer Composite in Bridge Structures, Massachusetts Institute of Technology, (2005)
[5] FLEXURE AND SHEAR BEHAVIOR OF CONCRETE BEAMS DURING FIRES By Bruce Ellingwood' and T. D. Lin,2 Members, ASCE
[6] Kodur VKR, Bisby LA, Foo S. Thermal behaviour of fire-exposed concrete slabs reinforced with fibre reinforced polymer bars. ACI Struct J 2005;102(6):799–808
[7] ASTM. Standard methods of fire test of building construction and materials. ASTM E119-05a, American Society for Testing and Materials, West Conshohocken, PA; 2005. 22pp.
[8] Katz A, Berman N, Bank LC. Effect high temperature on the bond strength of FRP rebars. J Compos Constr 1999;3(2):73–81.
[9] Hend Elsayed, "Behaviour of concrete beams reinforced using basalt and steel bars under fire exposure", M.Sc.thesis, University of Helwan University, Cairo, (2021).
[10] Subramanian N. Sustainability of RCC Structures Using Basalt Composite Rebar. Gaithersburg, MD, USA; September, 2013.
[11] ECP 203. Egyptian Code for Design and Construction of Concrete Structures. Housing and Building National Research Center, Cairo, Egypt; 2018.
[12] ECP, 208. Egyptian Code for the Use of Fiber Reinforced Polymers in the Construction Field. Housing & Building National Research Center, Cairo, Egypt; 2005.
[13] Hamad RJA, Megat Johari MA, Haddad RH. Mechanical properties and bond characteristics of different fiber reinforced polymer rebars at elevated temperatures. Constr Build Mater 2017;142:521–35.
[14] Kalifa, Menneteau FD, Quenard D. Spalling and porepressure in HPC at high temperature. Cement Concr Res 2000;1:1915–27.
