International Journal of Civil and Structural Engineering Research ISSN 2348-7607 (Online) Vol. 9, Issue 2, pp: (38-47), Month: October 2021 - March 2022, Available at: www.researchpublish.com
Comparison between Experimental, Nonlinear Finite Element Analysis Results and International Codes for Reinforced Concrete Flat Slabs Strengthened Using Different Techniques to Resist Punching Failure
1
Hanna F. H. Habeb1
2
, Ahmed A. Mahmoud* , Alaa G. Sherif3
4
, Magdy M.M. Genidi*Corresponding author, Tel: 20201005679172, E-mail: ahmed.ahmed@feng.bu.edu.eg, ahmed.m5882@gmail.com
Department of Civil Engineering, Faculty of Engineering at Shoubra, Benha University-, 108 Shoubra Street, Shoubra 11691, Cairo, Egypt.
2Higher Institute of Engineering, 15th of May City, Egypt (E-mail: civil.hanafakhry@yahoo.com).
3Professor, Faculty of Engineering (Shoubra), Benha University, Egypt (E-mail: ahmed.ahmed@feng.bu.edu.eg and ahmed.m5882@gmail.com);
4Professor of Reinforced Concrete Structures, Civil Engineering Dept., (Structure), Faculty of Engineering El MataryaHelwan University, Cairo, Egypt (E-mail: alaa_sherif@m-eng.helwan.edu.eg and agbsherif@gmail.com);
5Associate Professor, Civil Engineering Dept., (Structure), Faculty of Engineering El Matarya- Helwan University, Cairo, Egypt (E-mail: magdy_genedy@m-eng.helwan.edu.eg and magdy_genidi@yahoo.com).
Abstract: The main objectives of this research are to study experimentally, analytically and numerically the effectiveness of the proposed external strengthening techniques to resist punching shear of reinforced concrete flat slabs. The finite element (FE) analysis software program (ANSYS V. 19) was used to create the models and investigate the effects of some parameters on punching shear of reinforced concrete flat slabs. Eight variable parameters are taken into consideration during study full scale flat slab models to account the influence of: (1) concrete compressive strength fcu; (2) reinforcing steel yield strength fy; (3) slab thickness (ts); (4) shear studs and stirrups diameter (Db); (5) shear studs (stirrups) spacing /ts ratio (Sb/ts); (6) shear studs stirrups spacing/ts ratio (D/ ts); (7) main steel ratio/m max ( m /m max); (8) top steel ratio/m max (m` /m max).The numerical results were compared with the analytical results calculated from ECP 203-2017 [1] and ACI 318-19 [2]. The comparison showed a great match between the numerical results and the results of the two codes, especially ACI 318-19 [2].
Keywords: Punching shear, experimental, external strengthening, ANSYS program, numerical analysis.
I. INTRODUCTION
A flat slab floor system is often the choice when there is a need for more clear head such as car parks, libraries and multistory buildings where larger spans are also required
Punching shear failure is a major problem encountered in the design of reinforced concrete flat slabs. Many researchers have studied the punching shear behavior of reinforced concrete flat slabs [3]. The punching shear strength and deformation capacity are strongly influenced by the type and characteristics of the shear reinforcing system [4]. The slabs punching shear reinforcing system are: (1) separated stirrups, (2) continuous stirrups, (3) bonded reinforcement with
International Journal of Civil and Structural Engineering Research ISSN 2348-7607 (Online) Vol. 9, Issue 2, pp: (38-47), Month: October 2021 - March 2022, Available at: www.researchpublish.com
anchorage plates, (4) steel plates, (5) continuous FRP sheets, (6) FRP strips, (7) internal prestressing, (8) external prestressing, (9) bent up bars, (10) vertical studs, and (11) inclined studs.
Failures of flat slab structures were reported during construction and brittle failure happens with no enough warnings.The experimental results showed that the increase of concrete strength leads to increase of ultimate load of the slab and flat slabs resisting by steel fiber reinforcement have the highest punching shear resistance comparing to its corresponding slabs resisting by added straight bars [5]
There are many researches that talk about external strengthening to resist punching shear [6] Because experimental tests take a long time and are expensive, it was essential for the researchers to find less expensive methods, so they turned to use various methods of modeling concrete structures using both numerical and analytical methods [7].
II. NONLINEARFINITEELEMENTANALYSIS
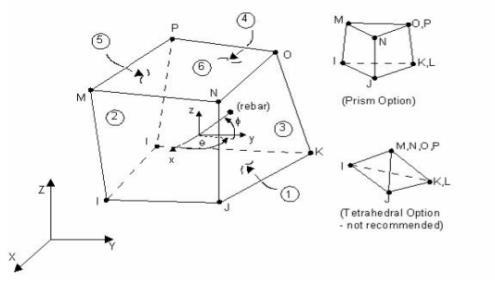
The following steps were taken in order to analyze the considered slabs specimens: (1) selection of element type; (2) assigning material properties; (3) modeling and meshing volume; (4) applying loads and boundary conditions, then solving [8]. Flat slab reinforced concrete was modeled using SOLID65. The reinforcing bars, steel shear studs and GFRP stirrups were idealized using a 2-node bar (linear) named (Link 180) as shown in Fig. 1.
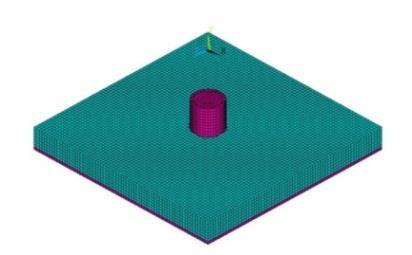
The tested slabs discretized using equal-size 3-D isoperimetric elements (25*25*25 mm) Solid 65 as shown in Fig. 2. The column stub was represented as shown in the figure to simulate the actual shape and dimensions of column stub of the tested specimens. The slabs were analyzed as simply supported along the four sides to simulate the experimental set-up. Referring to ANSYS V19 technical manual [8], the three-dimensional isoparametric element Solid65 was adopted to model the concrete elements. Solid 65 element is capable of cracking in tension and crushing in compression. This element is similar to the one recommended., which introduced a three-dimensional, 8-node isoparametric element.
Solid 65 element is defined by eight nodal points each having three translational degrees of freedom x, y, and z (and no rotational deformations), along with a 2 x 2 x 2 Gaussian integration scheme which is used for the computation of the element stiffness matrix. The software package "ANSYS V. 19.0" [8] allows steel reinforcement to be defined using the smeared reinforcement approach, in which the amount of reinforcement is defined by specifying a volume ratio and orientation angles of the rebar.
(a) Solid65.
Fig. 1: Elements Geometry [9].
(b) Link180.
(a) Concrete elements (Solid 65)
(b) Reinforcing bar elements (Link 180)

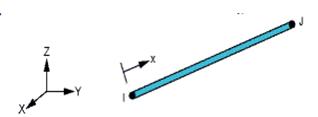
Fig. 2: ANSYS idealization of the slabs.
International Journal of Civil and Structural Engineering Research ISSN 2348-7607 (Online) Vol. 9, Issue 2, pp: (38-47), Month: October 2021 - March 2022, Available at: www.researchpublish.com
III. VERIFICATION AND FALIDATION
III.I Details of studied slabs
One slab from Hanna, F.H.H. [9] (named Sc) was used to verify the numerical and the analytical results. The average cubic and cylindrical concrete compressive strength were 26 and 22 MPa, respectively. The cracking strength of concrete was taken as 10% of the concrete compressive strength.
A fiberglass is a custom of fiber-reinforced plastic. Fiberglass is strong, less brittle and lightweight. The best advantage fiberglass is its ability to get shaped in different difficult shapes The used Epoxy was Sikadur -165 which is also a product of Sika construction company as well.
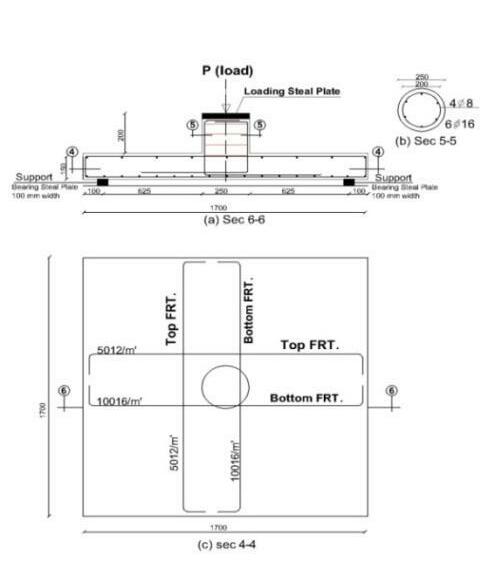
Shear bolts have diameter 16 mm and length 180 mm with a nut. Shear bolts are installed in holes drilled in the slab shortly before testing. The holes were drilled perpendicular to the slab plane using 16 mm diamond coring bits. The shear bolts were arranged in concentric rows parallel to the perimeter of the column Figure 3 shows the slab dimensions and reinforcement details. The slab has 1700 mmx1700 m and thickness 150 mm with a circular column has 250 mm diameter. Figure 3 shows the typical dimensions and reinforcement details of slab Sc [9]
Fig. 3: Typical dimensions and reinforcement details of slab Sc [9].
III.II Comparison between the experimental and numerical results
Figure 4 shows a comparison of the experimental and the predicted load-deflection curves, revealing excellent responses to the numerical model's accuracy at various response stages. The ultimate load, ��u, deflection at ultimate load, ���� and secant stiffness, S.S which defined as the ratio of the ultimate load to the corresponding displacement were estimated. Table 1 shows comparison between the numerical and the experimental results of slab Sc
Load P, (kN) Deflectiom (mm)
0 50 100 150 200 250 300 350 400 0 2 4 6 8 10 12 14 16 18 20 22 24
Experimental Numerical
Fig. 4: Experimental and numerical load-deflection curve for slab Sc [9].
International Journal of Civil and Structural Engineering Research ISSN 2348-7607 (Online) Vol. 9, Issue 2, pp: (38-47), Month: October 2021 - March 2022, Available at: www.researchpublish.com
TABLE I: COMPRISON BETWEEN THE NUMERICAL AND THE EXPERRIMENTAL RESULTS OF SLAB Sc [9].
Comparison Experimental [27] Numerical [FE] Exp. [27]/Num [FE]
Ultimate load, (Pu), kN 351.01 364 0.96 u) mm 20.386 19.92 1.023
Secant stiffness (S.S), kN/ mm 17.22 18.27 0.94
The following conclusions were reached after comparing the numerical and the experimental results as shown in Fig. 4 and Table 1:
1. The finite element predictions have been close to the experimental results at the ultimate level.
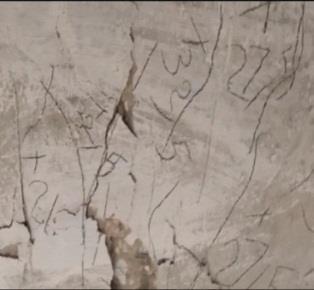
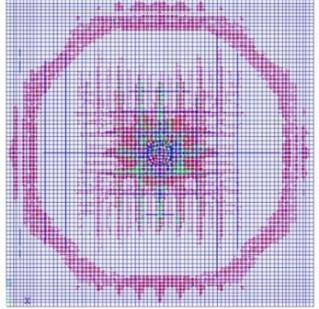
2. The ratio [(���� exp/��������)] is 0.96. The ratio [(���������� / ������)] is 1.023 and the secant stiffness ratio is (S.S (������.) /S.S (����))) = 0.95. Early flexure cracks for Sc appeared at the middle of the slab span and became more spread as the load increased as shown in Fig.5. Figure 5 shows a very good agreement between the experimental and the numerical cracks pattern.
(a) Predicted cracks pattern.
(b) Experimental cracks pattern.
Fig. 5: Cracks pattern of experimental and the predicted model for slab.
IV. PARAMETRIC NUMERICAL STUDY
IV.I Details of the studied slabs
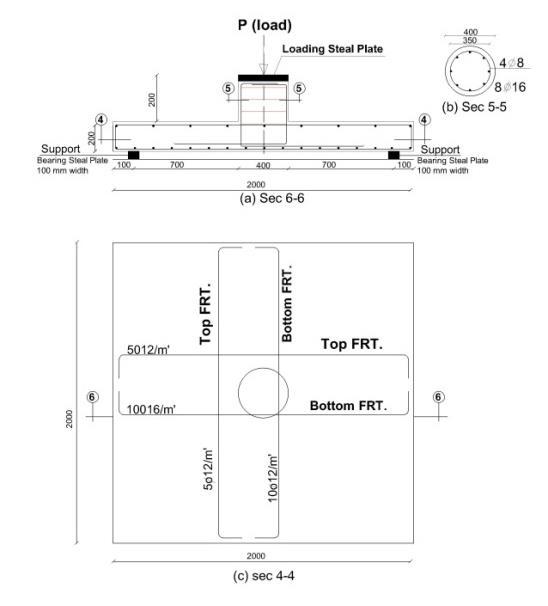
Figure 6 shows the geometry and reinforcement details of the parametric studied slabs. Ten groups are described in Table 3 and analyzed by ANSYS rogram.19. All slabs 2000 mm x 2000 mm, slab thickness 200 mm, fcu = 25 Mpa and fy =350 Mpa with a column circular diameter 400 mm (As = 8F16). S1 was the first control slab (reference slab for 24 slabs divided into 8 groups as shown in Table 2) with shear studs (bolts) diameter 8 mm, with spacing (0.5 ts) 100 mm, one row with distance 200 mm (ts) from column face and main steel ratio/m max (m /m max) = 0.3 and compression steel ratio/m max (m /m max) = 0.2 without drop panel..
TABLE II: DETILES OF THE STUDIED SLABS.
Group Slab NO
Studied Parameters fcu (MPa) fy (MPa)
Shear Studs (Stirrups) Distance s/t slab
/
max
/
International Journal of Civil and Structural Engineering Research ISSN 2348-7607 (Online) Vol. 9, Issue 2, pp: (38-47), Month: October 2021 - March 2022, Available at: www.researchpublish.com
C S9 25 350 24 8 0.5 1 0.4 0.2 the Slab Thickness
S10 25 350 26 8 0.5 1 0.4 0.2
Group (4) C
Group (5) C
Group (6) C
Group (7) C
Group (8) C
S12 25 350 20 10 0.5 1 0.4 0.2
S13 25 350 20 12 0.5 1 0.4 0.2
S11 25 350 20 6 0.5 1 0.4 0.2 Effect of Shear Studs Diameter
S15 25 350 20 8 1 1 0.4 0.2
S16 25 350 20 8 1.25 1 0.4 0.2
S14 25 350 20 8 0.75 1 0.4 0.2 Effect of Shear Studs Spacing / t slab
S18 25 350 20 8 0.5 1.5 0.4 0.2
S19 25 350 20 8 0.5 2 0.4 0.2
S17 25 350 20 8 0.5 0.5 0.4 0.2 Effect of Shear Studs Distances/t slab
S20 25 350 20 8 0.5 1 0.3 0.2 Effect of Main Steel Ratio/ max
S21 25 350 20 8 0.5 1 0.5 0.2 S22 25 350 20 8 0.5 1 0.6 0.2
S24 25 350 20 8 0.5 1 0.4 0.25 S25 25 350 20 8 0.5 1 0.4 0. 3
S23 25 350 20 8 0.5 1 0.4 0.15 Effect of Top Steel Ratio/ max
Fig.6: Geometry and reinforcement details of the parametric studied slabs.
IV.II Analysis of the numerical results
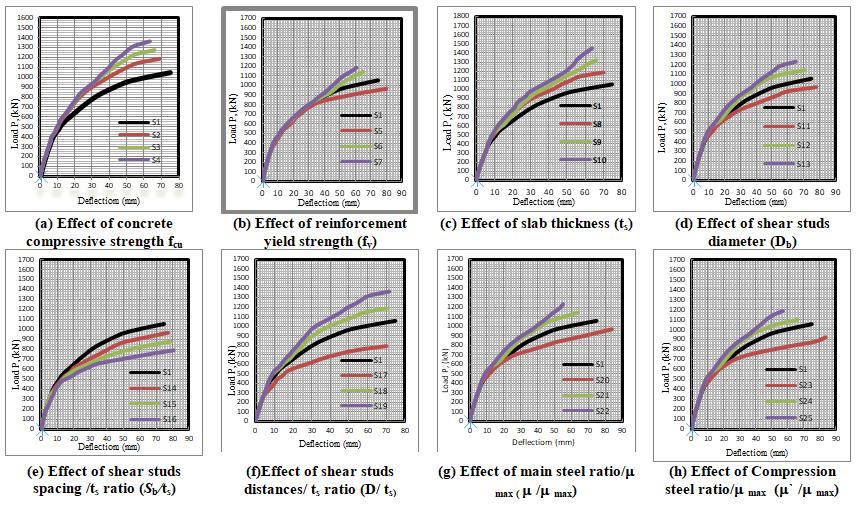
The load-deflection curves showed the behavior of the slabs by displaying a variety of response parameters, including ultimate load, deflection, and secant stiffness. Figure 7 and Table 3 shows the effect of some parameters affecting the punching shear behavior
Research Publish Journals
International Journal of Civil and Structural Engineering Research ISSN 2348-7607 (Online) Vol. 9, Issue 2, pp: (38-47), Month: October 2021 - March 2022, Available at: www.researchpublish.com
TABLE III: NUMERICAL REUSLTS OF THE STUDIED SLABS.
Slab No. Numerical Ultimate Load, (Pu ) (kN)
Deflection at Ultimate Load u) (mm)
Secant Stiffness (S.S) (kN/mm) Pu /Pu S1 %
S1 1056 74.84 14.11 100 100 100
S2 1188 69.12 17.19 112.5 92.36 121.83
S3 1276 66.09 19.31 120.83 88.30 136.85 S4 1364 63.39 21.52 129.17 84.70 152.51
S5 968 80.12 12.08 91.68 107.06 85.61
S6 1144 65.05 17.59 108.33 86.92 124.66
S7 1188 60.84 19.53 112.50 81.29 138.41
S8 1188 70.12 16.94 112.5 93.69 120.05
S9 1320 66.13 19.96 125 88.36 141.45
S10 1452 63.84 22.74 137.5 85.30 161.16
S11 968 77.85 12.43 91.66 104.02 88.09
S12 1144 70.61 16.20 108.33 94.34 114.81
S13 1232 64.91 18.98 116.66 86.73 134.51
S14 968 77.17 12.54 91.66 103.11 93.85
S15 880 78.93 11.15 83.33 105.46 79.02
S16 792 80.63 9.82 75 107.73 69.59
S17 792 70.10 11.30 75 93.66 80.08 S18 1188 70.61 16.82 112.5 94.34 110.20
S19 1364 71.59 19.05 129.16 95.65 135.01
S20 968 83.63 11.57 91.66 111.74 81.99
S21 1144 64.03 17.87 108.33 85.55 126.62
S22 1232 55.09 22.38 116.66 73.61 158.61
S23 924 83.56 11.06 87.50 111.65 78.37 S24 1100 65.96 16.67 104.16 88.13 118.19 S25 1188 57.17 20.78 112.50 76.39 147.27
Fig. 7: Load -deflection curves of all parametric studied slabs.
Research Publish Journals
International Journal of Civil and Structural Engineering Research ISSN 2348-7607 (Online) Vol. 9, Issue 2, pp: (38-47), Month: October 2021 - March 2022, Available at: www.researchpublish.com
IV.III Effect of concrete compressive strength (fcu)
The concrete strength increased, higher ultimate loads reached with a noticeable small decease in deformation at the same load levels. Four slabs have the concrete compressive strength (��cu) 25, 30, 35 and 40 MPa for slabs S1, S2, S3 and S4 respectively. Table 4 shows the ultimate load of slabs S2, S3 and S4, is larger than of slab S1 (reference slab) by 12.5%, 20.83% and 29.75%, respectively. In addition to the secant stiffness of slabs S2, S3 and S4, is larger than that of slab S1 by 21.83%, 36.85%, and 52.51%, respectively, although the corresponding deflections are 7.64%, 11.7%, and 15.3 % respectively lower than slab S1(reference slab). It can be noted that, the increase of the concrete compressive strength, the increase in the ultimate load and the secant stiffness, and decrease in the deflection.
IV.IV Effect of reinforcement yield strength (fy)
As shown in Fig. 7.b, the load deflection curves are approximately the same for all slabs of group 2 at the beginning, while it varied according to the reinforcement yield strength (����) near the ultimate load. Based on Table 4, the ultimate load of slab S5 is less than that of slab S1 by 8.32% but slabs S6 and S7 has larger ultimate load than of that of slab S1 by 8.33% and 12.50%, respectively. In addition to the ultimate deflection of slab S5 is larger than of that of slab S1 by 7.06% but S6 and S7 is less than of that slab S1 by 13.08 %, and 18.71% respectively, although the corresponding secant stiffness of slab S5 is less than of slab S1 by 7.63% but S6 and S7 is larger than of slab S1 by 20.69 %, and 31.5%, respectively. It is clear that, the higher the reinforcement yield strength ����, the small higher the ultimate load, secant stiffness and the lower the deflection.
IV.V Effect of slab thickness (ts)
Figure 7.c shows the effect of increase slab thickness (ts) on the ultimate load, secant stiffness and the deflection using three slabs S8, S9 and S10 compared to S1(reference slab). It can be noted that, an increase in both the ultimate load and secant stiffness while a decrease in deflection has been occurred as shown in Table 4.
IV.VI Effect of shear studs (stirrups) diameter (Db)
From Table 4 the ultimate load and secant stiffness of slab S11 is less than that of slab S1 by (8.34 % and 11.91%) but S12 and S13 is larger than that of slab S1 by (8.33% and 14.81%) and (16.66% and 34.51) respectively. In addition to the ultimate deflection of slab S11 is larger than that of slab S1 by 7.06 % while slabs S12 and S13 has ultimate deflection less than that of slab S1 by13.08%, and 18.71% respectively. From Fig. 7.d it can be noted that the decrease of (Db) decrease the ultimate load and secant stiffness and increasing deflection and vice versa
IV.VII Effect of shear studs (stirrups) spacing /ts ratio (Sb/ts)
Four slabs S1, S14, S15 and S16 has (Sb/ts) 0.5, 0.75, 1 and 1.25 respectively. Increasing shear studs spacing (Sb) has a noticeable effect on the three slabs S14, S15 and S16, where both the ultimate load and secant stiffness decreased with an increase in the deflection as shown in Table 4 and Fig 7.e. The ultimate load and secant stiffness of slabs S14, S15 and S16 are less than that of slab S1 by (8.34% and 6.15%), (16.67% and 20.98%) and (25% and30.41%) respectively, with an increase in deflection by 3.11%, 5.46% and 7.73% respectively compared to S1 (reference slab).
IV.VIII Effect of shear studs (stirrups) distances/ts ratio (D/ts)
Group 6, study the effect of distance of shear studs (bolts) row from column face (D) where taken ratio (D/ ts) 1.0, 0.50, 1.5 and 2 for slabs S1, S17, S18 and S19 respectively where S1 is the reference slab. Table 4 shows an increase in both the ultimate load and secant stiffness at increase (D) and vice versa while the deflection very decreased when increase or decrease (D). The ultimate load and secant stiffness of slab S17 is less than of slab S1 by (25% and 19.92%) but S18 and S19 is larger than of that of slab S1 by (12.5% and 10.20%) and (29.16% and 35.01) respectively. In addition to the ultimate deflection of slab S17, S18 and S19 is very small less than that of slab S1 by 6.34%, 5.66% and 4.35% respectively.
IV.IX Effect of main steel ratio/max max)
Table 4 and Fig 7.g showed that increasing the main steel ratio/max increasing the ultimate load decrease the deflection leads to large secant stiffness while, the ultimate load and secant stiffness decreased and large deflection due to decreasing main steel ratio/max. Increased and decreasing proportions ultimate load and secant stiffness, reduction and increasing ratios deflection for three slabs S20, S21 and S22 compared to S1 control specimen showed in Table 4. The ultimate deflection of slab S20 is larger than of slab S1 by 11.74% but S21 and S22 has ultimate deflection less than of that of slab S1 by14.45%, and 26.39% respectively.
International Journal of Civil and Structural Engineering Research ISSN 2348-7607 (Online) Vol. 9, Issue 2, pp: (38-47), Month: October 2021 - March 2022, Available at: www.researchpublish.com
IV.X Effect of compression steel ratio/mmax (`m /m max)
Three slabs S23, S24 and S25 compared to S1 control specimen showed in Table 4 to study effect top steel ratio/max on ultimate deflection, ultimate load and secant stiffness. It can be noted that a small increase in the ultimate load with big decrease in deflection led to large secant stiffness at increasing top steel ratio/ max. the ultimate load and secant stiffness of slab S23 is less than of slab S1 by (12.5% and 11.63%) respectively, while S24 and S25 is larger than of slab S1 by (4.16% and 18.19%) and (12.5% and 47.27%) respectively. In addition to the ultimate deflection of slabS5 larger than of slab S1 by 11.65% but S6 and S7 is less than of slab S1 by11.87%, and 23.61% respectively.
V. COMPARISON OF THE NUMERICAL RESULTS AND THAT CALCULATED FROM EGYPTIAN CODE 203-2017 [1] AND ACI318-19 CODE [2]
The numerical results were compared with those calculated from the ECP 203-2017 [1] and ACI 318-19 [2] to verify the results as shown in Table 4
V.I Comparison of the numerical results and that calculated from Egyptian code 203-2017 [1]
Table 5 illustrates the comparison between the numerical ultimate load and the ultimate load calculated from Egyptian code 203-2017 [1]. The mean of the ratio of the numerical ultimate load and that calculated using Egyptian code 2032017 [1] is 119%, the standard deviation is 13% and coefficient of variation 11% for the twenty-four-slab used in the parametric study (S1 to S24), while these values for the last six slabs used in the parametric study (S25 to S32) are 106%, 15% and 14% respectively. This comparison reveals agreement between the numerical results and those calculated using the Egyptian code 203-2017 [1].
V.II Comparison of the numerical results and that calculated from ACI 318-19 code [2]
Good agreement between ACI 318-19 code [2] results and the nonlinear finite elements analysis was achieved. Table 4 shows the ratio between the numerical and ACI 318-19 code [2]; Pu Num /Pu ACI [2]. The mean of this ratio for the twentyfour-slab used in the parametric study (S1 to S24), the standard deviation and coefficient of variation are 111% 11% and 10% respectively, while these values for the last six slabs used in the parametric study (S25 to S32) are 116%, 15% and 13% respectively
TABLE IV: COMPARISION OF Pu USING EGYPTION CODE 203-2017 [1] AND ACI 318-19 CODE [2] AND THE NUMERICaL REUSLTS.
NLFEA result
Codes NLFEA / Codes Codes results
Pu ACI[2] (kN) Pu Egy..[1] (kN) Ultimate load Pu Num. (kN)
Pu Num / Pu Egy.[1]
Pu Num / Pu A[2]CI
Slab No. Pu Egy.[1] / Pu ACI[2]
0.94 1.14 1.21 928.91 875.156 1056 1 0.92 1.17 1.26 1017.57 941.6232 1188 2 0.83 1.16 1.23 1099.10 1034.622 1276 3 0.75 1.16 1.20 1174.99 1131.732 1364 4 0.83 1.16 1.23 Mean 0.08 0.006 0.03 S.D 0.10 0.005 0.02 C.O.V 0.94 1.01 1.07 928.91 875.156 968 5 0.94 1.23 1.31 928.91 875.156 1144 6 0.94 1.28 1.36 928.91 875.156 1188 7 0.94 1.17 1.25 Mean 0 0.14 0.15 S.D 0 0.12 0.12 C.O.V 0.94 1.13 1.20 1053.19 992.240 1188 8 0.94 1.12 1.24 1181.68 1113.293 1320 9 0.94 1.10 1.17 1314.38 1238.316 1452 10 0.94 1.11 1.21 Mean 0 0.15 0.03 S.D 0 0.01 0.03 C.O.V 0.94 1.04 1.11 928.91 875.156 968 11 0.94 1.23 1.31 928.91 875.156 1144 12 0.94 1.33 1.41 928.91 875.156 1232 13
International Journal of Civil and Structural Engineering Research ISSN 2348-7607 (Online) Vol. 9, Issue 2, pp: (38-47), Month: October 2021 - March 2022, Available at: www.researchpublish.com
0.94 1.2 1.27 Mean 0 0.15 0.16 S.D 0 0.12 0.12 C.O.V 0.94 1.04 1.11 928.91 875.156 968 14 0.94 0.95 1.01 928.91 875.156 880 15 0.94 0.86 0.91 928.91 875.156 792 16 0.94 0.95 1.01 Mean 0 0.09 0.1 S.D 0 0.095 0.99 C.O.V 0.94 1.07 1.13 739.34 696.553 792 17 0.94 1.06 1.13 1118.49 1051.949 1188 18 0.87 1.04 1.19 1308.06 1142.381 1364 19 0.92 1.06 1.15 Mean 0.04 0.015 0.03 S.D 0.044 0.014 0.03 C.O.V 0.94 1.04 1.11 928.91 875.156 968 20 0.94 1.18 1.26 928.91 875.156 1100 21 0.94 1.32 1.40 928.91 875.156 1232 22 0.94 1.18 1.26 Mean 0 0.14 0.14 S.D 0 0.12 0.11 C.O.V 0.94 0.99 1.05 928.91 875.156 924 23 0.94 1.18 1.26 928.91 875.156 1100 24 0.94 1.28 1.36 928.91 875.156 1188 25 0.94 1.15 1.22 Mean 0 0.15 0.16 S.D 0 0.13 0.13 C.O.V 0.92 1.11 1.19 Mean (total) 0.04 0.11 0.13 S.D (total) 0.043 0.10 0.11 C.O.V (total)
VI. CONCLUSIONS
The finite element (FE) analysis software program (ANSYS V. 19) was used to create the models and investigate the effects of some parameters on punching shear behavior of reinforced concrete flat slabs. Verification model was carried out to simulated a slab tested experimental by the first author. The numerical results compared with the experimental results. The results show that the numerical results matched with the experimental results and good agreement was archived. After that, some variables which included the effect of concrete compressive strength, reinforcing steel yield strength, slab thickness, shear studs diameter, shear studs spacing, shear studs distances from column face, main steel ratio/max, top steel ratio/ max were studied. The numerical results were compared with the analytical results calculated from ECP 203-2017 [1] and ACI 318-19 [2] and the following are the main conclusions that can be drawn from the numerical and analytical results:
1. Finite element structural modeling simulated the experimental results up to good extent.
2. The higher the concrete compressive strength and slab thickness, the higher the ultimate load, secant stiffness and the lower the corresponding deflection.
3. The load deflection curves due to the of effect of the reinforcement yield strength are approximately the same at the beginning, while it varied according to the reinforcement ratio.
4. The higher the reinforcement yield strength, shear studs diameter, main steel, compression steel, the higher the ultimate load, secant stiffness and the lower the deflection at ultimate load.
5. The lower the shear studs spacing, the lower the ultimate load, secant stiffness and the higher the deflection at ultimate load.
6. The higher the shear studs distances from column face, the higher the ultimate load and secant stiffness while decreasing shear studs distances from column face, the lower the ultimate load, secant stiffness and the lower the deflection in both cases at ultimate load.
Research Publish Journals
International Journal of Civil and Structural Engineering Research ISSN 2348-7607 (Online) Vol. 9, Issue 2, pp: (38-47), Month: October 2021 - March 2022, Available at: www.researchpublish.com
7. The mean and standard deviation demonstrate a good agreement between the numerical results and the analytical ones calculated from ECP 203-2017 [1] and ACI 318-19 [2].
8. The most results calculated from both ECP 203-2017 [1] and ACI [2] are less than that related to the numerical results this means that both Egyptian and ACI codes are conservative.
9. The results show that ACI 318-19 code [2] is more conservative than ECP 203-2017 [1].
10. ECP 203-2017 [1] and ACI [2] code provision should be revised to add the effect of reinforcement yield strength, shear studies (diameter, spacing) and flexural steel ratio (main and compression) on calculation punching shear capacity.
REFERENCES
[1] Egyptian Code of Practice for Design and Construction of Reinforced Concrete Structures ECP-203, Housing and Building Research Center, Ministry of Building and Construction, Giza, Egypt, 2017, Chapter 6, pp. 113-122.
[2] ACI Committee 318-19, Building Code Required for Reinforced Concrete, (ACI 318-19) and Commentary (ACI 318R-19), American Concrete Institute, Farmington Hills, Mich,2019, Chapter 22, 4011-4020.
[3] Jae, I.J. and Su, M. K., ´ “Punching shear behavior of shear reinforced slab– column connection with varying flexural reinforcement”, International Journal of Concrete Structures and Materials, ,2019.
[4] Eid, F. M., “New methods for resisting punching shear stress in reinforced concrete flat slabs”, Journal of Current Engineering and Technology, Vol.8, No.2,2018.
[5] Lips, S., Fernandez, M.R. and Muttoni, A., “Experimental investigation on punching strength and deformation capacity of shear-reinforced slabs”, ACI Structural Journal,109(1): 889–900, 2012.
[6] Hamed, S. A., “Repair of R/C flat plates failing in punching by vertical studs”, Alexandria Engineering Journal, 2015.
[7] Malena, B. M., and Eugen, B., “Composite model for predicting the punching resistance of R-UHPFRC-RC composite slabs”, Engineering Structures,117, pp.603-616, 2016.
[8] ANSYS Inc., Release 19.0, Documentation, Theory References, 2013.
[9] Hanna, F.H.H.,” External strengthening of reinforced concrete flat slabs to resist punching using different techniques”, Ph.D. (under Discussion), Faculty of Engineering, Matarya, Helwan University, Civil Engineering Department, Structure, Egypt, 2021.
