Have we run out of homes?


Have we run out of homes?

Over the past 12 months, we’ve had the privilege of assisting more than 180 families buy or sell property across our core markets of Beecroft, Cheltenham and Pennant Hills. In a market defined by cautious confidence, stabilising interest rates and renewed buyer activity, our drawcard combination of excellent schools, warm community and connected transport options continues to attract strong demand.

Setting new suburb and street records whilst maintaining exceptional client satisfaction, my commitment to transparency, honesty and integrity remains at the heart of every transaction, ensuring my clients feel informed and supported at every step.
As a third-generation resident of 2119, I am incredibly appreciative of the continued trust shown by the local community.
Backed by the reputation and strength of the McGrath network and our global partnerships with Knight Frank and Bayleys, I look forward to helping even more families make confident, informed moves in 2026. Whether you’re considering buying, selling, leasing or would simply be interested in an updated market appraisal, my team is here to help. I hope you find this year’s report both interesting and informative.
Belinda x
Belinda Hill
0418 477 538
belindahill@mcgrath.com.au
21
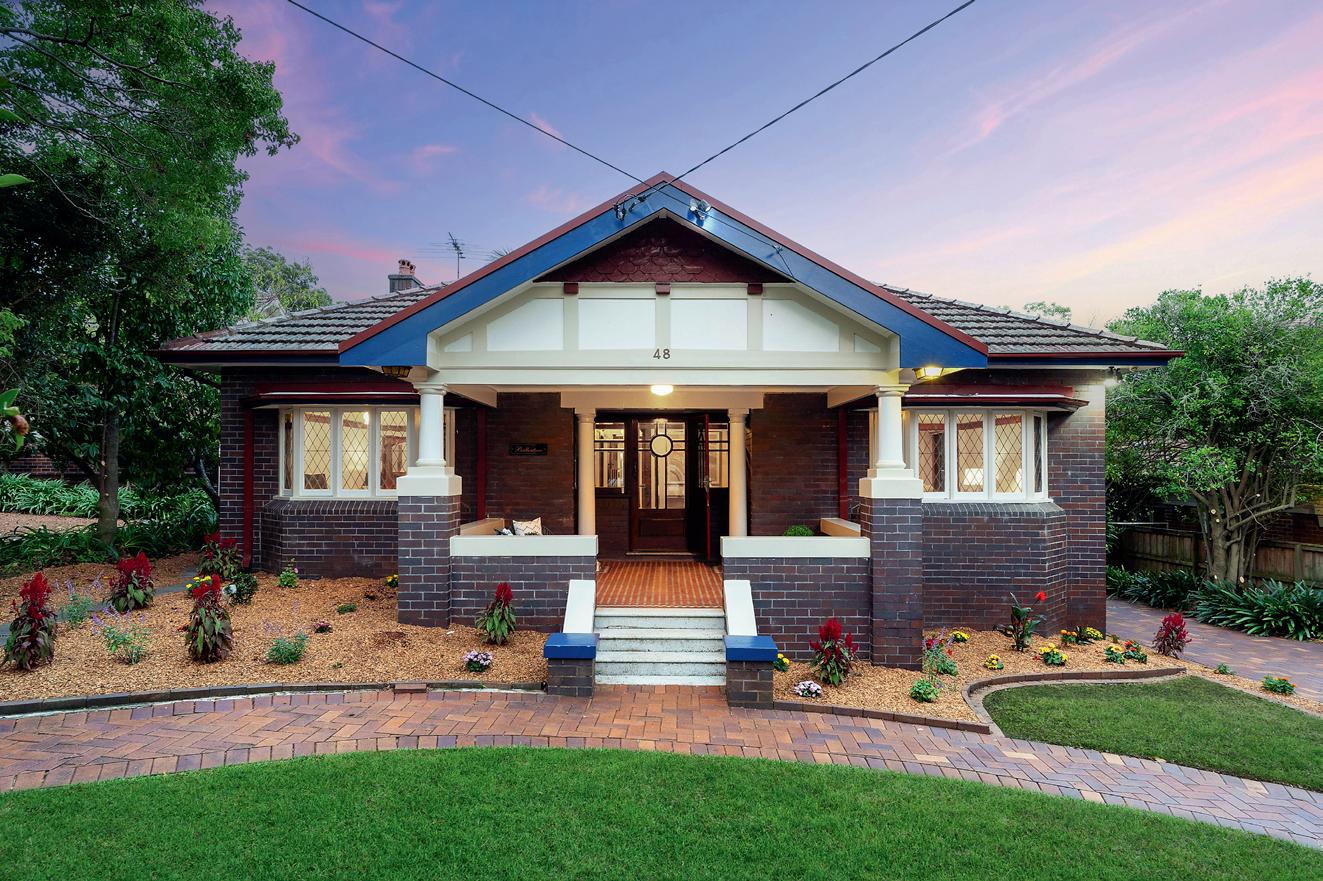
48
Sold

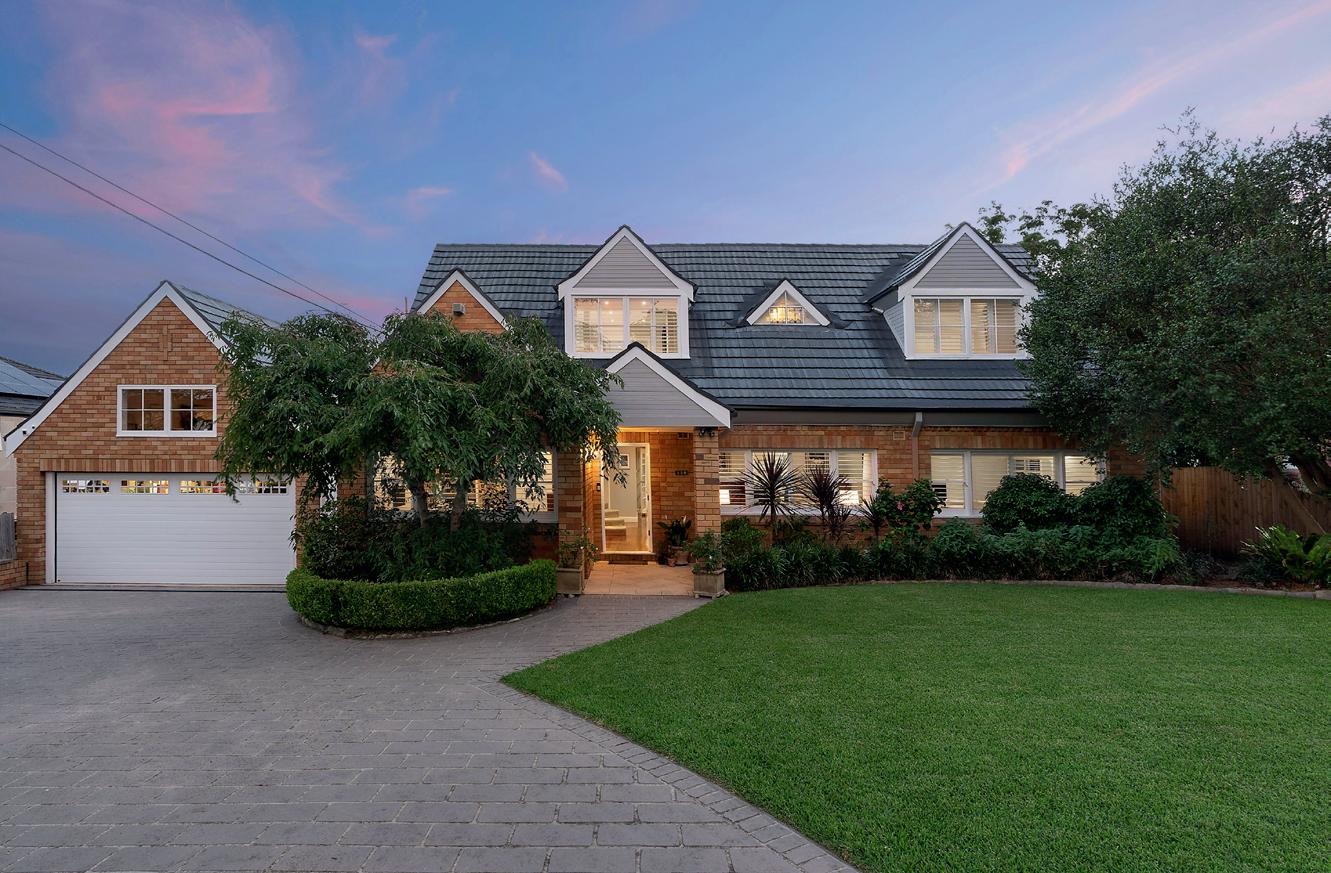
170
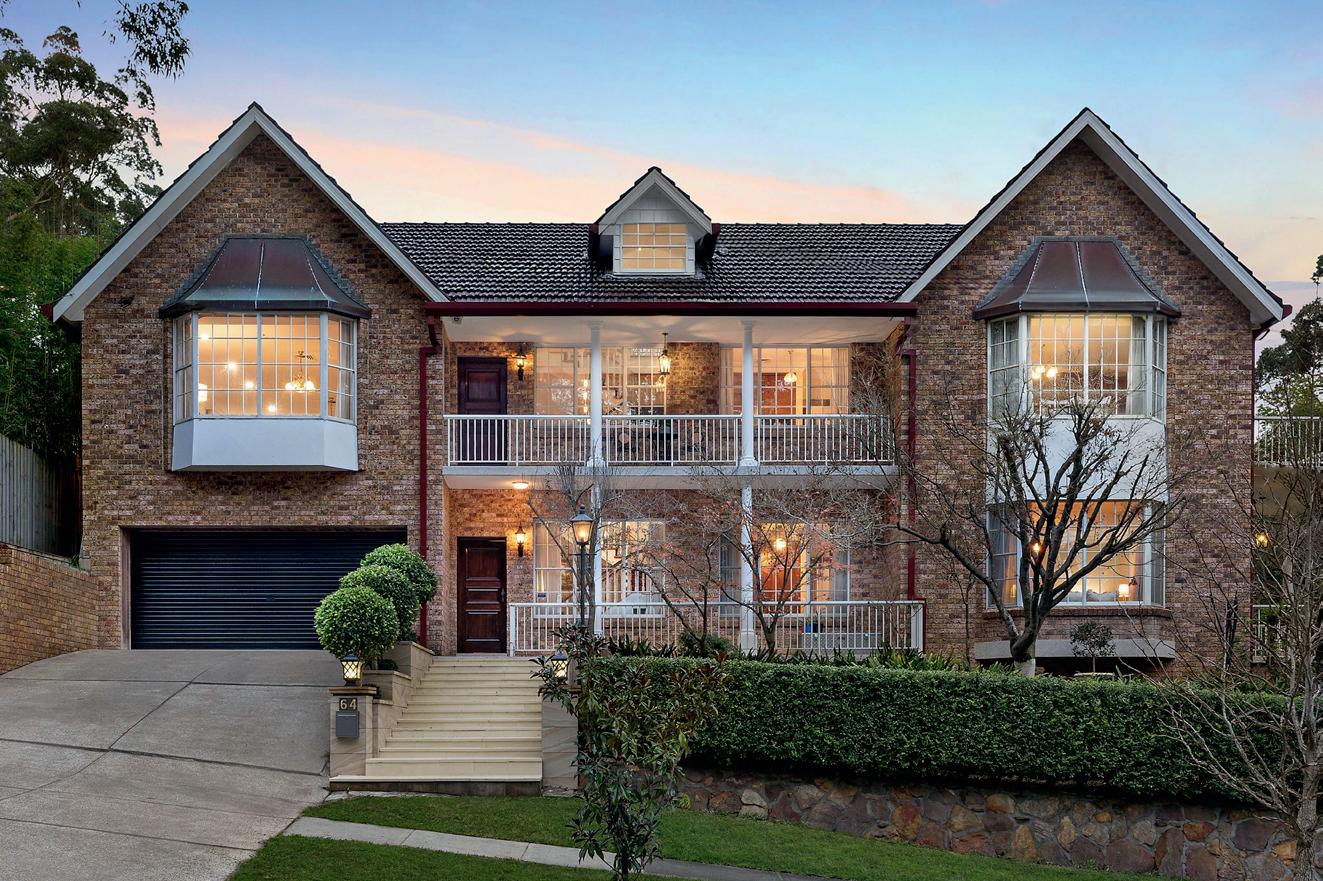
64
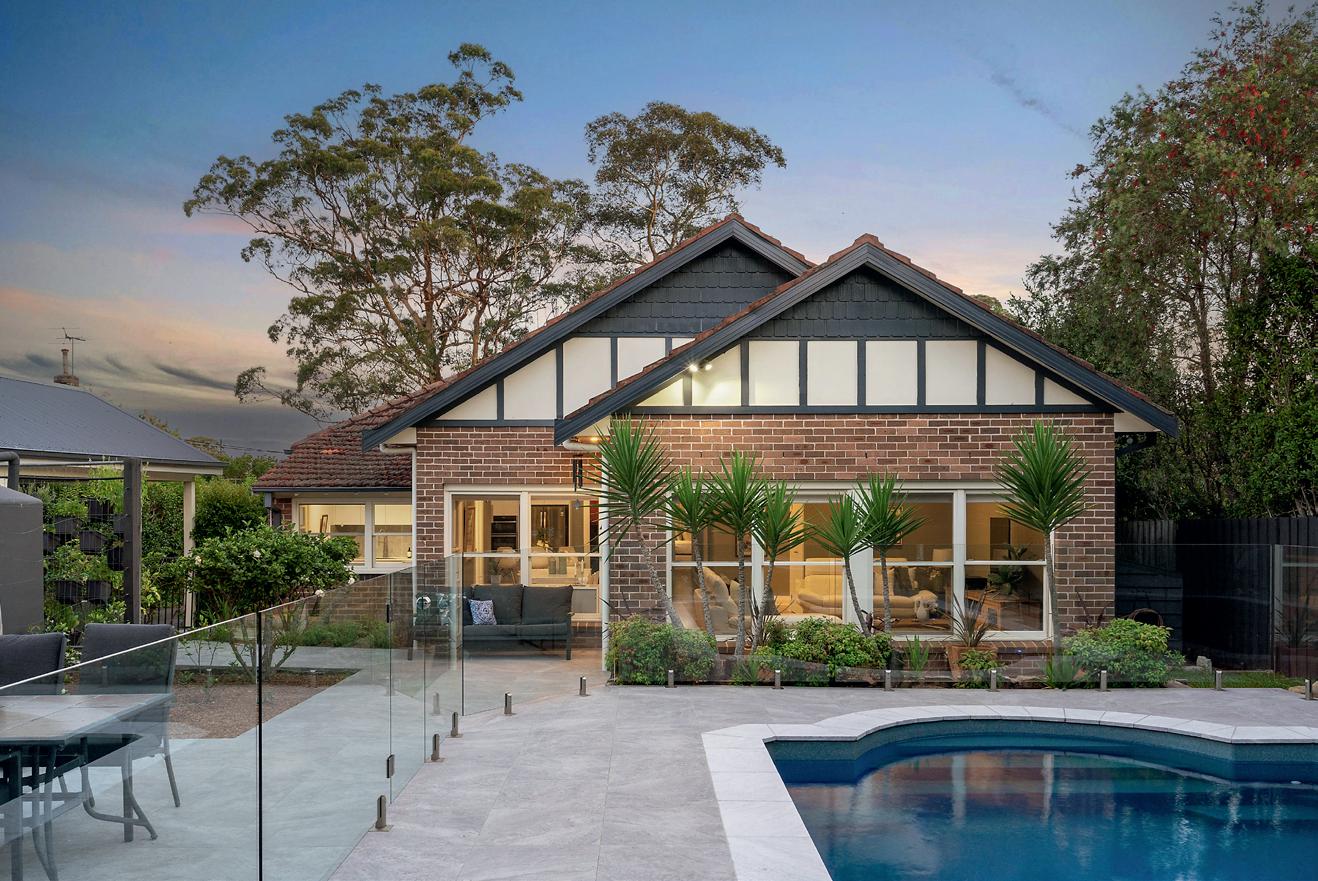

44B


112
Page 4 A message from John McGrath
Page 6
Trend 01
Pressure To Power: The Sandwich Shift
Page 14
Trend 02
Lifestyle Locations: Walkable, Liveable, Lovable
Page 24
Trend 03
Weathering The Future: The Power Of Smart Design
Page 32
Sydney & Surrounds
Page 40
Melbourne & Surrounds
Page 46
Brisbane & Surrounds
Page 52
Hobart & Surrounds
Page 62
References
Have we run out of homes? As I sit down to write this year’s message to you, I’m reflecting on a fundamental contradiction. How is it that Australia – with this vast continent of ours – finds itself in the grip of a housing crisis so severe that only 22% of Australians are satisfied with the availability of good and affordable housing? For Australians aged under 34, that figure drops to just 16%.
The numbers paint a picture that should concern all of us. New borrowers are spending 50% of their household income servicing the loan, while renters dedicate 33% of household income to rent. The time to save for a 20% deposit has blown out to over 10 years and the home price-to-income ratio has climbed to 8 times. These aren’t just statistics – they represent real people and real pain.
After decades in this industry, I’ve learned that the housing market has three key pillars. When one pillar falters, the entire structure becomes unstable. Right now, all three pillars are compromised: supply, affordability and construction viability.
The core issue of Australia’s housing dilemma isn’t land scarcity – it’s accessibility. Over half our population has squeezed into just three cities, creating price pressure and rising density in Sydney, Melbourne and Brisbane while vast developable land sits disconnected from essential infrastructure.
Every week, property developers tell me the same thing: “We can’t develop on our current sites because we just can’t make the numbers work.” The industry faces great challenges: labour shortages have doubled or even tripled in many skills, and construction costs are up 30%, so many developments simply can’t be built profitably at current market prices.
Our housing dilemma isn’t just about the overall number of homes – it’s also about their diversity. As discussed in our trend article, Power to Pressure: The Sandwich Shift, Gen X families increasingly need larger houses that accommodate multigenerational living and working from home. Downsizers need apartments and other smaller homes in the neighbourhoods they already know. Young couples need semis and terraces suited to small families, while first home buyers need genuinely affordable starter homes.
I believe real change requires us to focus where the bottlenecks exist – on supply. We need to streamline development processes, reduce approval timeframes and provide better infrastructure to free up the options and provide more choice for everyone on where they live. Now, in some areas, this is finally happening and increased development activity around transport hubs will eventually ease some of the pressure.
We also explore in our trend, Lifestyle Locations: Walkable, Liveable, Lovable, government plans to create walkable neighbourhoods with revitalised retail, cafe and nightlife precincts surrounded by modern and compact new housing across our capital cities.
Government-owned land with existing infrastructure should also be prioritised for development. We must address labour shortages through skilled migration and training while supporting innovative construction methods that reduce costs.
Things like modular housing and 3D printed housing solutions need to be incentivised and supported. As mentioned in our Weathering The Future: The Power Of Smart Design trend, prefabricated homes can be completed in 10-12 weeks compared to 18 months for a traditional house, saving time and money for everyone involved. There’s no reason why Australia shouldn’t be a world leader in innovative design and construction and, indeed, there are many reasons why we should be.
Now, I know governments are well-intentioned with first home buyer incentives, but here’s the uncomfortable truth: these demand-side solutions are providing nothing more than a sugar hit to home values. The seller benefits slightly, but buyers face the same relative disadvantage.
Despite the challenges, I see genuine reasons for optimism. Housing demand is moderating and expected to stabilise at about 175,000 households annually from 2026. Construction cost growth is slowing. State governments are implementing meaningful planning reforms, and build-to-rent models are expanding supply options. We just need to fast-track all these solutions in parallel.
Australia has the land, demand and capability. What we need is the will to implement supply-focused solutions that address root causes rather than symptoms. I hope the insights we offer in this year’s McGrath Report encourage conversation and highlight some of the changes needed to deliver sustainable, affordable housing for all Australians.
John McGrath Founder & CEO

In 1982, Australian band Moving Pictures released the hit song What About Me?
The song channels the frustrations of “little people” who “want their share”. It quickly became an anthem for a group of young Australians, later to be known as Generation X. Those same teens are now in their 40s and 50s and have spent several decades working full-time jobs, raising families, buying and paying off their home and looking after their ageing parents. And - just like the song - these 50 somethings are now asking the question What About Me?
Generation X (or Gen X) refers to people born between 1965 and 1980. Today, Gen Xers are aged between 45 and 60.
According to Demographics Group co-founder Simon Kuestenmacher, many Gen Xers developed a resilient and independent mindset, which can be traced to their unique upbringing. “Gen X was the only generation in Australian history which grew up with working parents and no childcare network,” he said in an interview with McGrath. “This meant that many Gen Xers came home to an empty house, and this made them pragmatic.”
This mindset helps explain why another Australian demography company, McCrindle, found in 2023 that 66% of Gen Xers listed ‘full financial freedom and independence’ as their ‘top hope’, ahead of 59% for Baby Boomers (born 1946-1964) and 63% for Millennials (born 1981-2006).1
Kuestenmacher also said Gen X witnessed their parents having relatively high divorce rates, and “working themselves to death”, and reacted by holding a strong belief in family harmony and the need for work-life balance.
The good news for Gen X is that it has been able to take advantage of some key Australian policy and economic tailwinds in seeking to meet these generational objectives.
Firstly, Gen X was able to access Australian property at what would today be regarded as affordable prices. For most of the 1990s, Gen Xers were able to purchase an average Australian property at a price around six times the average annual income, well below the ten times ratio which crippled Millennials’ home ownership aspirations by the late 2000s.2
At the same time as enjoying relatively low housing prices, Gen X was also able to take advantage of falling interest rates during the mid-1990s and financial market deregulation to raise a loan to get into the market.3
Once Gen Xers were able to enter the market, prices turned in their favour from the early 2000s.4 Research undertaken by Cotality confirms this fact to McGrath, showing that Gen X has earned higher overall capital gains than the Baby Boomer or Millennial generations, and therefore are the winners in the Australian generational real estate race.
The research found that a 25-year-old Gen Xer purchasing a median Australian property, worth $126,728 in 1997, would have collected a tidy $528,182 capital gain by 2025 thanks to that property being worth $654,910 in mid2025. This is higher than the $405,472 capital gain which would have been earned by a Millennial, and $456,243 earned by a Baby Boomer, from when they were aged 25.
Gen X are the clear overall capital gains winners in the Australian generational real estate race.

Source: Cotality Generation
Purchase year (assuming purchase at age 25 from middle year of generation)
Median Australian property price in June of purchase year
$421,121 What this property would be worth in June 2025
Gen X has now become the Australian generation with the largest housing portfolio. A KPMG report released in January 2025 found that Australian Gen Xers own housing to an average value of $1.31 million, closely followed by Baby Boomers at $1.30 million.5
“Gen X sustained and popularised the great Australian dream, but then took it to the next level,” said Mark McCrindle, co-founder of McCrindle, in an interview with McGrath.
So, given its dominant position in the Australian real estate stakes, how will Gen X shape the housing market in years to come?
Some people call Gen X the ‘sandwich’ generation, due to the fact it is caught between looking after parents who are living longer and children who are not leaving home.
Statistics back this assertion. The proportion of 19-year-olds living with their parents has increased from 63% in 2006 to 72% in 2021.6 Meanwhile, over the 20th and 21st centuries, life expectancy for Australian men rose from 55 to 81.7
These two factors, combined a generational desire for family harmony, means that Gen Xers are increasingly seeking housing solutions which can support three generations under one roof. Commenting on multigenerational family housing, Kuestenmacher said Gen X “needs it and needs it now … this is the right time for governments to allow Gen Xers to have a large enough house for family members, or a granny flat.”
Fortunately, the NSW, Victorian and South Australian governments have all introduced streamlined planning approvals to support the construction of granny flats on the same block as the family home.8 Furthermore, in 2021, the Federal Government changed the law to ensure that granny flat arrangements could be set up for family members, without exposing the entire family home to capital gains tax.9
In addition, state governments around Australia are introducing policies to make it easier for homeowners to subdivide their land, so they can demolish the family home and build two or more new dwellings for parents or children.10 11
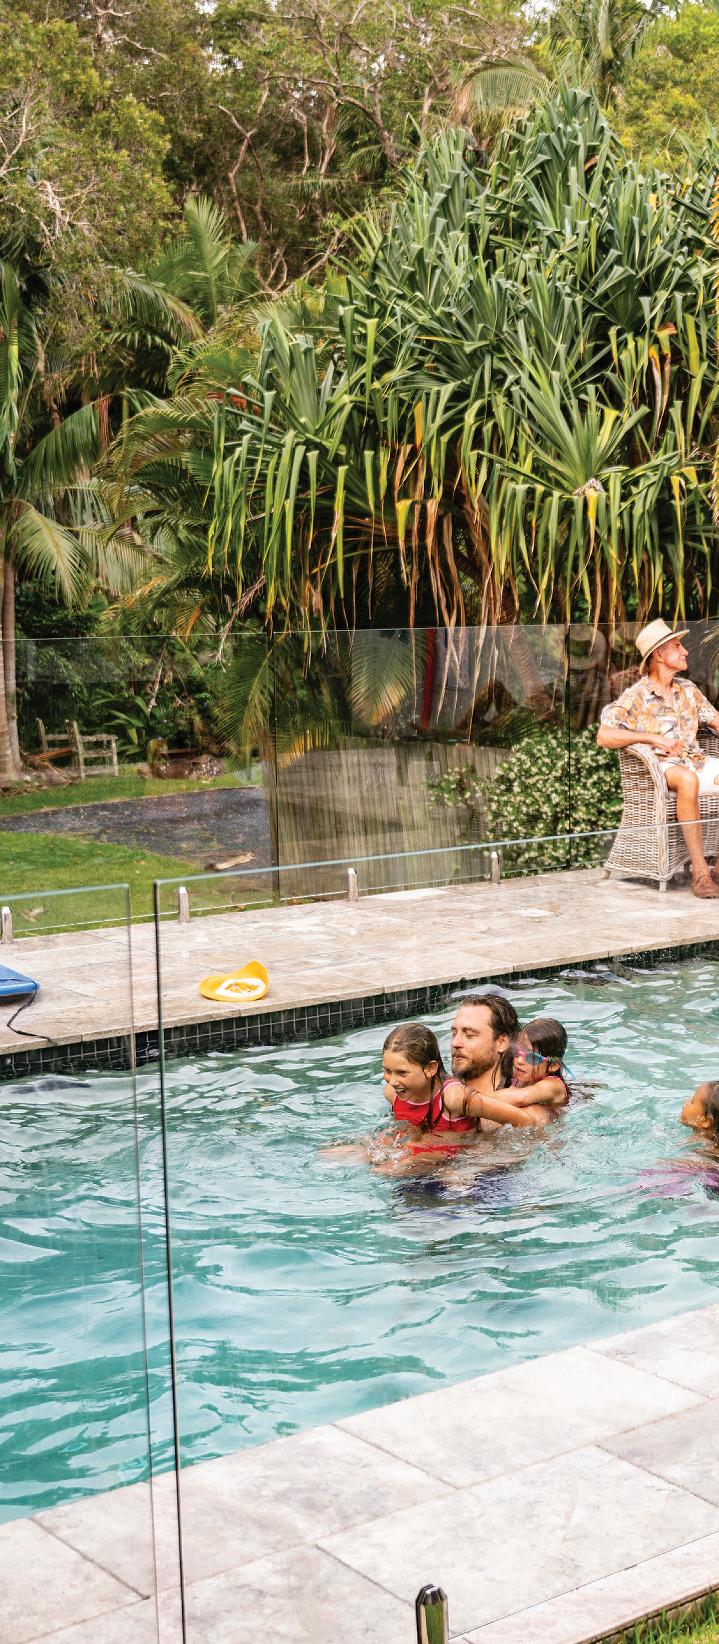
Gen Xers hold an average mortgage balance of $448,000 — five times higher than Baby Boomers ($82,000) — keeping them in the workforce longer and shaping their housing choices.
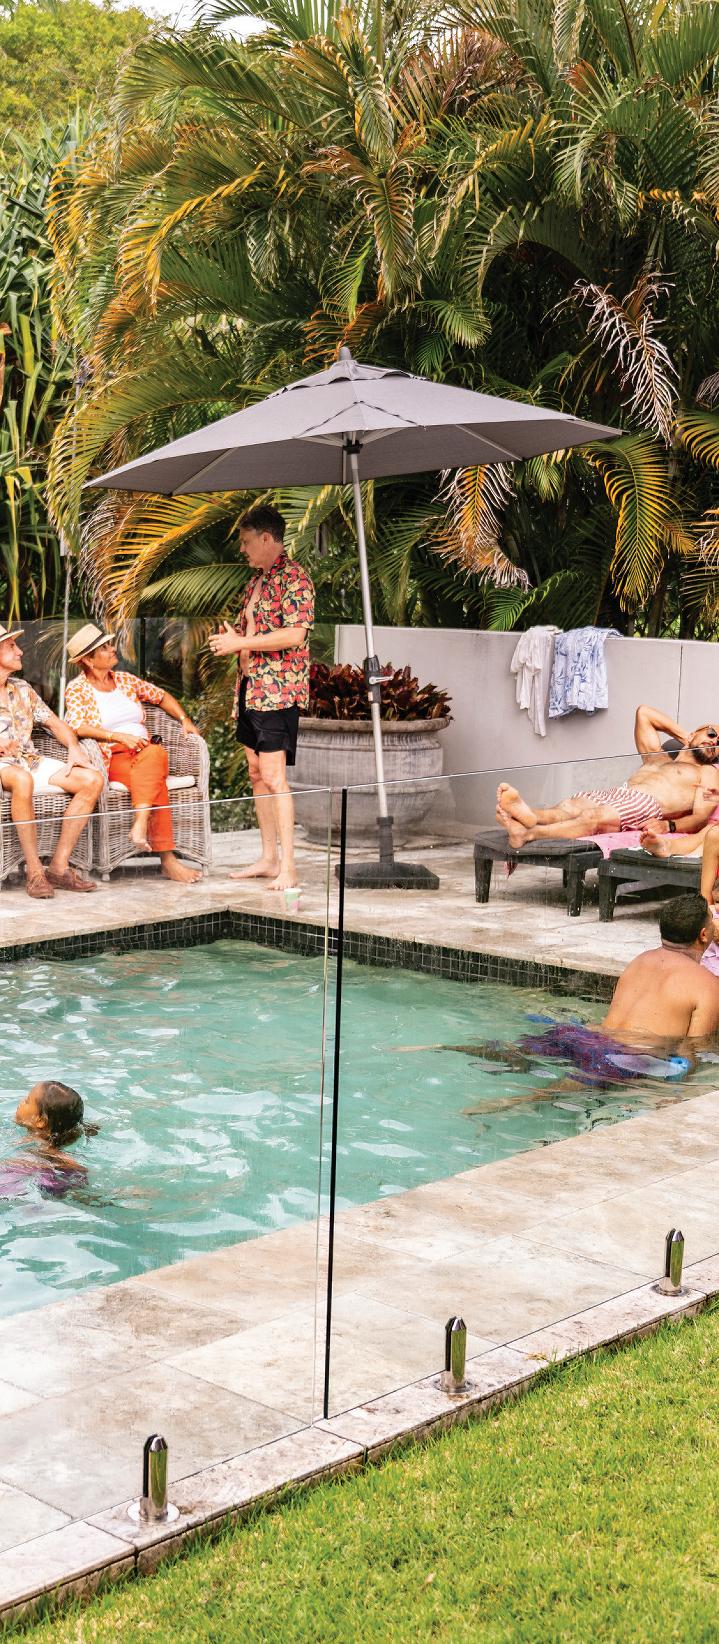
Gen X is called the ‘sandwich’ generation – caught between looking after parents living longer and children not leaving home.
Another Gen X-related property trend relates to the need to have properties with workfrom-home facilities.
McCrindle research found that 34% of remote workers hailed from Gen X, compared to 31% from the Millennial generation, and just 18% for the even younger Gen Z.12
Mark McCrindle attributes this to the fact that, compared to younger generations, Gen Xers are more likely to have sufficient space in their home to undertake work, and are at a stage in their careers where they don’t need to build their network by frequently going to the office. Kuestenmacher also points out that remote working meets Gen X’s desire for work-life balance.
What’s more, Gen Xers - compared to Baby Boomers - need to work later into life. This is in part due to the fact that Gen X has an average mortgage balance of $448,000, compared to just $82,000 for the Baby Boomers.13
This all points to a situation where, for at least the next decade, many Gen Xers will be looking to either renovate their existing home, or move into a new home, to provide the space and facilities they need to be able to undertake remote work.
While Gen X members have an immediate need for family accommodation and workfrom-home facilities, the medium to longerterm property game looks very different and far more exciting.
By 2031, it’s been predicted that just under a quarter of Gen Xers aged 55-64 will be outright homeowners, with just over half still having a mortgage.14 Around the same time, they will be increasingly released from their generational ‘sandwich’, with many children having left home and parents having sadly passed away or living in aged care.
Gen X will also be the first generation to enter retirement as the beneficiary of mandatory superannuation, which commenced in 1992. They are also predicted to benefit from an increasing inheritance windfall, which is set to rise from its current $120 billion to $500 billion per annum nationwide over the next 25 years.15
Gen Xers are therefore uniquely positioned to combine their home and savings assets to secure prized financial freedom, and at the same time enjoy some long-awaited lifestyle benefits.
One way they can do this is via downsizing. “While Gen X needs a big house for the next ten years for the kids and grandparents, after this they can become empty nesters, sell the house down and pocket the profit,” Kuestenmacher said. “Downsizing as a

share of population will be a much larger phenomenon in the Gen X population than Boomers.
“With Boomers, there is a view that whoever dies with the most toys wins the game of life, but Gen X will be more likely to downsize, both for financial reasons but also because they can move into a more walkable neighbourhood and have better mental and physical health.”
For those who are still paying off a mortgage, downsizing can become an extremely handy way to eliminate debt. Outright homeowners, meanwhile, will be more likely to use Federal Government incentives to place up to $600,000 into their superannuation fund from downsizing proceeds.16 Currently, many Baby Boomers are reluctant to downsize because of fears the equity they release by selling the family home means they will lose access to the aged pension.17 However, given their larger savings, Gen X will be part of the growing percentage of self-funded retirees who won’t have this concern.18
When Gen Xers do downsize, they are likely to be comfortable moving into an apartment or semi-detached house, given one in four were living in these housing types when aged 25-39.19

Many Gen Xers are also likely to take advantage of the shift towards wellnessrelated new housing projects. This trend is seeing projects increasingly integrating health, sustainability and lifestyle into their design, including through communal features such as pools and garden sanctuaries, and home design features such as purified air and lighting systems which mimic natural daylight patterns. Research published in August 2025 found the Australian wellness real estate sector reached US$25.65 billion in FY23, up 65% from US$15.58 billion in FY19.20
Mauricio Umansky, one of the world’s most influential leaders in global real estate and star of Netflix’s ‘Buying Beverly Hills’ series, says the focus on wellness is here to stay.
“One of the things that’s happening right now in the US, is that luxury is longevity –it’s wellness,” Umansky said during a visit to Australia in May 2025.21 “It’s creating a space that becomes your sanctuary … and it becomes a place where you’re really, truly resting. You’re starting to see a lot more organic materials, earthy tones – everything that’s good for the mind and the brain and the soul. And I feel as though it’s going to be the next trend.”
“Luxury is longevity – it’s wellness. It’s creating a space that becomes your sanctuary…”
– Mauricio Umansky
Some Gen Xers will find their personal and financial sanctuary in regional areas that can offer affordable housing and a great lifestyle. They may gravitate towards locations that a 2024 study found provided the best value for money, healthcare, and lifestyle and leisure facilities in retirement.22 These locations included Armidale in NSW, Hervey Bay and Ingham in Queensland, Launceston in Tasmania and Maryborough and Rosebud in Victoria.
In the short term, many Gen Xers will continue to hum the tune What About Me? as they look after mortgages, work, kids and parents.
However, in the near future, they will be able to sing a far happier and upbeat song as they enjoy a healthy and independent lifestyle, and a secure retirement, due to their hard work and investment in the great Australian dream.

McGRATH REPORT 2026
Living close to or within vibrant town centres, or being able to reach these amenity-rich hubs quickly and easily by public transport, has become increasingly important to Australians across our cities and regions.
The number one reason Australians would move in 2025, according to the 2024 Muval Index, was for a better life, with 41% of upcoming moves motivated by lifestyle - above and beyond work, housing and money.23 “We are increasingly prioritising lifestyle over life stress this year, and next,” said James Morrell, chief executive officer of removalist Muval.24
And for an increasing number of buyers - in particular Gen Zs and Millennials - this desired lifestyle can be found at metropolitan centres offering a quick commute to the office, a bustling café culture and night-time entertainment. What’s more, these younger generations tend to be environmentally focused, so are more likely to prefer walkable neighbourhoods with easy access to public transport.25 Regional centres are also offering many urban lifestyle attributes formerly only available in the big smoke, plus a great natural environment to explore.
Local and state governments are moving away from approving new, low-density precincts predominantly made up of homes which are heavily reliant on private passenger vehicles. Instead, they are encouraging the creation of precincts with more compact development, serviced by public transport and clustered around vibrant and interesting retail centres. This shift is in part due to the high cost of providing new infrastructure to relatively few residents in low-density precincts.26
In Victoria, these preferred new precincts are known as 20-minute neighbourhoods, where residents are able to reach shops, cafes, health services, schools and public transport within 800 metres of their home. The idea is to create precincts that are safe, accessible and well connected; with high quality public spaces and thriving economies that provide amenity to support local living.27
Reasons why people are considering moving in 2025
Source: 2024 Muval Index (multiple choice responses)
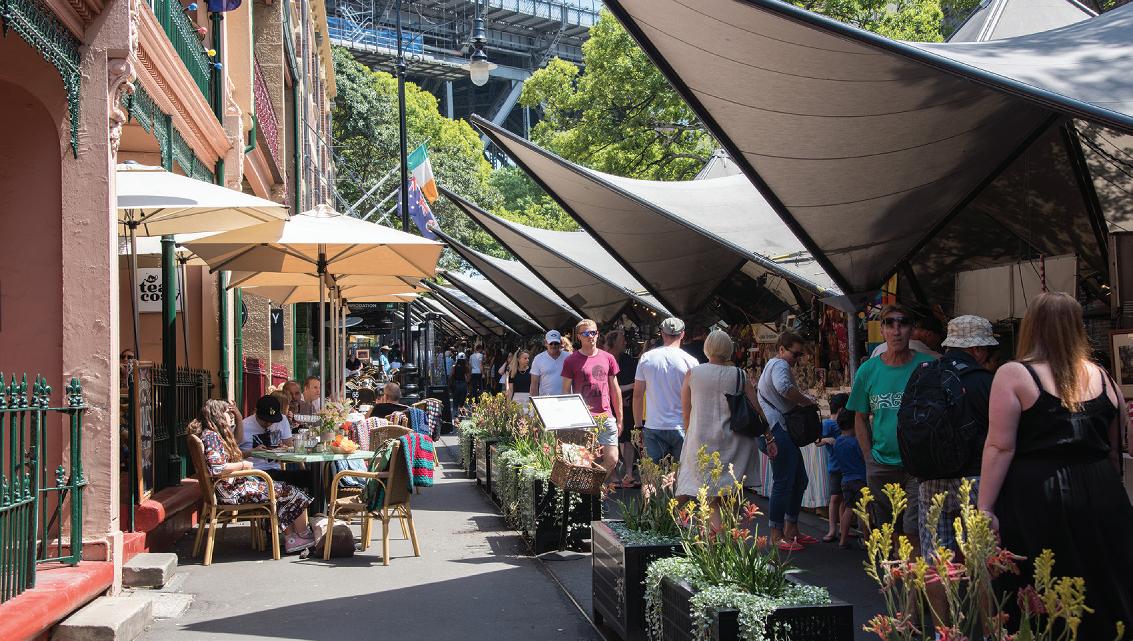
This level of convenience feeds into a family work-life balance that for many Australians is the definition of a desirable lifestyle.
Investment in community infrastructure is key to the success of 20-minute neighbourhoods. To this end, the Federal Government has provided a funding boost for many projects via the Thriving Suburbs Program, with the aim of filling infrastructure gaps particularly for communities that have experienced substantial growth.28
The revitalisation of the main street and shopping precinct in Melbourne’s Croydon is an example of the dozens of projects funded under the program. The $7.5 million Maroondah City Council project will include pedestrian and cycleways, street and feature lighting, artwork and activated green spaces, and is part of the broader enhancement and structure plan to improve the area’s nighttime economy and community liveability.29
Meanwhile, in NSW, local businesses are being empowered to work together, and with governments and the community, to improve local places. New Community Improvement Districts legislation, which passed NSW Parliament in May 2025, allows businesses to raise and centralise funds to promote and strengthen local areas; in doing so making these areas more attractive places to invest in real estate.30
Pilot schemes have included the Inner West Ale Trail that brought together 17 independent breweries to promote the indie beer boom; and YCK Laneways, the precinct around York, Clarence and Kent streets in Sydney’s CBD which has become Australia’s first Purple Flag recipient.31 Purple Flag is an international accreditation scheme that aims to identify areas offering a diverse, vibrant and safe night out.

Big changes are underway in Australia’s major cities to improve another important contributor to a great lifestyle – high frequency, safe and clean public transport.
For instance, construction is underway on Melbourne’s Suburban Rail Loop East (SRL East) which will deliver underground stations at Cheltenham, Clayton, Monash, Glen Waverley, Burwood and Box Hill, with the surrounding neighbourhoods to be enhanced, making them even more attractive places to live, work, visit, study and shop.32
The authors of RMIT University research looking at the impact of commuter rail transport infrastructure on house prices in Melbourne found that properties within 800m of a proposed train station are 8.7% higher in value than those outside 800m (but within 1,600m).33
Structure planning for SRL East precincts will initially apply to an area within an approximate 800m radius with the aim of concentrating jobs, new housing and amenities close to the new train stations. Resident feedback has highlighted an appetite for people to connect locally via a mix of social, cultural and commercial experiences such as eateries, entertainment facilities, small bars, creative workspaces and other elements contributing to vibrant public life.34
Meanwhile, Sydney’s new Metro lines have not only boosted property prices35, they have also delivered speedy travel times for those working in, or heading to, night-time hotspots. There are now calls for the system to implement an extended timetable to transport revellers and hospitality workers home safely.36
Across the country, governments are funding programs to improve the after-dark vitality and lifestyle of existing neighbourhoods. Sydney’s Enmore Road, located in the suburbs of Newtown and Enmore, was the first of seven Special Entertainment Precincts (SEP) approved under NSW Government and Inner West Council reforms to support late-night activity, including live music and entertainment.37
Surveys of nearby residents and businesses, and of visitors to Enmore Road, revealed strong backing for the precinct, which respondents said was a “boon to the arts” and had created a welcome vibrant atmosphere.38 Support from surveyed
residents who lived “within a block” or “more than a block” away from Enmore Road came in at a reassuring 74%, indicating a strong appetite for nightlife in the neighbourhood.
Other councils are now following suit, with trials underway in well-known pockets of suburbs such as Manly, Cronulla and Byron Bay. In Brisbane’s Fortitude Valley, live music venues have doubled since the creation of the first SEP, and plans are also underway to establish precincts in Canberra.39

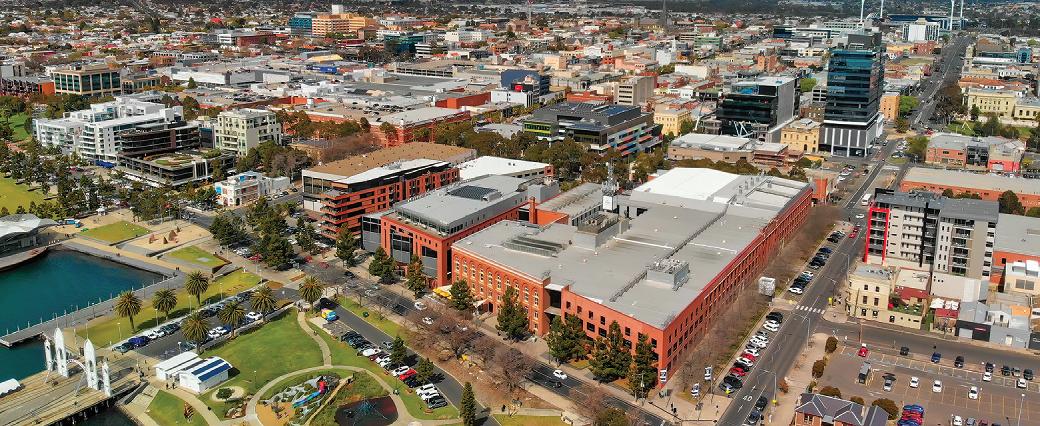
While capital cities continue to house the majority of Australia’s population, regional centres have enjoyed increased demand, especially amongst those who can easily work from home.
The broader acceptance of remote work in the wake of the pandemic has prompted many Australians to make or consider tree and sea changes to regional areas. Results from a Regional Australia Institute survey released in 2025 showed two out of five city dwellers would consider a move to regional Australia, up from one in five in 2023.40
This is not just about seeking a more relaxed pace of life. It’s about finding regional centres that still offer the benefits of city living in a country setting, combining good amenities and infrastructure with a strong sense of community.
Towns such as Gisborne in Victoria’s Macedon Ranges, Toowoomba in the Darling Downs region of Queensland and Orange in the NSW Central Tablelands demonstrate that you don’t have to sacrifice urban-style amenities to enjoy regional living.
You get all the perks - arts, sports, education, healthcare, shopping - wrapped up in a more relaxed and typically more affordable package. Mid-sized urban areas like these tend to have low unemployment rates and easy access to education, arts and recreation services, and are more likely to attract and retain migrants - especially those who are young, university-educated and/or international migrants, according to a 2022 Australian Housing and Urban Research Institute (AHURI) report.41
In Victoria, Greater Geelong has toppled the Sunshine Coast as the LGA receiving the largest inflow of net internal migration in the 12 months to March 2025, accounting for 9.3% of all net migration to regions.42
Set on the shores of Corio Bay, part of the scenic Surf Coast, Geelong has been the target of recent government investment, with projects including a new $449.1 million convention centre43 and $500 million towards an expanded Barwon Women’s and Children’s Hospital.44 The region’s idyllic waterside location, established services and range of employment opportunities all contribute to making it an attractive lifestyle destination.45

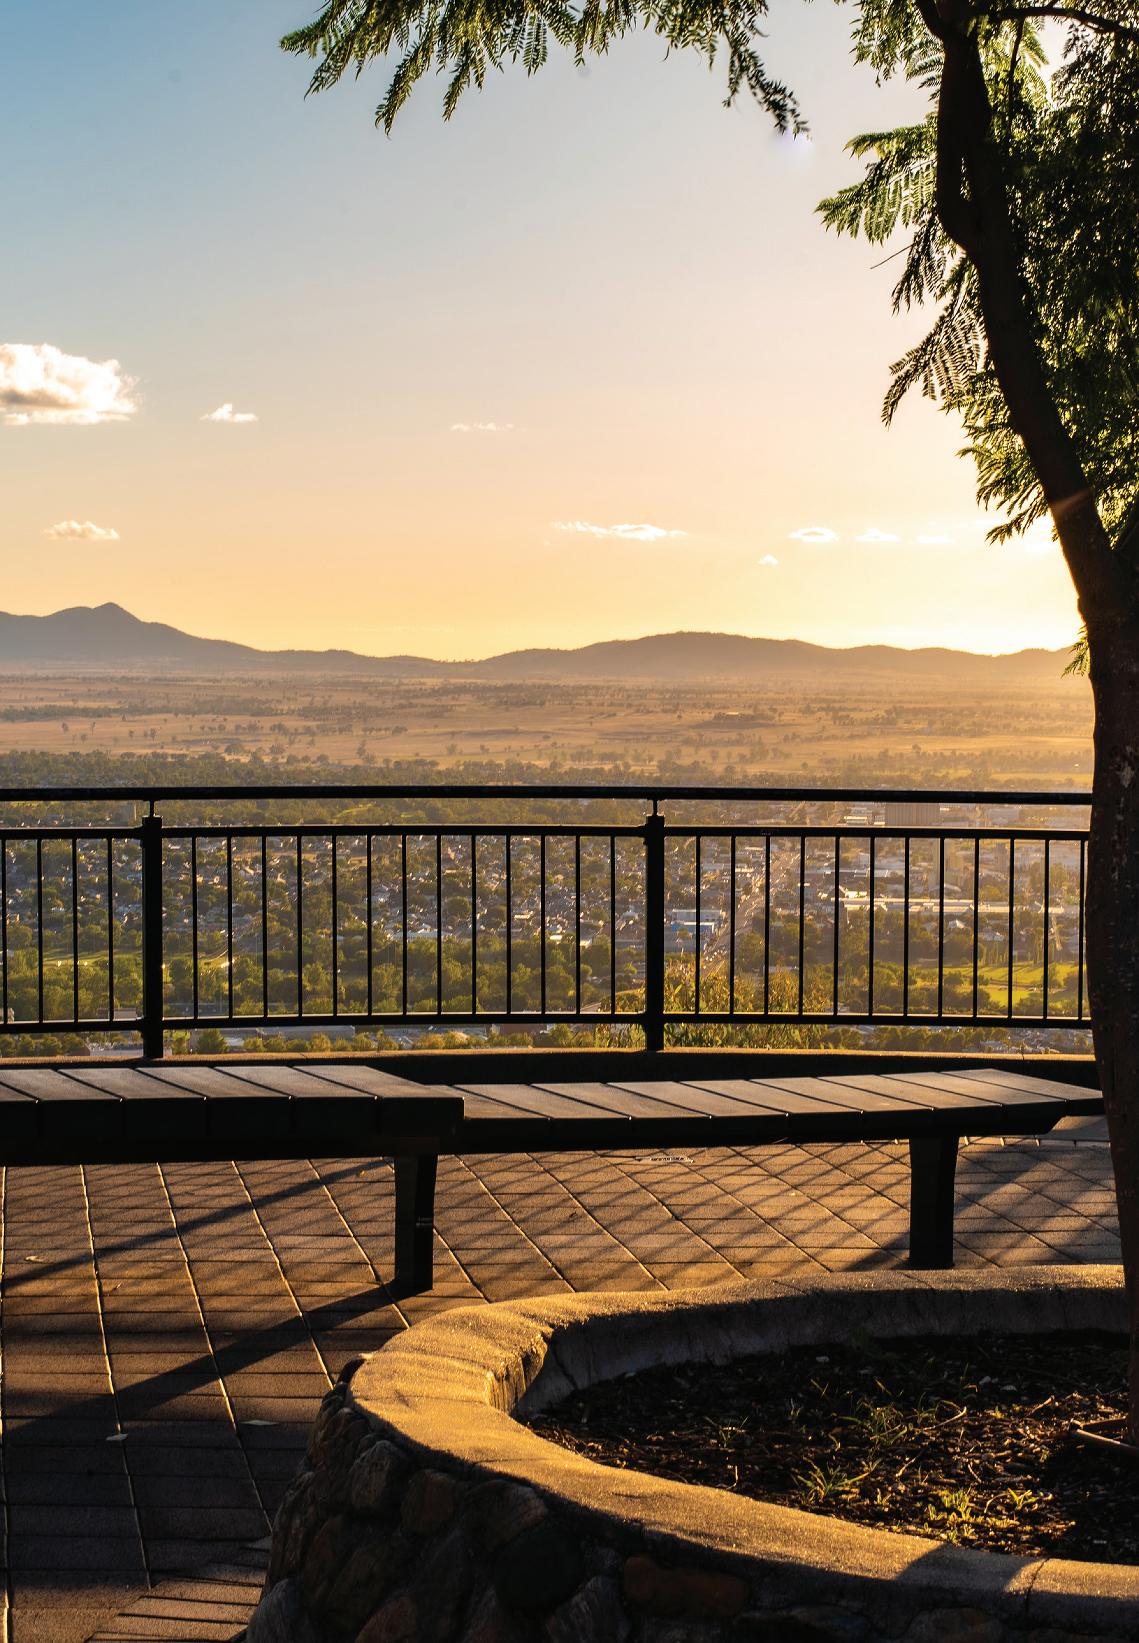
McGrath Tamworth director Jason Wherritt reports buyers are increasingly drawn to Tamworth’s balance of rural tranquility and urban convenience.
“Tamworth delivers on both lifestyle and accessibility,” he said. “Many are surprised at how easily they can cross town compared to Sydney traffic, and the city’s proximity to the coast, Brisbane, Newcastle and Sydney (via multiple daily flights) only enhances its appeal.”
“Tamworth delivers on both lifestyle and accessibility.”
– Jason Wherritt
Over the past decade, population growth has brought improved services to the Tamworth region, which has long been a central hub for surrounding towns and villages.
Wherritt said North Tamworth has become the city’s medical precinct, with upgraded public and private hospitals and a leading regional cancer treatment centre. Education offerings include a variety of public and private schools, including boarding and agricultural colleges. There are also plans for a new aquatic centre at the Tamworth Sports and Entertainment Precinct which already hosts a velodrome, equestrian arena and athletics track.
Lifestyle buyers can find everything from modern homes on acreage to equine-focused properties or bush retreats just 15 minutes from the CBD. The median house price in the Tamworth region rose by 9.2% in the year to June 2025.46
Wherritt said the area is well positioned for continued growth, particularly in the northern corridor thanks to the newly launched Windmill Hill Town Centre, a new commercial and lifestyle development.

Whether by intent or happenstance, pets can help us to make healthier lifestyle choices. Studies show that dog owners are more likely to exercise regularly, and dogs can help you initiate and maintain friendships close to home.47
With 69% of Australian households having pets, it’s not surprising to find they’re impacting our housing decisions.48 Many buyers zero in on properties with pet friendly features: think secure fencing, grassed areas, durable flooring, relaxed strata rules and proximity to parks and off-leash areas where furry friends can run free.
And there’s anecdotal evidence to suggest that being pet friendly can increase property value by 10%. As for landlords, there’s plenty of research that shows tenants will pay extra for a place where their pets are welcome - in some cities to the tune of a 30% premium.49 50
Anecdotal evidence suggests that being pet friendly can increase property value by 10%.
Meanwhile, ‘pupfluence’ is spreading around the globe, with some homeowners raising the bar and including dedicated pet spaces when designing a home or extension.
A Houzz survey found that 48% of renovators prioritise pets in their decision-making process when upgrading their home.51 Offerings range from under-stair nooks and ‘catios’ (an outdoor enclosure for feline friends) to fully furnished pet pads complete with custom dog beds and temperaturecontrolled flooring.52
For apartment dwellers, new developments in Australia and overseas now frequently showcase pet-friendly features, from durable flooring and dog wash stations to off-lead green spaces.

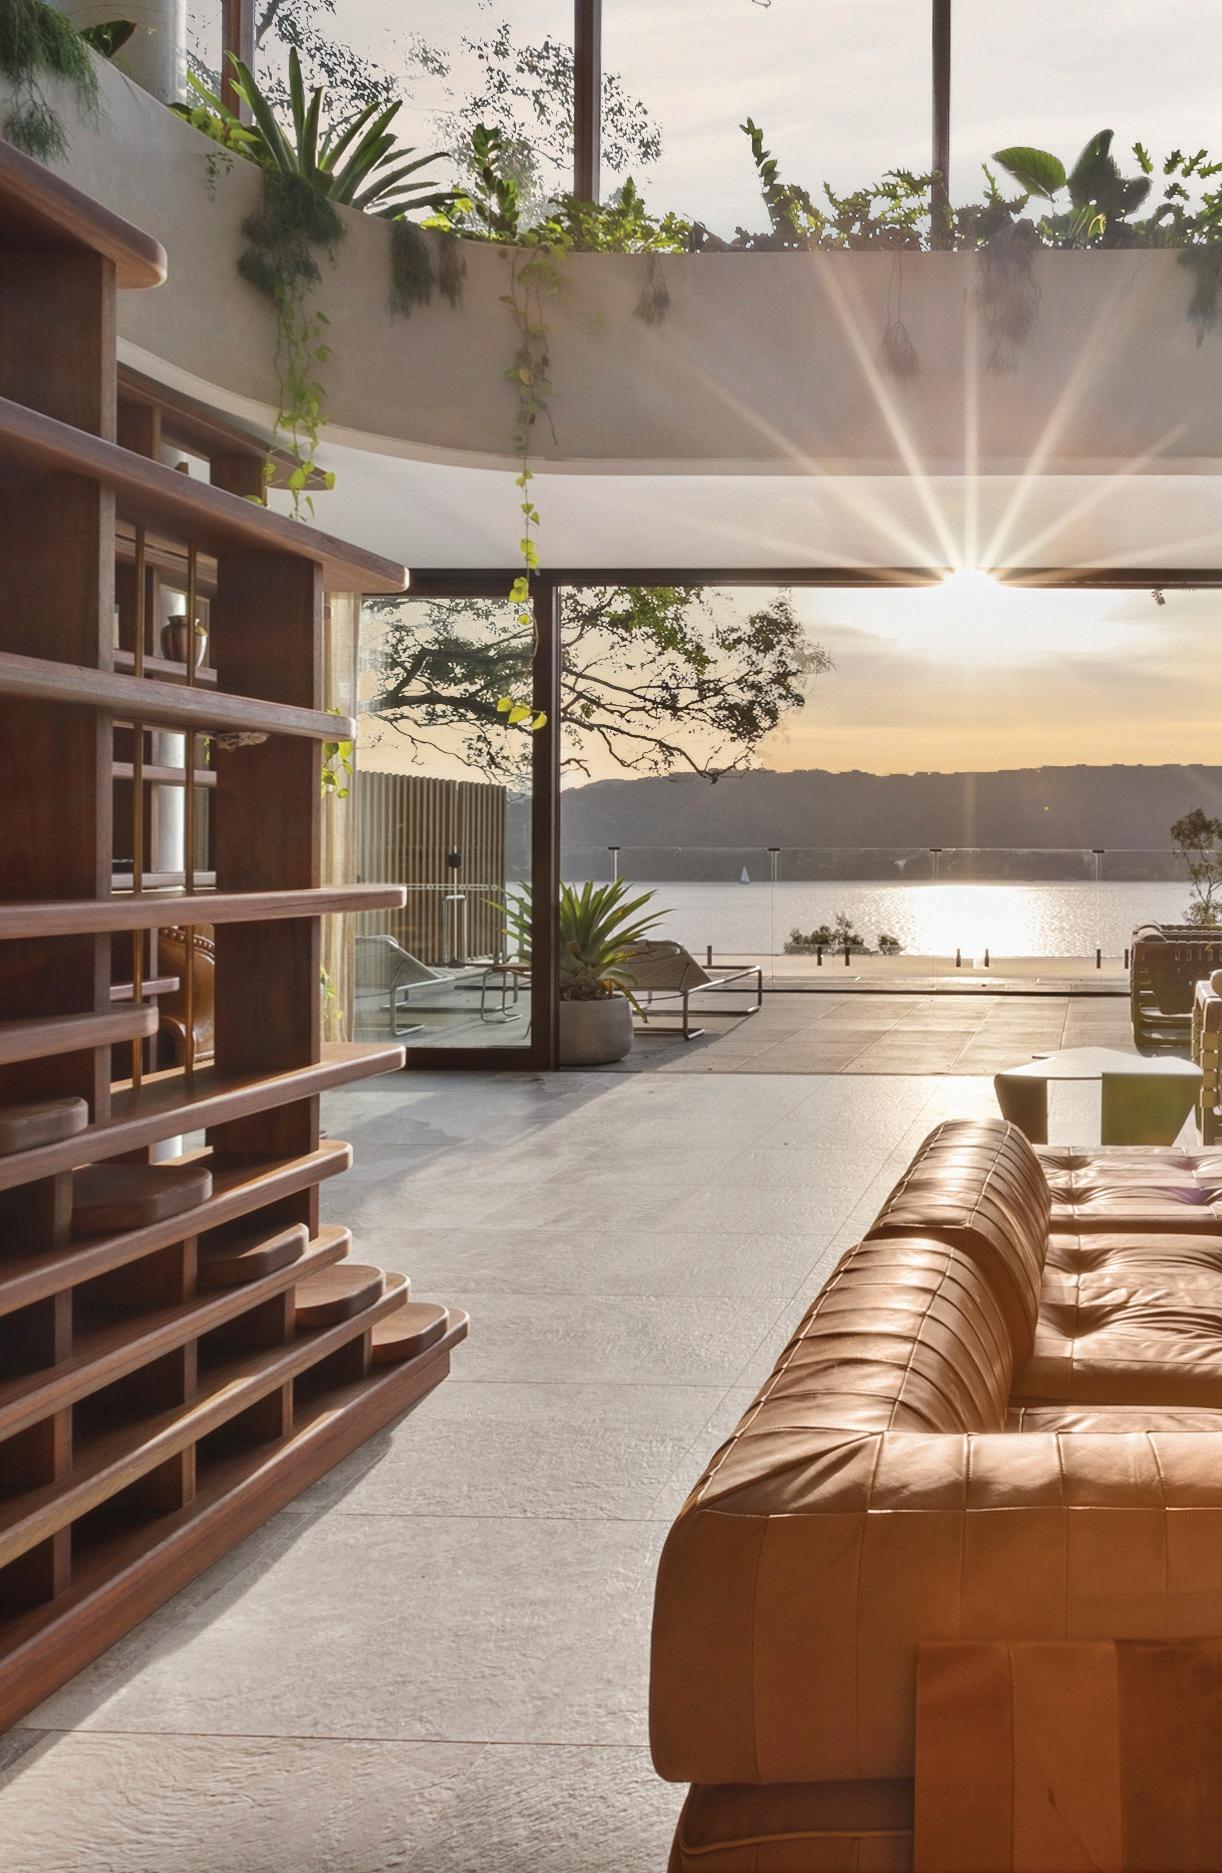
For much of the 20th century, the Australian dream was defined by a freestanding home on a generous block – a suburban sanctuary complete with a backyard barbecue, Hills Hoist and enough lawn for a game of backyard cricket.
Homes were built with simplicity and space in mind: three bedrooms, one bathroom and clearly defined living areas. Brick veneer dominated the streetscape, while energy efficiency was rarely a consideration. Designs were often one-size-fits-all, with little adaptation to Australia’s diverse climates or evolving lifestyles.
Fast forward to today, and that picture is changing rapidly. A sharp jump in the cost of living, building costs and concerns about climate change are reshaping the way we design and live in our homes, with buyers and builders alike prioritising energy efficiency, cost effective materials and flexible spaces that deliver long term value.
The modern Australian home is now more compact, energy efficient and flexible – designed not just for living, but for working, entertaining and relaxing. It’s a reflection of a new kind of aspiration: one that values functionality, longevity and smarter living over size.
While the pandemic briefly saw a resurgence in larger living spaces, the longer-term trend across Australia points to a steady decline in home sizes, driven by escalating property prices, increased demand for higher density living, smaller lot sizes and a growing share of apartments within the national housing landscape. In March 2024 the average floor area of detached homes across Australia was 250m², down from 255m² in March 2019.53
Floorplans are evolving to meet the demands of modern living, with a growing preference for intelligent, space efficient design. Versatility is key – home offices are increasingly doubling as guest bedrooms, while hybrid spaces such as combined laundry-bathrooms and media rooms incorporating gym equipment are on the rise.
“There’s definitely a movement to more efficient, clever home design,” said Adam Haddow, Director of SJB architecture and design studio. “There tends to be a lot less space in house design for the sake of space. People are more thinking, ‘If I don’t need it, why have it?’”
“There’s definitely a movement to more efficient, clever home design.”
–
Adam Haddow
At the same time, a shift is also underway towards cost-effective sustainable building materials and construction processes.
Prefabricated construction, including factory-built new home or granny flat modules delivered to site, is slashing labour and waste costs.54 By shifting most construction activities from an external building site to a controlled factory environment, prefabrication reduces weather and trade delays. This means prefabricated homes can be completed in 10-12 weeks, compared to the traditional 18 or more months, a time saving that could help reduce housing costs and expedite supply.55
Early in 2025, the Commonwealth Bank of Australia (CBA) took a landmark step by becoming the first major Australian bank to explicitly underwrite prefabricated home construction. Under the CBA’s new policy, customers can now access progress payment loans for such builds of between 60-80% of the total contract price, before the home is delivered to the land.56 CBA has also joined the industry association PrefabAUS and is co-sponsoring the development of standardised contracts between consumers and builders – a significant step in legitimising off-site construction finance.
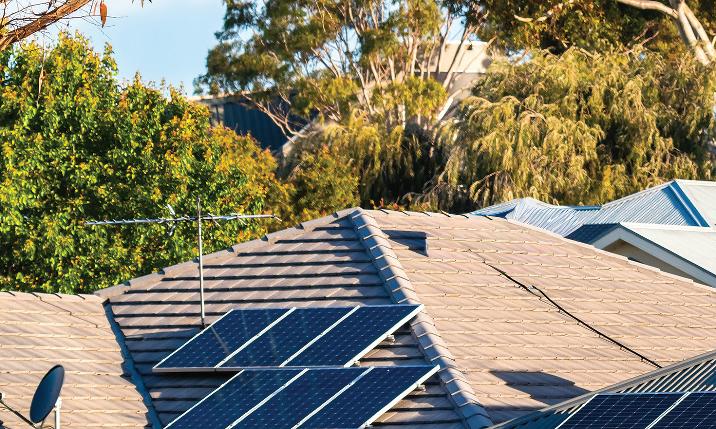
If the prefabricated sector takes wings, it will go a long way to helping the Federal Government meet its goal of building 1.2 million new, well-located homes by 2029.57
While Australia still has a long way to go compared to other parts of the world, more people are also incorporating recycled materials - such as reclaimed steel, glass and timber - into structural and finish elements. By doing this, homeowners are both saving money and introducing a unique character into their dwellings.58
Engineered timber – notably mass timber products like cross and glued laminated timber – is also gaining traction.59 This material delivers strength comparable to steel, exceptional carbon sequestration and faster assembly times, making it a compelling economic and environmental choice.
“Longevity in materials is more prevalent,” Haddow said. “We have moved away from the cheap and cheerful material finishes –people are choosing proper timber floors rather than vinyl because you can refinish them and get more out of them. They are also really cognisant of provenance, just as they are with food. They want to know where the materials come from and that they’re local.”

Meanwhile, Australian homeowners are increasingly taking advantage of a range of new technologies and government schemes to create smart and sustainable homes which save money and are kinder to the environment.
For instance, more than 300,000 rooftop solar systems were installed across Australia in 2024, bringing the total number to more than four million. In the second half of the year, 28.4% of rooftop solar installations
had an accompanying small-scale battery installed, bringing the total number of home battery units across the country to nearly 186,000. NSW was the biggest adopter in the second half of 2024 with 14,686 battery unit purchases, followed by Victoria with 10,996 and Queensland with 8,555.60 Under a Federal Government scheme which commenced on July 1, 2025, homeowners are able to claim a 30% discount on the upfront cost of installing a small-scale solar battery.61
In November 2024, Australia reached 4 million rooftop solar installations
These installations supplied 12.4% of Australia’s total energy generation for 2024 4m 12.4%

Haddow believes the shift to batteries will become more pronounced when electric vehicles become the norm. “If you’re getting a new car and something to power your house, I think that will be when the real change will happen,” he said. “It’s happening slowly, but I think there will be a bit of a tsunami once systems are sorted out and it becomes a bit simpler.”
Inside the home, owners and developers are no longer treating energy efficiency as an optional add-on – it’s now a core requirement.
This begins with the adoption of power-saving appliances, including energy-efficient lighting and electric heat pumps. Unlike traditional gas systems, heat pumps operate by transferring heat from cooler areas to warmer ones using electricity, offering both environmental and economic benefits over time.
“Gas is dead; heat pumps are in,” Haddow said. “While there’s an upfront cost for heat pumps, they work better and are more cost-effective [in the] long term.”
Complementing these physical systems are smart home monitoring technologies that further enhance efficiency. This allows households to control and optimise appliance usage in real time and to better track, manage and reduce their utility consumption. Smart energy systems can reduce household electricity use by up to 30%, with programmable thermostats alone accounting for a 10-15% reduction in heating and cooling costs.62
Industry leaders such as Google Nest and Ecobee continue to drive innovation in this space, offering systems that learn user behaviour and automatically adjust energy usage patterns. State-led initiatives in NSW and Victoria also offer rebates and incentives for installing these technologies, highlighting their growing importance in the broader push toward energy resilience and environmental accountability.63
Smart energy systems can reduce household electricity use by up to 30%.

New technology is emerging to help households better understand the energy performance of their homes – an area that has traditionally been difficult to assess, particularly for older dwellings. One example is a tool developed through a collaboration between data and analytics company Cotality and the CSIRO, which uses artificial intelligence to overcome information limitations and estimate the energy efficiency of a home.
The system produces a star rating aligned with the Nationwide House Energy Rating Scheme (NatHERS), a government-backed framework that rates the energy efficiency of homes on a scale from 0 to 10 stars. While NatHERS assessments have typically required detailed architectural plans and professional assessors, this new tool (known as RapidRate) aims to make the process faster and more accessible.
Green loans are also helping drive movement in this space.64 The Federal Government’s Clean Energy Finance Corporation is providing funding to commercial lenders to allow them to offer consumer-focused loan products with lower interest rates for environmentally conscious dwelling purchases and upgrades.65
Outside, edible gardens and rainwater harvesting are gaining traction among homeowners seeking greater self-sufficiency. “There’s a shift from big houses to big gardens,” Haddow said. “I think it’s a postCOVID shift, with people becoming more connected to the outdoors.” By cultivating home-grown produce and capturing rainwater, people are not only reducing their cost of living but also enhancing the sustainability and appeal of their properties.
Around 45% of Australians grow at least some of their own food, mostly vegetables, fruit and herbs66, while 26% of Australian houses have a rainwater tank.67 While the vast majority are in regional areas, they are increasingly being installed in suburban households due to rising water costs, mandatory building regulations and increased awareness of sustainable living.
Properties that can meaningfully demonstrate climate resistance are better positioned to weather the twin currents of insurance scrutiny and buyer demand.
Homes and apartments designed, retrofitted or located to withstand risks such as flooding, bushfires and storms are attracting stronger buyer interest, leading to better resale potential and reduced depreciation in volatile markets.68 As the frequency of natural disasters increases, cool climate areas such as Tasmania may become more popular.69 In warmer areas, homes will have to be designed to facilitate effective cooling – through air-conditioning, ceiling fans, cross-ventilation and appropriate insulation – to ensure year-round comfort and energy efficiency.
Homes with features such as elevated structures in flood prone regions, fire retardant materials, reinforced roofing and passive cooling systems, are also commanding a price premium in many markets as they offer not just physical protection but also financial predictability and peace of mind for homeowners.70
Homes with resilience features are commanding a price ... premium in many markets.

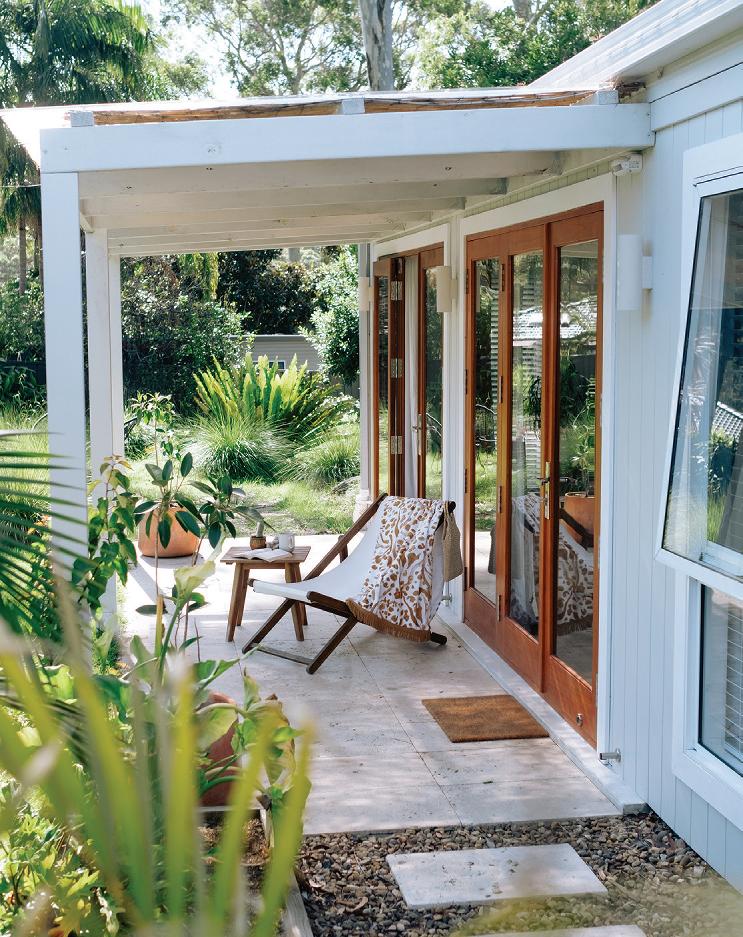
Australian regulatory bodies are also enacting more rigorous building code reforms to enhance residential resilience. The National Construction Code 2022, which was adopted in 2023, officially enshrined higher performance thresholds for new builds – particularly for new single dwelling homes and apartments. These mandate significantly stronger standards in thermal efficiency, structural resilience and climate adaptability.71
A growing number of local councils across Australia are also implementing tighter planning controls in areas identified as high-risk for natural disasters such as floods and bushfires.
As we look ahead, the great Australian dream is no longer defined by typical suburban homes on large blocks of land, but by intelligent home designs that respond to our changing climate, economic realities and lifestyles. From compact footprints and recycled materials to smart energy systems and resilient structures, the future of home design in Australia is not just about where we live, but also how we live, and how well our homes can support a more efficient, connected and sustainable way of life.
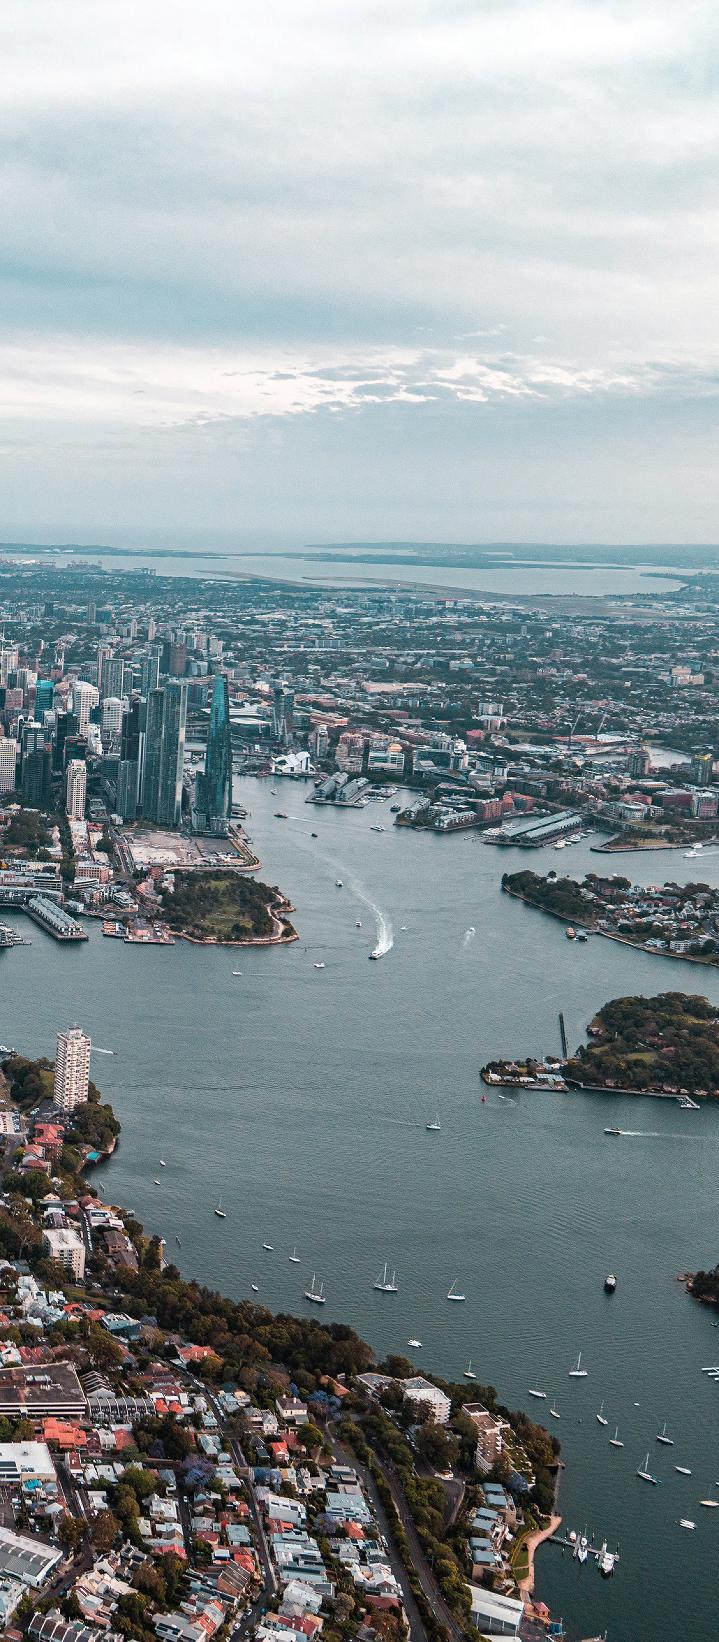
MEDIAN HOUSE PRICE
$1,521,611
MEDIAN APARTMENT PRICE
$873,838
Source: Cotality, September 2025

One in four NSW buyers today are first home buyers, which is above the decade average.
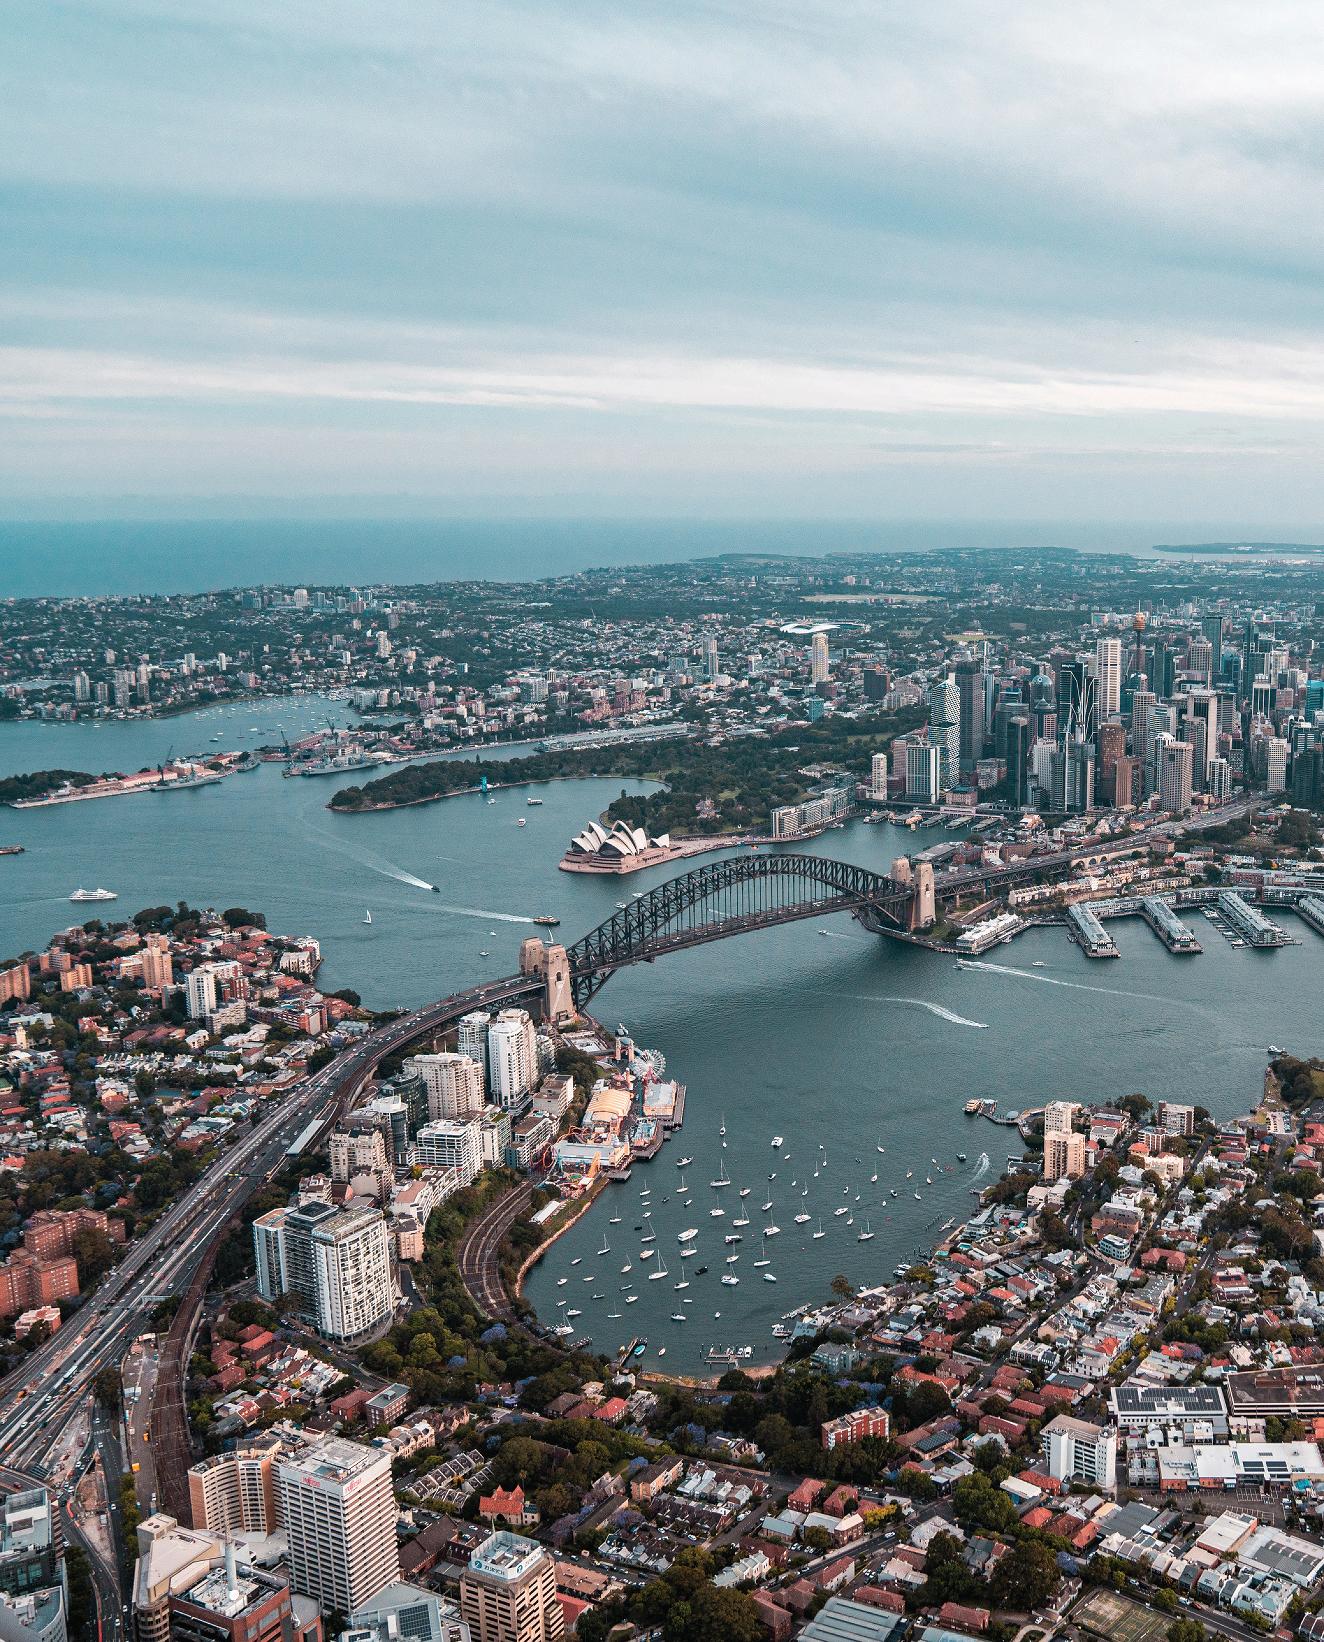
Home value growth slowed in Sydney as high interest rates, rising living costs and already elevated prices constrained affordability. Sydney lagged all capital cities except Canberra and Melbourne in FY25, with dwelling values rising just 1.3% to a record $1,210,222.72 The median house price lifted 1.7% to $1,496,985 and the apartment median rose 0.2% to $863,257.
Despite more homes for sale73, solid demand kept auction clearance rates above the 60% benchmark for a balanced market. Growth was strongest in Sydney’s more affordable western and south-western suburbs74, and buyers favoured established homes over building due to high costs.
NSW regional home values grew 3.5% in FY2572 driven by tighter supply73 and continued city-to-region migration. Movement out of capital cities remains 20.5% above pre-COVID levels75, with Sydney accounting for 64% of the net outflow and 40% of relocators settling in regional NSW. Most relocators are Millennial families76 chasing affordability, and retiring
Baby Boomers bringing significant equity to seachange communities where they can afford to pay cash for premium homes.77
Sydney has a reputation for home values that double every decade, but this contested phenomenon is now only happening in regional NSW. Over the past 10 years, Sydney home values rose 74% whilst regional home values lifted 104%.78 House prices more than doubled in the Southern HighlandsShoalhaven, Richmond-Tweed, NewcastleLake Macquarie, Central Coast, Mid-North Coast and the Illawarra. Only Sydney’s Northern Beaches and Eastern Suburbs delivered comparable growth.
One in four NSW buyers today are first home buyers, which is above the decade average. 73 Many are relying on the Bank of Mum and Dad, stamp duty concessions and First Home Guarantee loans. Some are buying with friends and siblings79 whilst others are rentvestors. NSW leads the country in rentvesting80, likely due to easier financing for income-producing properties and high rents pushing young people toward ownership.
Weekly rents in Sydney rose modestly in FY25 – up 2.7% to a median $1,074 for houses and 0.4% to $702 for apartments81 - amid lower immigration, strong first home buying and the highest level of investor activity in the country at 42.9% of NSW lending.73
Changes to NSW zoning laws aim to fast-track major apartment developments82 and encourage more townhouses, semis and boutique apartments to be built near amenities to suit more buyers’ needs and budgets.83 A notable side effect has been the uplift in land value for single-lot owners. Even without developing, they can unlock that value when selling by having their agent market to builders and developers. Some are taking it further. In Rose Bay, 12 owners are marketing their adjoining lots with expectations of more than $165 million.84 Other neighbour-led amalgamations include a $60 million site in Mosman and a $20 million site in Strathfield.85
Sydney’s prestige market was buoyant in FY25, recording its strongest first quarter ever. The top 10 sales totalled $384.5 million, according to Dyson Austen Valuers.86 The standout was the $130 million sale of ‘Elaine’ in Point Piper, matching the national record.87 The Crown Residences 849sqm dual level penthouse at Barangaroo was sold for circa $73 million in June. Other top sales included $56 million in Vaucluse and two $55 million sales in Rose Bay and Point Piper. The trophy home market was supported by global geopolitical shifts, a weaker Australian dollar and strong sharemarket gains.
Sydney Metro, Australia’s largest public transport project88, is reshaping the city’s connectivity and unlocking sleeper pockets of affordability. The Metro is now running from Tallawong in the north west to Sydenham in the inner west, with the 15.5km city section between Chatswood and Sydenham opening in August 2024.89 The extension to Bankstown, due to open in 202690, is already attracting buyers to previously overlooked suburbs such as Hurlstone Park, Canterbury and Campsie, which are more affordable than traditional hotspots like Marrickville and Dulwich Hill.91
In Western Sydney, the 16km M12 Motorway linking the M7 and The Northern Road to the new international airport will open before the airport commences operations in late 2026.92 The Metro line from St Marys to the airport and Bradfield City Centre will follow in April 2027.93 The Parramatta Light Rail from Westmead to Carlingford opened in December 202494, with the construction of Stage 2 linking Parramatta to Sydney Olympic Park now underway.95
Sydney remains Australia’s powerhouse market, with Cotality data showing 64% of homes have a median value of $1 million or more – compared to 40% in Brisbane, 31% in Melbourne and 12% in Hobart96 – reinforcing Sydney’s status as the foremost market for wealth creation through property. Whilst growth was subdued in FY25, expected interest rate cuts in FY26 could reignite demand. Early movers stand to benefit by buying before renewed competition pushes prices higher.

Property values continued to level out during a second year of stabilisation for the Canberra market.
Canberra outperformed Melbourne but lagged behind the other capital cities, with dwelling values rising 0.3% to a median $855,197 in FY25.97 The median house price lifted 0.5% to $980,802, while the median apartment price weakened 0.5% to $594,710.
Supply and demand are balanced but high home values and elevated interest rates have reduced affordability. While the market has cooled, the median dwelling value is only 6.4% lower than its peak in May 2022.98 The Federal Government’s re-election will contribute to further stability in FY26.
Canberra is growing and needs greater housing diversity to provide more affordability and choice. The ‘Bush Capital’ has only just begun to embrace apartment living, with most new developments being high-rise towers in town centres. Several high-rise development completions, particularly in Belconnen and Woden99, tempered the city’s apartment price growth in FY25. Meanwhile, boutique infill apartment developments in premium inner city areas, such as Red Hill and Forrest in the inner south, proved highly attractive to young professionals and retirees.100


The Australian Capital Territory (ACT) Government has a plan to enable the construction of 30,000 new homes by 2030 to cater for an anticipated population growth of 47,872 people between FY26 and FY30.101 It is prioritising densification over urban sprawl, with 70% of new homes to be built in existing suburbs.
About 90% of land releases over the next five years will be designated for apartment development. Most will be located close to transport, including the 11km Stage 2 extension of Canberra’s light rail network, now under construction and set to extend to Woden by 2028.102
But the ACT Government wants more diversity than new single lots and high-rise apartments. Strong demand from young families and downsizers for more affordable medium-sized homes with a garden within their current neighbourhoods has led to proposed ‘missing middle’ zoning changes that would allow townhouses, terraces, and duplexes to be built in older established suburbs.103
First home buyers were active in FY25, comprising 32% of owner-occupier lending99 and increasingly purchasing with siblings, friends, or a parent-guaranteed loan.104 Whilst stamp duty exemptions for homes under $1 million – lifted to $1,020,00 for FY26 – under the Home Buyer Concession Scheme105 have helped some young buyers purchase in the city, others are relocating and commuting from more affordable satellite areas including Goulburn where family homes cost less than $750,000.106
Investor activity fell in FY25 as rental growth eased and interest rates remained elevated.107 The city’s apartment yield is strong at 5.3%, leading all the other East Coast capitals, while the house yield is 3.8% – lower than Hobart (4.3%) and a little higher than Brisbane (3.5%) and Melbourne (3.2%).108
As Australia’s third most valuable market72, Canberra stands to benefit most alongside Sydney and Brisbane from falling interest rates. This could accelerate the start of a new growth cycle in FY26.

Sydney
This wonderful pocket of the Inner West bordering Dulwich Hill is starting to edge up in value, but you can still bag a good buy if you’re quick. Decent land allotments. Period homes. Great cafes emerging. It’s avoided the radar of the emerging wealthy until now. If you’ve been priced out of Concord, try on this little hybrid suburb for size. You’ll wonder how you missed it until now!
Sydney
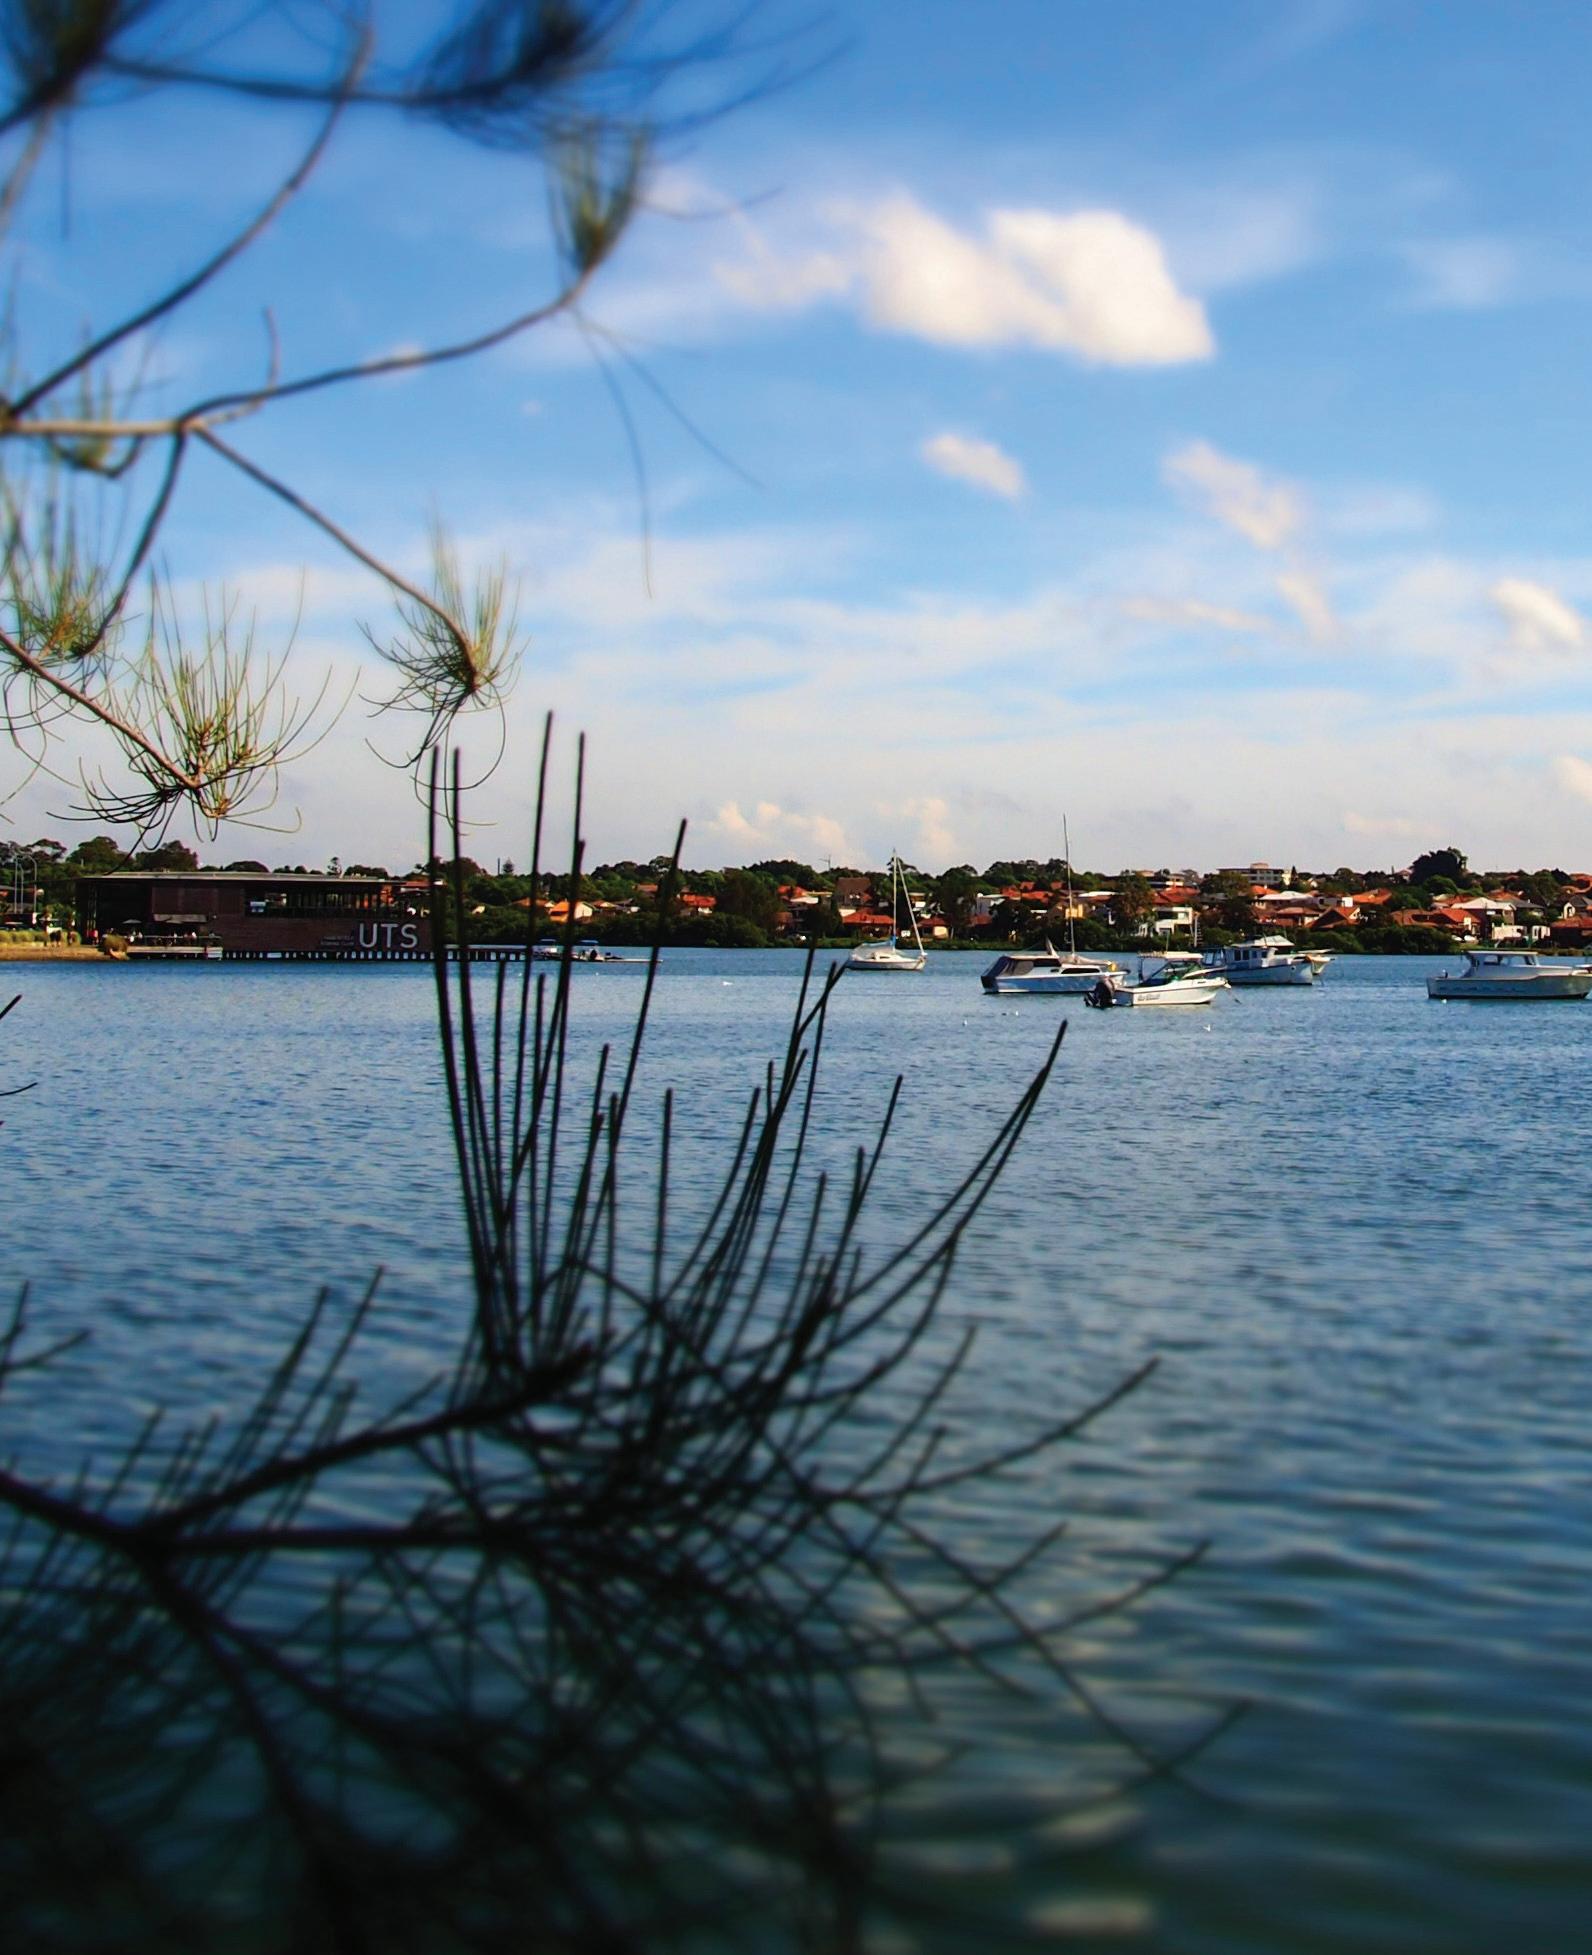
“Where the hell is that?” most inner city and north shore buyers shout when I suggest it. Exactly my point … and the locals like it that way! This little waterfront piece of paradise nestled quietly next to her uber wealthy neighbour Hunters Hill with little or no fanfare. Take a short drive to check out one of Sydney’s more charming waterfront enclaves.
Sydney
In California it’s renowned as one of the best addresses in the country. But this surfing village in Sydney is flanked by rolling surf on one side, peaceful Pittwater on the other, and a vibrant retail village in between. Whether you’re after a beachside mansion or a cute 1970s two bedder for $800,000 you’ll be thanking me in a few years when it’s doubled its price.
Sydney
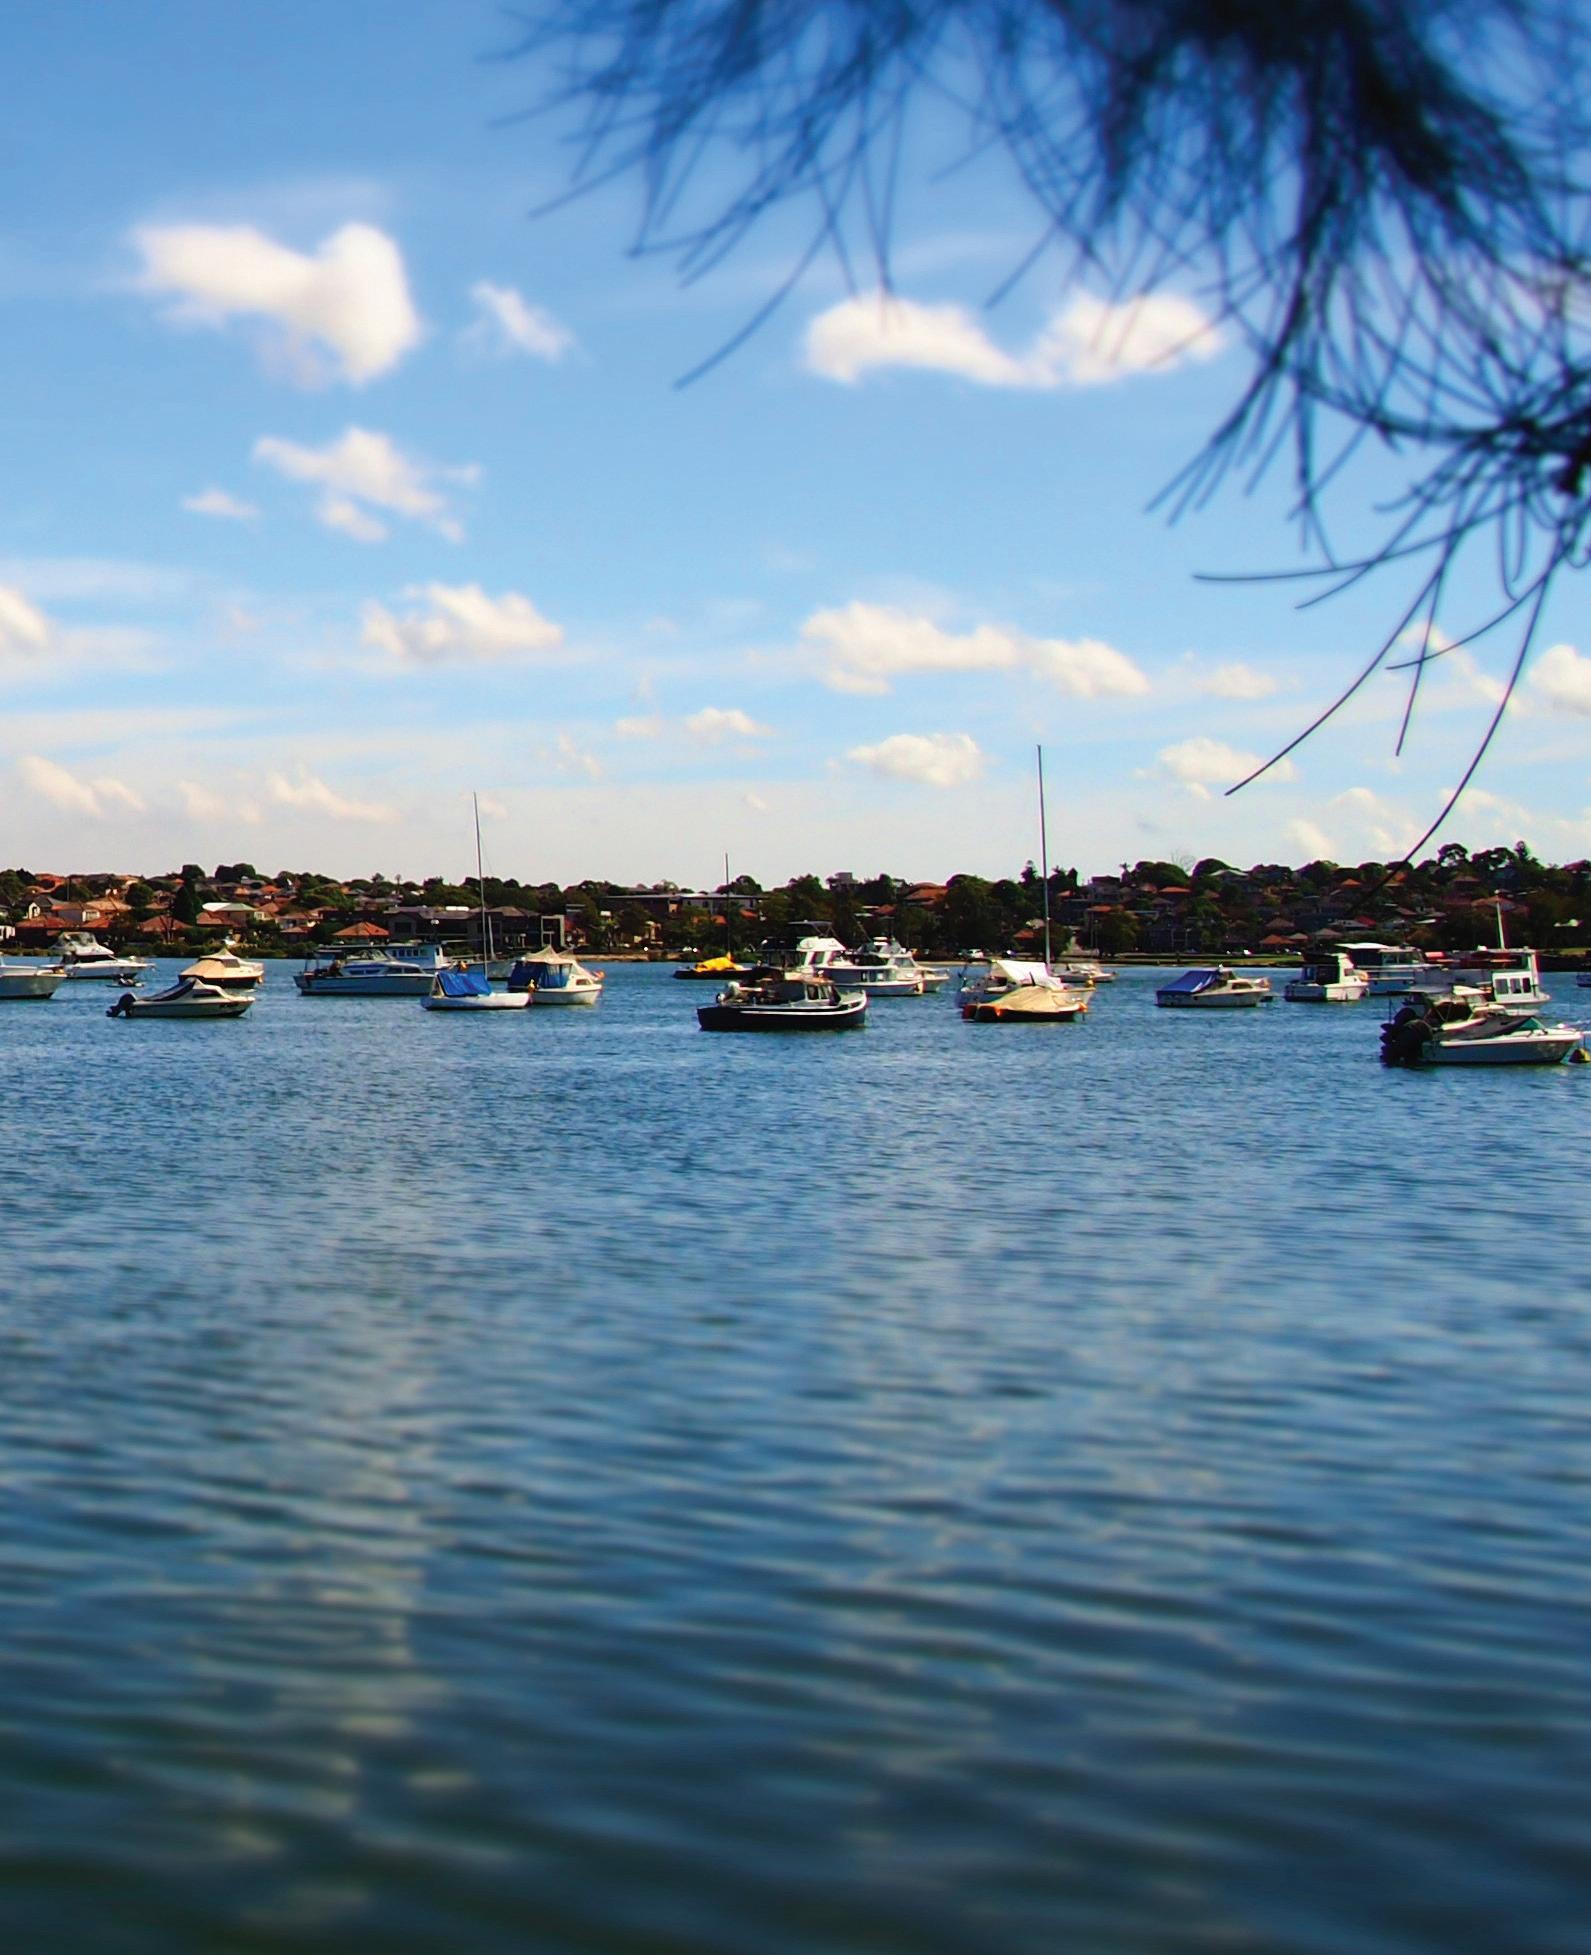
Its French translation means “carefree” and that’s how you’ll feel when you buy in this spot that feels like you’re on vacation every day when you get home from work. Part of the great southern suburbs of Sydney, on the water, and only 12 minutes to the airport on a good run. What more could you want? Trust me, you don’t have to speak French to be thrilled to call this wonderful little suburb home.
Bonnes vacances!
Sydney
One of our proudest heritage suburbs with its mix of Federation homes, leafy streets, and a dash of multi-cultural village vibe. Haberfield has been one of the Inner West’s most tightly held pockets for decades and definitely one to watch. Just minutes to the CBD, families are drawn to the ‘garden suburb’ peppered with traditional Italian eateries and cafes. With so few homes trading hands, demand will always be its strong card.
Remember when you used to head to the Central Coast for the school holidays? Well, it’s now home to the most astute buyers of residential real estate. Some areas have already outpaced most of us, but not this beachside charmer which is still offering great value. Do you swim, surf, fish, bird watch, whale watch? You can do them all from here and still secure your little beachside shack for around a million dollars. And you’re only an hour’s drive from Sydney’s northern suburbs. Can’t be true? Well it is. For a short while anyway until it’s on the radar and prices jump to more sensible levels.

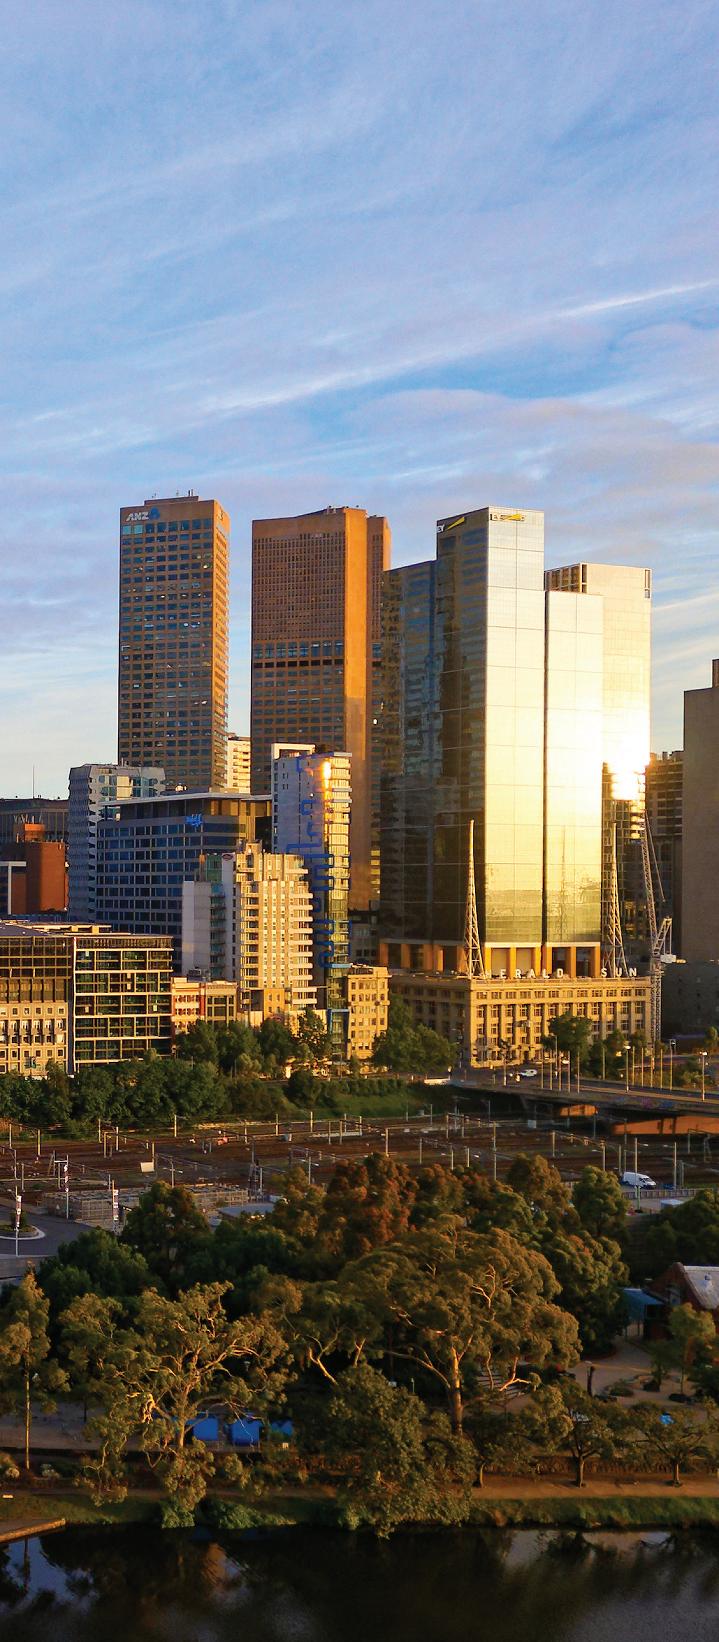
MEDIAN HOUSE PRICE
$956,305
MEDIAN APARTMENT PRICE
$622,939
Source: Cotality, September 2025

First
home buyer activity and recent rate cuts are helping reignite momentum in Melbourne’s property market.
Melbourne’s property market underperformed over the past 12 months, which now makes it Australia’s third most affordable capital city. Investors selling in response to government changes, and an increase in housing stock, put downward pressure on prices. However, there is a silver lining to Melbourne’s property cloud, with plenty of first home buyer activity, big infrastructure investments and recent interest rate cuts reigniting momentum in the Victorian capital.
In FY25, Melbourne was the only Australian capital city to record a fall in median overall dwelling value, down 0.4% to $796,952. This left Melbourne sitting above just two other capitals – Darwin and Hobart – in the median dwelling value stakes. House prices were flat year-on-year at $947,611 while apartments fell 1.3% to $617,395.109 Melbourne’s sub-par median dwelling price performance was shared with regional Victoria, which recorded a 1% increase in FY25 – well below the 5.5% growth across all Australian regional areas.
Several factors help explain the softer market, including land tax changes, tighter rental laws and strong supply.
In 2024, the state’s land tax free threshold was cut from $300,000 to $50,000110, nofault evictions were removed, and stricter minimum rental standards were introduced.111 From 2025, Victoria also applied a new levy of 7.5% on total booking fees for short stay rentals.112
Investors sold off their Victorian properties in response to these mounting costs, shrinking Victoria’s rental market by over 24,000 properties in 2024.113 Active rental bondsindicating the total number of rental homes - fell by 3.6% in Victoria, contrasting with the decade-long 2.6% average annual growth.114 In addition, just 31.2% of Victoria’s home lending in the March quarter 2025 came from investors, lower than 42.9% in NSW and 38.8% in Queensland.115
Meanwhile, the Victorian Government’s focus on boosting housing stock gave buyers more choice and helped take some steam out of the market. Victoria built 61,260 homes in the year to September 2024 – 15,600 more than NSW and 28,500 more than Queensland.116
Irrespective of the winners and losers in Melbourne’s property market, its fundamentals remain strong.
First home buyers were happy to take the place of investors, supported by Victorian government incentives including stamp duty exemptions for new homes up to $600,000 and concessions for homes up to $750,000117. First home buyers made up 23.5% of all property purchases in March 2025, more than any other state.118
Irrespective of the winners and losers in Melbourne’s property market during FY25 its fundamentals remain strong, which bodes well for the future.
Melbourne’s population grew by 142,600 people during FY24, the highest of any capital city.119 This robust population growth, along with a lack of rental stock, kept the rental vacancy rate tight at 1.4% in April 2025 and helped ensure investors could find tenants.120 The Metro Tunnel will be fully open by late 2025 and connect the city’s west and south east. Tunnelling for the Suburban Rail Loop (SRL) starts in 2026, with its first stage supporting over 70,000 new homes over 30 years.121 Another 50 activity centres
are planned around metro train and tram stops, enabling 300,000 extra homes by 2051.122 Major projects include the West Gate Tunnel (opening by the end of 2025) and the North East Link (scheduled for 2028).
Under the National Housing Accord, Victoria is expected to build 306,000 homes by 2029. The state is forecast to reach 98% of its target, outperforming other states.123
Given the above, it’s no surprise there were signs of life in Melbourne’s market towards the end of FY25. In the three months to July 2025, Melbourne’s market lifted by 1.1%.124
With prices recovering, further rate cuts expected and a pipeline of projects supporting growth, the outlook appears solid in the period ahead.
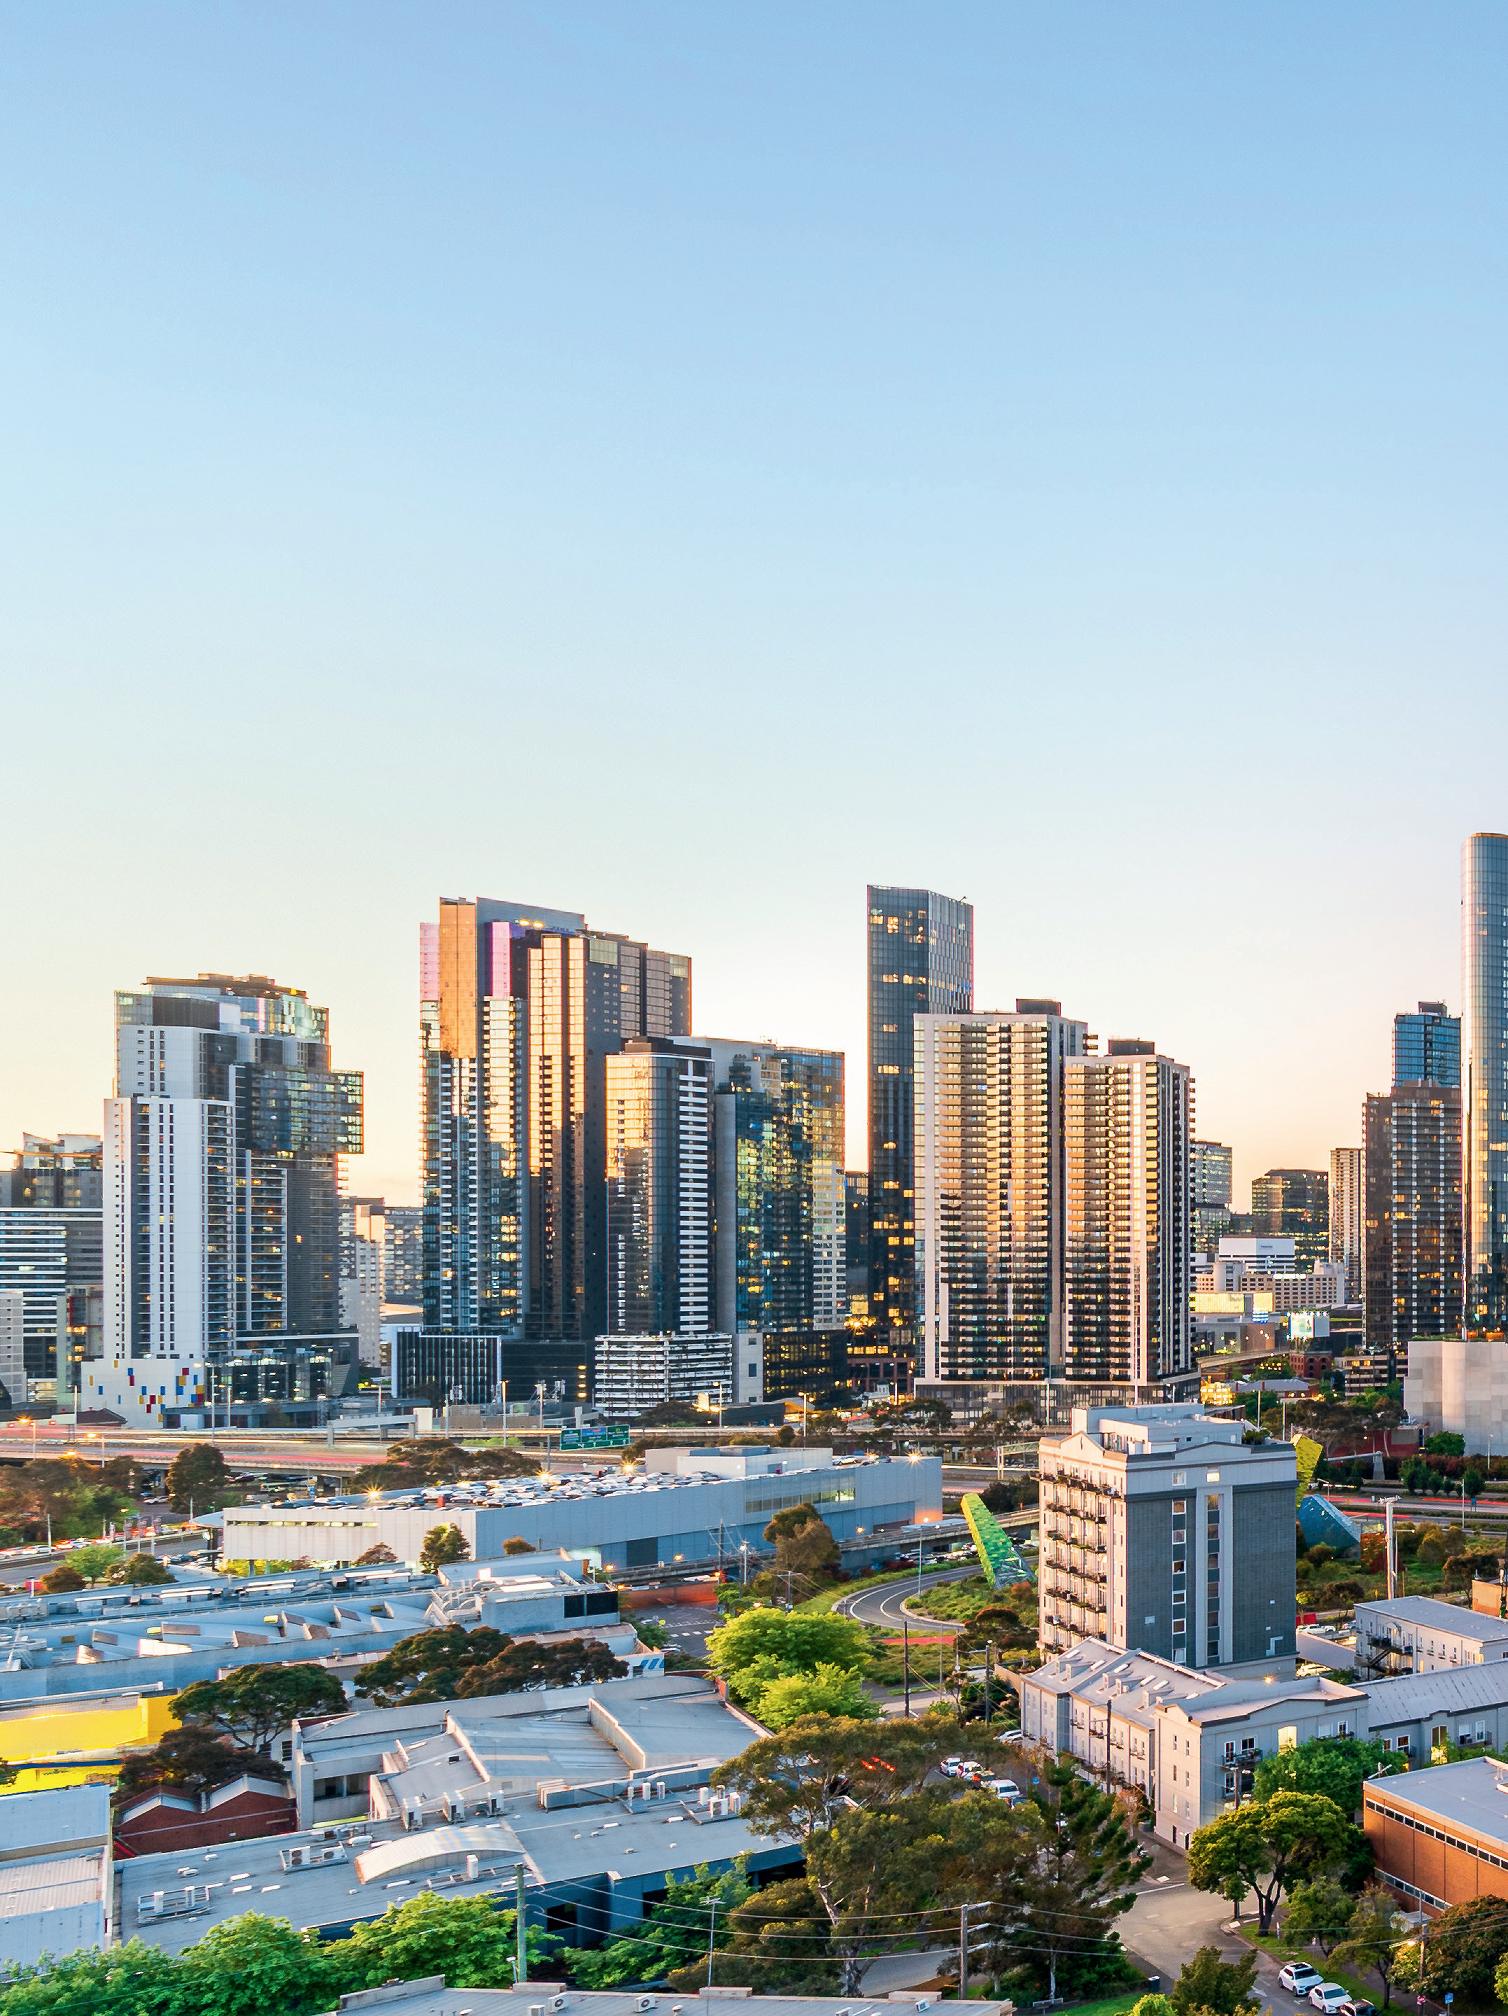
In 2024, Time Out magazine named Northcote’s High Street as the world’s coolest street. This honour confirmed what locals already knew – that Northcote is an urban delight blessed with cosy bars, great restaurants and abundant public and active transport connections. These features, along with a variety of housing options from apartments to Californian bungalows, are making Northcote increasingly attractive to professionals, creatives, families and investors alike.
Situated just to the north-west of the CBD, with a range of housing options including period terraces alongside modern warehouse conversions, West Melbourne has the right fundamentals for growth. The Metro Tunnel, due to open in late 2025, will place a new rail station just north of the suburb boundary and the West Gate Tunnel will take heavy traffic off local streets. With its ideal location alongside the Victoria Market, and within walking distance of the big smoke, expect big things from this small suburb popular with investors, young professionals and couples.

Located just 9km from the Melbourne CBD, and with just under a third of its area set aside as open space, Essendon West is a family-friendly suburb on the rise. Known for its strong community, spacious homes and parkland, top schools and excellent transport links, Essendon West is becoming more popular with those looking for a calm and convenient lifestyle. And the bonus – it’s recorded both strong recent capital growth and its $1.46 million dwelling price sits well below that of neighbouring Essendon.
Melbourne
Around 14km east of the CBD, Box Hill is a cosmopolitan, family-friendly suburb with easy access to schools, parks, shops and a local hospital and TAFE. With a new underground train station to be built by 2035 as part of the Suburban Rail Loop, the suburb is set for a shake-up as it becomes a major housing and transport hub. Expect greater housing demand from students, who will be able to reach Monash University in just 12 minutes.125
It seems it’s still possible to strike it rich in Victoria’s historic Central Goldfields region. This heritage and tourism hotspot provides a laidback country lifestyle and small town charm, along with easy access to the major centre of Maryborough just 7km to the west. And the good news is that the median home is still relatively affordable at $560,000, for those who get in quick.

MEDIAN HOUSE PRICE
$1,040,651
MEDIAN APARTMENT PRICE
$740,992
Source: Cotality, September 2025

Brisbane’s dwelling price has risen by 92.5% over the past decade –the largest increase of any capital city in Australia.
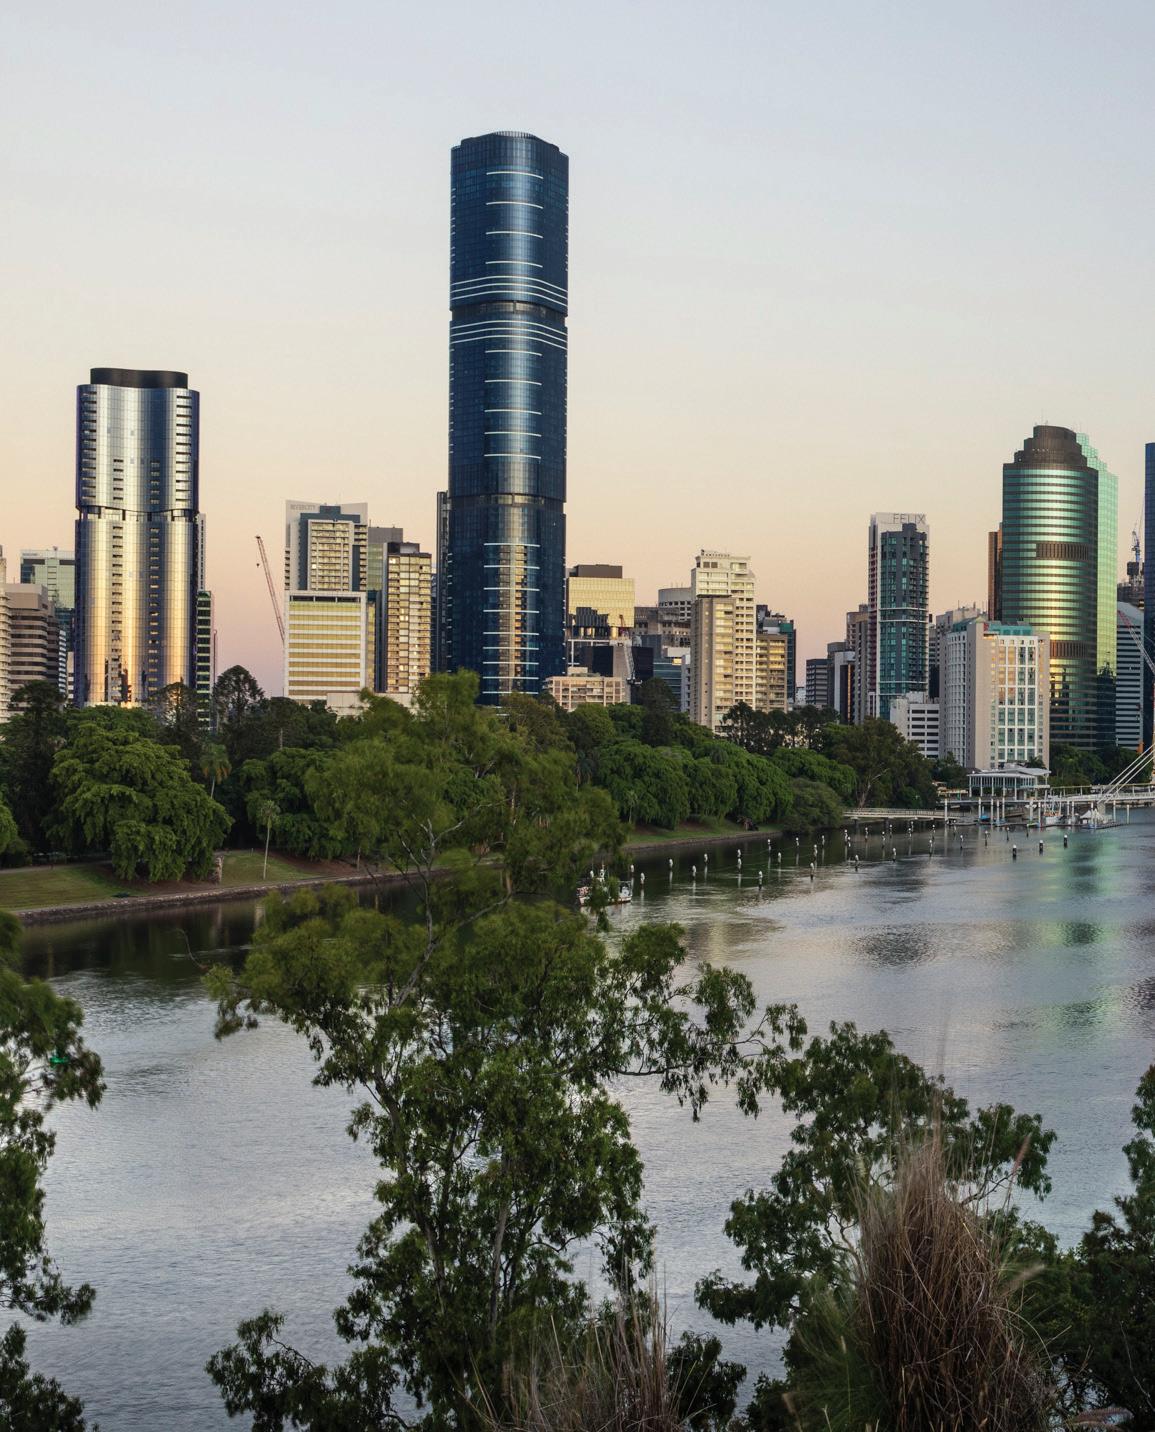
As the host city for the 2032 Olympic Games, Brisbane continues to experience robust housing price growth, driven by a population surge and appealing lifestyle offerings.126
Brisbane’s median dwelling value rose by 7%127 in FY25, with the median house value surpassing $1 million for the first time in May 2025.128 This result is even more impressive when considered alongside the fact that Brisbane’s dwelling price has risen by 92.5%129 over the past decade – the largest of any capital city in Australia.
Brisbane has now cemented its position as Australia’s second most expensive capital city, finishing FY25 ahead of both Canberra and Melbourne, and only one spot behind Sydney.
Interstate migration and overseas arrivals saw Brisbane’s population increase by 2.7% 130 to nearly 2.8 million people in FY24. Chambers Flat-Logan Reserve and Greenbank-North Maclean in Logan City, along with Ripley in Ipswich, were the local areas which experienced the greatest increase in new residents.
Regional Queensland is also experiencing remarkable growth, with Caloundra WestBaringa on the Sunshine Coast recording the highest population increase of any location outside Australia’s capital cities.131 The area is home to Stockland’s Aura development, one of the nation’s largest master-planned communities.
Brisbane is being transformed by a wave of infrastructure investment in the lead-up to the 2032 Olympic and Paralympic Games. Major projects include a new 63,000-seat stadium at Victoria Park, a state-of-the-art aquatic centre at Spring Hill’s Centenary Pool site and the Athletes Village at the Brisbane Showgrounds in Bowen Hills.
Public transport is being boosted through the introduction of the Brisbane Metro bus network, featuring a fleet of electric and bi-articulated (or bendy) buses to link the city centre with surrounding suburbs.132 Meanwhile, services on the Cross River Rail – a 10.2km rail line featuring twin tunnels beneath the Brisbane River and CBD and four new underground stations – are set to commence by 2029.133
Meanwhile, the $235 million Beams Road overpass, due for completion in late 2026, will help reduce congestion during peak traffic time for commuters travelling from the fast-growing northern suburbs.134 The Queensland government’s Hospital Rescue Plan will also see major expansions at health facilities across the city.135
First home buyers remain a vital segment of the market, with strong uptake of the Federal Government’s Home Guarantee Scheme facilitating increased access to home ownership.136 The Queensland Government is extending the $30,000 First Home Owner Grant until June 2026 for those buying properties where the value of the home and land is less than $750,000.137 It is also introducing an innovative Boost to Buy home ownership scheme, which will provide an equity contribution to eligible Queenslanders saving for their first home.
In Regional Queensland, property prices have risen an impressive 94.5% over the past decade.138 The greatest rise in FY25 was in the Darling Downs (West)-Manoa area, where the median dwelling value rose 21.2% to $352,963. It was followed by Mackay, which rose by 18.3% to $607,019, and Central Queensland, where values increased by 18% to $336,104.139
Brisbane rental prices rose by 3.4% for houses and 5.1% for apartments in FY25. Despite this impressive increase, dwelling values are climbing at an even faster rate (6.3% for houses and 10.9% for apartments over FY25) which is placing downward pressure on gross rental yields.140
Brisbane is being transformed by a wave of infrastructure investment in the lead-up to the 2032 Olympic and Paralympic Games.
The Darling Downs gateway area is emerging as a strategic property hotspot, underpinned by infrastructure growth, affordability and lifestyle appeal.
Positioned west of Brisbane, and incorporating urban areas such as Toowoomba, Gatton and Laidley, this area is already home to the Toowoomba Wellcamp Airport and is also anticipated to benefit from the Melbourne to Brisbane Inland Rail.
This freight superhighway is still in the planning stages but, when approved, is expected to bring hundreds of construction jobs to the area.
Buyers are drawn to the area’s mix of rural charm and urban convenience, with strong yields and capital growth potential. Family friendly communities, quality schools, and a rising food and agri-tech sector reinforce long term value.

Brisbane
With its vibrant village atmosphere, excellent connectivity and close to the Brisbane CBD, Coorparoo continues to show strong potential for capital growth. A blend of classic charm and modern sophistication, its mix of character-filled Queenslanders and sleek architectural homes attracts both families and professionals.
The area is well supported by quality schools and a buzzing café scene, all set against leafy, tree lined streets. Commuters benefit from direct access to major motorways, making travel north or south seamless.
Brisbane
Located in Brisbane’s highly sought-after Moreton Bay region, Redcliffe offers strong investment potential driven by its coastal lifestyle appeal, ongoing infrastructure upgrades, and proximity to Brisbane CBD. Buyers are drawn to its coastal lifestyle, upgraded infrastructure and affordability relative to inner-city suburbs, driving sustained demand and capital growth.141
This exclusive locale near Mermaid Waters offers premium lakeside living with strong capital growth potential, proximity to elite schools, golf courses and beaches. Tightly held with expansive homes and a FY25 median dwelling value of $1.87 million, Clear Island Waters attracts high income families seeking lifestyle, privacy and long term investment security.

Sunshine Coast
Known for its natural beauty, and unspoilt pristine beaches and café culture, it’s no wonder Peregian Beach continues to attract strong interest from families and lifestyle lovers. These buyers are drawn to the suburb’s laid back coastal character and tight knit community. Less than half an hour’s drive from Noosa with minimal new development, Peregian Beach is well positioned for long term capital growth.
North Queensland
Known as the sugar capital of Australia, Mackay delivers a relaxed coastal lifestyle backed by a robust economy driven by mining, agriculture and tourism. When you add the $9 billion Bruce Highway upgrade and a major project to revitalise Mackay’s waterfront, it’s easy to see why there is increased demand for property in the region. A modern regional city with a strong sense of community, Mackay boasts a buzzing arts and culture scene, pristine beaches and world class recreational fishing, making it increasingly attractive to both home buyers and investors.


MEDIAN HOUSE PRICE
$724,097
MEDIAN APARTMENT PRICE
$551,149
Source: Cotality, September 2025

Confidence is gradually returning to the broader Tasmanian economy, helped by a strong tourism rebound.
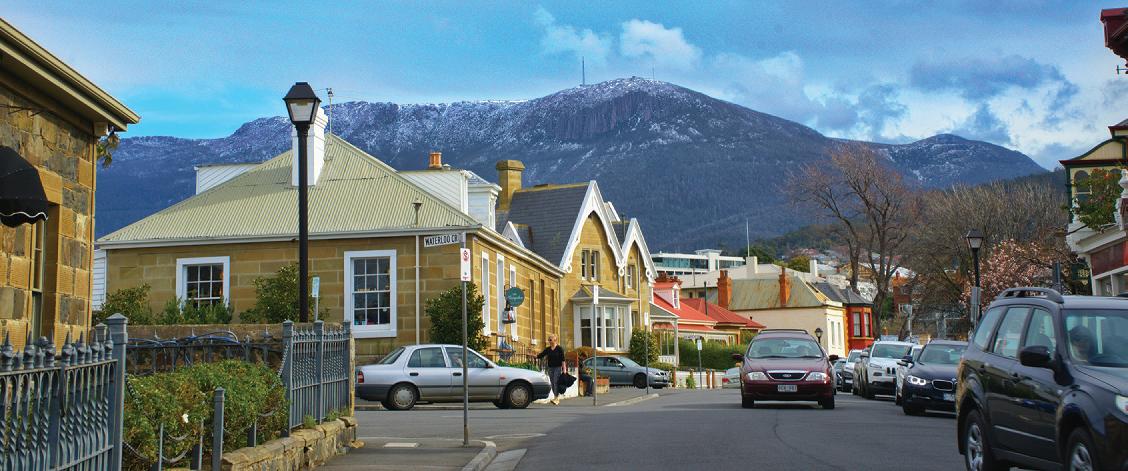
Hobart is a capital city with a distinctly relaxed rhythm, offering metropolitan convenience and lifestyle in equal measure. Interestingly, those same contrasts – city scale and country charm – are now being reflected in the housing market.
Hobart finished the FY25 with a median dwelling price of $677,390, which was below the combined Australian regional area FY25 figure of $685,193142
This came about after Hobart recorded a 0.2% fall in median dwelling value in June 2025 – the only capital city to do so.143 Meanwhile, Hobart’s FY25 annual growth of 2.0% was well below the nationwide average of 3.4%.144
The weaker performance could be the result of ongoing housing affordability challenges in Australia’s southern state. On average, Tasmanian buyers spend more than 40% of household income on mortgage repayments, ahead of Western Australia, the Australian Capital Territory and the Northern Territory.145
However, there are reasons to be optimistic about Tasmania’s future.
Confidence is gradually returning to the broader Tasmanian economy, helped by a strong tourism rebound, including a record number of summer visitors146, and steady public sector investment. The state continues to punch above its weight on key economic indicators such as employment, business investment, and housing construction activity.147
With dwelling values already low by national standards, there’s a window of opportunity for Hobart buyers.
Major infrastructure continues to help shape the city with the June 2025 completion of the $786 million Bridgewater Bridge148 and the $200 million airport terminal expansion149 supporting the state’s growth. The proposed Macquarie Point stadium remains divisive, offering potential economic uplift, but likely to add further strain to a construction sector already facing rising costs and limited labour.
Buyers based in mainland Australia are sensing opportunity, accounting for 46.5% of all investor purchasers in Tasmania in the three months to March 2025, compared to a 31.8% purchase rate over the past two years. 150 151
With population growth stagnant152 and annual building approvals down more than 13%153, Tasmania’s housing market has entered a more subdued phase. But with dwelling values already low by national standards154, this is creating a window of opportunity for buyers, and for those willing to act, the fundamentals remain in their favour.

Launceston continues to attract a broad mix of buyers drawn by lifestyle, accessibility and real value. In the three months to March 2025, the median house price for Northern Tasmania held steady at $560,000155, offering a more affordable alternative to Hobart.
Mainland investor interest remains elevated, with interstate buyers accounting for more than half of all investment activity in Northern Tasmania.156
Significant upgrades to the University of Tasmania (UTAS) Stadium, campus and Albert Hall are reshaping the city centre, boosting employment and creating renewed energy in surrounding suburbs.157


Devonport’s transformation continues to gather pace, underpinned by major investments across infrastructure, tourism and city renewal. The $240 million upgrade of the city’s port is well underway158, while Devonport’s council has allocated an additional $36 million towards capital works in FY26.
Sales volumes fell 4.8% in the year to June 2025, yet the median house price strengthened by 2.1% to $495,000159 as owner-occupiers competed with increasing buying activity from savvy mainland investors.160
Devonport remains one of the state’s most accessible markets – both physically due to the Spirit of Tasmania and local airport, and financially with a lower entry price point than other regional centres. It also stands out as one of Tasmania’s stronger-performing investment markets.161


Hobart
Despite its heritage charm and waterfront lifestyle, this prestigious suburb is now trading at a discount. Over the year to June 2025, Battery Point’s median house price fell 1.4% to $1.38 million amid a rising number of homes coming onto the market.162 Opportunity abounds in this iconic locality just footsteps from Salamanca Market and Hobart CBD.
Hobart
With the $47 million Hobart Airport Interchange complete and the $187 million causeway duplication progressing, Midway Point is becoming one of Hobart’s most connected suburbs. What’s more, a relatively affordable $615,000163 median dwelling price means Midway Point offers strong growth prospects as infrastructure catches up with demand.
Here you’ll find exceptional value for those seeking period homes, hillside views and direct access to Cataract Gorge. The suburb has a similar character to East Launceston, yet its $630,000 median home price is $270,000 cheaper than its more highprofile neighbour. Only 2km from the CBD, West Launceston is becoming increasingly popular among buyers wanting a premium lifestyle without the premium price tag.

Miandetta’s prospects are set to rise due to its proximity to the newly approved $50 million Stony Rise Village. This development, when completed by Christmas 2026, will have retail, medical and dining facilities. That’s not the only thing to like – the Mersey River suburb is also just a quick 3km commute to Devonport’s CBD and bustling waterfront.
With a median rental yield of 5.4% and median home prices up 94.9% in five years164, Acton is emerging as a standout in Tasmania’s property market. Just 3km from Burnie’s city centre and busy port, the suburb is drawing investor interest amid strong rental demand fuelled by infrastructure upgrades and clean energy investment. And the clincher? A median house price of just $385,000.165
Trend 01 | Pressure To Power: The Sandwich Shift
1. The Generations Defined, McCrindle, (2023)
2. Seven key charts on the state of the Australian property market, AMP Research, (July 22, 2025)
3. Dwelling Prices and Household Income, Reserve Bank of Australia, (2012)
4. The Great Divide: Australia’s Housing Mess and How to Fix It, Quarterly Essay 92, (November 2023)
5. Gen X overtake Boomers for housing and shares, KPMG, (January 3, 2025)
6. Young People Living With Parents, Australian Institute of Family Studies, (June 2023)
7. Deaths in Australia, Australian Institute of Health and Welfare, (April 9, 2025 )
8. Comprehensive Guide, Granny Flat Solutions, (January 30, 2024)
9. Granny flats and capital gains tax: your questions answered, Downsizing. com.au, (July 7, 2021 )
10. Low to Mid-Rise Housing Policy, NSW Department of Planning, Housing and Infrastructure
11. Townhouse and Low-Rise Code, Victorian Department of Transport and Planning
12. The Profile of Australia’s Hybrid Worker, McCrindle
13. Gen X overtake Boomers for housing and shares, KPMG, (January 3, 2025 )
14. Mortgage stress and precarious home ownership: implications for older Australians, Australian Housing and Urban Research Institute, (August 27, 2019)
15. Why the $5.4 trillion wealth transfer is a generational tragedy, FirstLinks, (March 12, 2025)
16. Downsizer super contributions, Australian Tax Office
17. Downsizing among older Australians, Australian Housing and Urban Research Institute, (January 7, 2014)
18. 2023 Intergenerational Report: Australia’s future to 2063, Australian Government, (August 24, 2023)
19. “Back in my day” – comparing Millennials with earlier generations, Australian Bureau of Statistics, (October 20, 2022 )
20. The Global Wellness Economy: Australia, Global Wellness Institute, (August 14, 2025)
21. No shortcuts: Mauricio Umansky’s formula for success in real estate, Real Estate Business, (May 30, 2025)
22. Relocating for retirement: Australia’s top retirement destinations, Citro
Trend 02 | Lifestyle Locations: Walkable, Liveable, Lovable
23. Muval Index: the great Australian dream 2024, Muval, (October 28, 2024) (page 12)
24. Report Shows Australians are Choosing Lifestyle over Life Stress, Muval, (October 28, 2024)
25. Housing is becoming a pipe dream for young Australians, The Centre for Independent Studies, (February 6, 2024)
26. Cost and feasibility estimates for supplying new residential dwellings in New South Wales, NSW Productivity and Equality Commission, (August 16, 2024)
27. 20-minute neighbourhoods, Victorian Department of Transport and Planning
28. Thriving Suburbs Program fact sheet, Federal Department of Infrastructure, Transport, Regional Development, Communications, Sport and the Arts
29. Thriving Suburbs Program projects as at 4 December 2024, Federal Department of Infrastructure, Transport, Regional Development, Communication and the Arts
30. Backing local businesses to bring their streets to life, NSW Government, (May 18, 2025)
31. YCK, Australia’s first Purple Flag district, YCK Laneways
32. SRL East precinct planning, Victorian Government
33. Measuring the impact of heavy rail transport infrastructure on house prices in Melbourne, Australia: a case study of Mernda rail extension project, RMIT, (June 10, 2022)
34. SRL East Structure Planning Engagement Report, Victorian Suburban Rail Loop Authority, (July 4, 2025)
35. Is property close to the Sydney Metro worth more money? The data says yes, Domain Insight, (December 3, 2024)
36. Sydney Lord Mayor Clover Moore, Facebook post, (July 25, 2024)
37. Special Entertainment Precincts, NSW Department of Housing, Planning and Infrastructure
38. Engagement outcomes report Enmore Road special entertainment precinct, Inner West Council, (2023)
39. Entertainment Precincts signal a cultural transformation, APRA AMCOS, (December 12, 2024)
40. A Glimpse into the Future of Regional Australia, Regional Australia Institute, (June 2025)
41. Understanding what attracts new residents to smaller cities, Australian Housing and Urban Research Institute, (March 2022)
42. Regional Movers Index, March 2025 Quarter Report, Regional Australia Institute, Commonwealth Bank, (May 28, 2025)
43. Nyaal Banyul Geelong Convention and Event Centre, Development Victoria
44. Barwon Women’s and Children’s, Victorian Health Building Authority
45. Cat’s out of the bag: Greater Geelong tops regional migration ladder, Commbank, (May 28, 2025)
46. Data supplied for the McGrath Report by Cotality
47. Pet ownership and human health: a brief review of evidence and issues, BMJ journal, (November 24, 2005)
48. Pets in Australia: A national survey of pets and people, Animal Medicines Australia, (2022)
49. Landlords who allow pets could boost their rental return by up to 30 per cent, Domain.com.au, (May 7, 2019)
50. Property Pet Tax: Sydney Renters being charged with 25% more rent, news release from Budget Pet Products, (June, 2025)
51. Pet Projects: Houzz Study Finds Pets are a Priority During Home Renovations, Houzz, (August 26, 2024)
52. Is the Dog Room the New Luxury Must-Have?, Elle Décor, (June 7, 2025)
Trend 03 | Weathering The Future: The Power Of Smart Design
53. Why Australian homes are getting smaller, Housing Industry Association, (February 18, 2025)
54. Modular construction in Australia market size and share analysis - growth trends & forecasts (2025-2030), Mordor Intelligence
55. CBA backs prefabricated construction industry to boost housing supply, Commonwealth Bank of Australia, (January 31, 2025)
56. CBA backs prefabricated construction industry to boost housing supply, Commonwealth Bank of Australia, (January 31, 2025)
57. Delivering the National Housing Accord, Australian Treasury, (October 22, 2025)
58. Building homes with reused materials to reduce construction waste, Australian Broadcasting Corporation, (September 6, 2024)
59. Materials and Embodied Carbon Leaders Alliance website
60. Rooftop solar and storage biannual report July-December 2024, Clean Energy Council, (March 17, 2025)
61. Solar home batteries eligible under the SRES, Australian Government Clean Energy Regulator, (1 July 2025)
62. Clean Energy Council releases Clean Energy Australia 2024 report, Clean Energy Council, (March 12, 2024)
63. Rebates, grants and schemes. NSW Government and Victorian energy upgrades, Victorian Government,
64. Green Loans Australia & NZ, Clean Energy Finance Corporation, (October 13, 2020)
65. Housing Energy Upgrades Fund, Clean Energy Finance Corporation
66. Millions of Australians plant a seed for a healthy life and a healthy planet, The Australia Institute, (November 26, 2024)
67. Rainwater Harvesting Australia website
68. Climate change & real estate investment: How risk impacts property value, Climate X
69. Migration as a potential heat stress adaptation strategy in Australia, Charles Darwin University, (January 1, 2020)
70. At our front door: Escalating climate risks for Aussie Homes, Climate Council, (2025)
71. NCC 2022 adopted, National Construction Code, Australian Building Codes Board, (May 1, 2023)
City Spotlights - Sydney & Surrounds
72. Home Value Index, June Results, Cotality, (July 1, 2025)
73. Monthly Housing Chart Pack, Cotality, (June 11, 2025)
74. Mapping the Market, 12 month value change, houses and apartments, Cotality, (July 2025)
75. Regional Movers Index, March 2025 Quarter, Regional Australia Institute and Commonwealth Bank, (May 23, 2025)
76. Metro to regional movers multiply, with millennials leading the march, Media Release, Regional Australia Institute, (May 31, 2024)
77. FY24 Cash Purchases Report, PEXA Group, (November 19, 2024)
78. Total change in house and unit prices, NSW SA4 regions, 10 years to Oct 2024, PropTrack, (January 2025)
79. Home Guarantee Scheme Trends & Insights Report 2023–24, Housing Australia, (September 9, 2024)
80. NAB Quarterly Australian Residential Property Survey Q1 2025, National Australia Bank, (May 9, 2025)
81. Weekly Rents, 12 months to July 4, 2025, SQM Research, (July 2025)
82. Accelerated precincts, Transport Oriented Development, NSW Department of Planning, Housing and Infrastructure, (July 2025)
83. Low and Mid-Rise Housing Policy, NSW Department of Planning, Housing and Infrastructure, (July 2025)
84. Twelve Rose Bay neighbours combine their properties to sell for colossal $165 million, domain.com.au, (May 29, 2025)
85. Love your neighbour: The Sydney homeowners selling together for $165m, smh.com.au, (July 1, 2025)
86. Record Breaking Quarter for Sydney’s Prestige Residential Market, Dyson Austen Valuers, LinkedIn, (2025)
87. Top 20 sales: Sydney king of the mansions as $1.1bn in homes sell, realestate. com.au, (June 29, 2025)
88. Sydney Metro, Australia’s biggest public transport project, NSW Government, (2025)
89. Sydney Metro City to open on Monday 19 August, NSW Government, (August 16, 2024)
90. Update on Sydney Metro’s Southwest conversion, Sydney Metro, NSW Government, (March 5, 2025)
91. Prices get moving with the Metro, The Australian, (June 28-29, 2025)
92. M12 Motorway, NSW Government, (June 24, 2025)
93. Sydney Metro Annual Report, 2023-24, NSW Government, (November 27, 2024)
94. New era of public transport in Parramatta, NSW Government, (December 20, 2024)
95. Parramatta Light Rail Stage 2, NSW Government, (2025)
96. What does $1 million now buy in Australia’s housing market?, Cotality, (May 16, 2025)
City Spotlights - Canberra
97. Home Value Index, June Results, Cotality, (July 1, 2025)
98. Monthly Housing Chart Pack, Cotality, (June 2025)
99. Month in Review, December 2024, Herron Todd White, (January 2025)
100.Month in Review, April 2025, Herron Todd White, (May 2025)
101. Housing Supply and Land Release Program 2025-26 to 2029-30, ACT Government, (2025)
102. ACT Light Rail Stage 2A – City to Commonwealth Park, Australia New Zealand Infrastructure Pipeline website, (2025)
103. Supporting more ‘missing middle’ homes in Canberra’s suburbs, Media Release, ACT Government, (May 5, 2025)
104.Month in Review, October 2024, Herron Todd White, (November 2024)
105. Home buyer concession scheme, ACT Revenue Office website, (2025)
106.Home Value Index, June Results, Cotality, (July 1, 2025)
107. Monthly Housing Chart Pack, Cotality, (June 2025)
108. Home Value Index, June Results, Cotality, (July 1, 2025)
City Spotlights - Melbourne & Surrounds
109. Home Value Index, June Results, Cotality, (July 1, 2025 )
110. Parliamentary Budget Office, Melbourne, (May 20, 2025)
111. Crackdown on excessive rent increases and dodgy rentals, Victorian State Government Media Release, (November 27, 2024)
112. Short Stay Levy, State Revenue Office Victoria, publication updated May 8 2025
113. Tables from Rental Report - December Quarter 2024, Victorian Government, (2024)
114. Homes Victoria Rental Report December Quarter 2024, Victorian Government, 2024, page 4
115. Data provided by Cotality to McGrath Research: Quarterly value of housing finance and proportions in Victoria and nationally, Cotality, (March 2025)
116. Thousands of Homes Ahead of Every Other State, Media Release, Premier of Victoria Jacinta Allan, (January 22, 2025)
117. Buying a property, State Revenue Office Victoria, update published, June 2025
118. Data provided by Cotality to McGrath Research: Quarterly value of housing finance and proportions in Victoria and nationally, Cotality, (March 2025)
119. Regional population 2023-24, Australian Bureau of Statistics, (March 2025)
120. Quarterly Rental Review, Cotality, published April 2025
121. Victorian Budget 2025/26 Overview, Victorian government, (May 2025)
122. Victorian Budget 2025/26 Overview, Victorian government, (May 2025)
123. State of the Housing System 2025, Australian Government National Housing Supply and Affordability Council, (2025)
124. Home Value Index, June Results, Cotality, (July 1, 2025)
Top Picks - Melbourne & Surrounds
125. Victoria’s Big Build, Victorian Government, updated August 14, 2025
City Spotlights - Brisbane & Surrounds
126. Regional population, Australian Bureau of Statistics, (March 27, 2025)
127. Home Value Index, June Results, Cotality, (July 1, 2025)
128. Brisbane is now a million-dollar house market: here’s how it happened, Cotality, (July 14, 2025)
129. Home Value Index, June Results, Cotality, (July 1, 2025)
130. Regional Population, Australian Bureau of Statistics, (March 27, 2025)
131. Regional Population, Australian Bureau of Statistics, (March 27, 2025)
132. Brisbane Metro, Brisbane City Council
133. Project Overview, Cross River Rail
134. Construction underway on Beams Rd level crossing, Ministers for Infrastructure, Transport, Regional Development, Communications, Sport and the Arts, (March 4, 2024)
135. A fresh start for Brisbane and the Redlands in 2025-26 Budget, Queensland Government, (June 24, 2025)
136. Home Guarantee Scheme Trends and Insights Report 2023-24, Housing Australia
137. Extending the $30,000 First Home Owner Grant, Queensland Government, (June 23, 2025)
138. Home Value Index, June Results, Cotality, (July 1, 2025)
139. Home Value Index, June Results, Cotality, (July 1, 2025)
140. Home Value Index, June Results, Cotality, (July 1, 2025)
Top Picks - Brisbane & Surrounds
141. Home Value Index, June Results, Cotality, (July 1, 2025)
City Spotlights - Hobart & Surrounds
142. Monthly Housing Chart Pack, Cotality, (July 2025)
143. Monthly Housing Chart Pack, Cotality, (July 2025)
144. Monthly Housing Chart Pack, Cotality, (July 2025)
145. Housing Affordability Report March Quarter, Real Estate Institute of Australia, (June 6, 2025)
146. Record-Breaking Numbers Enjoyed Tasmania’s Unique Summer Offerings, Premier of Tasmania, (April 16, 2025)
147. State of the States – April 2025, CommSec, (April 2025)
148. New Bridgewater Bridge Reaches Home Stretch, Premier of Tasmania, (February 27, 2025)
149. Terminal Expansion Project, Hobart Airport, updated July 2025
150. March 2025 Quarterly Report, Real Estate Institute of Tasmania, (June 1, 2025)
151. Home Value Index, June Results, Cotality, (July 1, 2025)
152. National, State and Territory Population, December 2024, Australian Bureau of Statistics, (June 19, 2025)
153. Building Approvals, Australia, Department of Treasury and Finance, (July 2, 2025)
154. Home Value Index, June Results, Cotality, (July 1, 2025)
City Spotlights - Launceston & Devonport
155. Northern Tasmania Regional Market Update, March Quarter 2025, Real Estate Institute of Tasmania, (June 1, 2025)
156. Northern Tasmania Regional Market Update, March Quarter 2025, Real Estate Institute of Tasmania, (June 1, 2025)
157. City of Launceston Economic Development Strategy 2022–2026, City of Launceston, (2022)
158. QuayLink Project Responsibilities, TasPorts, (October 18, 2024)
159. Market Trends, 12 months to June 2025, Cotality, (September 10, 2025)
160. North West Tasmania Regional Market Update, June Quarter 2025, Real Estate Institute of Tasmania, (September 4, 2025)
161. North West Tasmania Regional Market Update, March Quarter 2025, Real Estate Institute of Tasmania, (June 1, 2025)
Top Picks - Hobart & Surrounds
162. Market Trends, 12 months to June 2025, Cotality, (September 10, 2025)
163. Market Trends, 12 months to June 2025, Cotality, (September 10, 2025)
164. Market Trends, 12 months to June 2025, Cotality, (September 10, 2025)
165. Market Trends, 12 months to June 2025, Cotality, (September 10, 2025)
© McGrath Limited 2025 Disclaimer: This report is published for general information only and not to be relied upon in any way. Although high standards have been used in the preparation of the information, analysis, views and projections presented in this report, no responsibility or liability whatsoever can be accepted by McGrath Limited for any loss or damage resultant from any use of, reliance on or reference to the contents of this document. As a general report, this material does not necessarily represent the view of McGrath Limited in relation to particular properties or projects. Reproduction of this report in whole or in part is not allowed without prior written approval of McGrath Limited. McGrath trademarks are property of McGrath Limited.