
School
EmpowerK12
June 10, 2020


EmpowerK12
June 10, 2020
On March 26th, Governor Kemp ordered all schools closed in Georgia as a result of the COVID-19 pandemic. To estimate the influence of extended time off outside the traditional school schedule, redefinED atlanta and Learn4Life commissioned EmpowerK12 to review relevant research and analyze metro Atlanta data to identify the student achievement impact of these cancellations.
In 2019-20, metro Atlanta students lost nine weeks of regular instruction due to the COVID-mandated quick transition to distance learning in mid-March. Based on local and national data, if students had taken Milestone assessments in spring 2020, the percentage of students demonstrating proficiency would be expected to drop 3.6 points in English language arts and 4.9 points in math as compared to last year. Based on regional student enrollment of 594,000 in 2018-19, today, about 21,000 fewer students in ELA and 29,000 fewer in math are now on track for grade-level proficiency than prior to COVID-19. Two specific proficiency measures tracked by Learn4Life, 3rd grade reading and 8th grade math, show an expected decline of 3.5% and 4.8% respectively
About this study’s research partners
EmpowerK12
EmpowerK12 is a DC-based nonprofit with the mission to empower education leaders, including principals, support organizations, and policymakers, with the right information, relevant skills, and proper systems needed to continuously improve educational institutions. We are a leader in accountability, education data analytics, and impactful research.
redefinED atlanta
redefinED atlanta was founded in 2016 with the vision to transform Atlanta into a place where every student in every community receives a high-quality public education. redefinED has the ability to leverage private philanthropy and become a catalyst for change in Atlanta by playing three key roles: raising and aligning funds, investing strategically, and building coherence.
Learn4Life
Learn4Life (L4L), composed of leaders from school districts, businesses, and nonprofits, is the metro Atlanta regional education partnership. L4L was founded in 2016 by the Atlanta Regional Commission, Community Foundation for Greater Atlanta, Metro Atlanta Chamber, and the United Way of Greater Atlanta to identify best practices at key education milestones and scale those proven solutions throughout the region
The last regular day of in-person schooling in Atlanta occurred on March 13th. Starting the week of March 23rd, schools embarked on an unprecedented distance learning regimen through the end of the 19-20 school year. While there is hope distance learning has been successful for all students, it is prudent for school leaders and policymakers to prepare as though distance learning will not generate similar academic outcomes as in-person education.
To estimate the influence of extended time off outside the traditional school schedule, we reviewed relevant research and analyzed Georgia data to triangulate possible future student achievement outcomes due to school day cancellations related to COVID-19. First, we reviewed the existing evidence on (a) summer learning loss and (b) learning loss associated with natural disasters such as Hurricane Harvey and Hurricane Katrina. Then, we compared the similarities of those outcomes with metro Atlanta data points, including how schoolwide student attendance impacts growth and achievement on the Georgia Milestone assessments.
As of March 29th, nearly every US jurisdiction ordered or recommended the cancellation of the remaining academic year, lengthening the traditional, 10-week summer break by an additional two and a half months. While some students receive instruction through camps, summer classes, and family activities during a typical summer break, the rigor and connection to the school curriculum often lack confluence, which leads to academic regression when school is out. Many schools across the nation adopted distance learning initiatives of varying degrees to mitigate COVID-19 closures. Literature on large-scale distance learning is limited, leaving summer learning loss as one of the best ways to assess possible achievement impact.
The traditional summer break is essentially a relinquishment of approximately 45 additional instructional days for students during the summer months, June through August, or roughly 25% of the typical 180 instructional days in the school year. Researchers found that students who took the NWEA Measures of Academic Progress (MAP) assessment in the spring and again the following fall at the start of a new school year earned fall scores that were, on average, 25% lower in the fall than the spring for math and 13% lower in reading (Thum & Kuhfeld, 2020). This means that over the summer months, students in elementary or middle school grades lost nearly one-fifth of the skillsets they learned the prior school year.
The line charts on the following page show the national average scale score on the NWEA MAP in the fall and spring across grade levels.
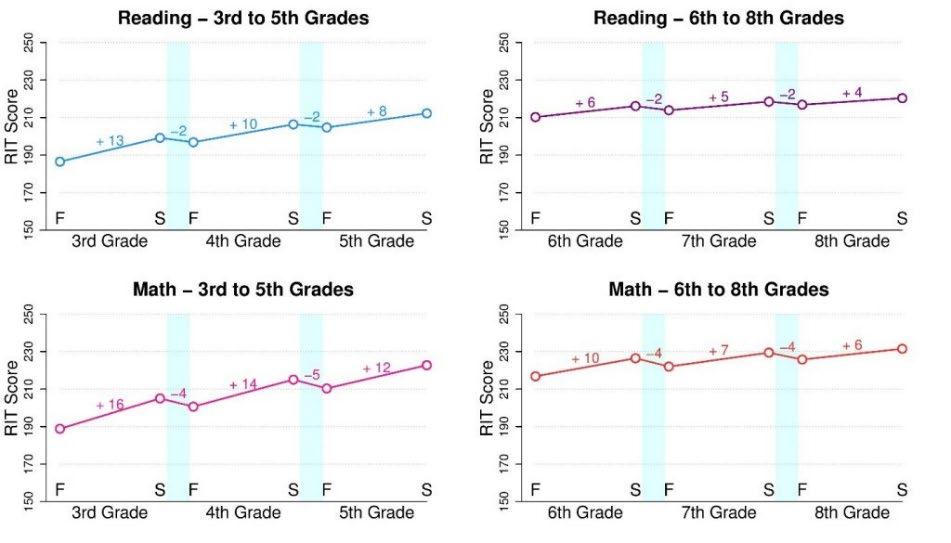
“F” represents average fall score and “S” the average spring score
Nationally, there is evidence of differential summer learning loss across student groups.
Atteberry and McEaching (2016) used NWEA MAP scores to look at learning trajectories. In general, students grew during the school year and then regressed over the summer with differential summer regression accounting for about 35% of the racial achievement gap.
Cooper et al. (1996) reviewed 39 studies pertaining to summer vacation and student achievement and performed a meta-analysis on 13 of the most recent studies. The results of the meta-analysis indicated that typical “summer loss was equivalent to about one month on a grade-equivalent scale” or “about one-tenth of a standard deviation relative to spring test scores” (p. 259). Achievement losses were greater in math and greater for economically disadvantaged students.
Rambo (2015) looked at differences in reading loss over the summer between higher and lowerachieving students and found that “average students grew steeply during the school year and gained nothing over the summer. By contrast, initially high-achieving students grew more slowly than average students during school but maintained that same slower growth rate in the summer” (p. 112).
What can we learn from the impact of hurricanes Katrina and Harvey?
Hurricane Katrina and Hurricane Harvey both generated mass flooding that led to substantial delays in the start of the school year in affected areas. For Katrina, residents in New Orleans and Mississippi were affected by displacement and school delays. A 2008 Ward et al. study examined the outcomes of displaced Mississippi students who missed an additional 8% of the 2005-06 school year and found that displaced students had lower math and reading scores that were on average 13% of one standard deviation lower than Mississippi students who were not displaced. Displaced students were also more likely to have behavioral issues and drop out of school.
In 2017, flooding from Hurricane Harvey lead to 3-5 week delays in the start of the school year across many Texas gulf coast districts, including the city of Houston. Students in affected districts attended 8.3% fewer school days that year. When compared to non-affected districts with similar demographics and prior achievement levels, students at affected school districts demonstrated 2018 scale score gains that were 7.8% lower in reading and 21.6% lower in math, according to an EmpowerK12 analysis
What are other early COVID-19 studies saying about possible achievement loss this academic year and the future?
Kuhfield and Tarasawa (2020) utilized a robust dataset from the NWEA MAP to extend previous summer learning loss research and adjust for additional slide due to COVID-19 school closures. According to the study, “preliminary COVID slide estimates suggest students will return in fall 2020 with roughly 70% of the learning gains in reading relative to a typical school year. However, in mathematics, students are likely to show much smaller learning gains, returning with less than 50% of the learning gains and in some grades, nearly a full year behind what we would observe in normal conditions” (p. 2).
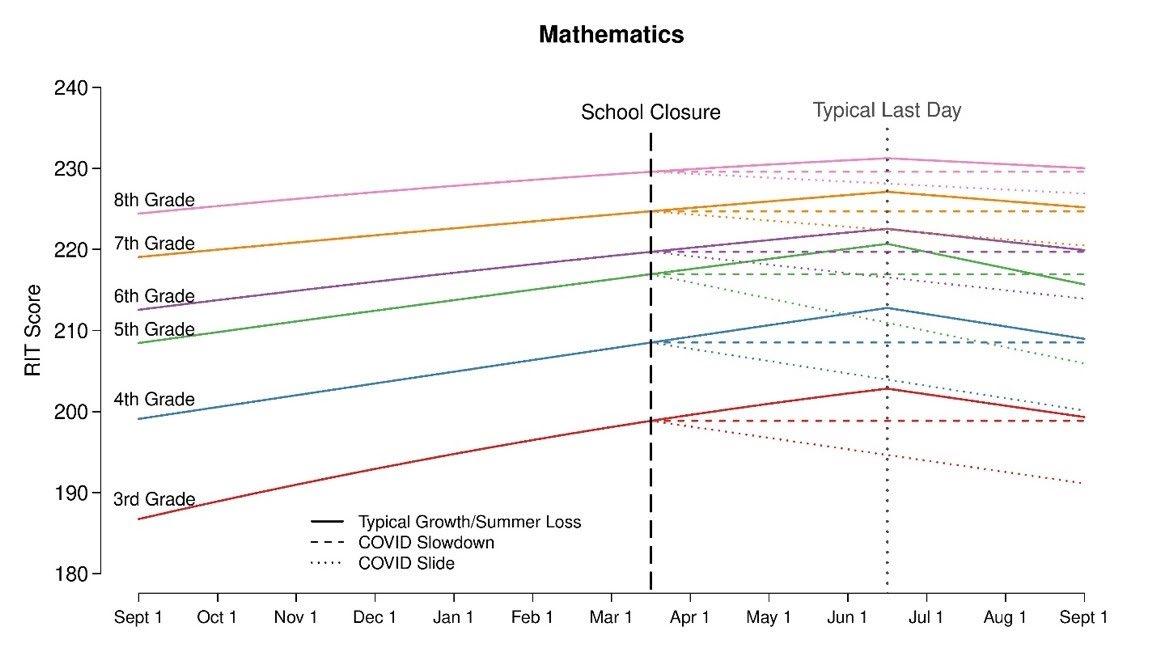
Source: NWEA Report on COVID Slide, April 2020
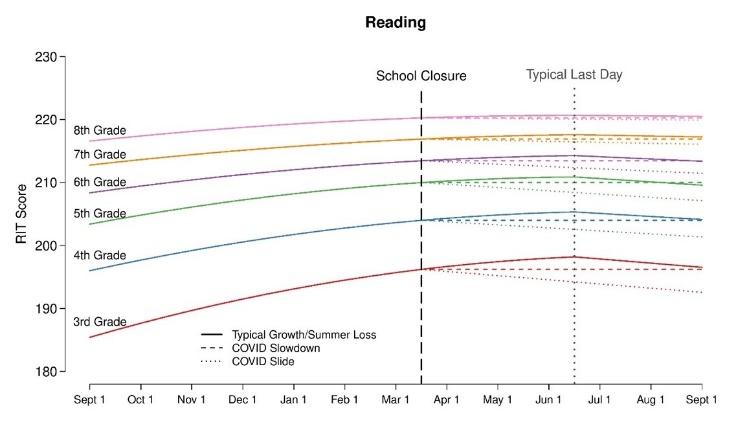
Source: NWEA Report on COVID Slide, April 2020
EmpowerK12 (2020) analyzed student-level data in Washington, DC to project likely proficiency losses by 2021 and beyond due to COVID-19. The organization estimated that the District of Columbia, one of just two states to make substantial gains on NAEP (the Nation’s Report Card) in 2019, will see proficiency on their state assessment drop 16.5 percentage points in reading and 10.4 percentage points in math.
The chart below shows the projected proficiency based on the date students return to school fulltime. A recent update to local guidance means DC students will not be able to return to school for regular in-person instruction full-time until there is a vaccine or cure. However, the projections show the extent of likely proficiency loss that has already occurred due to COVID closures with more loss compared to a normal year possible this fall.
District of Columbia “All Students” Proficiency
Source: EmpowerK12 on DC state assessment proficiency loss due to COVID-19, April 2020
To address this question, we analyzed Georgia school report card data from the last two years from the Governor’s Office of Student Achievement. Since the Georgia Department of Education only publishes attendance data at the school level by demographic and not by grade, our school sample only includes schools that serve students in tested grades, primarily upper elementary and middle schools.
Characteristics of 2018-19 Sample Georgia Schools Compared to the State
Learning Loss Due to Student Absence in Sample Georgia Schools
To build a predictive model that estimates the impact of COVID closure on Milestones proficiency, we began by analyzing the link between proficiency changes, student growth measures, and absenteeism within the sample set of Georgia schools. We find a statistically significant correlation (p < .01) between student attendance rates at the school level and Milestones growth as measured by the median growth percentile (MGP). Further, there is a significant correlation (p < .01) between MGP and a school’s change in proficiency rate from one year to the next, allowing us to create a model that estimates proficiency changes based on changes to regular school attendance.
The chart on the left shows the average 2019 MGP for the sample schools based on their average student attendance in 2018-19, and the graph on the right shows the correlation between the MGP growth measure and annual proficiency changes.
Attendance Impact on Student Growth Student Growth Impact on Proficiency from 2018 to 2019

Based on national research and Georgia instructional loss data, how might COVID-19 affect future Milestone achievement rates in the metro Atlanta region?
If all students in grades 3-8 had taken Milestone assessments in spring 2020, the percentage of students demonstrating proficiency would be expected to drop 3.6 points in English language arts and 4.9 points in math as compared to last year. This approach is based on the more conservative assumption that the steady improvement in proficiency over proceeding years remains at 2019 levels otherwise even more students may have been impacted by the lack of in-person instruction. Two specific proficiency gateway measures tracked by Learn4Life, 3rd-grade reading and 8th-grade math, show similar declines.
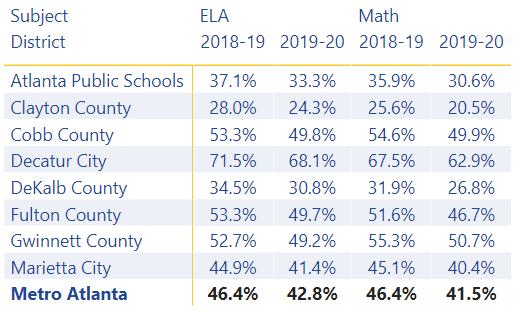
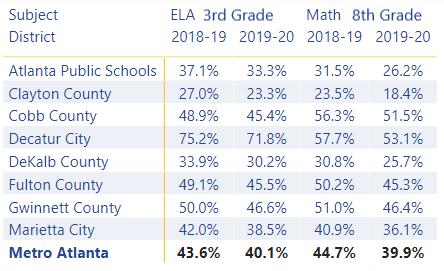
Projected 2019-20 Proficiency Rates Compared to 2018-19 Results for Metro Atlanta School Districts
Economically disadvantaged students and students of color, who were already behind their peers, will fall further behind. The study’s modeling projects only three out of ten students from historically underserved groups would have demonstrated grade-level proficiency at the end of 2019-20, reversing recent gains.
Projected 2019-20 Proficiency for Underserved Student Groups
Based on total regional student enrollment of 594,000 in spring 2018-19 and applying the model results to students in all grades, today about 21,000 fewer students in ELA and 29,000 fewer in math are on track for grade-level proficiency than prior to COVID-19.
Assumptions and caveats related to the model estimates above:
1) Achievement projections only include the Milestone assessments for students in grades 3-8. Since the state only publishes high school attendance data at the school level, we cannot reliably attribute a school’s attendance rate to the student population who completed an endof-course assessment as only a subset of high schoolers take Milestones each year.
2) The model assumes that distance learning initiatives in 2019-20 had an impact similar to the average summer academic engagement elementary and middle school students receive Even
under the best circumstances with ample time to prepare, virtual schooling has shown little evidence of success, especially for low-income students and students with disabilities (Woodworth et al., 2015). Equitable access to devices and strong broadband internet is still a challenge in the region’s less affluent neighborhoods. Local schools have reported low attendance rates to online synchronous lessons offered during the pandemic.
3) The model assumes schools retain the typical 180-day academic year. Additional instructional time represents an opportunity to recover some of the losses, as noted below.
4) Also, the model assumes no other major changes in the quality of education in metro Atlanta, and that prior incremental achievement gains or losses in each district continue when students return full-time
What possible solutions do we have for the education community’s consideration?
1) Assessments allow schools to make critical education decisions. The disruption of assessments this past spring limit teachers’ ability to gauge where students are academically. As students return to school in the fall, research from the Center of Assessment (2020) highlights that the most urgent assessment priority is to identify the specific learning needs of students. These findings will assist schools with adopting appropriate interventions that address specific learning gaps (Boyer, 2020).
2) Lengthen the school year in 2020-21 and 2021-22 by at least 5% to make up for lost quality instructional time for all students. By doing so, our model suggests 2019-20 COVID proficiency loss can be recovered in less than four years. Schools that offer extended school year or extended school day have statistically significantly higher academic growth and achievement outcomes (Kidron & Lindsay, 2014)
3) During remote learning, ensure teachers prioritize math skills in addition to reading skills as math regression is more acute due to instructional time loss, especially for low-income students and students with disabilities.
4) Prioritize virtual site visits for students with disabilities during distance learning time, moving virtual home visits to in-person when it is safe. Disabled students are particularly vulnerable to academic regression while away from school, so the goal is to ensure they receive additional attention and their home environment is set up for success.
5) High school student disengagement tracking during the next several months will be critical to avoid substantial increases in dropouts as has happened after other natural disasters.
Atteberry, A., & McEachin, A. (2016) Summer learning loss across grade levels and school contexts in the United States today. In Alexander, K. L. (Ed.) The summer slide: What we know and can do about summer learning loss. Teachers College Press.
Boyer, M. (2020, March 24). An assessment response to anticipated learning gaps: Implications of school closures on assessment needs. Center for Assessment. https://www.nciea.org/blog/covid-19-response/assessment-responseanticipated-learning-gaps
Cooper, H., Nye, B., Charlton, K., Lindsay, J., & Greathouse, S. (1996). The effects of summer vacation on achievement test scores: A narrative and meta-analytic review. Review of Educational Research, 66, 227-268.
Kidron, y. & Lindsay, J. (2014). The effects of increased learning time on student academic and nonacademic outcomes: Findings from a meta‑analytic review. IES Meta-Analysis Report. Washington, DC: American Institutes for Research
Kuhfeld, M. & Tarasawa, B. (2020). The COVID-19 slide: What summer learning loss can tell us about the potential impact of school closures on student academic achievement. NWEA Collaborative Brief Report. Portland, OR: NWEA.
Rambo-Hernandez, K. E., & McCoach, D.B. (2015). High-achieving and average students’ reading growth: Contrasting school summer trajectories. Journal of Education Research, 108, 112-129.
Sparks, S. (2018). Summer Learning Gaps Worsen in Higher Grades, Just Not the Way You Think.
von Hippel, Paul T., & Hamrock, C (2019) Do test score gaps grow before, during, or between the school years? Measurement artifacts and what we can know in spite of them. Sociological Science, 6, 43-80.
Thum Y. M., & Hauser, C. H. (2015). NWEA 2015 MAP Norms for Student and School Achievement Status and Growth. NWEA Research Report. Portland, OR: NWEA
Thum, Y. M., & Kuhfeld, M. (2020). NWEA 2020 MAP Growth Achievement Status and Growth Norms Tables for Students and Schools. NWEA Research Report. Portland, OR: NWEA.
Ward, M. E., Shelley, K., Kaase, K., & Pane, J.F. (2008). Hurricane Katrina: A Longitudinal Study of the Achievement and Behavior of Displaced Students, Journal of Education for Students Placed at Risk, 13:2-3, 297-317
Woodworth, J.L., Raymond, M.E., Chirbas, K., Gonzalez, M., Negassi, Y., Snow, W., & Van Donge, C. (2015). Online Charter School Study. Center for Research on Education Outcomes.