– LUXURY MONTHLY MARKET REVIEW – A Review of Key Market Differences Year over Year November 2020 | November 2021
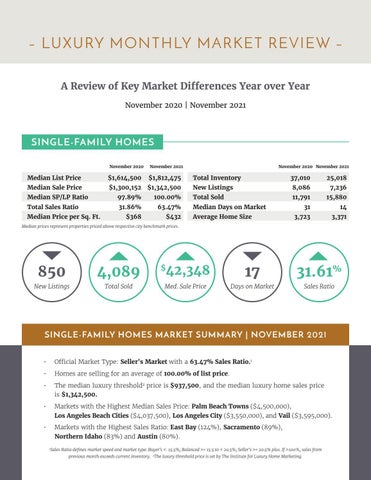
SINGLE-FAMILY HOMES November 2020
November 2021
Median List Price
$1,614,500
$1,812,475
Median Sale Price
$1,300,152 $1,342,500
Median SP/LP Ratio
97.89%
100.00%
Total Sales Ratio
31.86%
63.47%
$368
$432
Median Price per Sq. Ft.
November 2020 November 2021
Total Inventory
37,010
25,018
New Listings
8,086
7,236
Total Sold
11,791
15,880
31
14
3,723
3,371
Median Days on Market Average Home Size
Median prices represent properties priced above respective city benchmark prices.
850
4,089
New Listings
Total Sold
17
31.61%
Med. Sale Price
Days on Market
Sales Ratio
42,348
$
SINGLE-FAMILY HOMES MARKET SUMMARY | NOVEMBER 2021 •
Official Market Type: Seller's Market with a 63.47% Sales Ratio.1
•
Homes are selling for an average of 100.00% of list price.
•
The median luxury threshold2 price is $937,500, and the median luxury home sales price is $1,342,500.
•
Markets with the Highest Median Sales Price: Palm Beach Towns ($4,500,000), Los Angeles Beach Cities ($4,037,500), Los Angeles City ($3,550,000), and Vail ($3,595,000).
•
Markets with the Highest Sales Ratio: East Bay (124%), Sacramento (89%), Northern Idaho (83%) and Austin (80%). 1
Sales Ratio defines market speed and market type: Buyer's < 15.5%; Balanced >= 15.5 to < 20.5%; Seller's >= 20.5% plus. If >100%, sales from previous month exceeds current inventory. 2The luxury threshold price is set by The Institute for Luxury Home Marketing.