


Market Location
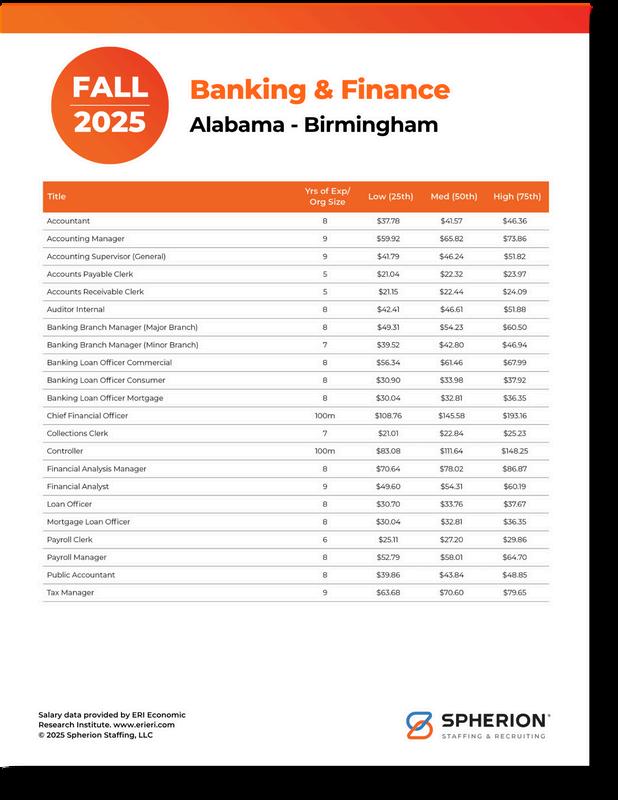
The data on the page is specific to this market location
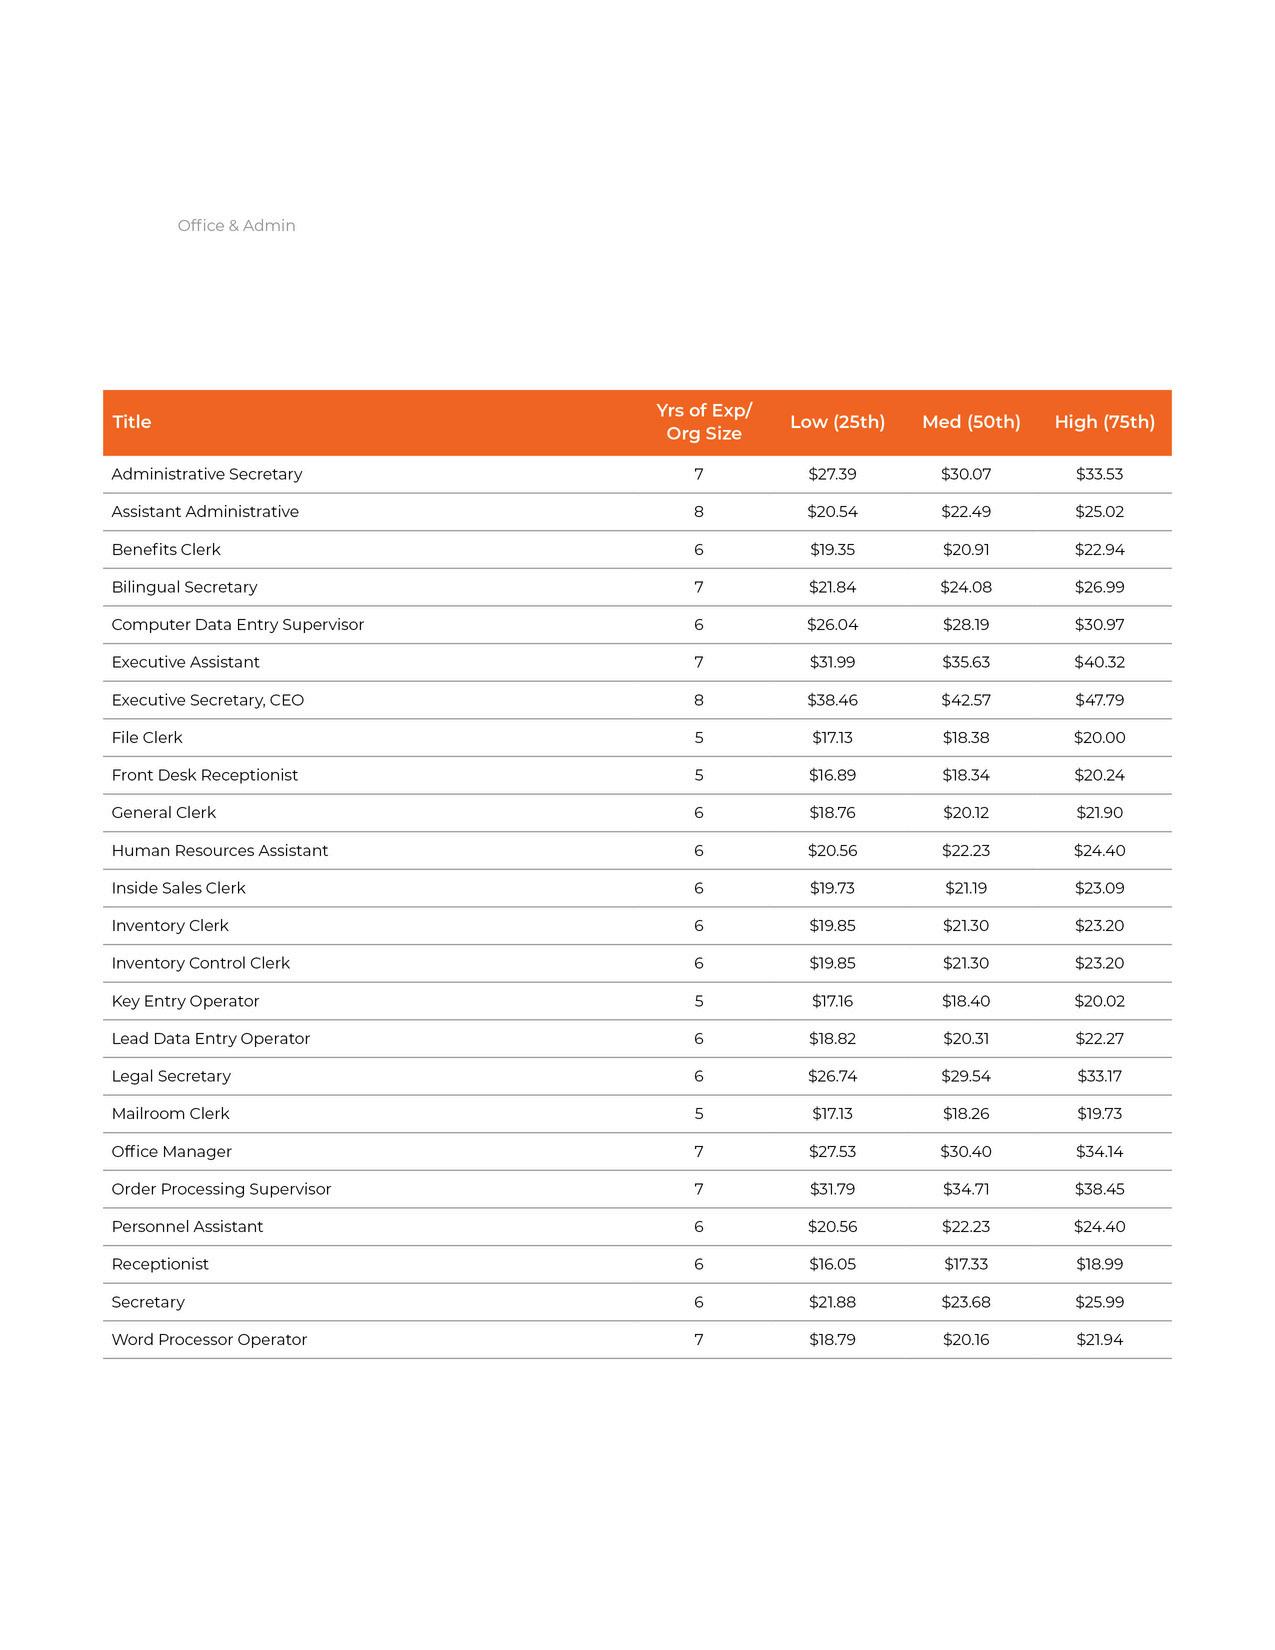
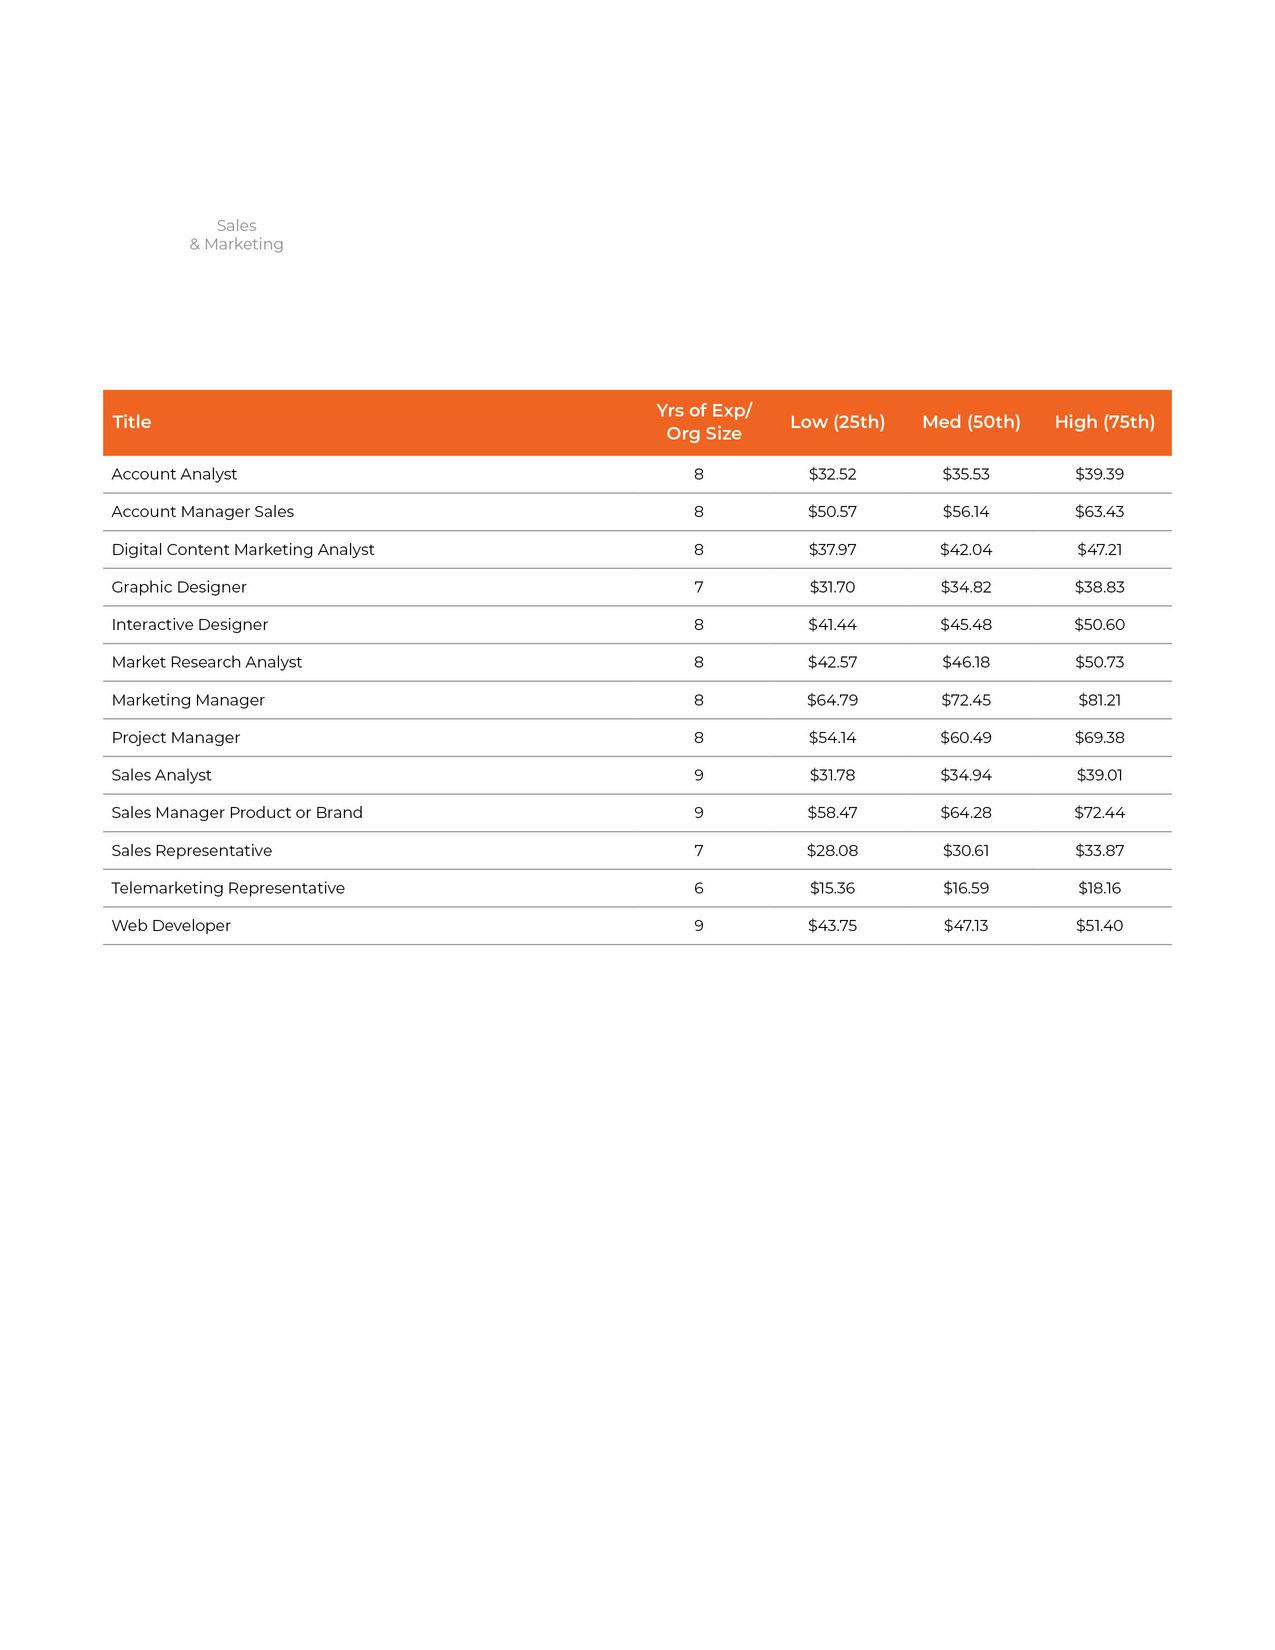
This is intended to help you better estimate compensation for each role, based on the individual’s experience and other market factors at play.
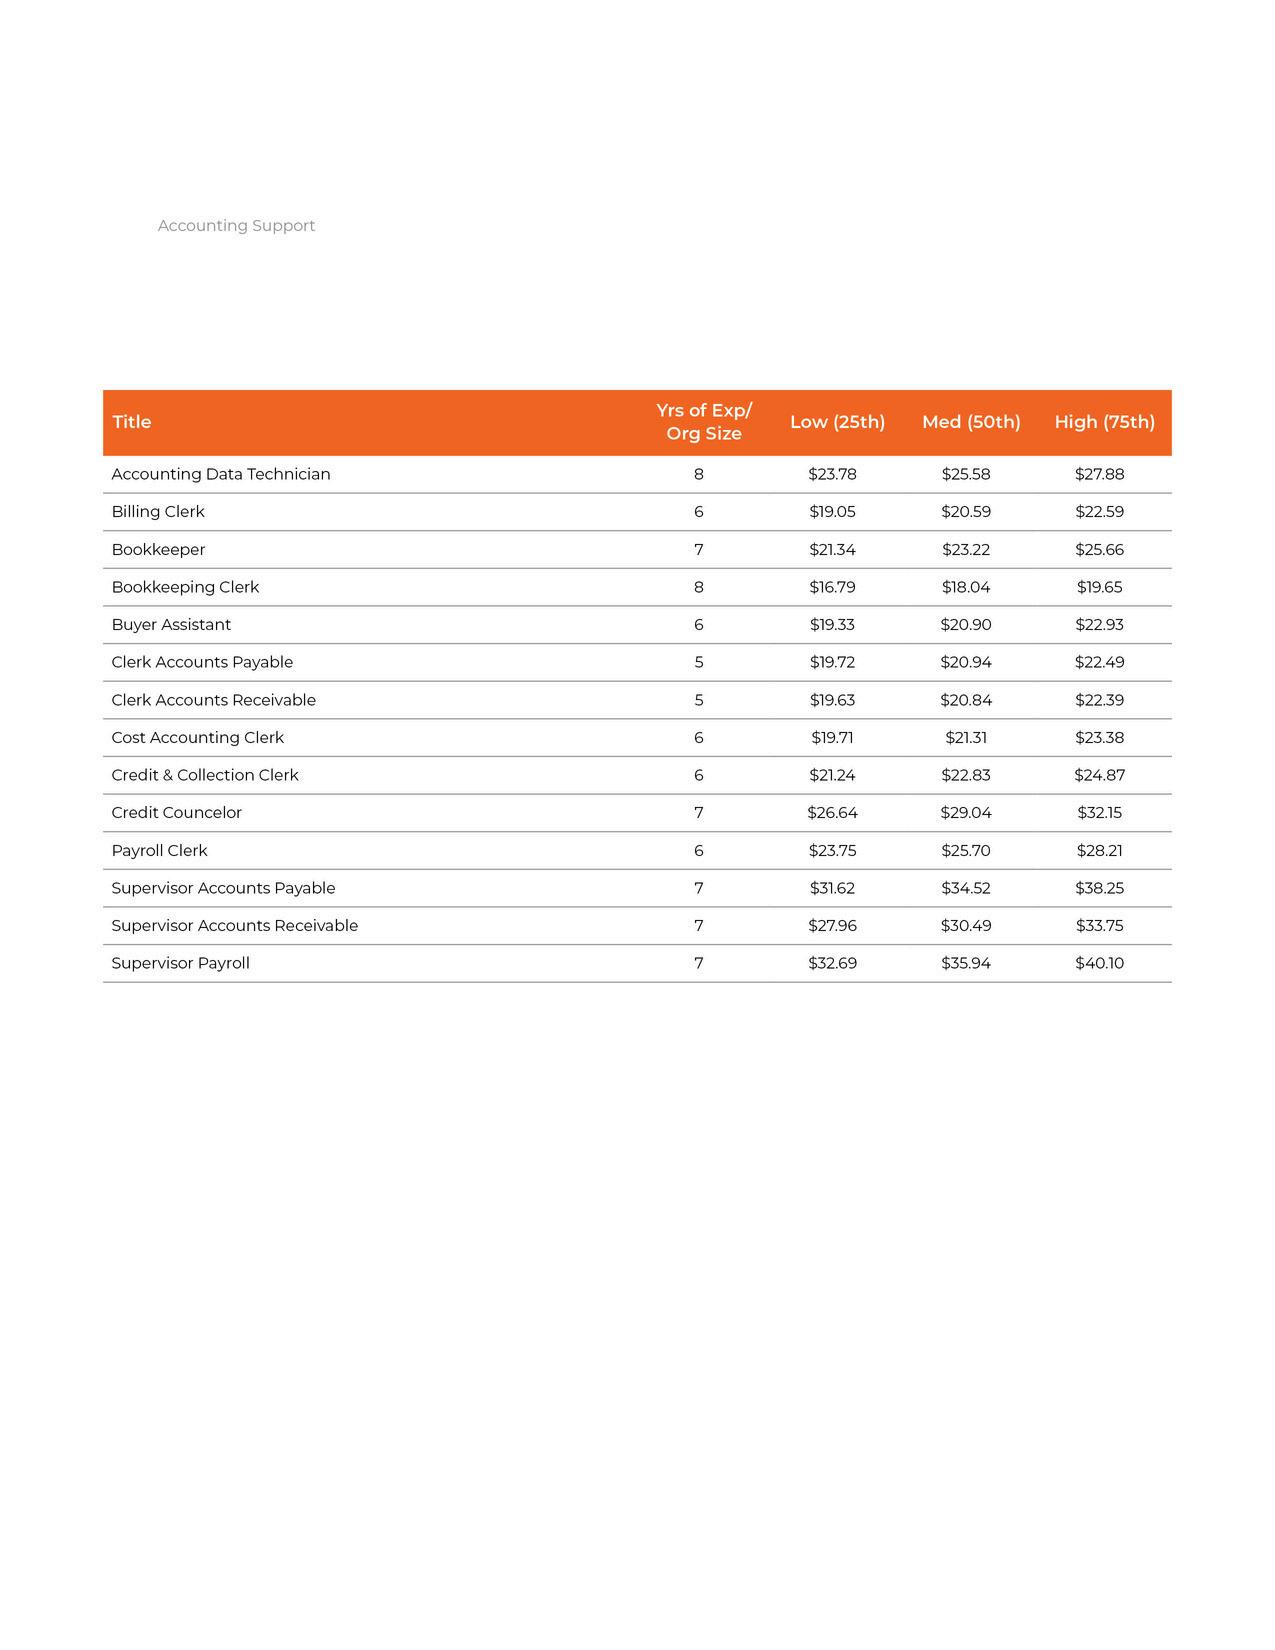
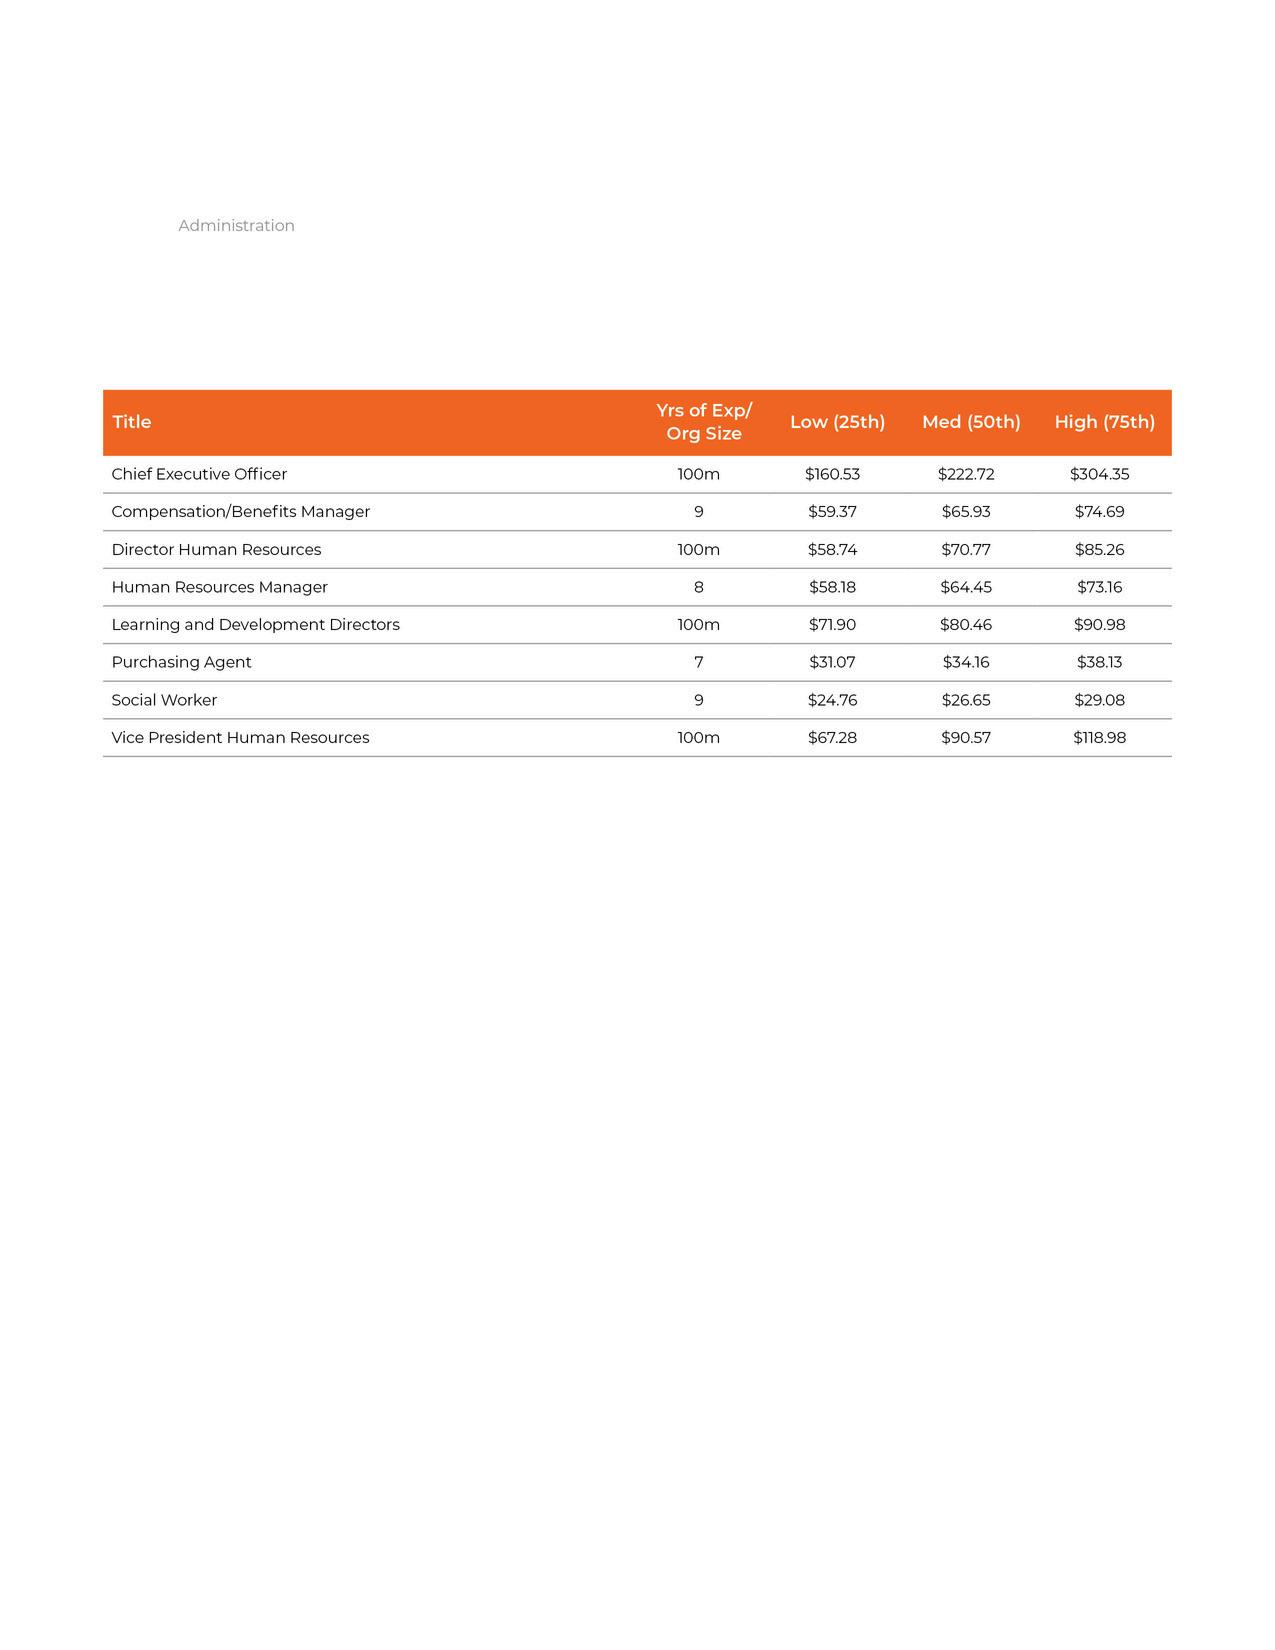
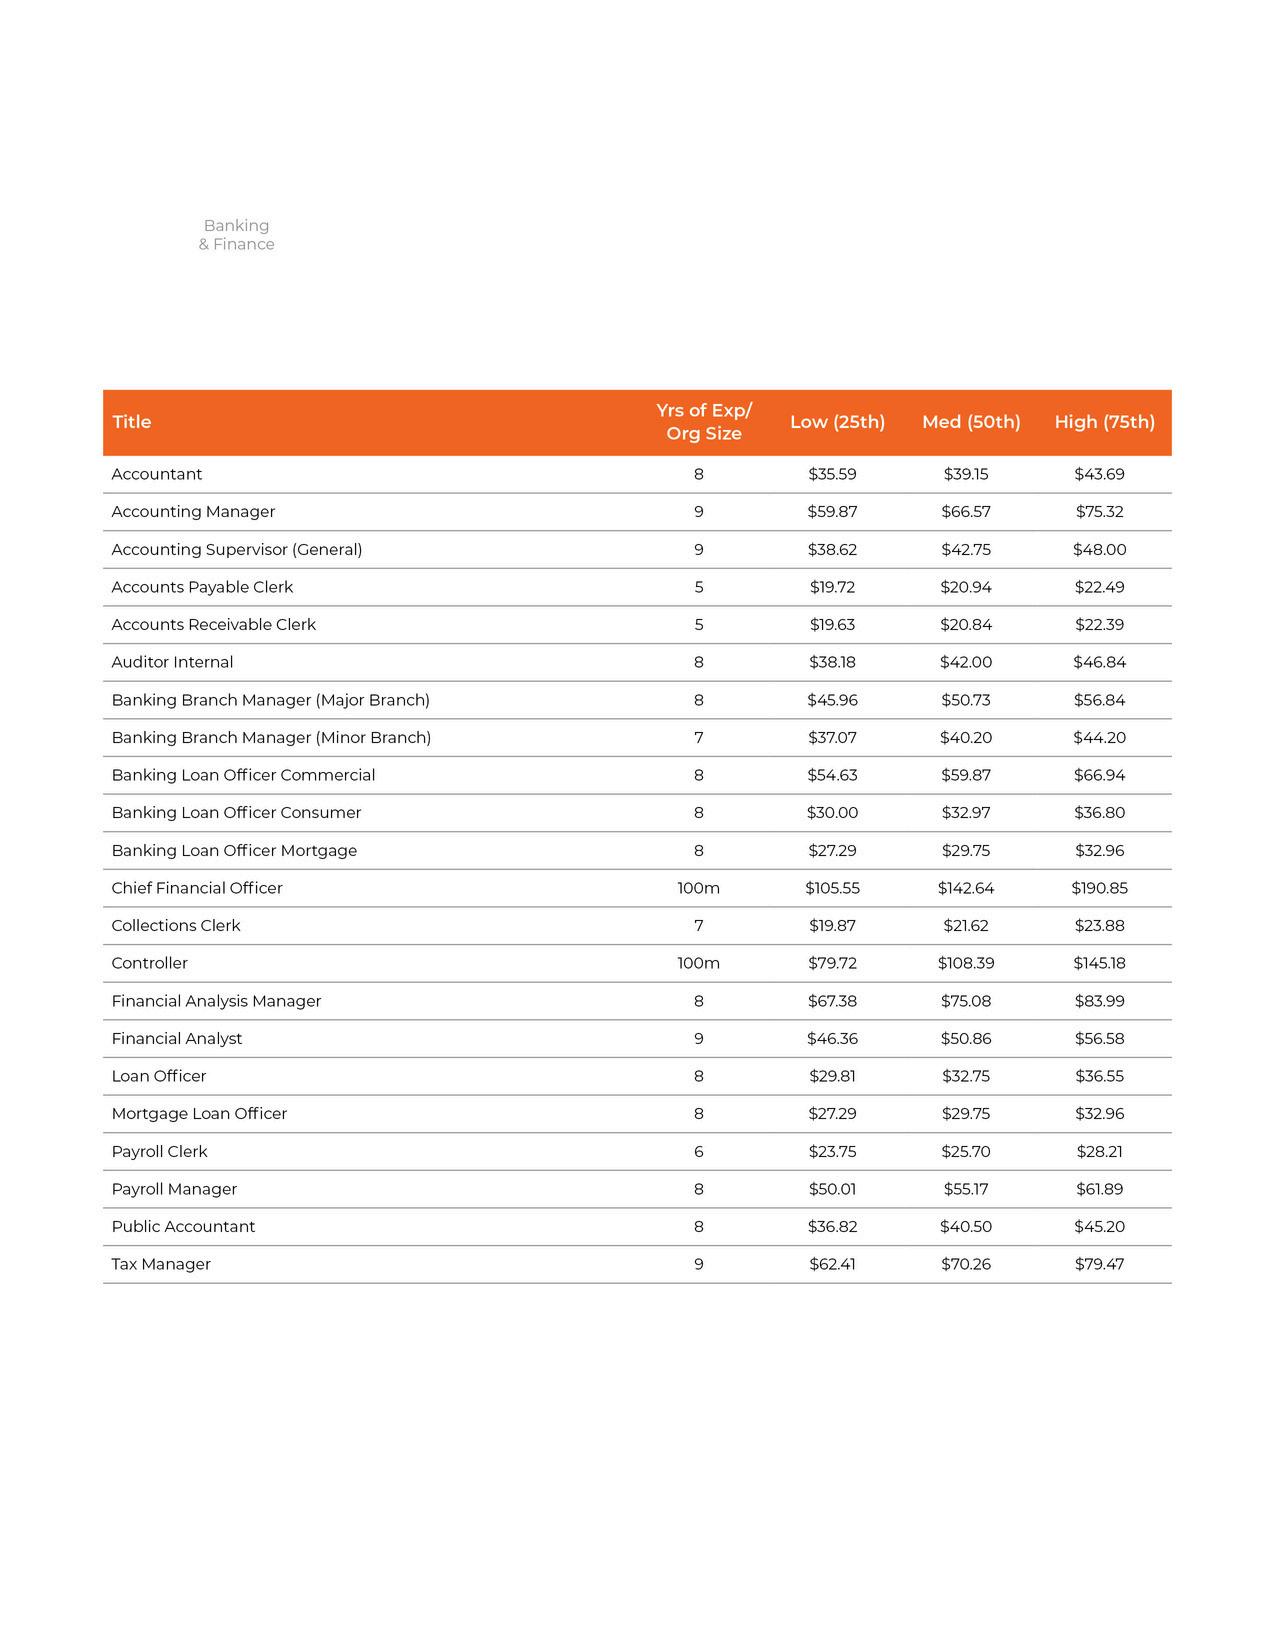
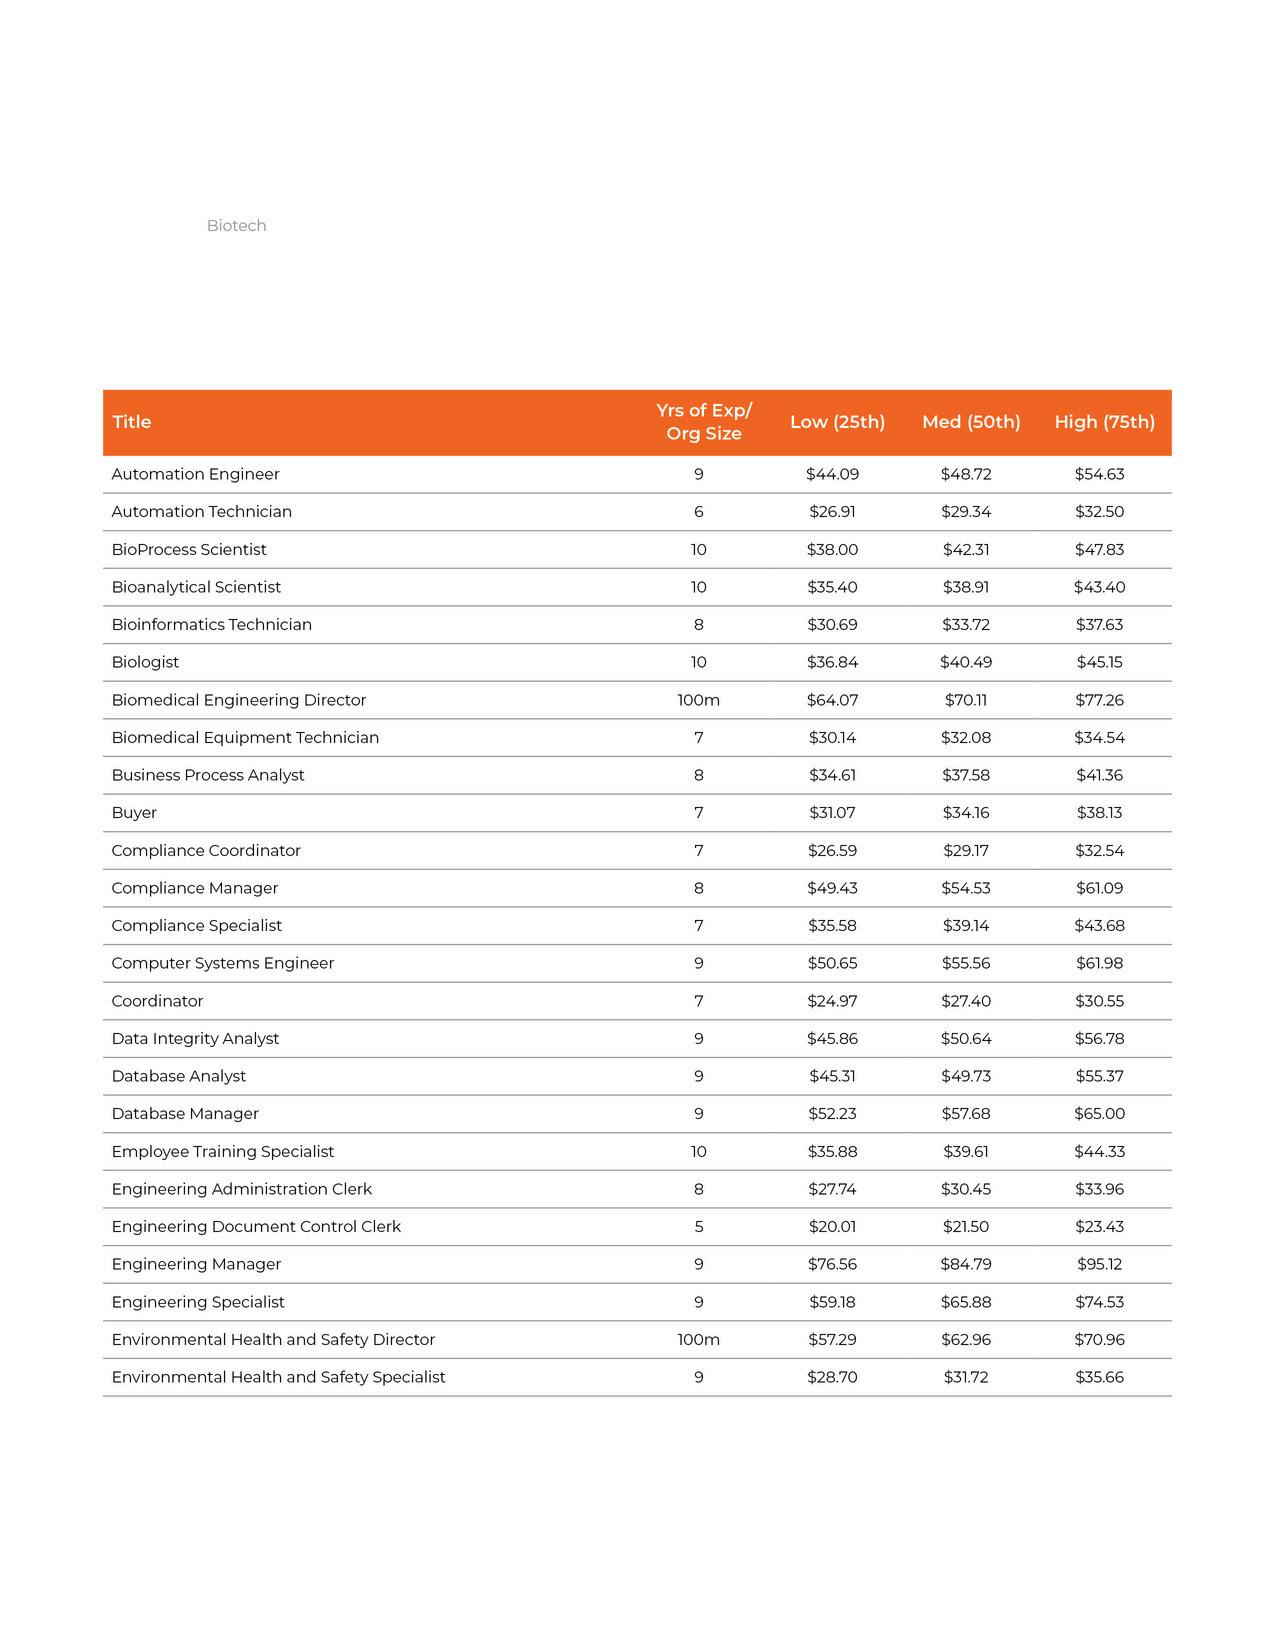
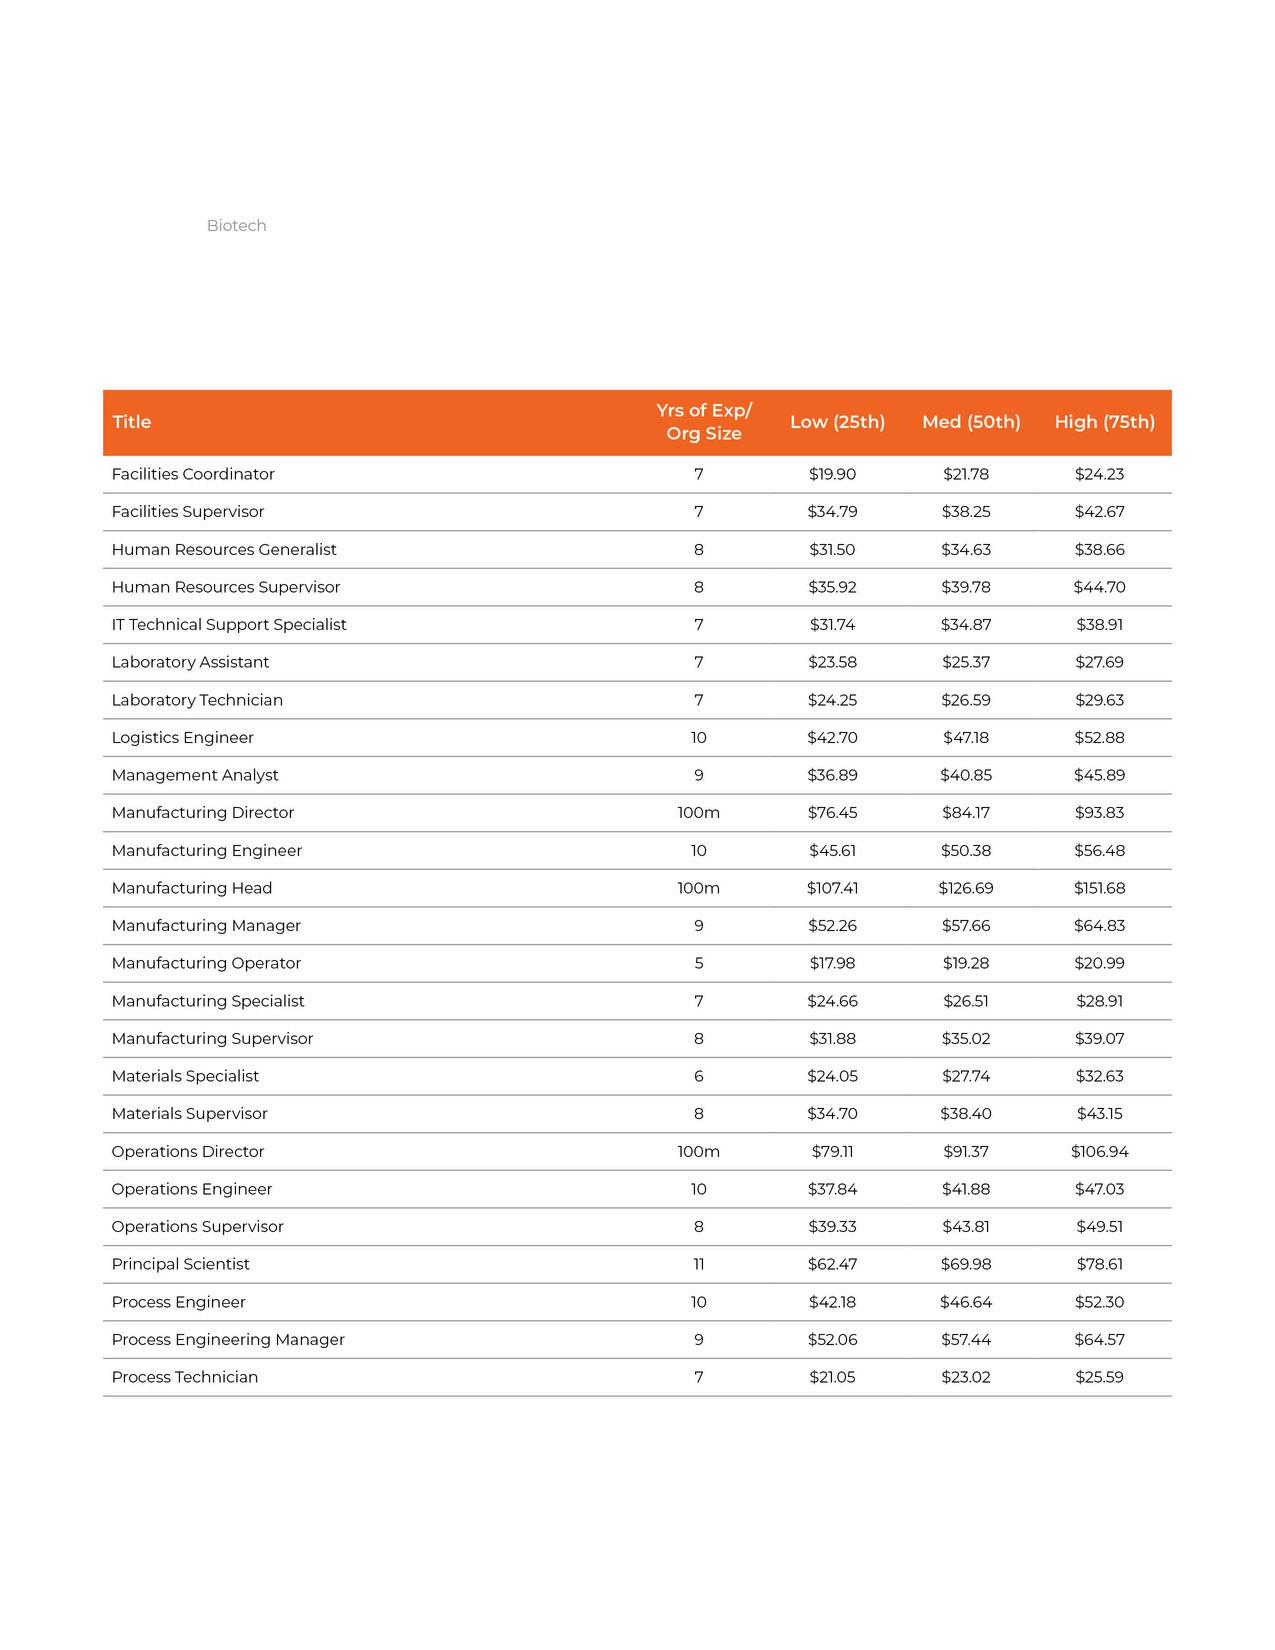
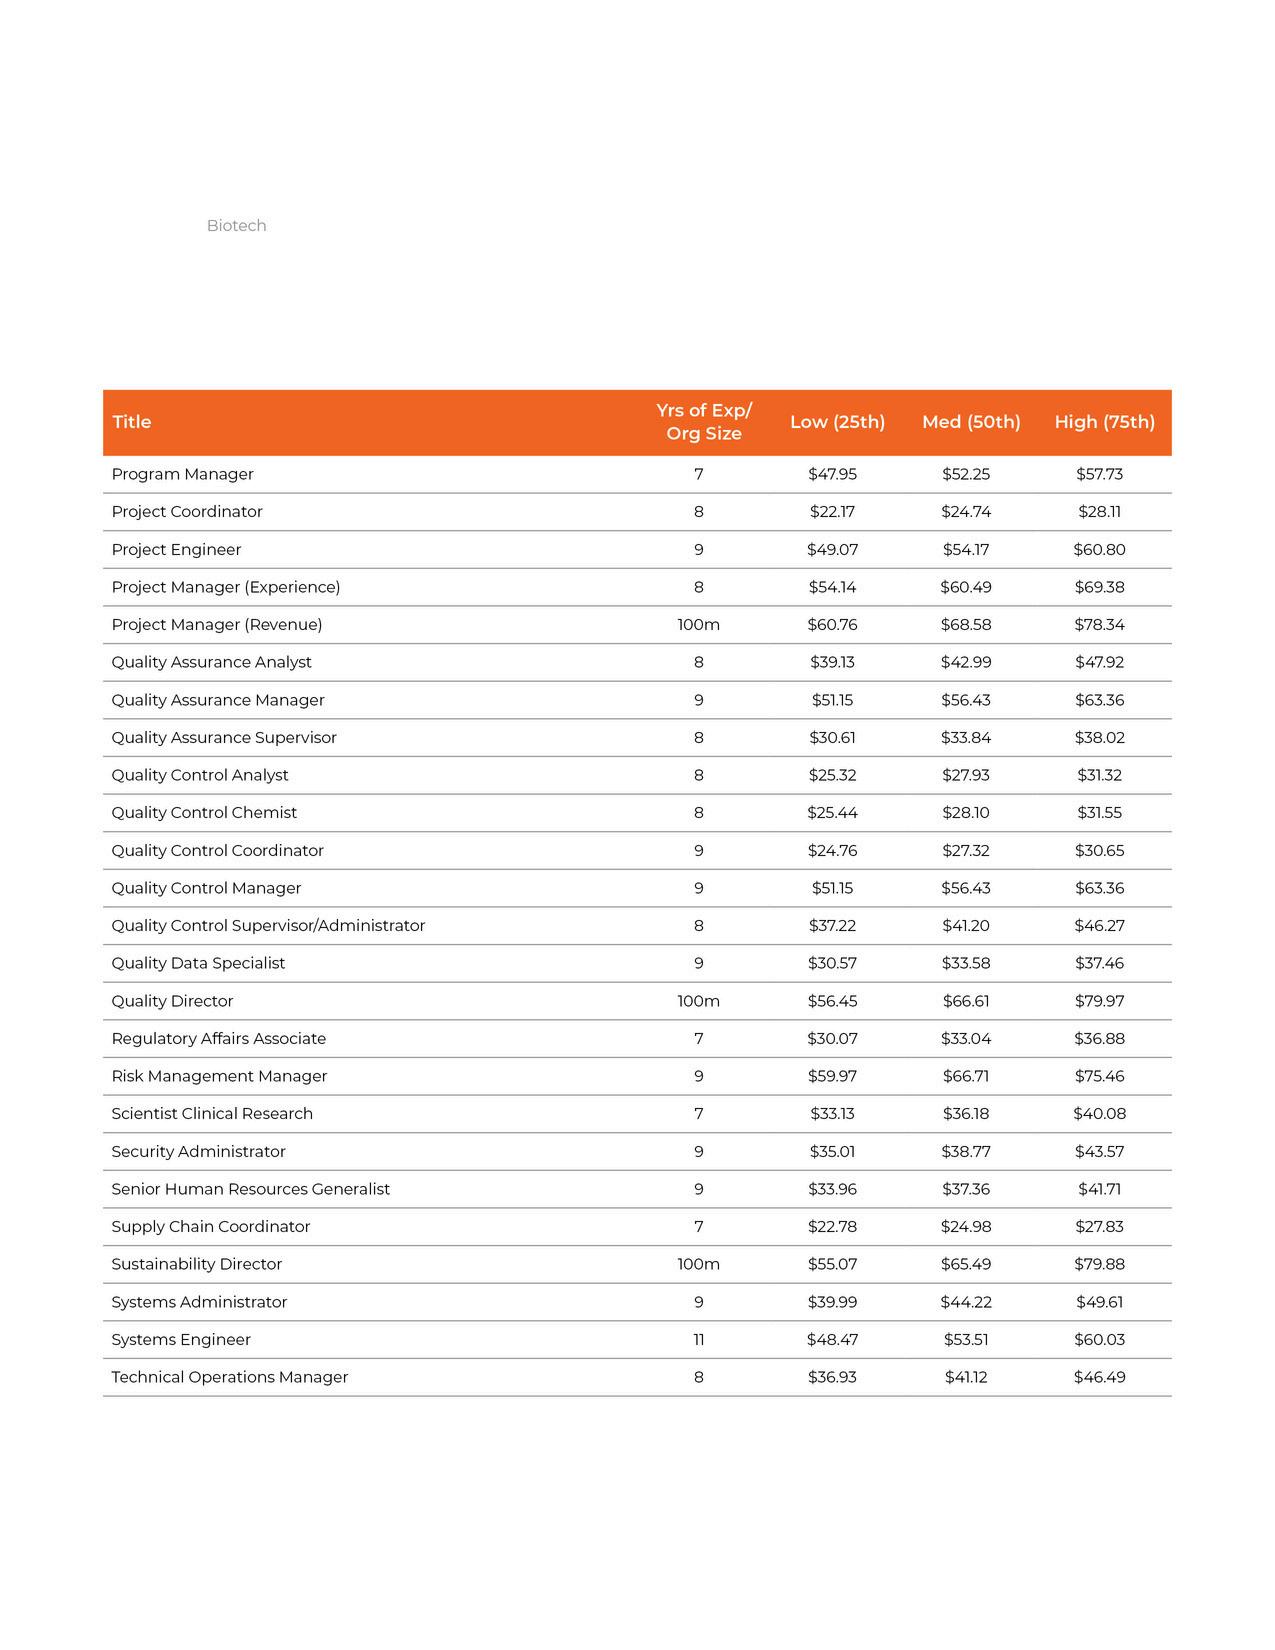
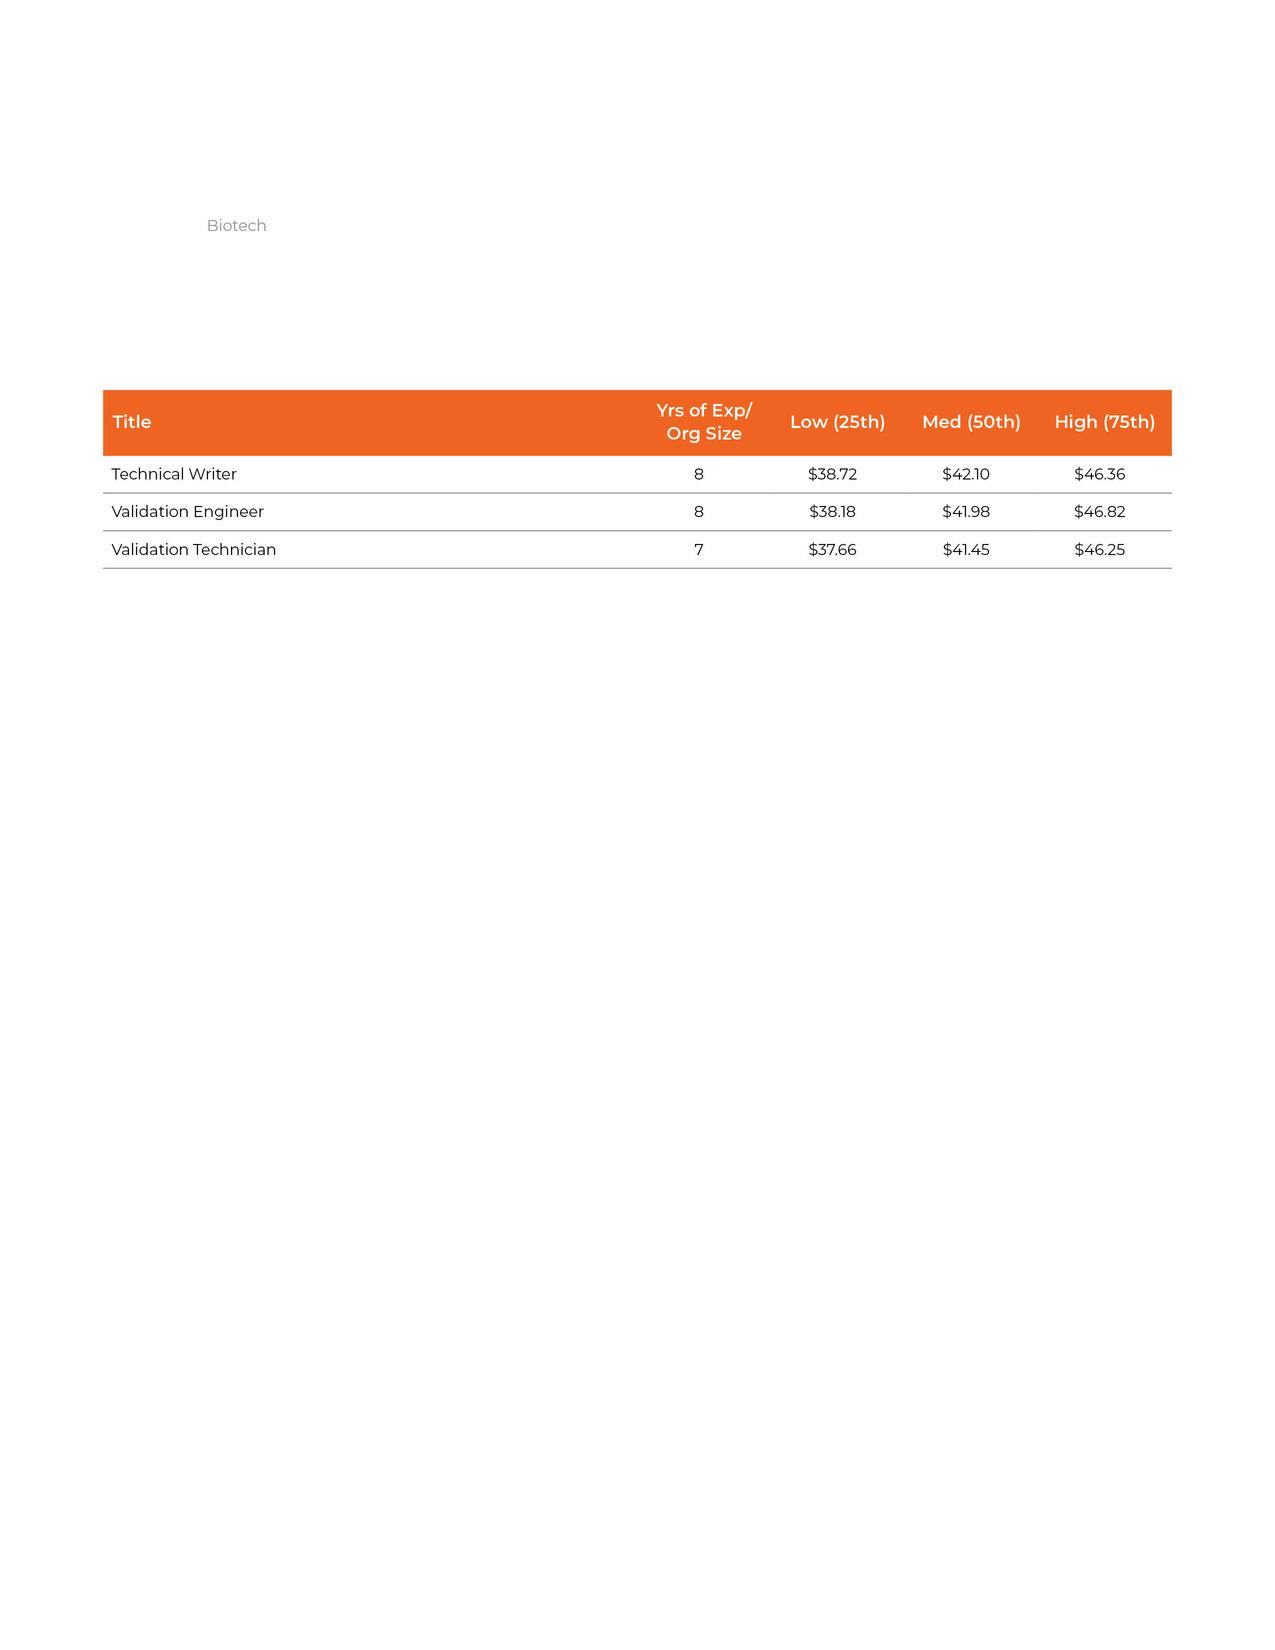
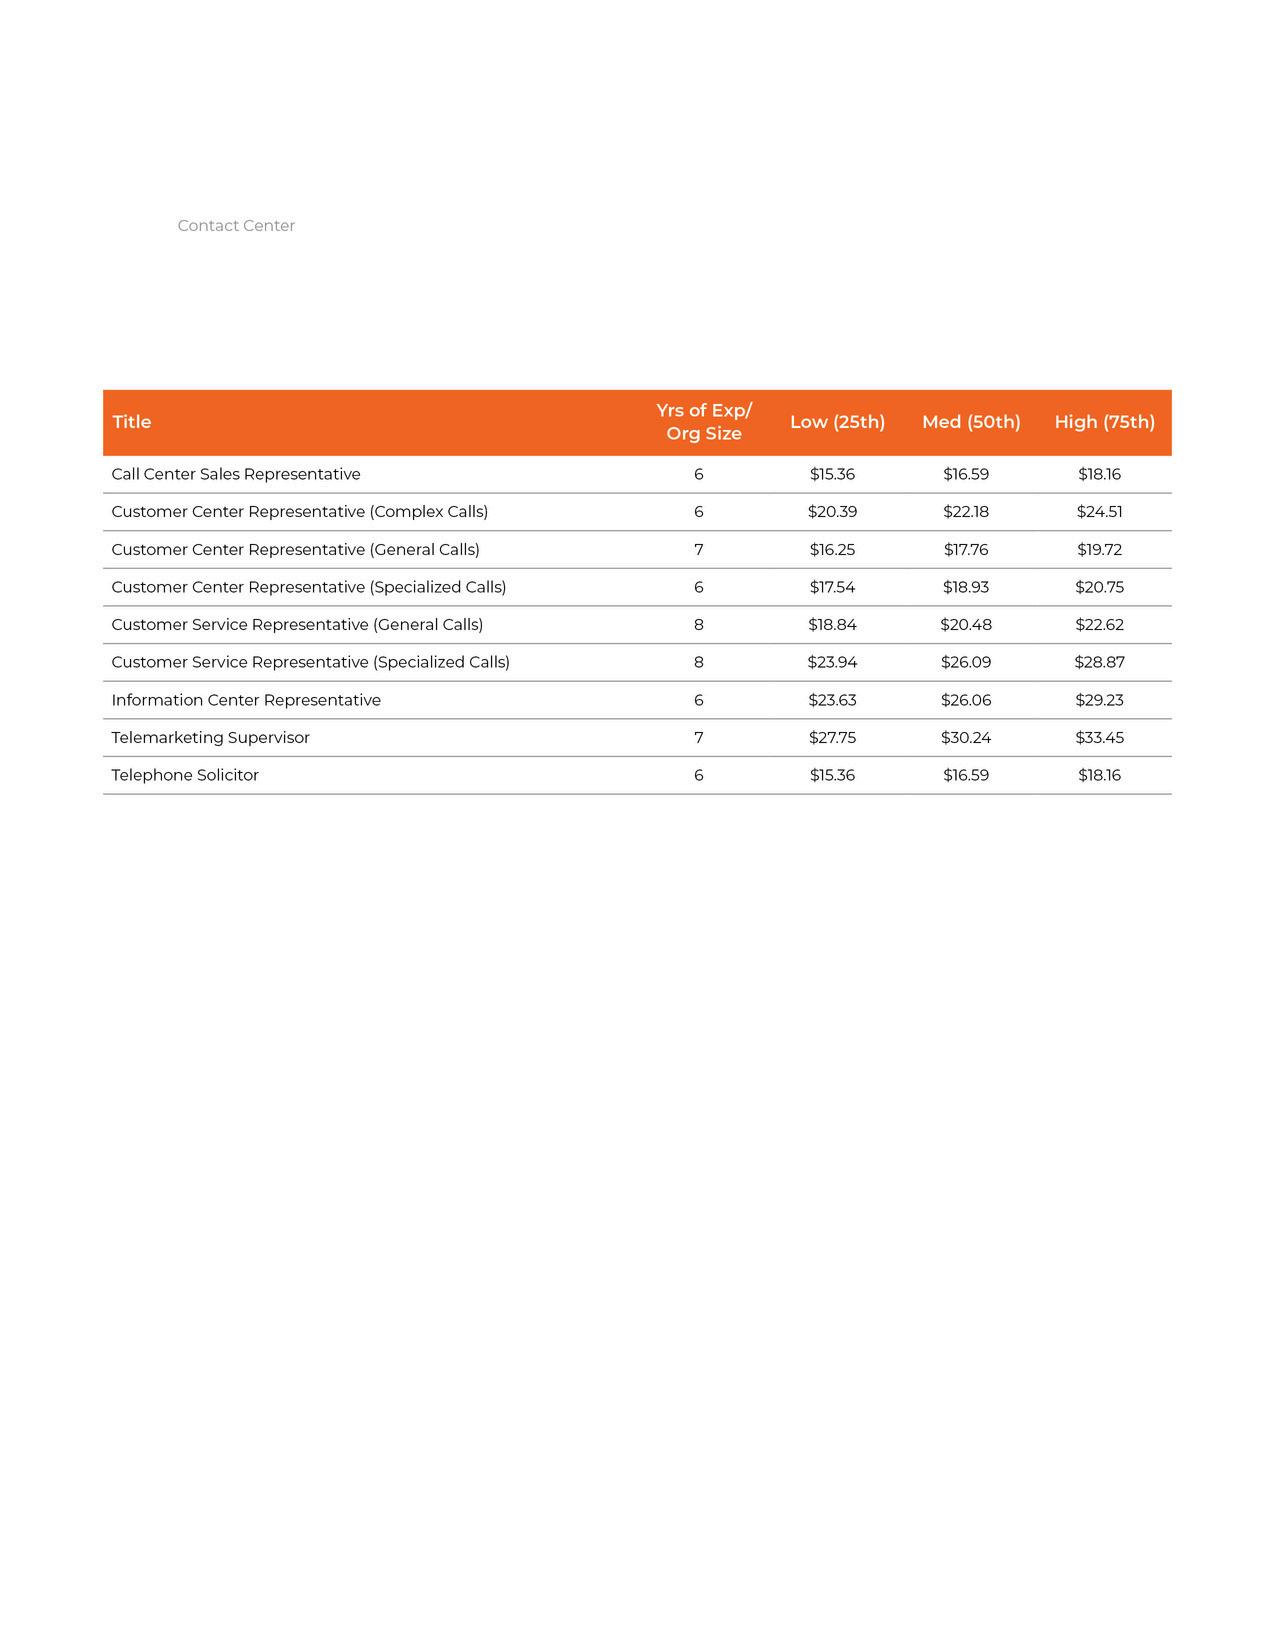
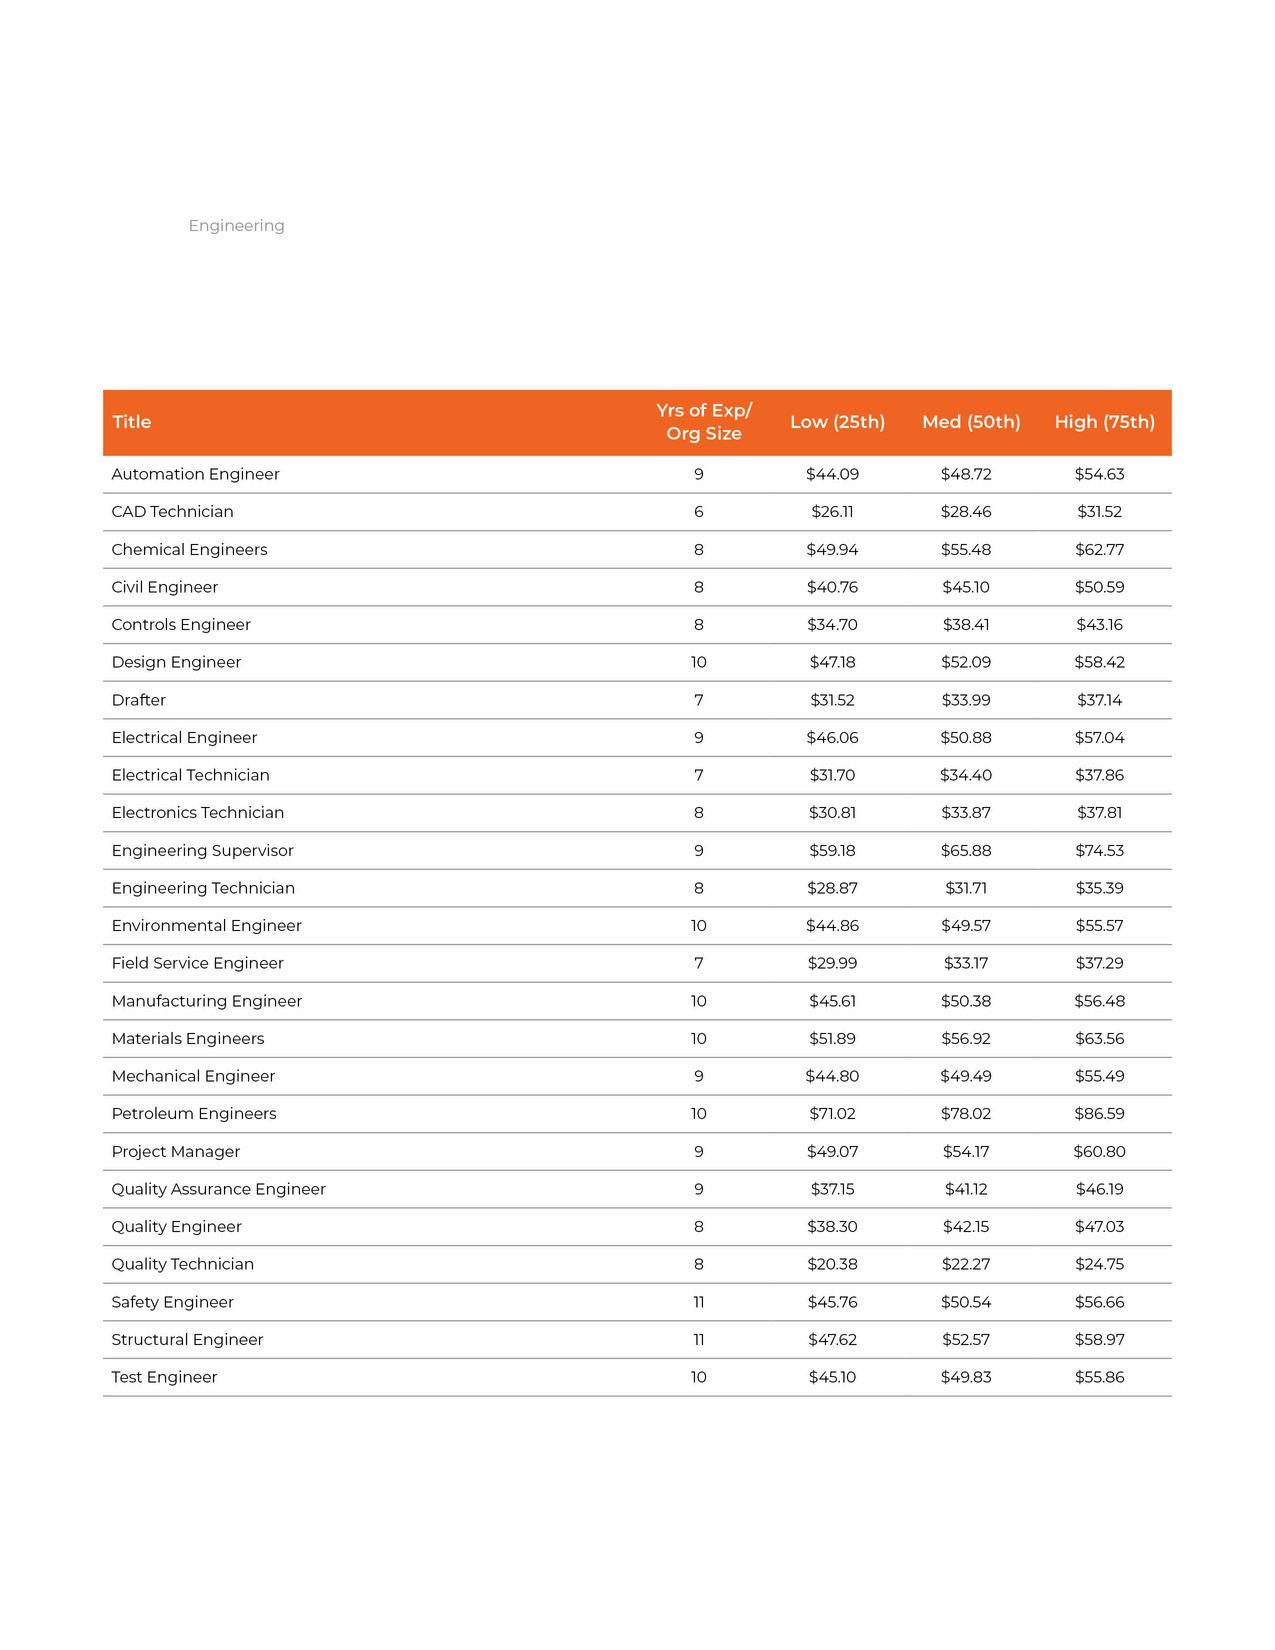
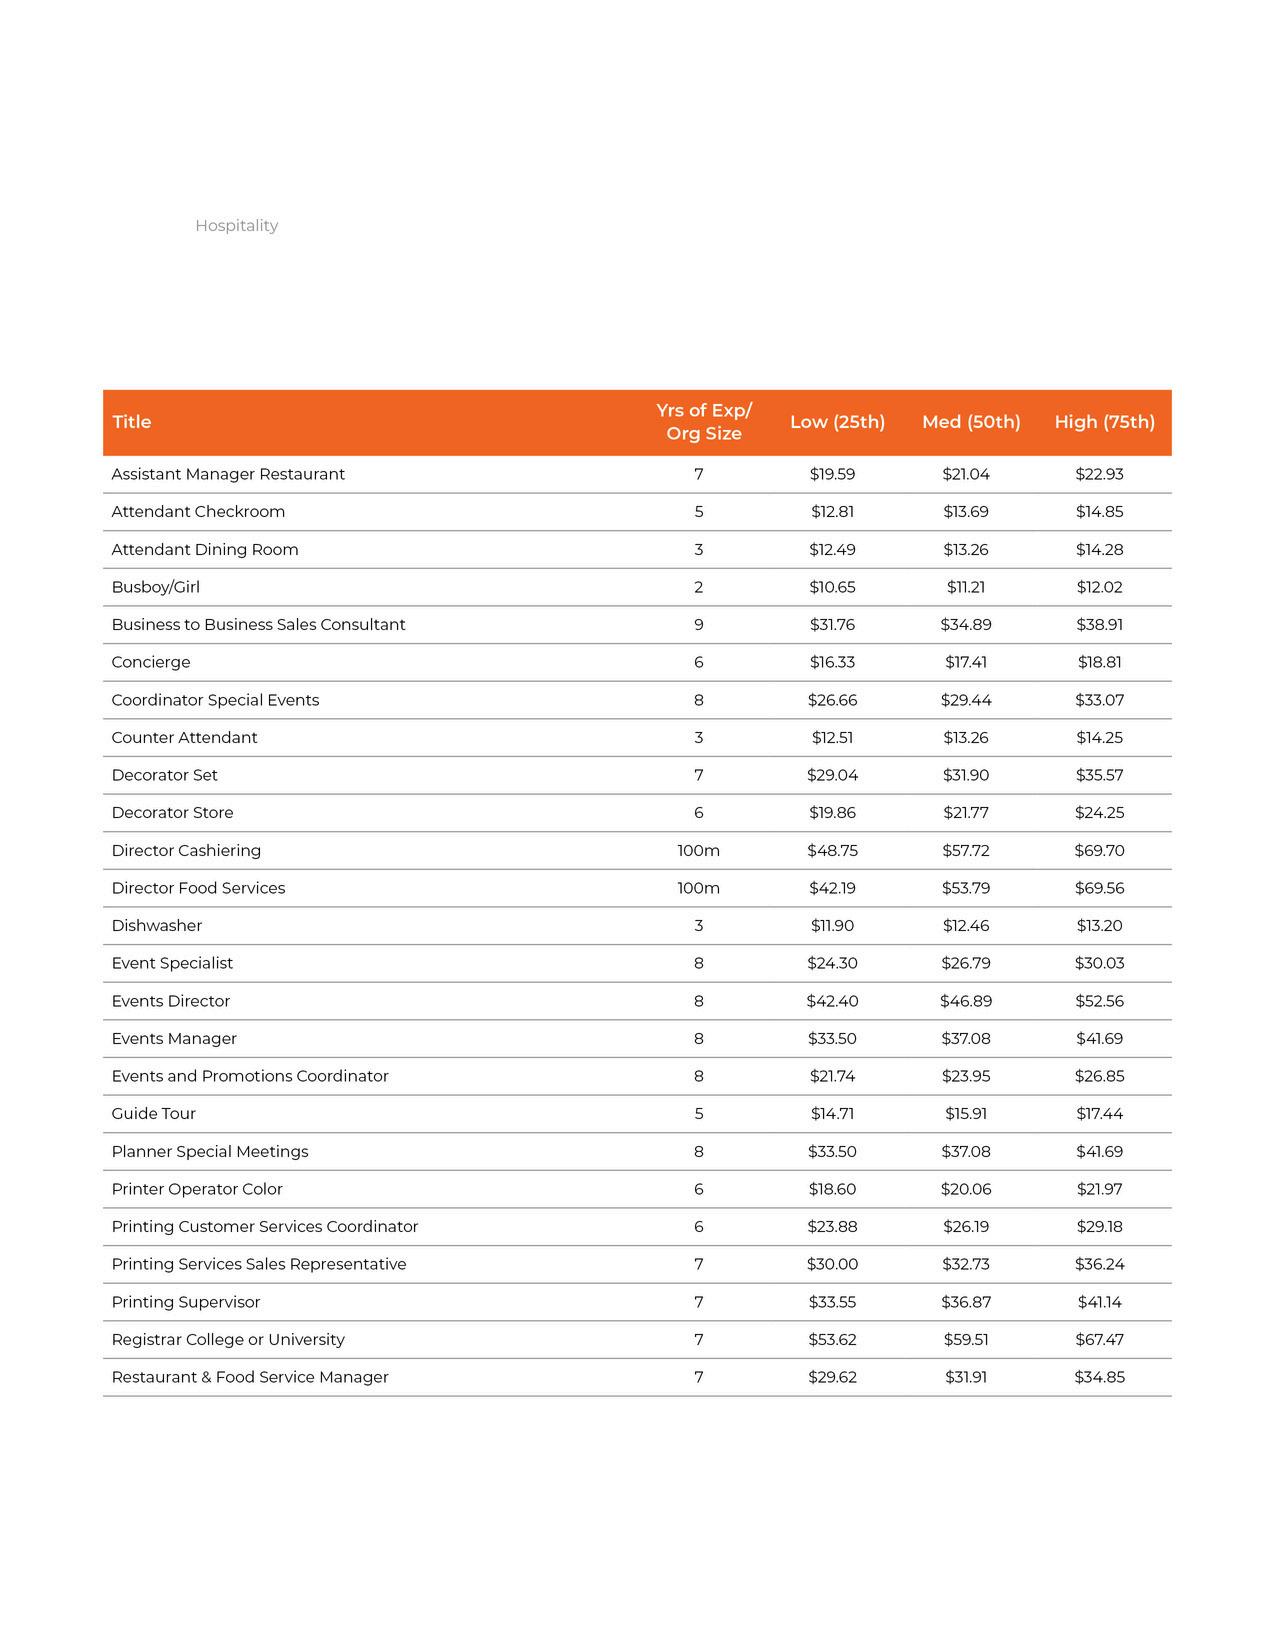
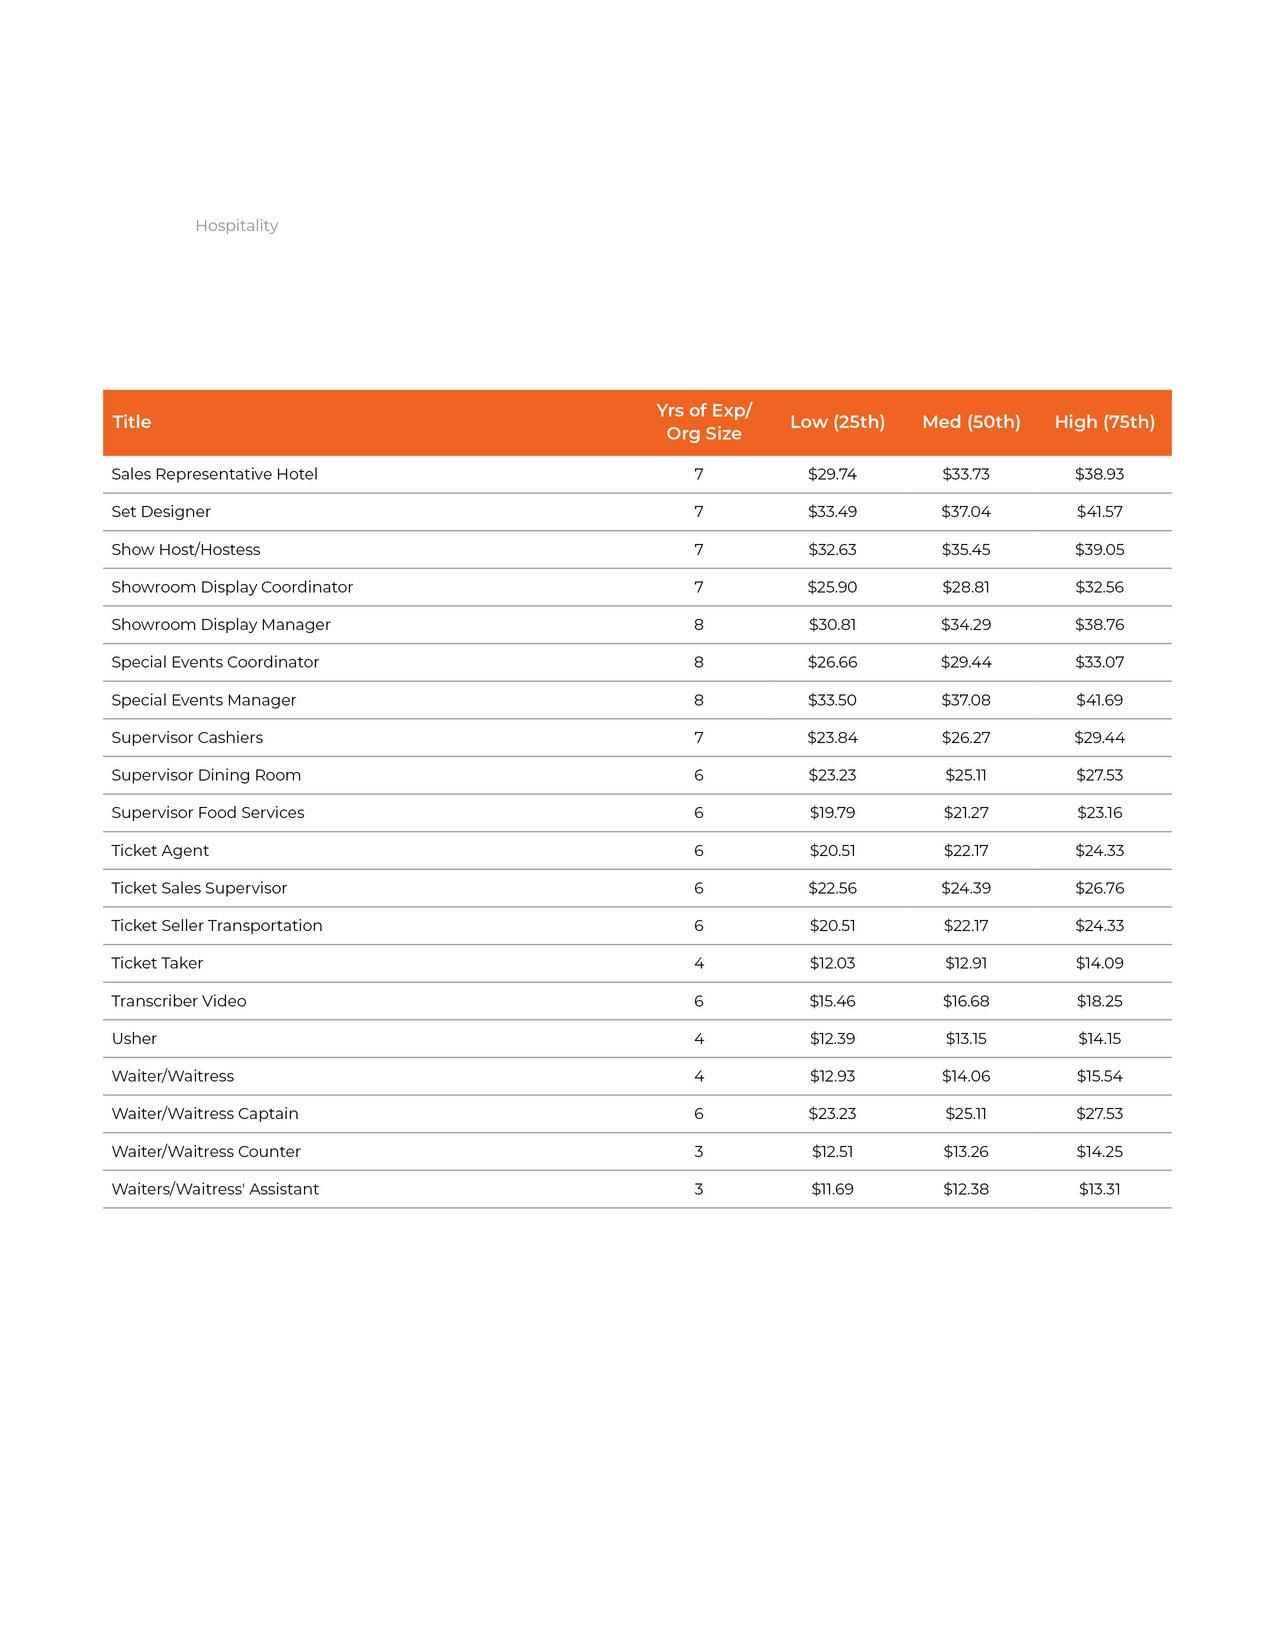
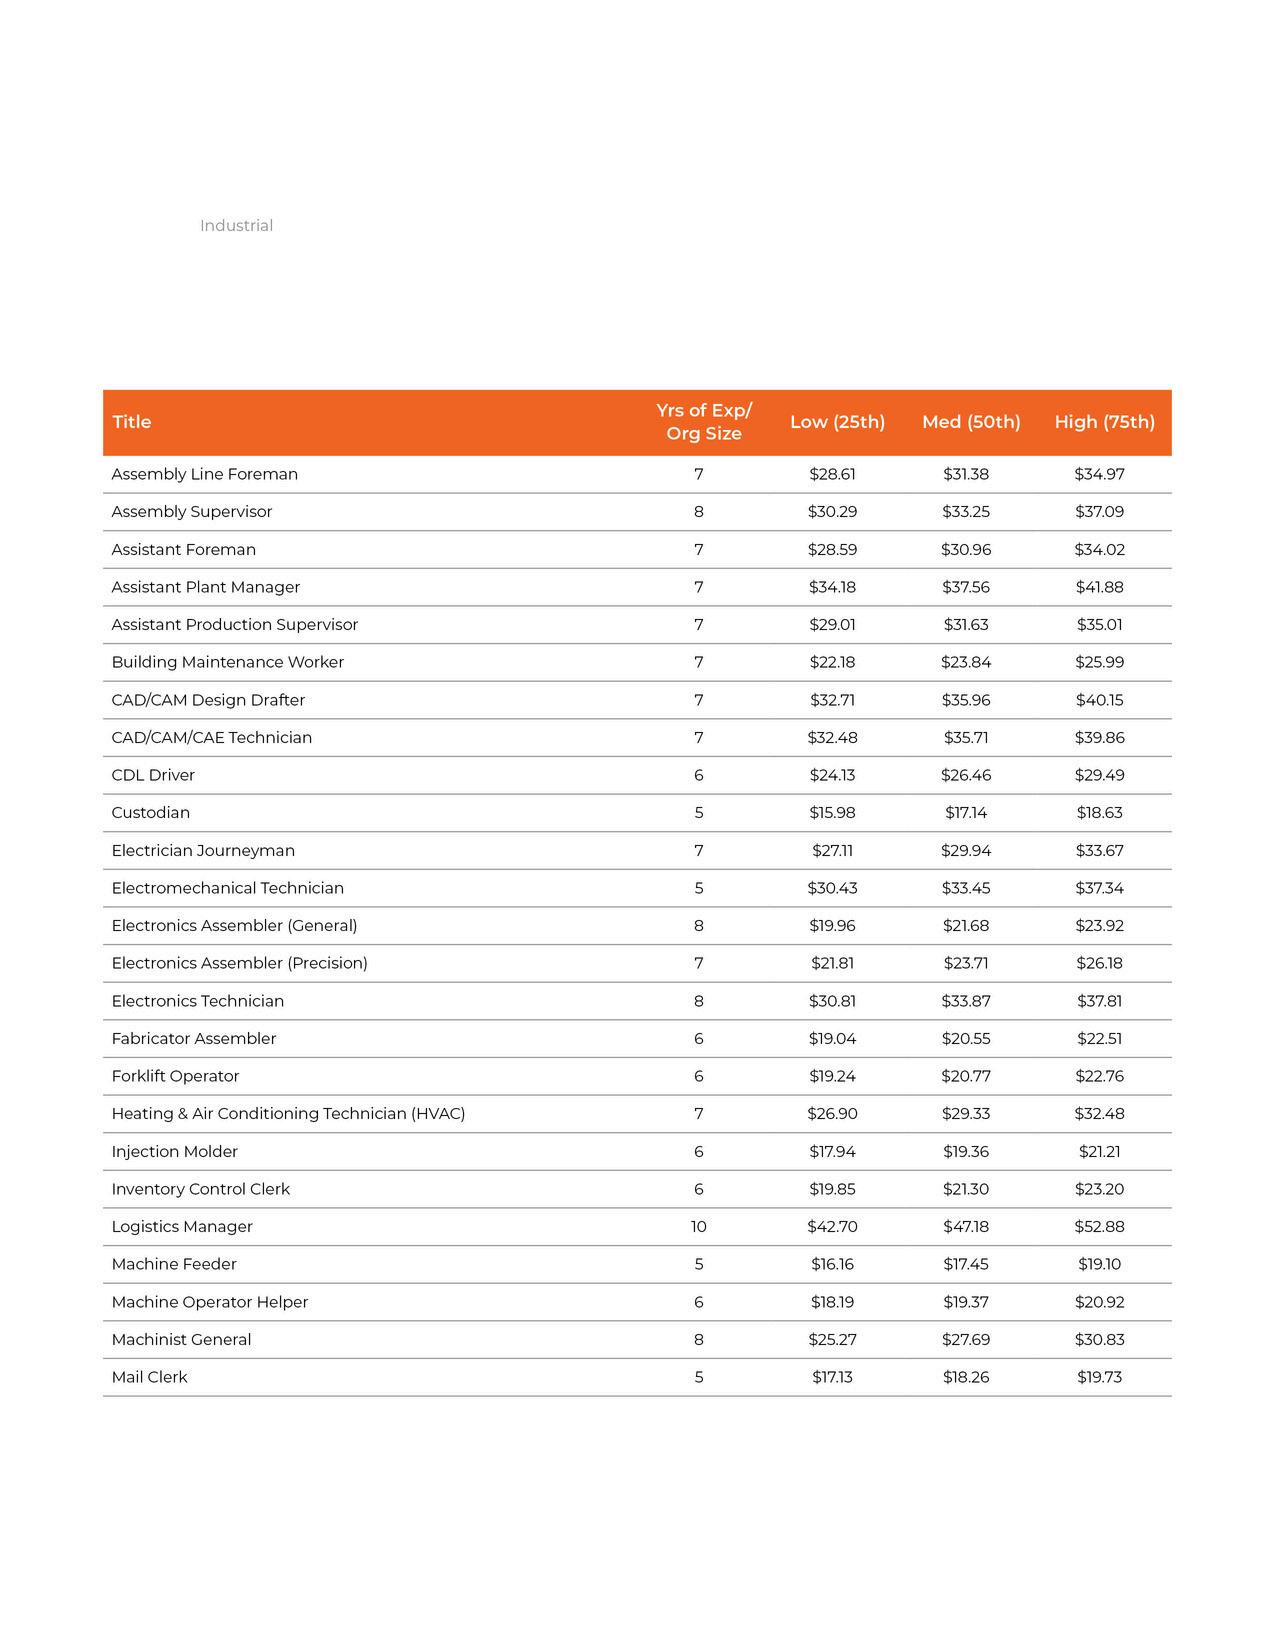
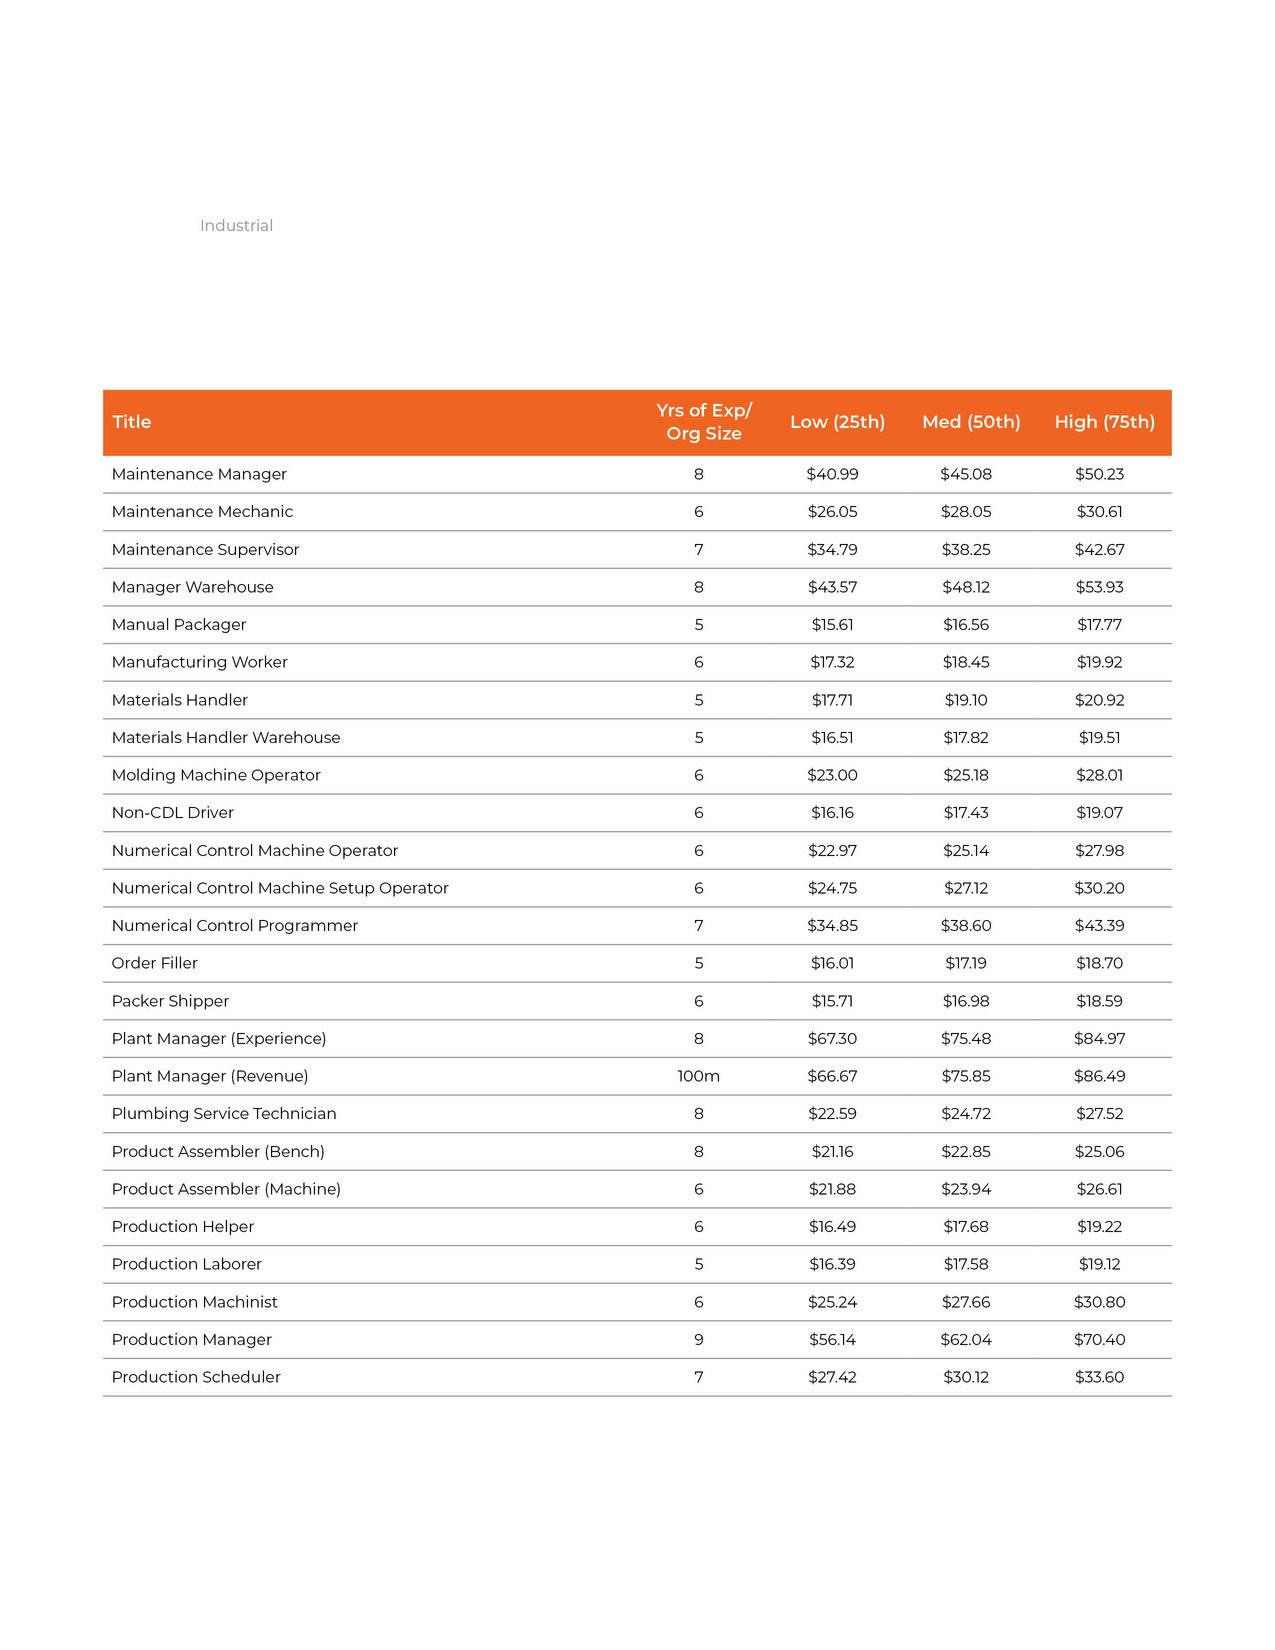
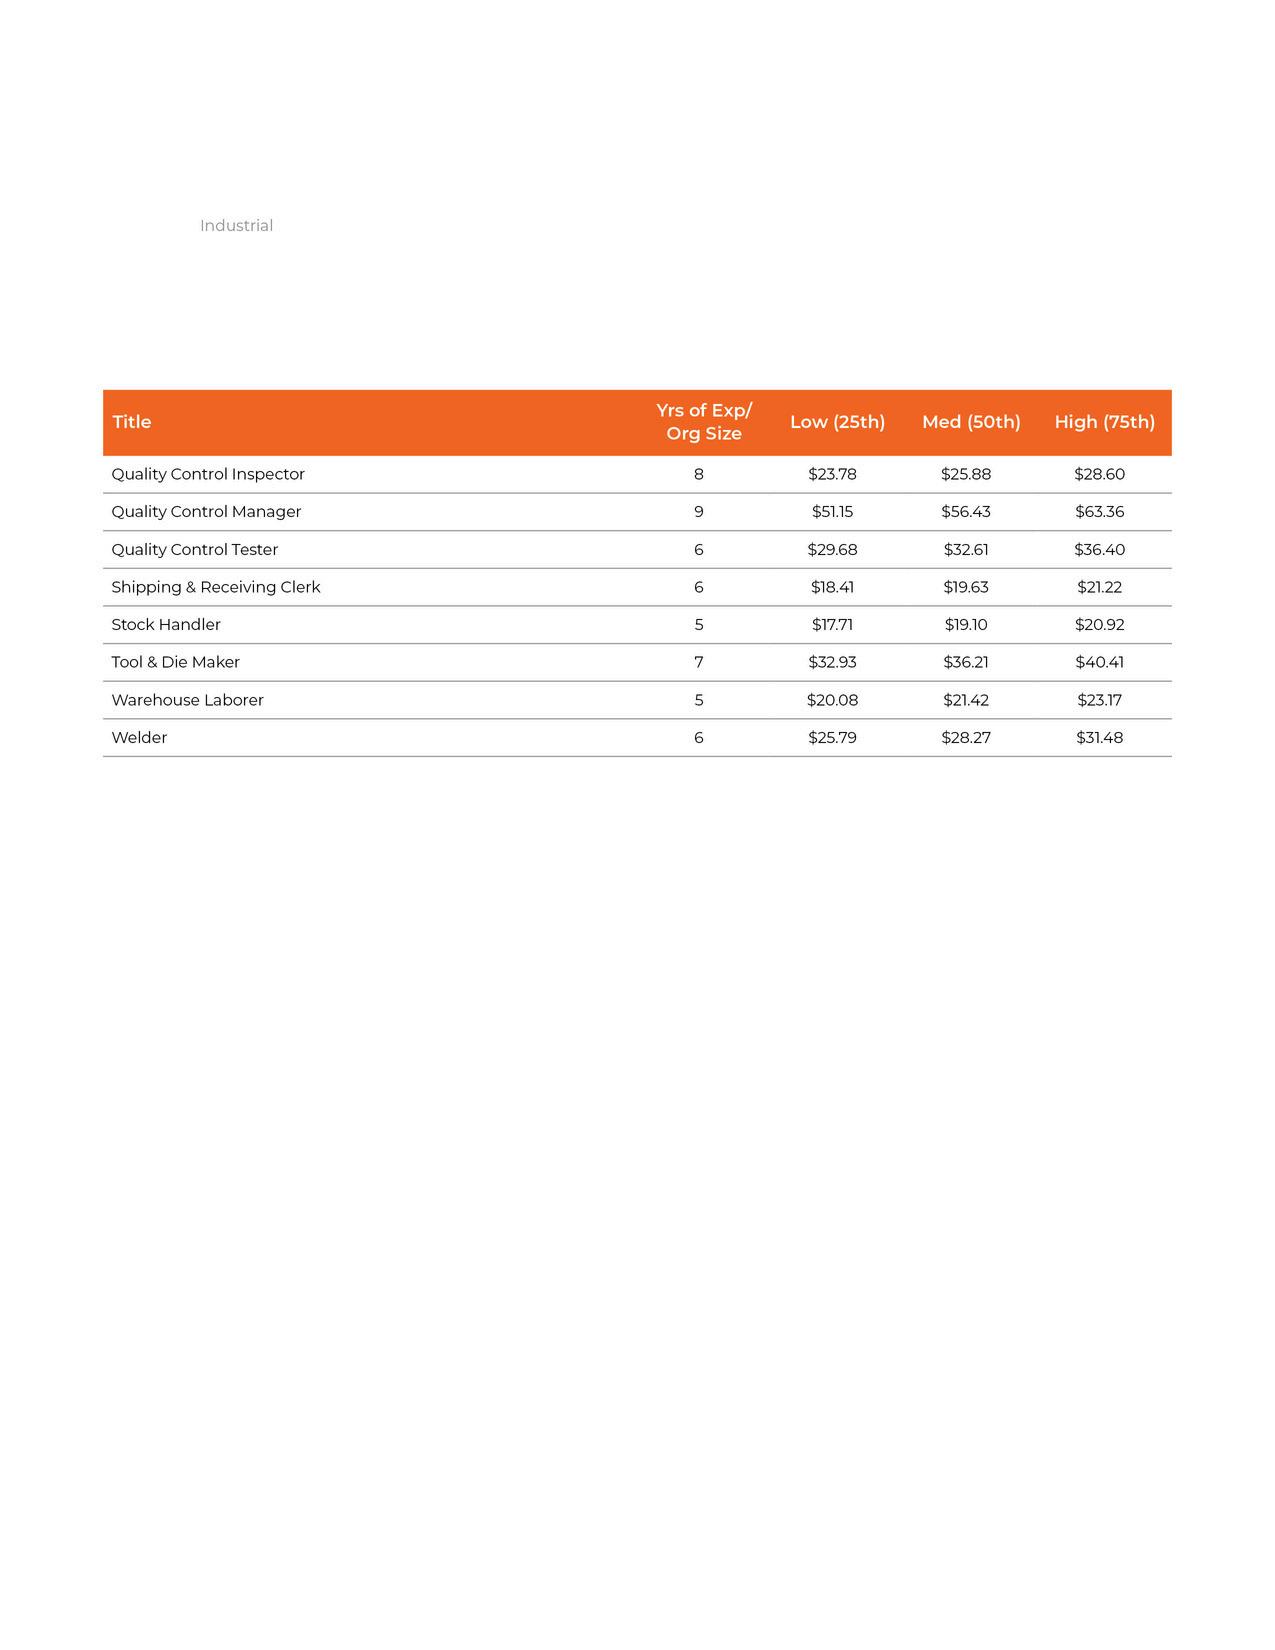
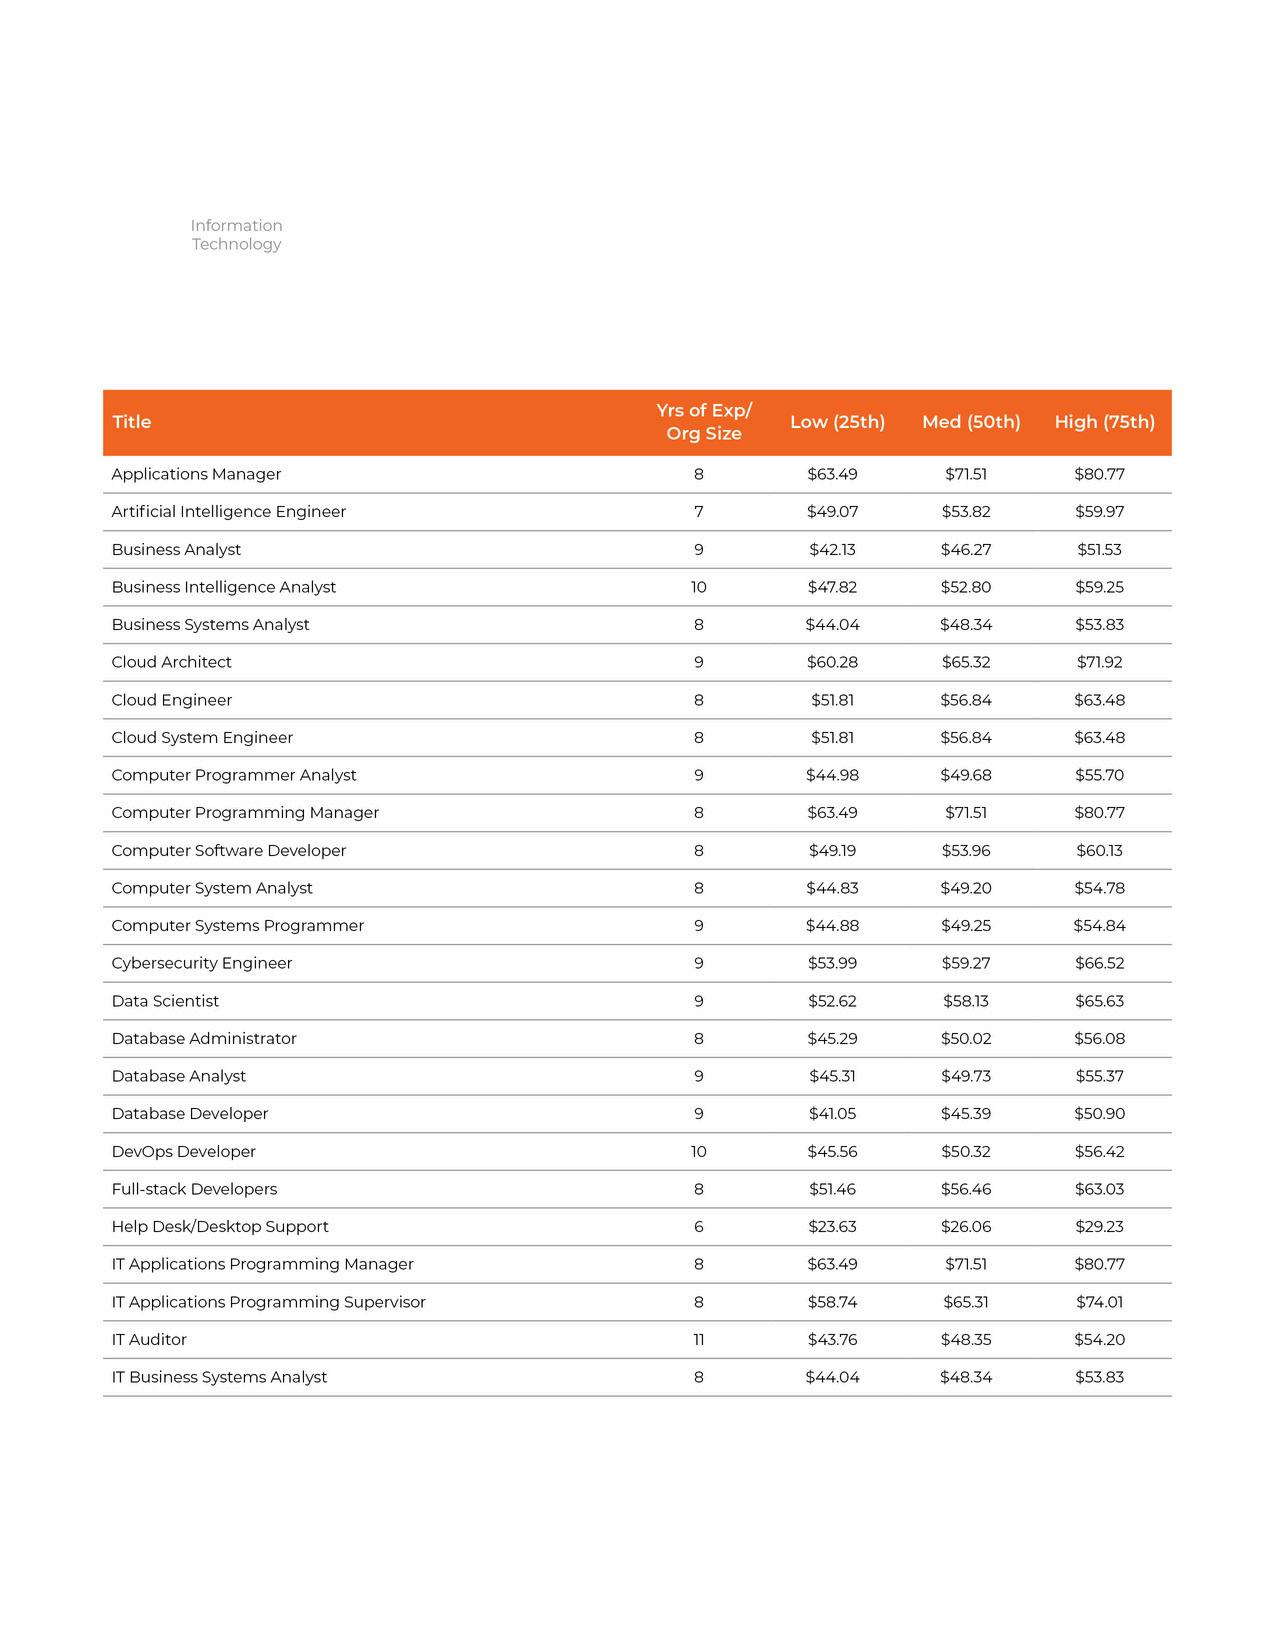
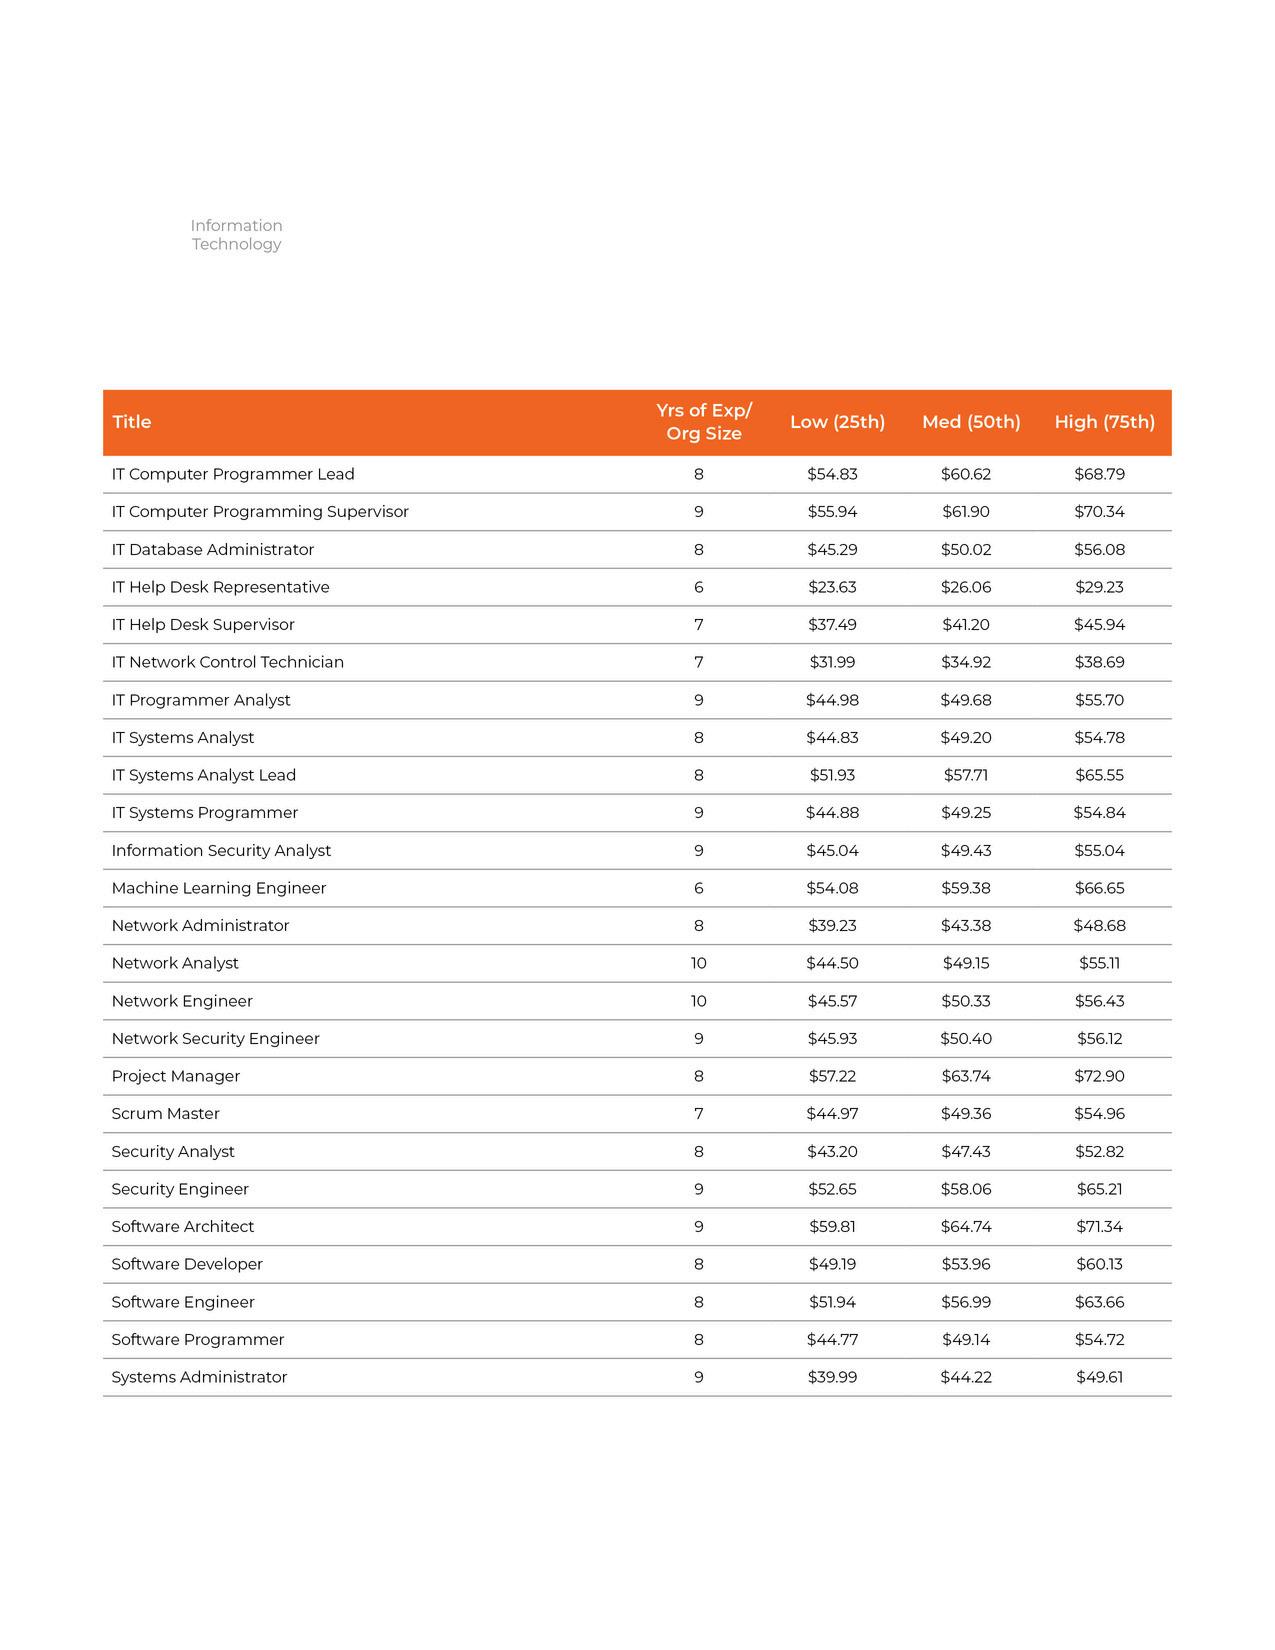
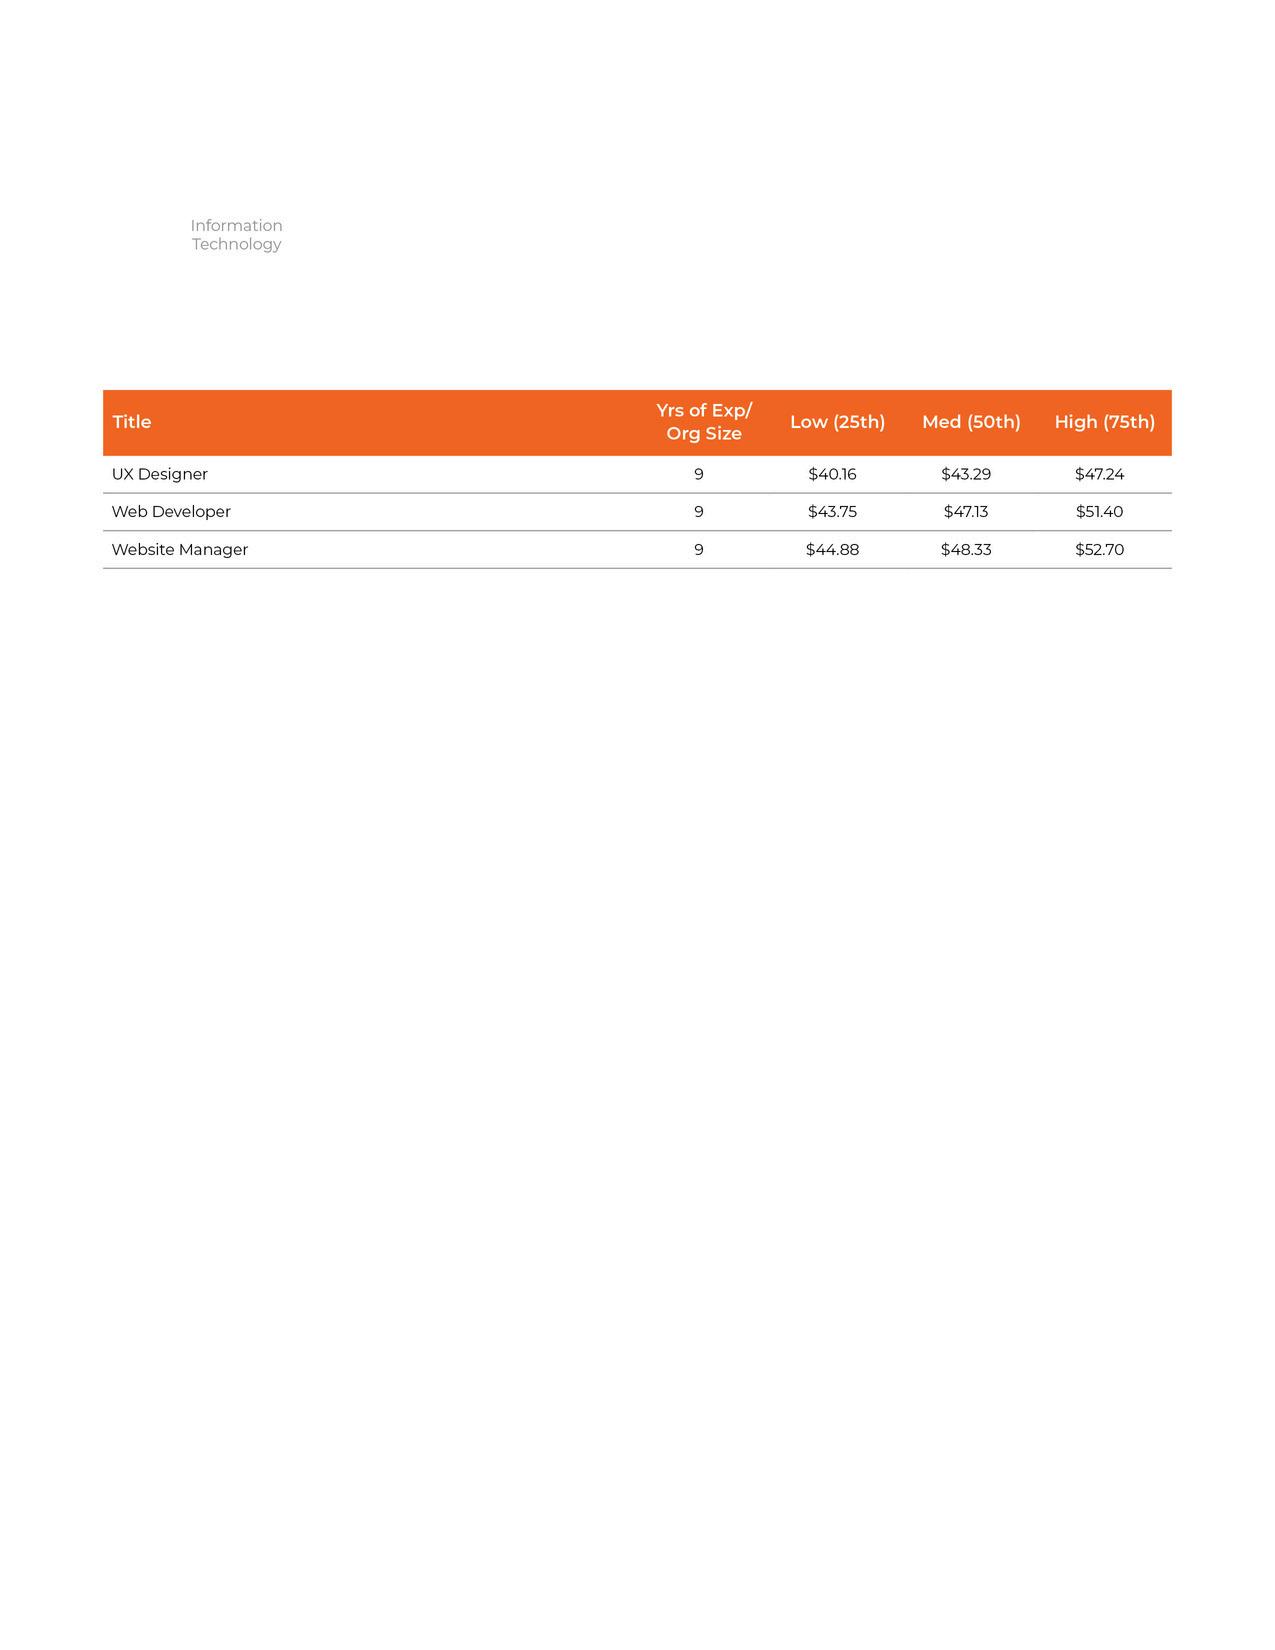
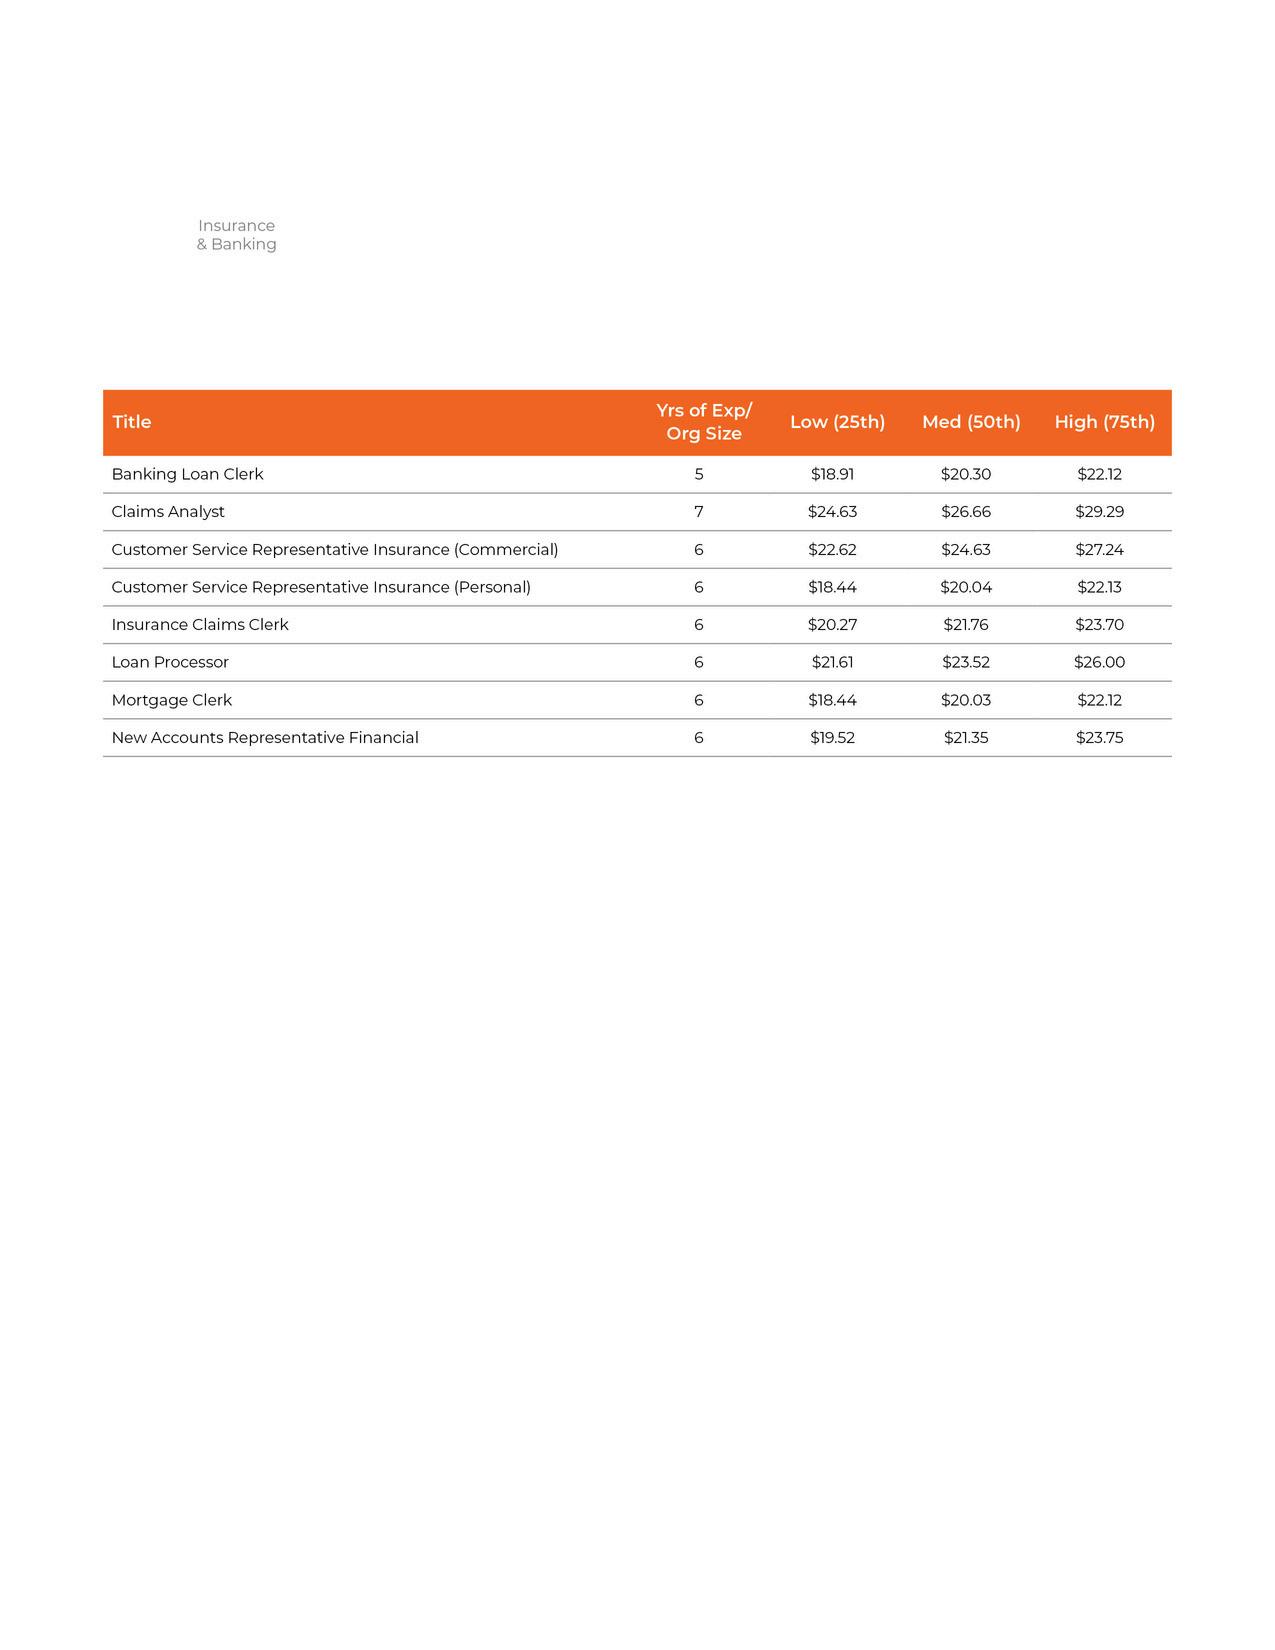
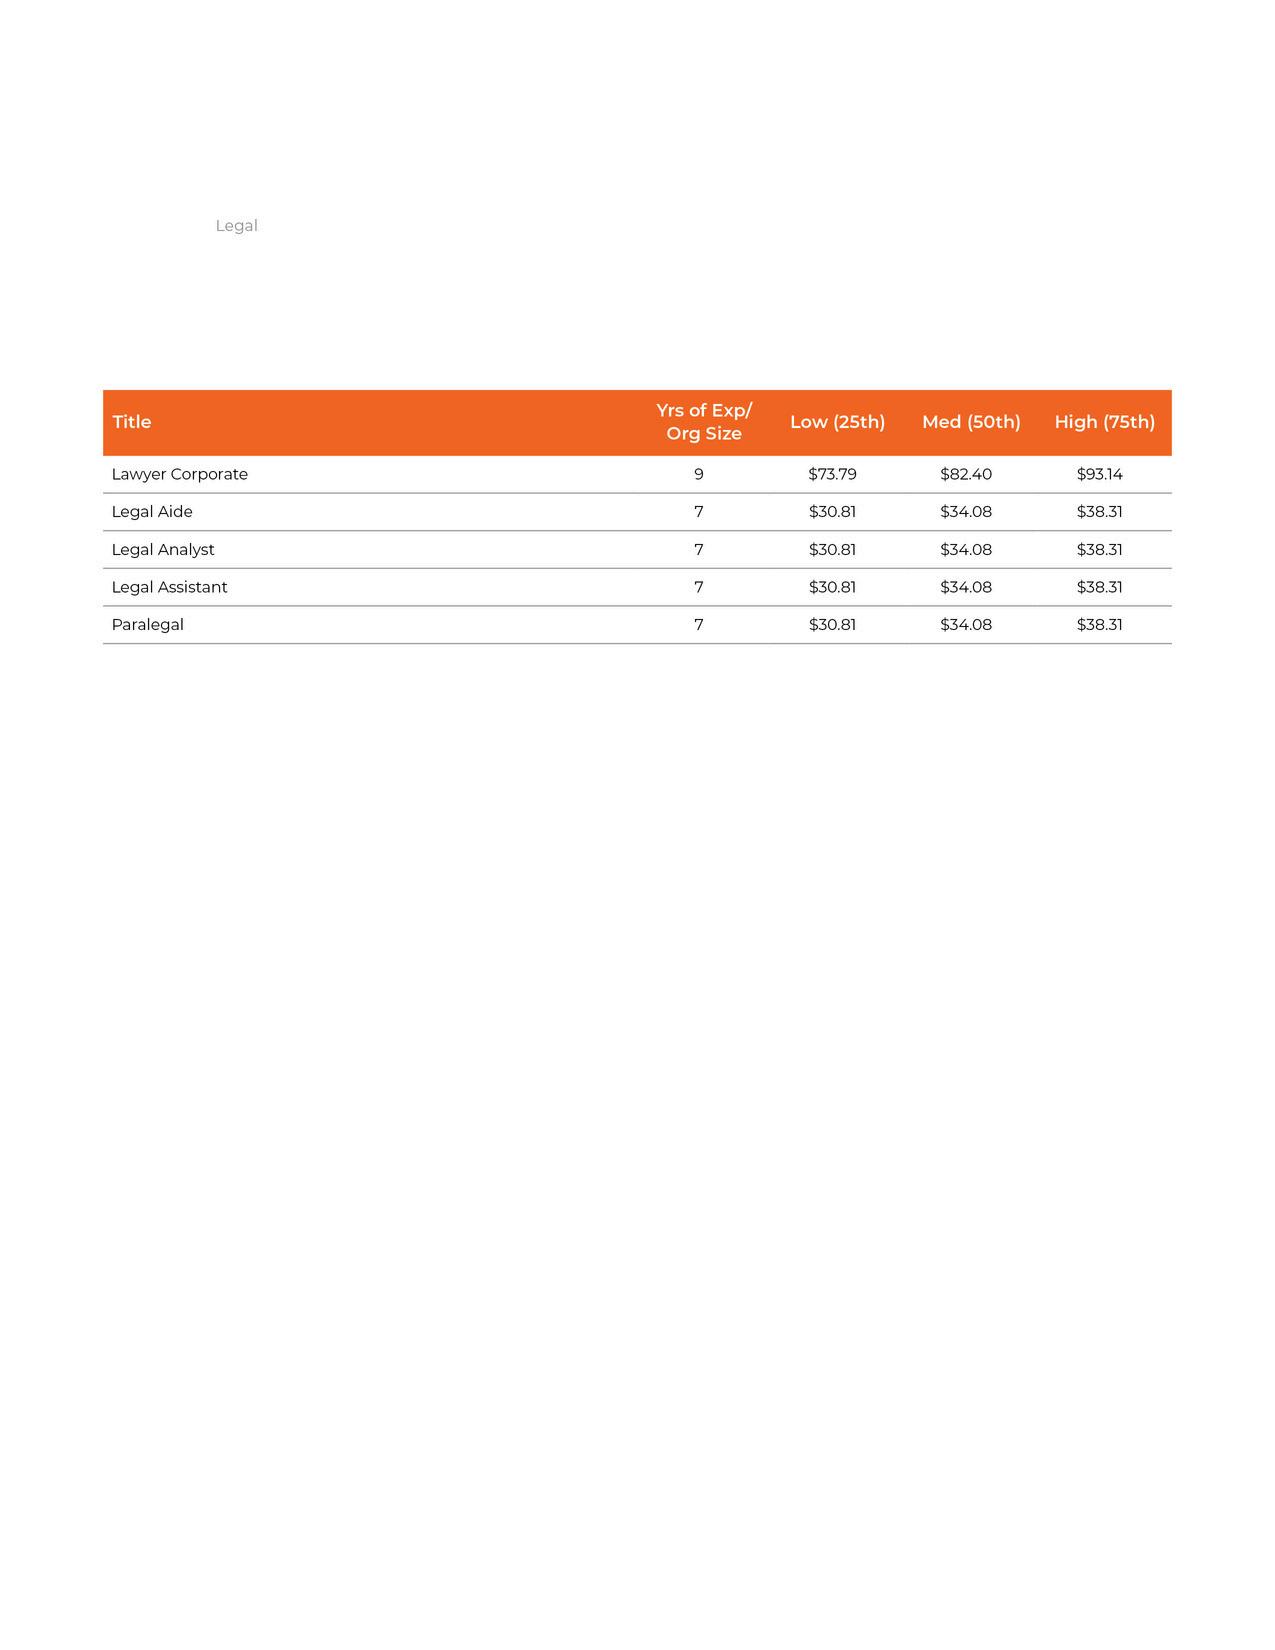
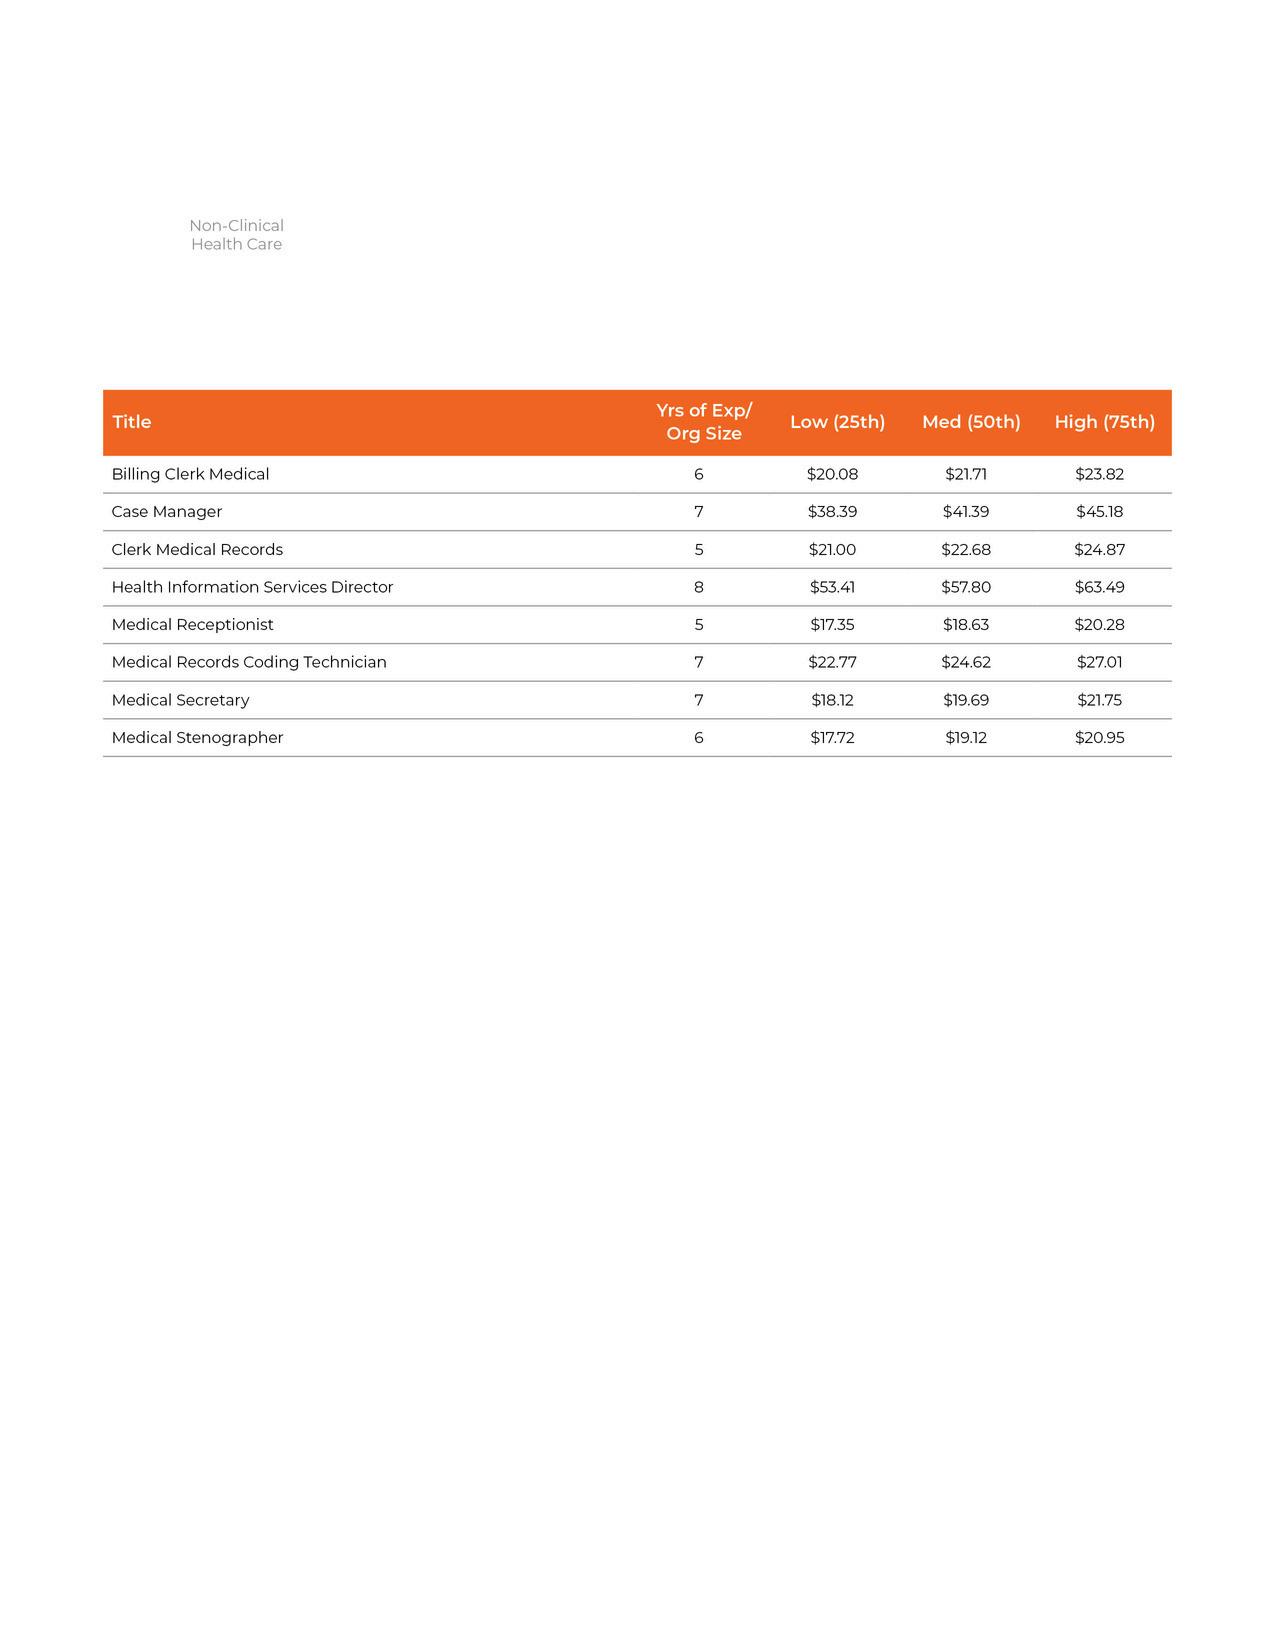
The median percentile (50th) represents the midpoint of salary ranges for that specific title based on average years of experience indicated to the left The low (25th) percentile means that 75% of the salary ranges for that given title & years of experience are higher, 25% are lower The high (75th) percentile means that 25% of the salary ranges for that given title & years of experience are higher, and 75% are lower
This shows the position for which each row of compensation data applies
For more information on a given position and what it entails, please refer to the Job Description document
The years of experience indicate that the compensation estimates are based on that job title with that specific amount of experience
When you see a $100m in the row, this indicates that the compensation estimates are based on that job title at an organization with a size of $100m in revenue. The revenue-based calculation is typically done for executive-level roles
Thedollaramountsrepresenttheestimated compensationpaidhourlyinthemarketforthegiven jobtitle,basedondatawesourcefromERI,the EconomicResourceInstitute
FormoreinformationonERI,visitwwweriericom