MARKET AT A GLANCE OCTOBER 2022
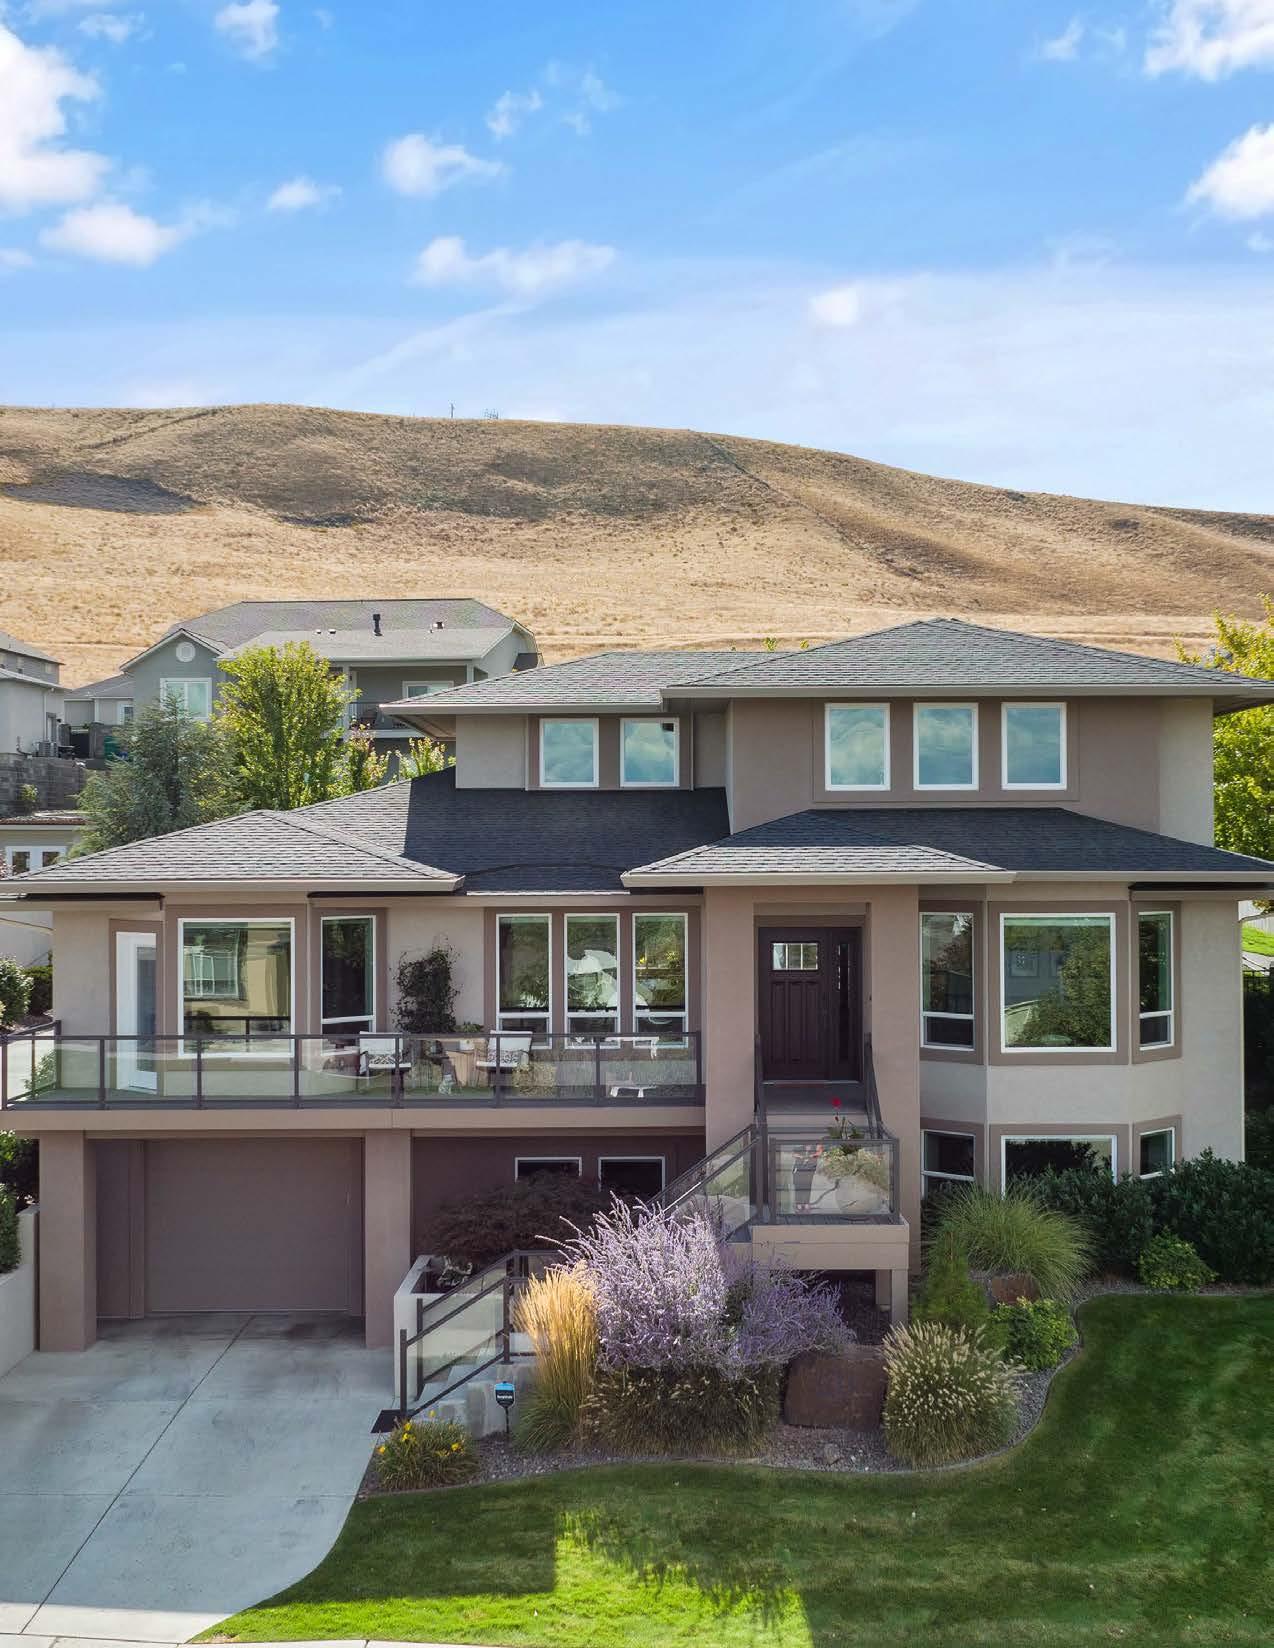


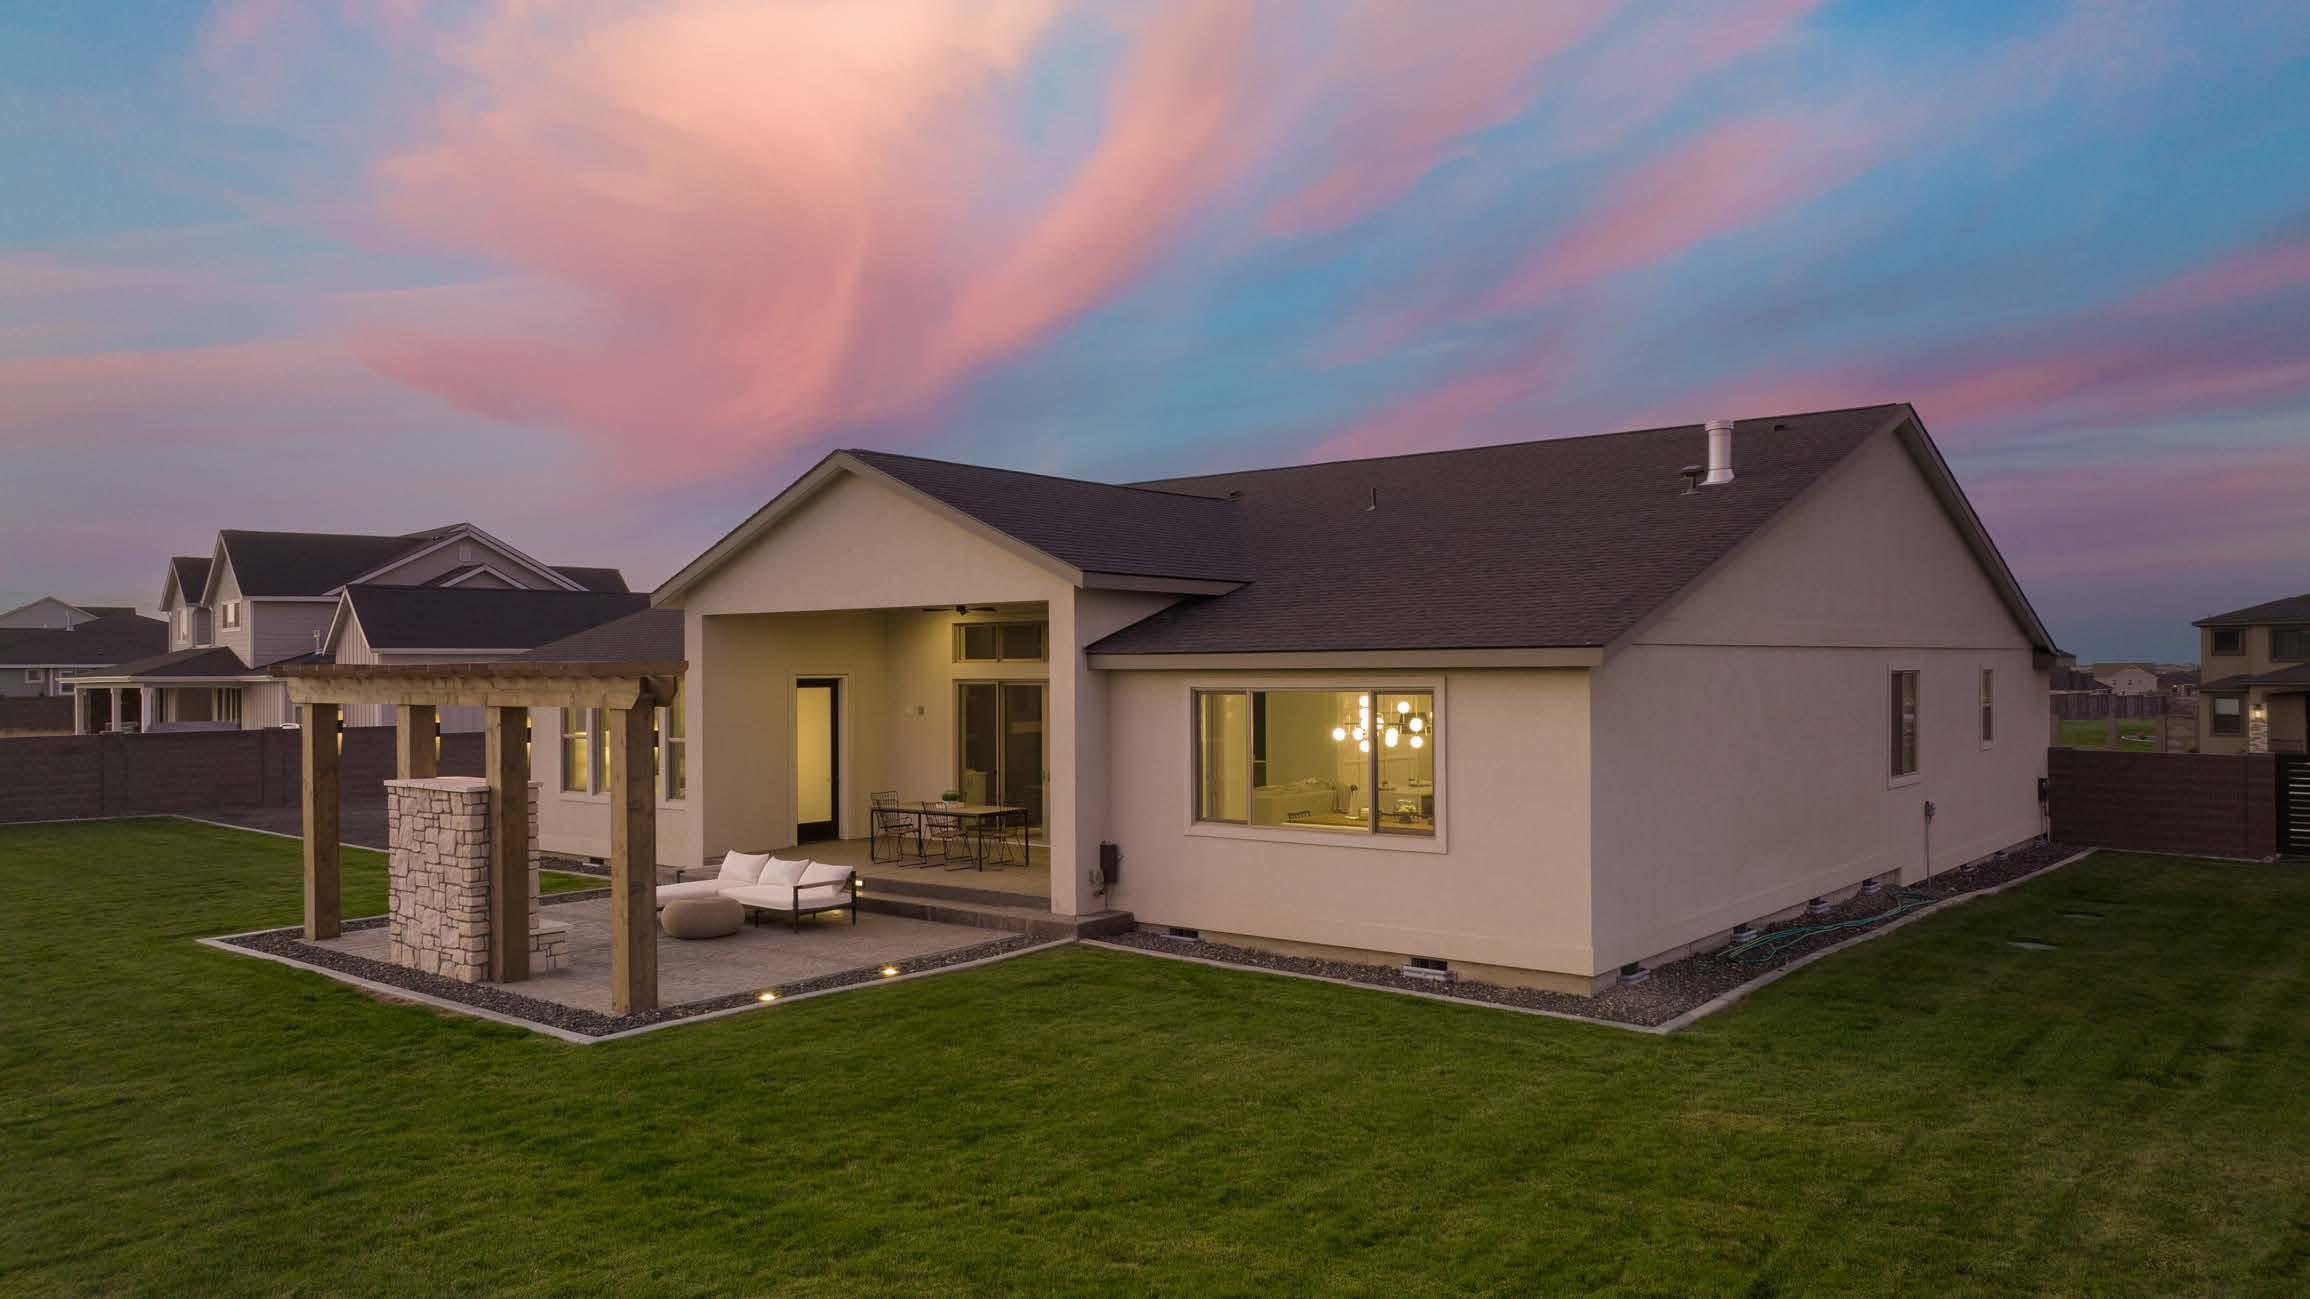
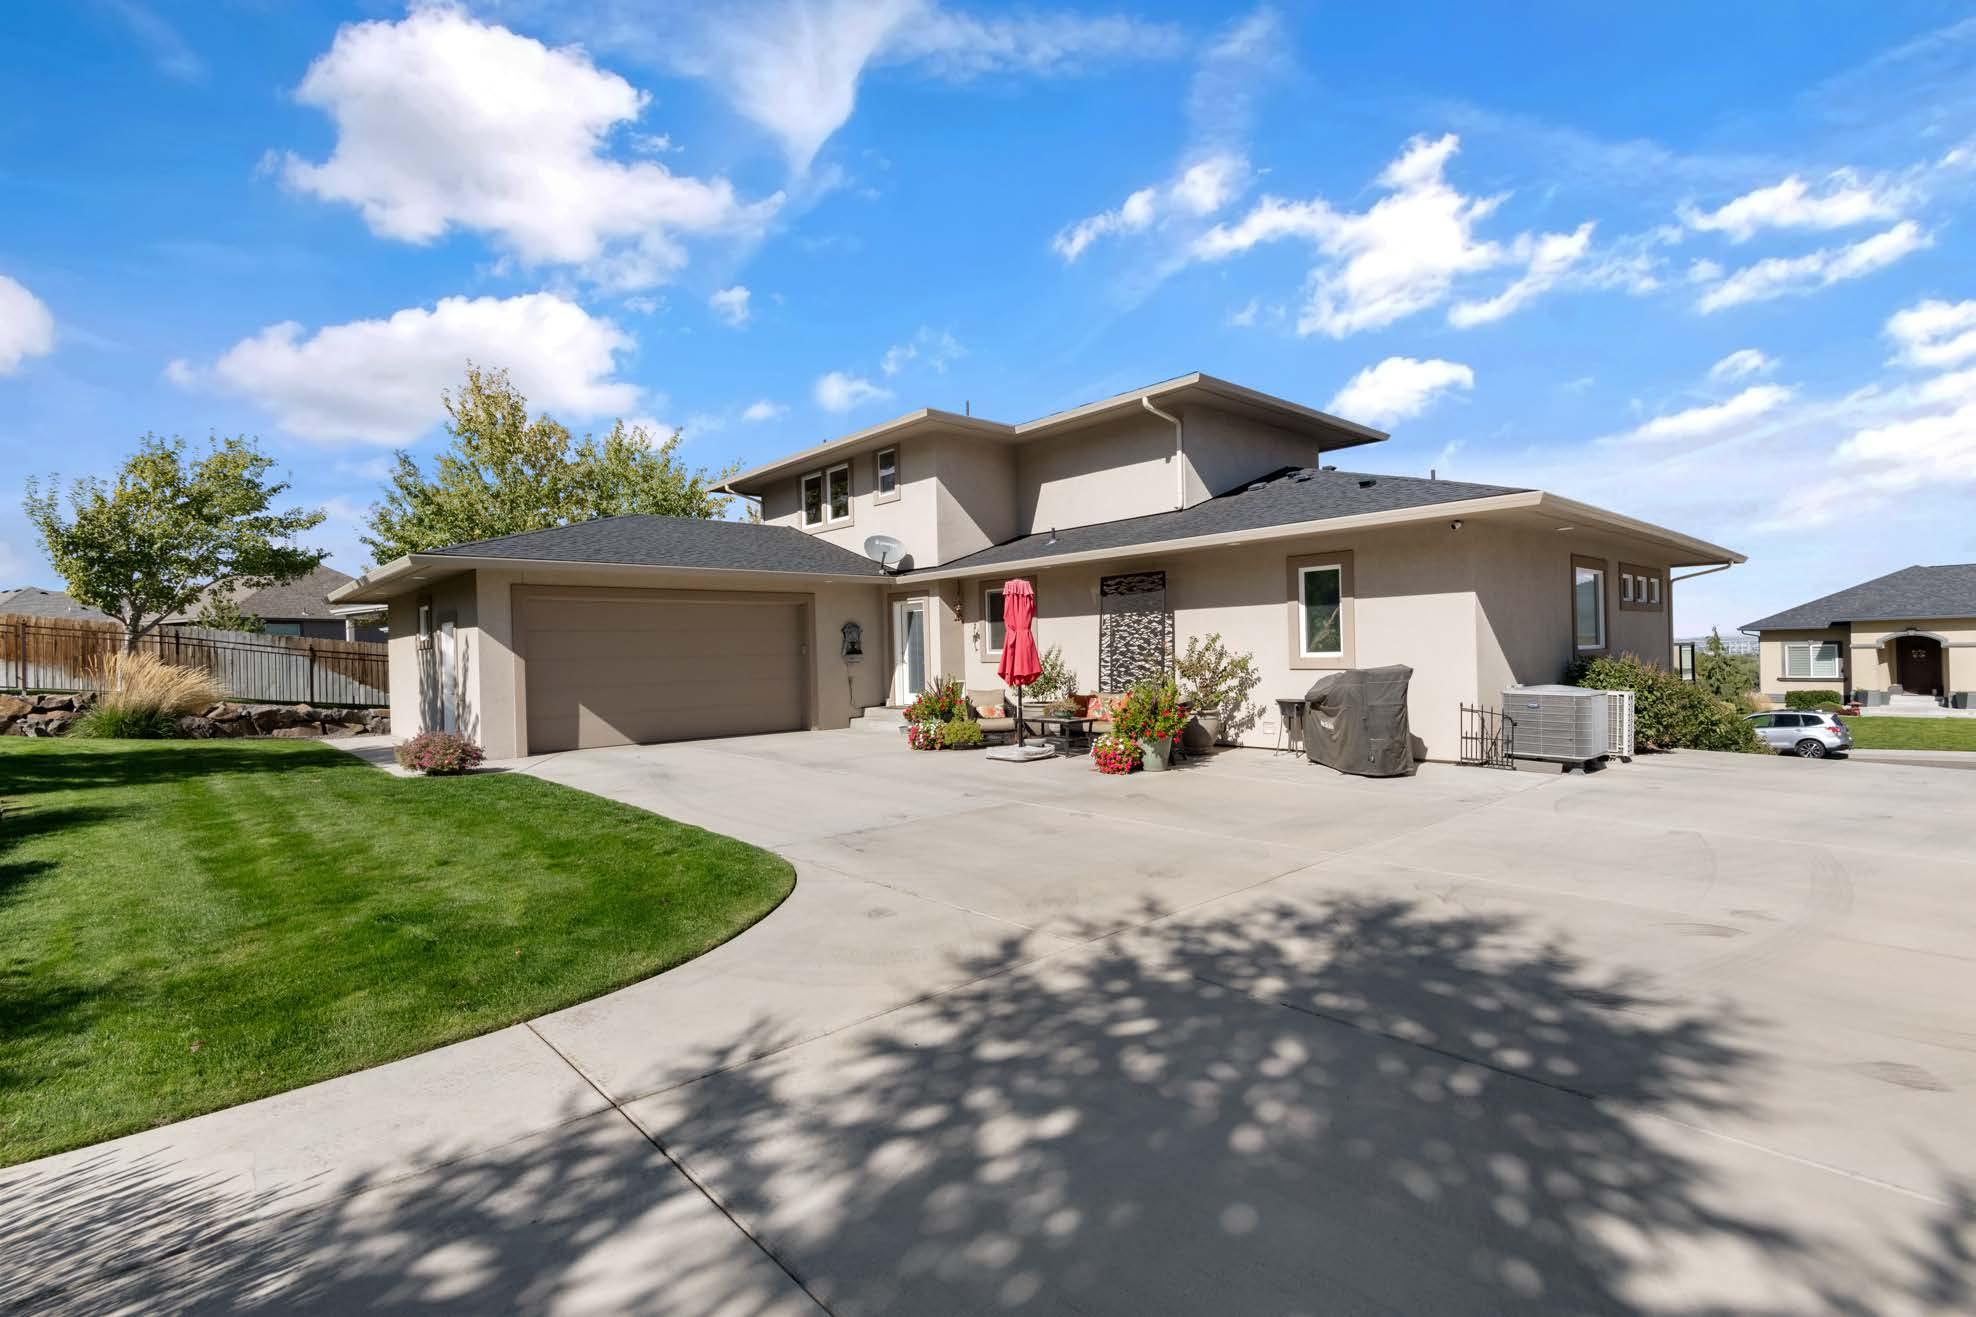
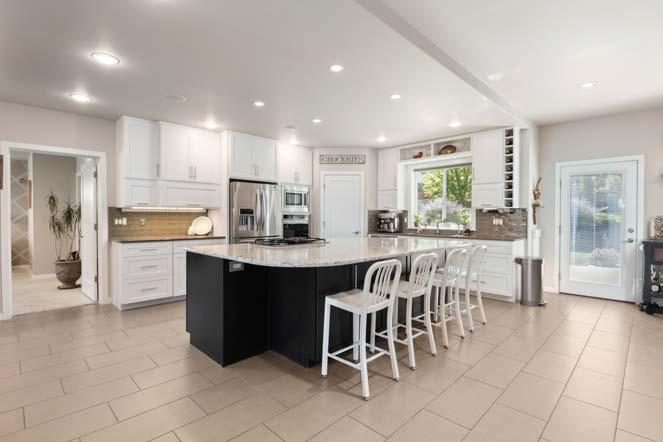
2211 W. 50TH AVENUE | KENNEWICK, WA
TABLE


WA | MLS# 265097
YEARLY RESIDENTIAL SALES SALES ACTIVITY 12
INVENTORY ABSORPTION RATES MARKET STATS
OF CONTENTS YEARLY AVERAGES
MONTH COMPARISONS
YEARLY AVERAGES SALES PRICE COMPARISON 2022 is YTD $475,229 $410,664 $348,375 $324,085 $299,658 $270,189 $247,639 $227,280 $216,270 2022 2021 2020 2019 2018 2017 2016 2015 2014

YEARLY RESIDENTIAL SALES Yearly Residential Sales YTD Sales 3 3 2 8 3 9 8 5 4 2 0 4 4 1 8 4 4 2 2 7 4 3 2 7 4 7 9 4 4 7 2 2 3 3 2 6 2014 2015 2016 2017 2018 2019 2020 2021 2022
Homes built prior to 1990 Homes built after 2010 - RESALE ONLY 2022 is YTD 2022 is YTD AVERAGE SALES $353,607 $312,485 $267,296 $248,214 $226,907 $198,426 $181,285 $165,564 $155,412 2022 2021 2020 2019 2018 2017 2016 2015 2014 $535,612 $471,174 $402,311 $368,082 $346,100 $313,700 $295,200 $282,500 $263,900 2022 2021 2020 2019 2018 2017 2016 2015 2014
Homes built between 1991 and 2009 Homes built after 2010 - NEW CONSTRUCTION 2022 is YTD 2022 is YTD SALES PRICE $456,600 $411,777 $348,339 $327,478 $299,294 $279,727 $258,939 $236,707 $227,094 $460,881 $411,777 $348,339 $327,478 $299,294 $279,727 $258,939 $236,707 $227,094 2022 2021 2020 2019 2018 2017 2016 2015 2014 $554,601 $453,654 $385,120 $365,355 $380,600 $332,500 $315,000 $290,000 $279,400 2022 2021 2020 2019 2018 2017 2016 2015 2014
LAST 12 MONTHS Kennewick 1631 34% Outlying Areas 388 9% West Richland 353 8% Richland 1224 27% Kennewick 1557 35% Pasco 962 21% SALES ACTIVITY
NEW VS. RESALES Last 6 months (April 2022 - September 2022) Resale 1991 85% Kennewick 120 Pasco 88 Richland 181 W. Richland 32 New Construction 421 15% 120 88 181 32 766 466 593 166 Ke nnewick Pasco Richland WestRichland NewConstruction Re-Sale
MONTH COMPARISONS INVENTORY
800
500 600 700
200 300 400
0 100
JanFebMarAprMayJunJulAugSepOctNovDec 2017389348375419451548626648674614537468 2018 430426459479526 559600643647626599564 2019 494437426439490497563662694695633564 2020 526498480474458468477439442408359351 2021282230168161155197250328365384399338 2022270276298313387502593580679720
12
600
500
400
300
200
100
0
JanFebMarAprMayJunJulAugSepOctNovDec
2017255308395350429377405376316357342260
2018322316395356426384402369347340260234
2019 328249397402450425424417407380308247
2020 340427391324445464466503458452338259 2021 387374464362427364391418385408359266 2022 298342375373374309339324255188
TOTAL SALES
JanFebMarAprMayJunJulAugSepOctNovDec
2017 211205336337372412363419377360349369
2018271262348358355386409411319406333258
2019246246276313325441415428379415345359
UNDER CONTRACTS
2020295308382328314430506423472496427409 2021 303310382390409452436418430408361403 2022 259275372351381369332356329266 0 100 200 300 400 500 600
PRICE BREAKDOWN INVENTORY Total Active = 720 7 1% 11 2% 42 6% 107 15% 120 17% 132 18% 136 19% 60 8% 43 6% 25 3% 37 5% $1,000,000+ $600,000$699,999 $500,000 $599,999 $900,000 - $999,999$700,000$800,000-$899,999 -$799,999 $400,000$499,999 $300,000$399,999 $200,000-$299,999$100,000-$199,999$0-$99,999


CURRENT LISTING INVENTORY 6 8 6 3 1 4 3 2 3 1 6 3 1 1 2 1 1 4 3 4 Ke nnewick Pasco Richland West Richland New Construction Re-Sale
SOLDS Total Closings = 266 $1,000,000+ -$699,999 $900,000 $999,999 $800,000 $899,999 $700,000 - $799,999 $400,000 $500,000 -$5 99 , 99 9 $400,000$499,999 $1,000,000+ $400,000$400,000$499,999 $ 5 00 , 000 $ 5 $699999 , $700000 $799999 , , $800,000 $899,99 5 2% 10 4% 21 8% 73 28% 63 24% 41 15% 19 7% 14 5% 6 2% 6 2% 8 3% $300,000$399,999 $200,000$299,999 $100,000$199,999 $1,000,000+ $600,000$699,999 $500,000$599,999 $900,000 $700,000$800,000-$799,999 $400,000 $499,999 $0
UNDER CONTRACTS Total Under Contract = 188 5 3% 8 4% 20 11% 68 36% 39 21% 23 12% 13 7% 8 4% 1 0% 1 1% 2 1% $1,000,000+ $600,000 $699,999 $500,000$599,999 $900,000 $999,999 $800,000 $899,999 $700,000 $799,999 $400,000-$499,999 $300,000-$399,999 $200,000-$299,999 $100,000-$199,999 $0-$99,999
1111 12 Source:
Census and
Tri-Cities, MSA........................................................................................
.............
...................
Benton County................................................................................
................
....................
Kennewick.......................................................................................
.............
........ ......
Richland................................................................................... ........
..............
......................
West Richland...................................................................... ...........
...................
.......................
Franklin County................................................................................
............. ....
..............
Pasco........................................................................................ .........
................
............. ........
2000 Census 2010 Census 2019 Estimate Household: Kennewick, WA............................................... .......................... $62,203 Pasco, WA...................................................... ..................... .......... $66,735 Richland, WA................................................................................ $78,798 Kennewick, WA............................ ............................ .................. $58,277 Pasco, WA........................................................................... .......... $58,669 Richland, WA............................................................................... $69,063 Average Selling Price(January 2020)............................ $313,200 Active Listings(SFR, January 2020)........ ................................. 464 Average Apartment Rent(2 bed, 2 bath)............................. $964 Median Household Income.............. Average Household Spending........ Housing................................................... Cost of Living: Tri-Cities, WA....................................................................... 97.8 ....................
...............
............................
Yakima, WA...........................................................................
...................
............ ..
............................
Spokane, WA....................................................................
................. .
................
..........................
Seattle, WA........................................................................
.............. ..
......... .....
............. ...............
Portland, OR.....................................................................
.................
................
...........................
Boise, ID............................................................................... 98.4 ....................
................
.................. ........
Housing Utilities Transportation Composite Index 329 North Kellogg Street, Kennewick, WA 99336 | 509.783.8811 | rcsothebysrealty.com MARKET STATS
U.S.
Washington O ice of Financial Management Forecasting Division, July 2019 Population:
191,822
253,340
296,480
142,475
175,177
201,800
54,751
.... 73,917
........ 83,670
38,708
. 48,058
56,850
8,385
. 11,811
15,340
49,347
78,163
....... 94,680
32,066
. 59,781
75,290
99.7
92.1
112.2
96.1
80.7
83.3
114.5
100.3
99.3
97.5
108.5
156.7
225.0
108.1
137.6
134.0
184.3
87.2
130.8
96.5
82.0
130.2


