


ROB CHAPMAN | 0428 577 202
RAY WHITE MANNING VALLEY

Australian house and unit prices continue their upward trend this month, albeit at a slower pace. Both housing types saw a modest 0.2 per cent appreciation. However, the market is exhibiting greater diversity across states and regions, reflecting varying local economic conditions.
July’s CPI results indicate a continued downward trend, approaching the target two to three per cent band, suggesting potential interest rate reductions in 2025. This has boosted optimism and is expected to lead to a busy spring sales period, with preliminary listing authorities showing a sizeable increase.
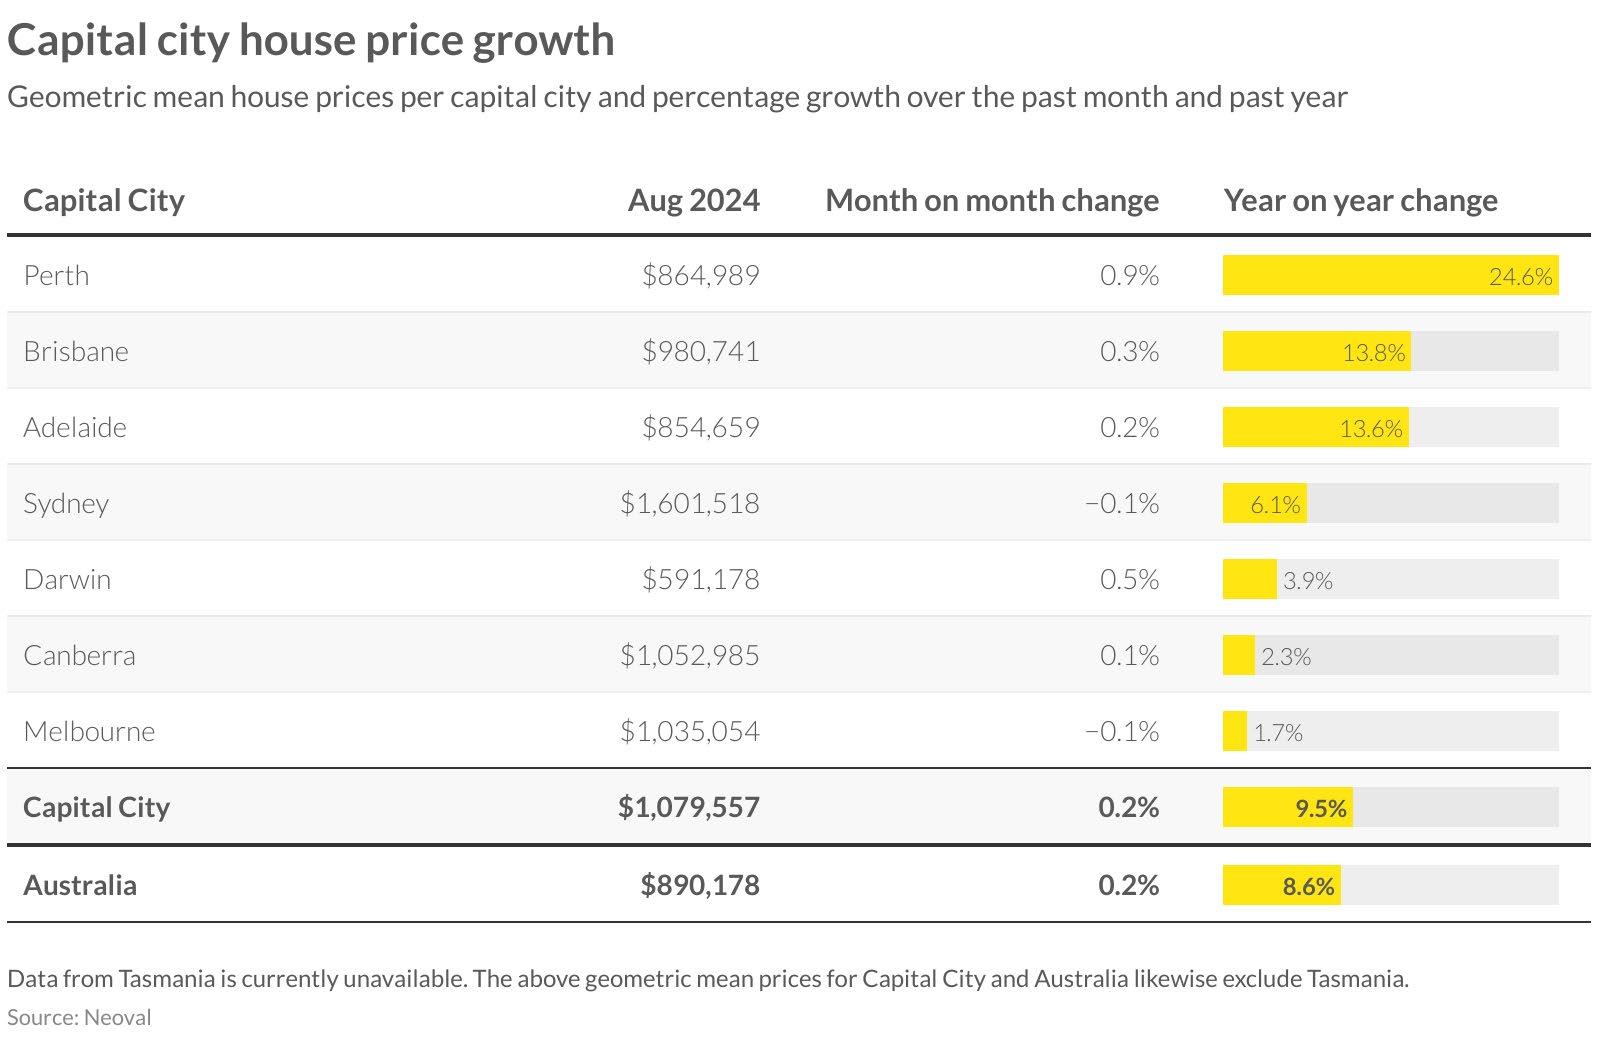
Over the past year, house prices have risen by 8.6 per cent, bringing the national mean to $890,178. Similarly, unit prices have increased by 6.7 per cent annually, reaching a nationwide mean of $664,466.

This past month saw varied price growth across Australian markets, further widening the value gap nationwide. Melbourne continues to struggle, hampered by taxation and government uncertainties, dropping 0.1 per cent this month and recording a mere 1.7 per cent annual improvement, the country’s lowest. Sydney’s market has also cooled, with median prices falling 0.1 per cent monthly, though annual growth remains at 6.1 per cent in Australia’s most expensive city.
Perth maintains its strong performance, leading with a 0.9 per cent monthly increase and 24.6 per cent annual growth, reaching a mean of $864,989. Brisbane, benefitting from similar factors as Perth (limited new supply and continued population growth) has moderated from its rapid increases, rising 0.3 per cent this month to $980,741. Adelaide’s results mirror Brisbane’s, growing 0.2 per cent monthly or 13.6 per cent annually, bringing house prices to $854,659.

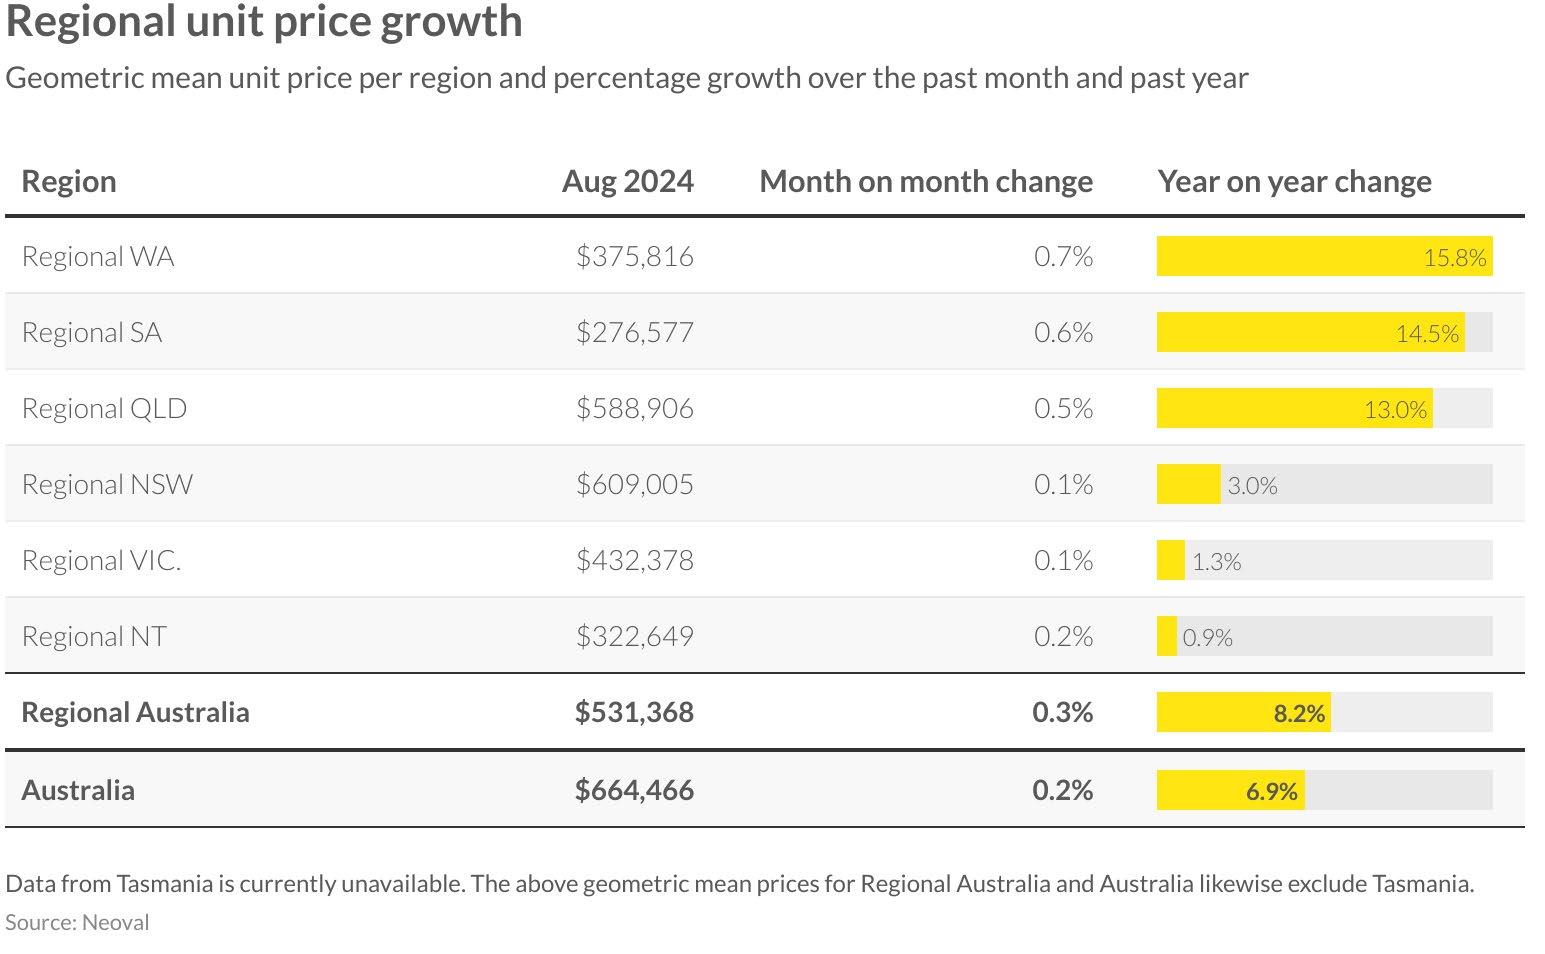
This month, all unit markets showed price increases, reflecting the affordability of this housing option, after previous volatility. Perth leads the way, mirroring the housing sector with one per cent monthly growth and over 20 per cent annual increase, reaching $553,822. Adelaide continues its strong performance with a 15.9 per cent yearly increase, or 0.4 per cent monthly growth, matching Brisbane and Darwin’s monthly growth rates.
Sydney, Canberra, and Melbourne experienced minimal changes, albeit upward, each recording just a 0.1 per cent uplift. Melbourne’s market continues to see investor exodus, leading to increased listings and potential short-term price moderation. It grew only 1.6 per cent over the year to $633,107, falling below the national average. Sydney remains the most expensive market at $886,394, up 4.4 per cent annually, followed by Canberra at $629,705.


Regional property markets across Australia are displaying greater uniformity in results this period. House values in these areas have appreciated by 7.2 per cent year-on-year, though still trailing the national average of 8.6 per cent. Regional Western Australia continues to lead, albeit with signs of deceleration, posting a 0.8 per cent monthly gain to reach $497,499, and boasting the highest annual growth at 16 per cent. Close behind are Queensland and South Australia, with yearly increases of 13.9 per cent and 13.5 per cent respectively. Both maintained their upward trend, rising 0.5 per cent this month to $694,950 for Queensland and $431,780 in South Australia.
Regional Victoria remained static this month, with a minimal 0.2 per cent annual increase. Northern Territory showed comparable performance, with a 0.3 per cent yearly gain. Regional New South Wales sits between the top and bottom performers, recording a 0.1 per cent monthly change and a modest 3.7 per cent annual growth.


This period, regional unit markets have outpaced regional housing performance, as the trend towards affordability persists. Regional Western Australia, South Australia, and Queensland remain at the forefront of growth, with monthly increases of 0.7 per cent, 0.6 per cent, and 0.5 per cent respectively. Western Australia has solidified its leading position in annual growth at 14.6 per cent, with South Australia following at 13.2 per cent. These two markets continue to attract buyers due to their comparatively accessible price points.
Victoria and New South Wales markets have seen minimal growth, each rising just 0.1 per cent this month. While New South Wales regional units maintain the highest median at $609,005, Queensland is narrowing the gap at $588,906. Regional Northern Territory has shown the weakest annual performance with a 0.9 per cent increase, despite a 0.2 per cent monthly uptick.
CAPITAL CITY HOUSE PRICES (%CHANGE) | SINCE LAST

LISTINGS ACTIVITY
At Ray White, we gauge upcoming listings through listing authorities - the point when a vendor signs an agent to sell their home. With our 15 per cent market share, this provides valuable market insights. Good news for buyers: nationally, our 28-day rolling sum of listing authorities is at an all-time high. All states show strong volumes, with Victoria | Tasmania leading, followed by South Australia | Northern Territory. New South Wales | ACT shows the smallest increase since last year.
Various factors drive this trend. Strong price growth in Perth, Adelaide, and south-east Queensland motivates sellers. In Melbourne, new investor taxes make rental properties less attractive. Hobart’s falling prices due to low population growth may also encourage listings.
This surge in listing authorities suggests a vibrant spring selling season ahead. Buyers can expect more options and potentially less competition per property. However, the impact on prices remains to be seen, as increased supply meets pent-up demand in many areas.
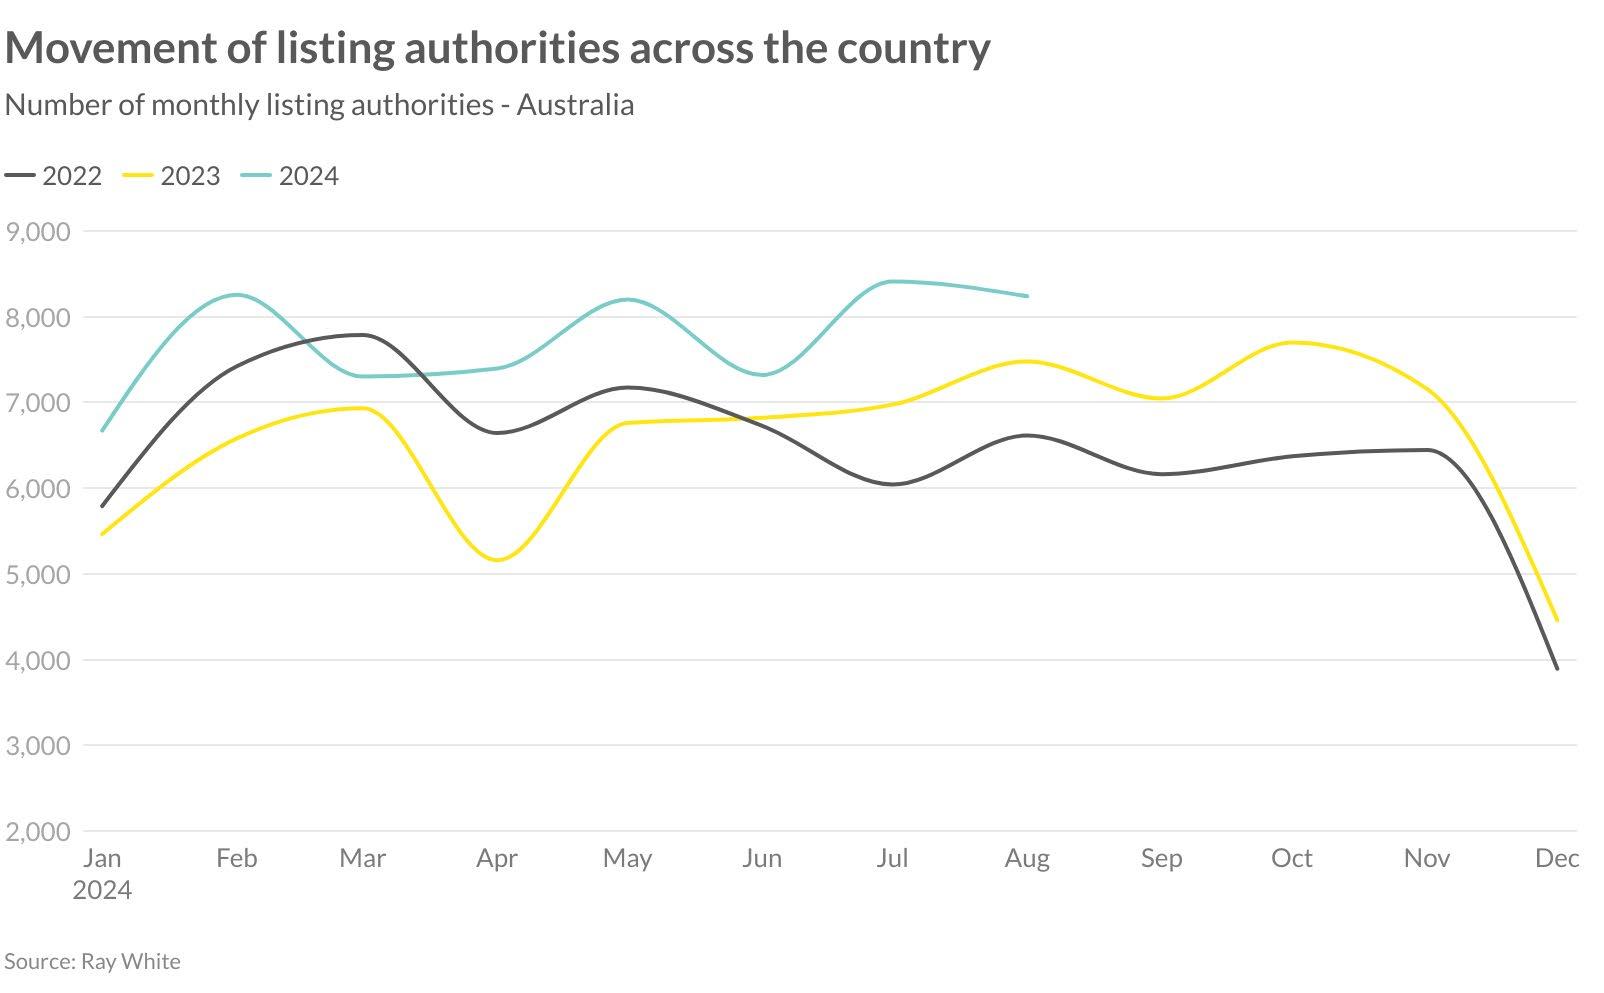
The property market appears to be emerging from a prolonged ‘holding pattern’, with preliminary data from July and August indicating a modest uptick in listing levels after a subdued June winter selling period. This shift suggests a turning point in market sentiment, moving away from the recent period of caution driven by inflation concerns and interest rate uncertainties. The growing optimism surrounding potential interest rate reductions later in 2024 is expected to catalyse a more active spring selling season. This change in outlook is likely to encourage both buyers and sellers who have been hesitant to engage in the market.
As economic confidence builds, we anticipate a surge in listing activities, with property owners who have been reluctant to sell now preparing to enter the market. This potential increase in supply could reshape market dynamics, offering more choices to prospective buyers who have been waiting for more favourable conditions. Overall, this transition signals a possible end to the market’s holding pattern and the beginning of a more dynamic property landscape in the coming months.


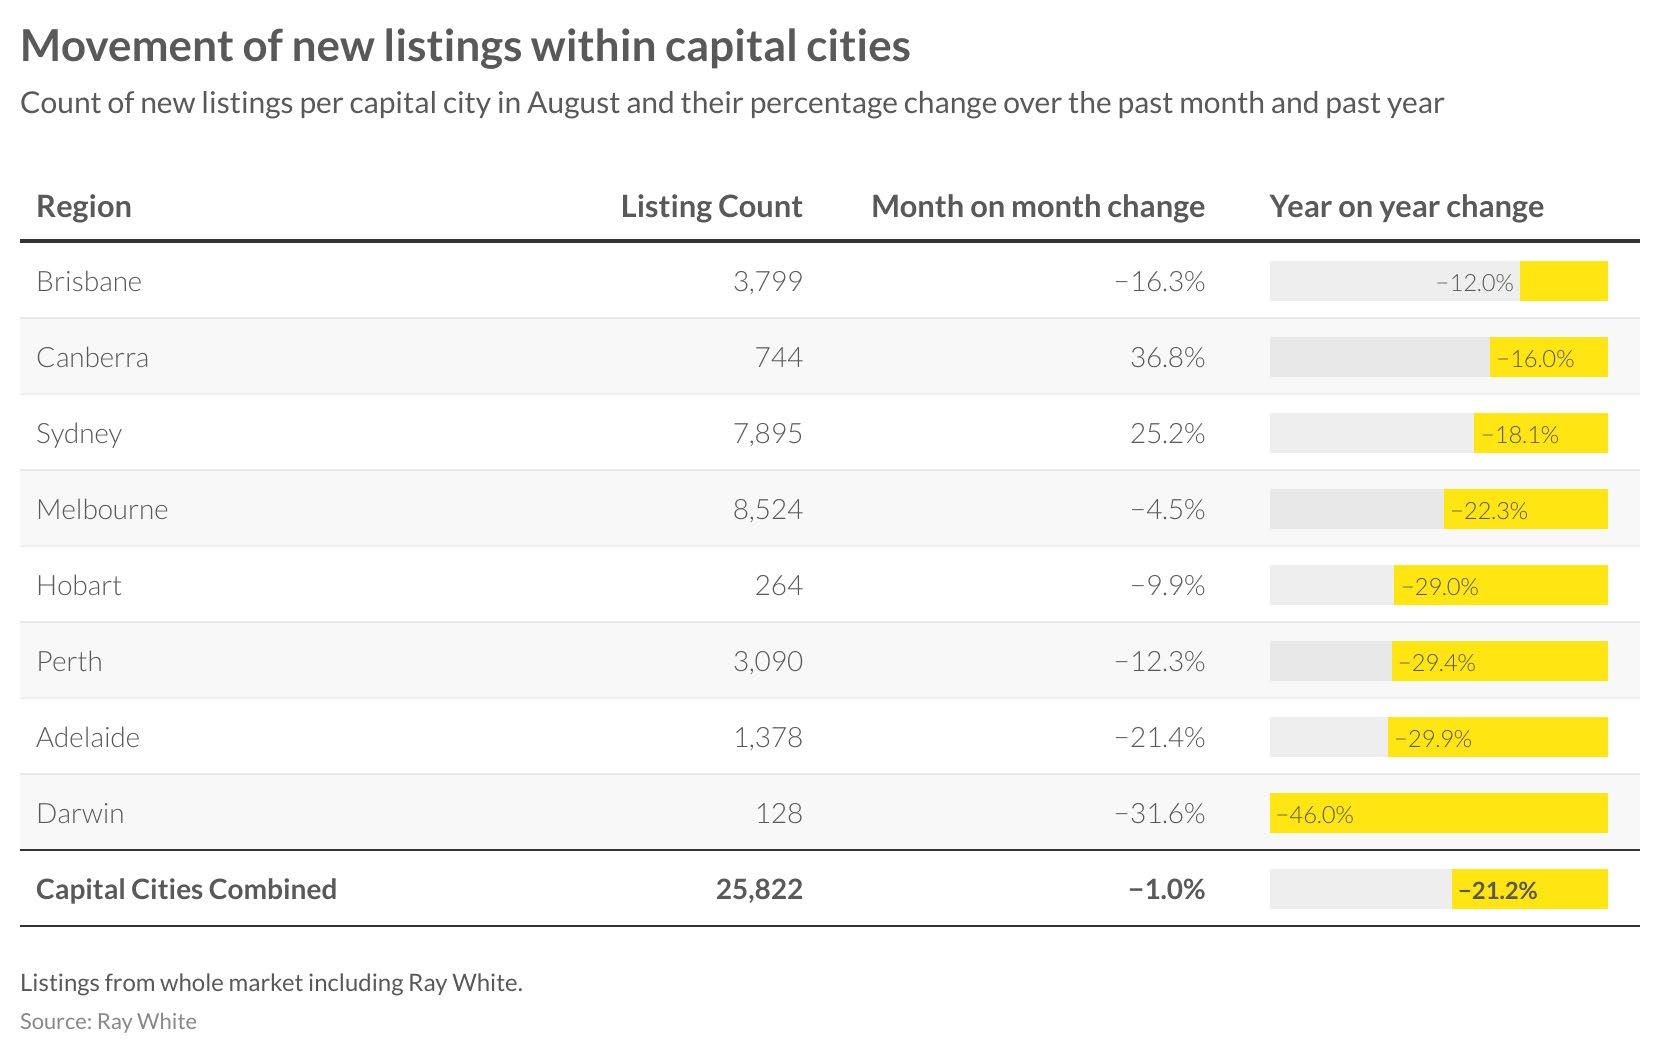
This month marks a turning point in listing numbers across several capital cities, with only a one per cent overall decrease nationwide - a significant improvement compared to previous months this year. Canberra and Sydney lead the recovery, with impressive monthly increases of 36.8 per cent and 25.2 per cent respectively. While annual figures remain negative, this uptick signals a potentially more dynamic spring selling season, with Sydney listings reaching 7,895.
Brisbane shows the least annual change, down 12 per cent year-on-year, with listings totaling 3,799 after a 16.3 per cent monthly decline. Hobart, Perth, Adelaide, and Darwin continue to be the most tightly held markets, with annual listing declines ranging from 29 per cent to 46 per cent, and ongoing monthly reductions. This contrast highlights the varying market condition sentiment across Australian capital cities.

Unlike capital cities, regional markets haven’t experienced the same level of rebound in listing numbers. All regional areas recorded declines this month, exacerbating annual reductions. Across all regions, monthly listings dropped by 13.6 per cent to 11,079, representing a 25.7 per cent annual decrease. Regional New South Wales fared best, with 3,879 listings, showing an 8.7 per cent monthly decline or 22.3 per cent year-on-year reduction.
Smaller markets exhibit greater volatility, particularly Northern Territory, Tasmania, and South Australia, all recording over 26 per cent annual declines. Regional Queensland remains one of the most tightly held areas, with only 3,114 listings, down 27.6 per cent from the previous year.


AUCTION INSIGHTS
Australian auction clearance rates have improved in August, reaching 67.5 per cent. This exceeds 2022 levels but remains slightly below 2023 figures. The year has been marked by vibrant auction activity, with high bidder participation driven by the imbalance between limited listings and strong buyer demand.
Looking ahead, anticipation of increased property listings, coupled with potential interest rate cuts later this year, is likely to boost market sentiment. This positive outlook is expected to invigorate the auction sector further. As a result, we may see continued improvement in auction clearance rates for the remainder of the year, reflecting a more confident and active property market.
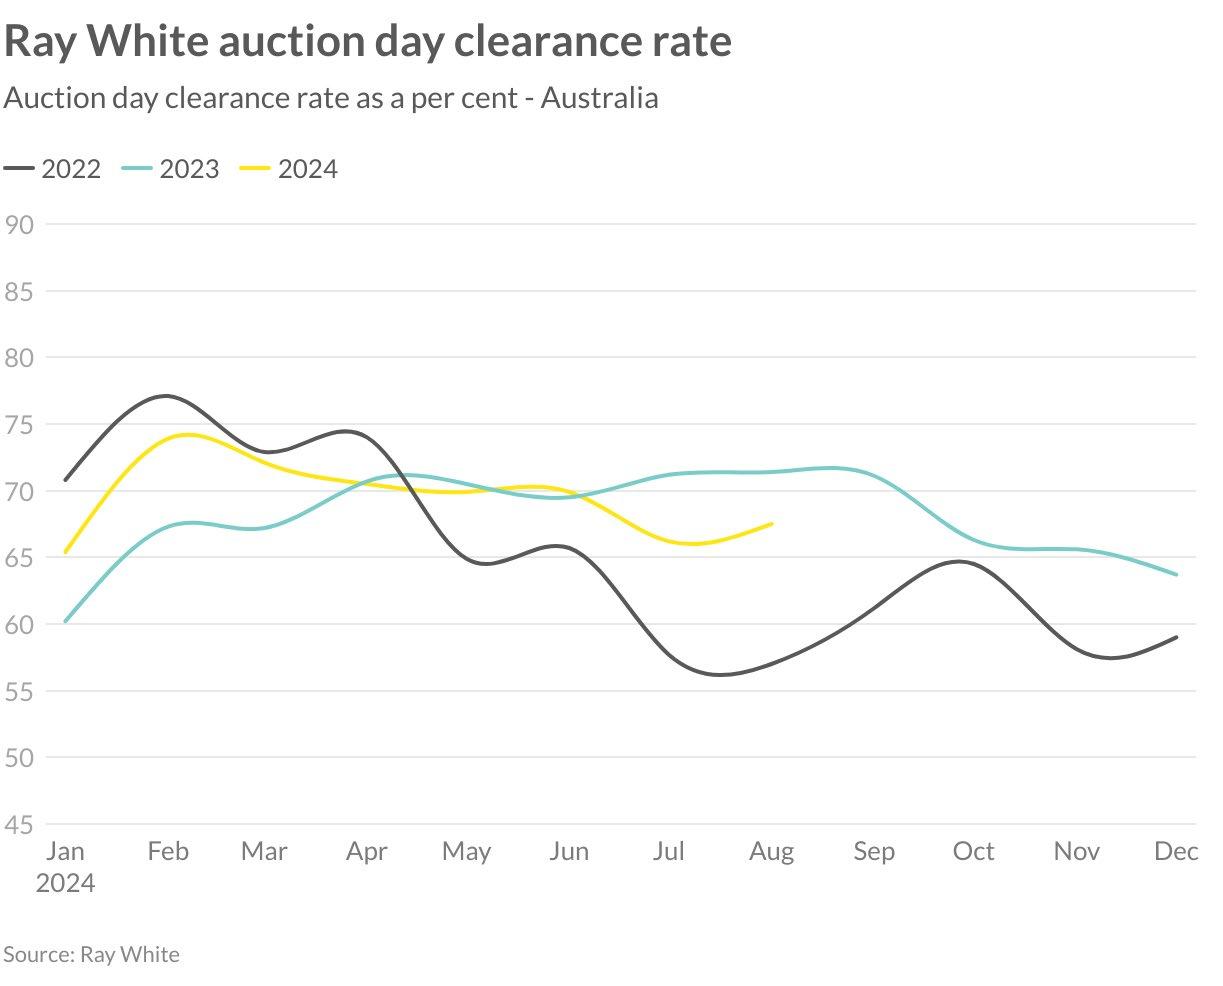

cautious and look towards potential rate cuts in 2025. This may lead to a slowdown in auction participation rates. However, if listings remain scarce in competitive markets, this could potentially result in more active bidders at auctions.

Average active bidders
Average registered bidders

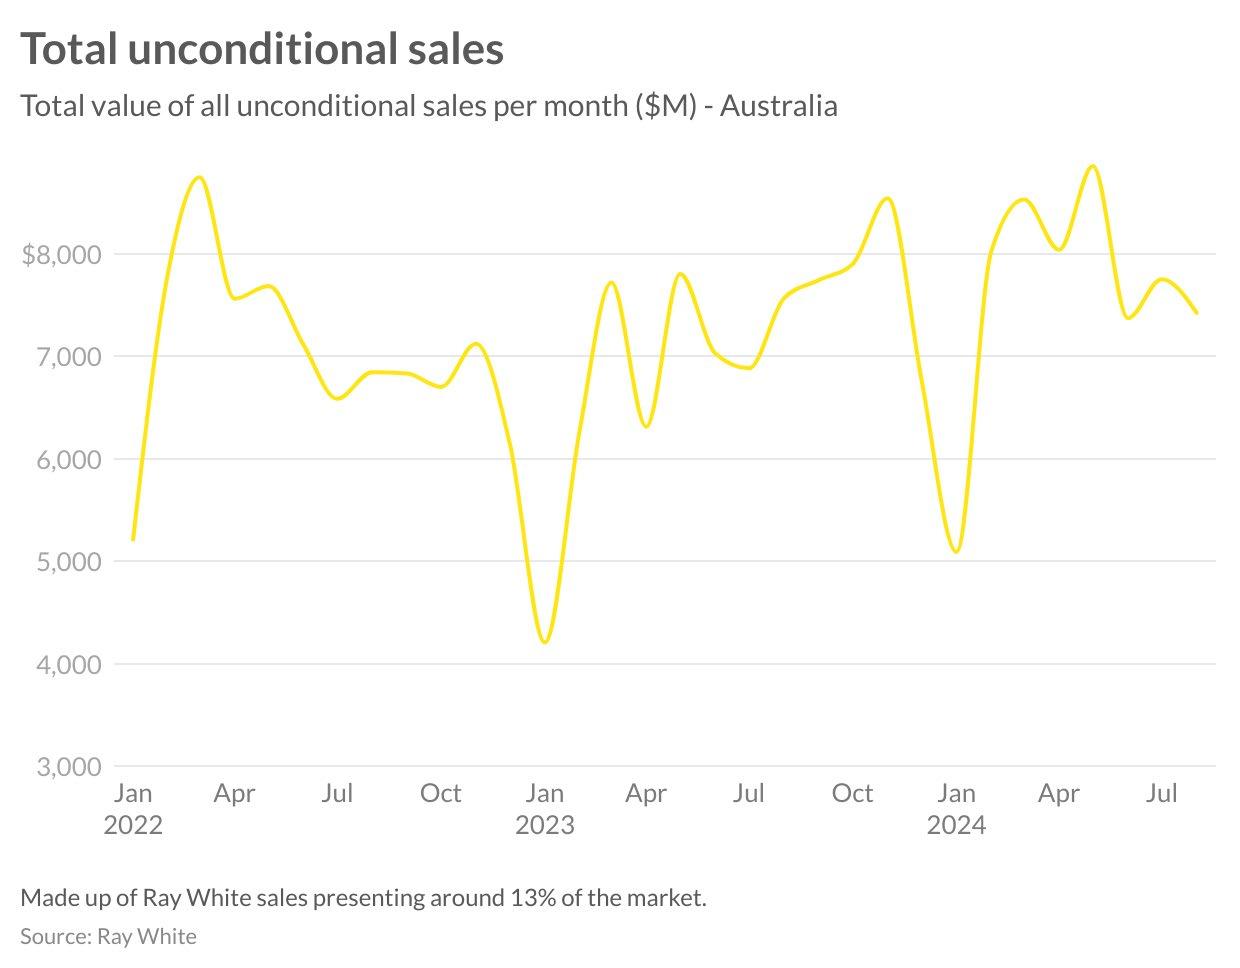
The Ray White Group has demonstrated remarkable resilience during the traditionally sluggish winter selling period, characterised by muted listing levels. While market dynamics continue to exhibit monthly fluctuations, the upcoming spring selling season is anticipated to result in a surge of listings and heightened activity. Moreover, the prospect of declining interest rates is expected to further invigorate market sentiment and activity. August sales figures reached an impressive $7.42 billion, marking a robust 6.5 per cent increase compared to the same period last year.
This notable annual growth is evident across the nation, with Western Australia’s favourable market conditions leading the charge, boasting a remarkable 33.8 per cent year-on-year increase. South Australia and Northern Territory follow closely, with a substantial 24.7 per cent uptick over the same timeframe. New South Wales maintains its position as the leader in market activity, accounting for $2.28 billion in turnover, an 8.8 per cent increase, while Queensland contributes $1.48 billion, reflecting a solid 5 per cent growth compared to last year’s results.