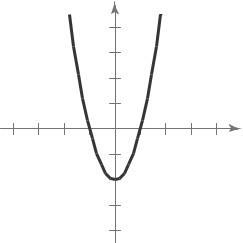
Solution Manual for College Algebra 10th Edition Larson ISBN 13372822949781337282291 Full download: https://testbankpack.com/p/solution-manual-for-college-algebra-10thedition-larson-isbn-1337282294-9781337282291/ CHAPTER 2 Functions and Their Graphs Section 2.1 Linear Equations in Two Variables 165 Section 2.2 Functions 178 Section 2.3 Analyzing Graphs of Functions .......................................................187 Section 2.4 A Library of Parent Functions.......................................................... 197 Section 2.5 Transformations of Functions ..........................................................202 Section 2.6 Combinations of Functions: Composite Functions.......................212 Section 2.7 Inverse Functions...............................................................................221 Review Exercises........................................................................................................234 Problem Solving.........................................................................................................243 Practice Test................................................................................................................ 248
CHAPTER 2 Functions and Their Graphs
Section 2.1 Linear Equations in Two Variables
)
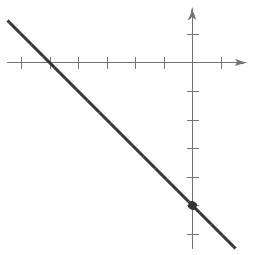
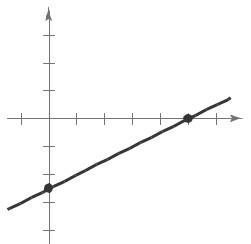
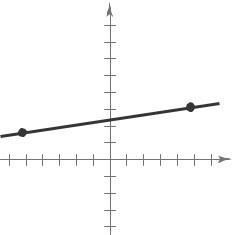
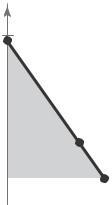
1. linear 14. The line appears to go through 0, 7 and 7,0
2. slope
3 point-slope
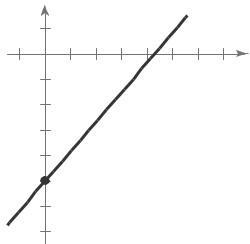
4. parallel 15. y = 5x + 3
5. perpendicular y-intercept: (0, 3 )
6. rate or rate of change
7 linear extrapolation
8. general
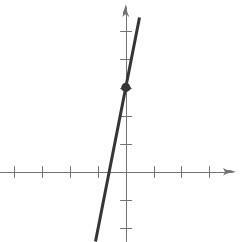
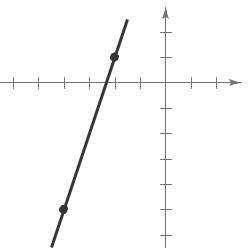
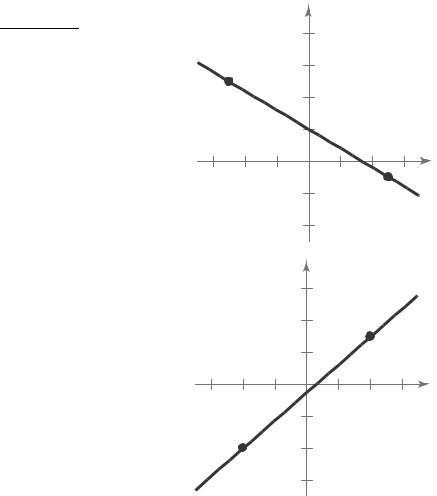
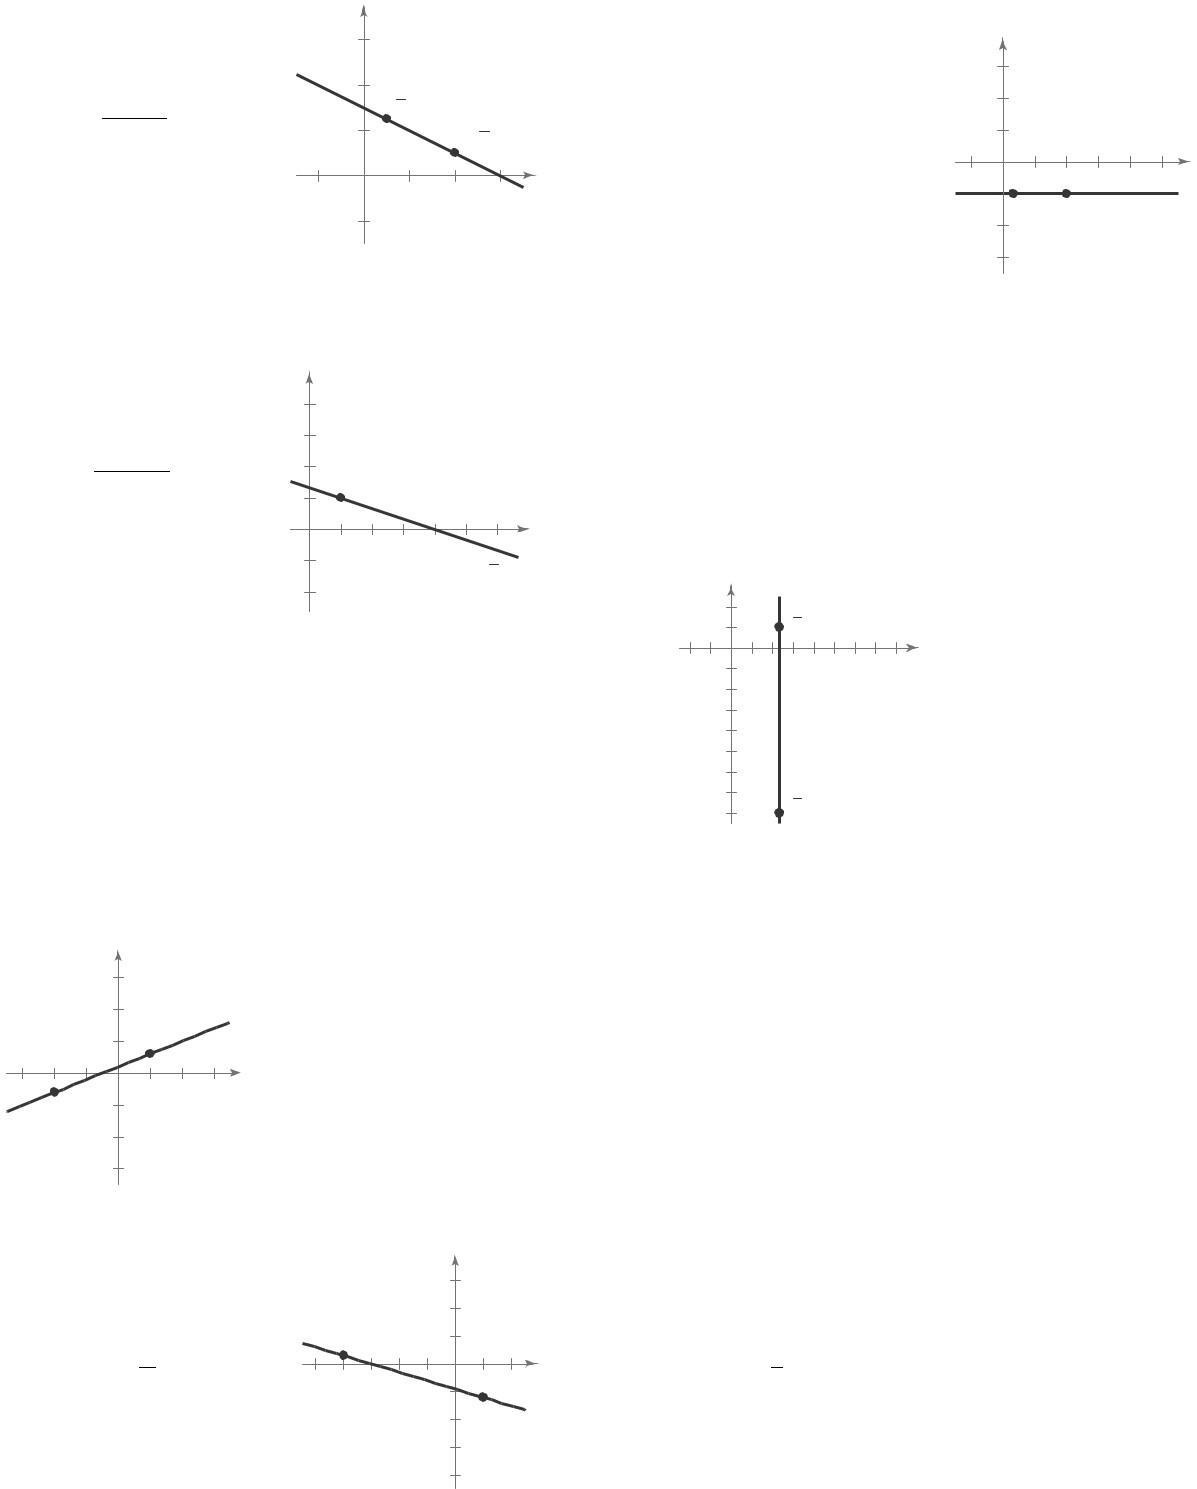
9 (a) m = 2 Because the slope is positive, the line rises.
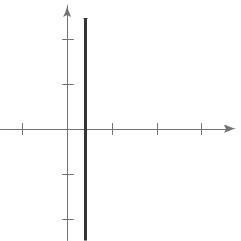
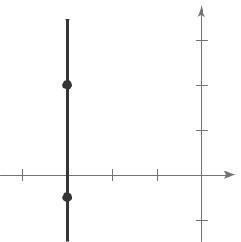
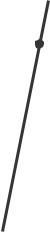
(b) m is undefined The line is vertical. Matches L3
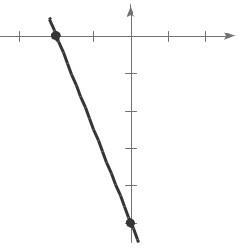
(c) m = 2. The line falls. Matches L1.
16. Slope: m = 1
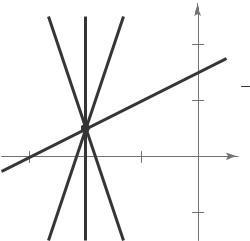
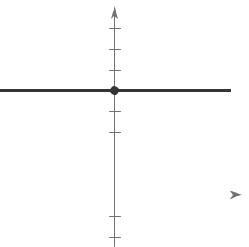
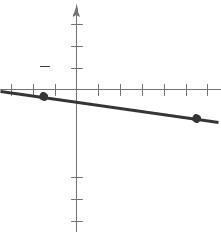
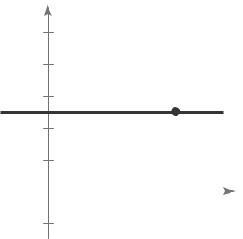
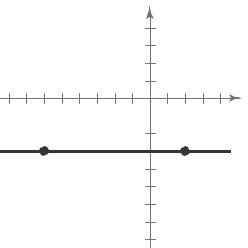
10 (a) m = 0 The line is horizontal. Matches L2 y-intercept: (0, 10)
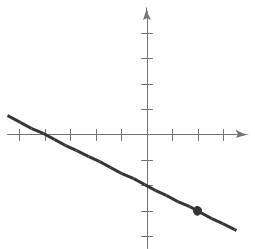
(b) m = 3 Because the slope is negative, the line 4
falls. Matches L1
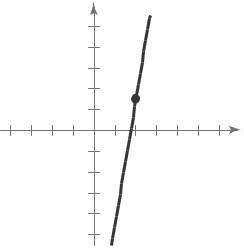
(c) m = 1. Because the slope is positive, the line rises.
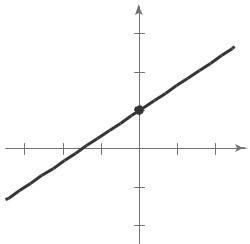
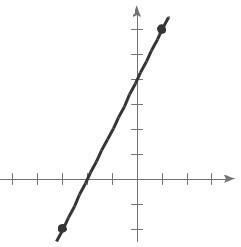
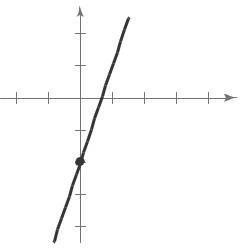
13. Two points on the line: (0, 0) and (4, 6)
( ) (
Slope = y2 y1 = 0 7 = 1
x2
x1 7 0
Slope: m = 5
y
5 4
3 (0, 3)
3 x Matches L2 −4 3 −2 −1 1 2 3
y
2
Matches L3 11. y −12 −10 x 6 4 2 2 2 4 6 2 m 1 (2, 3) m = 0 10 (0, 10) 12 1 m = 2 m = 3 y 4 x 3 1 x Slope: m = 3 1 2 12. undefined y m 3 17. 4 ) y-intercept: 0, 1 y m = 3 4 4 m =1 2 2 2 x (− 4, 1) −6 −4 −2 2 4 6 x 2 (0, 1) 6 2 4 2 6 8
Slope = y2 y1 = 6 = 3 x2 x1 4 2
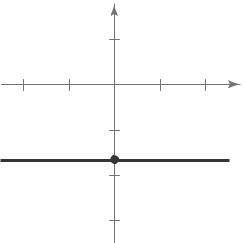
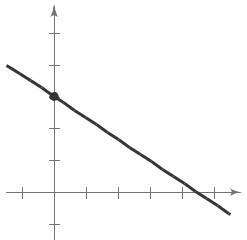
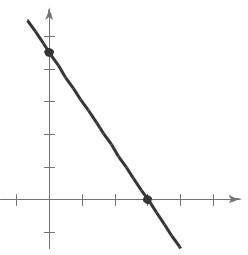
166 C h a p te r 2 F unction s an d Thei r Gra p h s S e c t i o n 2 1 Linea r Equ a ti ons i n Two V a ria b les 166 3 ) ( y = 2 x + 2 3 2 Slope: m = 3 18 y-intercept: (0, 2) y 6 4 (0, 2) x 6 2 2 4 2 4 y 5 = 0 19 y = 5 Slope: m = 0 y-intercept: (0, 5 ) y 8 6 (0, 5) 4 2 x 4 2 2 4 2 +4=0 x = 4 Slope: undefined (vertical line) y-intercept: none y 5x 2 = 0 = 2 , vertical line 5 Slope: undefined y-intercept: none y 2 1 x 1 1 2 3 1 2 22.3 y + 5 = 0 3 y = 5 = 5 Slope: m = 0 y-intercept: (0, 5 3 ) y 1 x 2 1 1 2 1 5 2 0, − 3 3 23. 7 x 6 y = 30 6 y =− 7 x + 30 y = 7 x 5 6 4 7 2 ) 6 2 2 2 4 y-intercept: y 0, 5 x 1 1 2 3 5 6 7 1 2 3 4 5 (0, 5) 7
167 C h a p te r 2 F unction s an d Thei r Gra p h s S e c t i o n 2 1 Linea r Equ a ti ons i n Two V a ria b les 167 ) 24. 2 x + 3 y = 9 3 y = 2 x + 9 y = 2 x + 3 3 1 1 28. m = ( ) = 2 = 1 2 2 4 2 y 5 Slope: m = 2 4 3 3 y-intercept: y 5 4 (0, 3) 0, 3 ( ) 2 (− 2, 1) 1 x −5 −4 −3 2 −1 3 4 5 2 (2, 1) 3 4 5 2 1 x 1 1 2 3 4 29 m = 7 ( 7)= 0 = 0 8 5 3 y 25. m = 0 9 = 9 = 3 6 0 6 2 y 4 2 −4 2 2 4 x 2 4 6 8 10 (0, 9) 8 6 6 (5, 7) (8, 7) 8 10 4 2 (6, 0) x 30 m = 5 1 4 ( 2) = 3 2 2 4 6 8 10 2 2 (− 2, 1) 1 26. m = 5 0 = 5 = 1 x −6 5 −4 −3 − 1 1 2 0 10 10 2 y 6 4 2 (10, 0) x 2 2 4 6 8 10 12 2 4 1 2 3 4 ( 4, 5) 5 6 4 ( 1 5 (0, 5) 31. m = 6 ( 6) = 0 8 6 ( 2) 8 m is undefined. y 6 27. m = 1 3 = 4 = 2 ( ) y (− 6, 4) 4 2 6 (1, 6) 5 4 2 1 x −5 4 −3 1 1 2 3 ( 3, 2)
168 C h a p te r 2 F unction s an d Thei r Gra p h s S e c t i o n 2 1 Linea r Equ a ti ons i n Two V a ria b les 168 x 8 ( 6, 1) 2 2
33.
Point: (5, 7), Slope: m = 0 m =0,
oint: ( 5, 4), Slope: m = 2
m = 2 = 2 , y
Because 1 increases by 2 for everyone unit increase in x Three additional points are ( 4, 6), ( 3, 8), and ( 2, 10)
Point: (0, 9), Slope: m = 2
m = 2, y
Because decreases by 2 for every one unit
increase in x Three other points are ( 2, 5), (1, 11), and (3, 15). 1
Point: (4, 5), Slope: m = 3
m = 13 ,
Because y decreases by 1 unit for every
three unit increase in x Three additional points are ( 2, 7), (0, 19 4 ), and (1, 6)
40. Point: (3, 4), Slope: m = 4
Because m = 14 , y increases by 1 unit for every four
unit increase in x Three additional points are ( 1, 5), (1, 11), and (3, 15)
4, 3 , Point: Slope is undefined
Because m is undefined, x does not change Three points are ( 4, 0), ( 4, 5), and ( 4, 2)
2, 14 ,
Point: Slope is undefined
Because m is undefined, x does not change. Three other points are (2, 3, )( 2, 0 , and ) ( 2,4 )
43 Point: ( 0, 2 ; m = 3 )
Because y does not change. Three other points y + 2 = 3 x 0 ( ) are ( 1, 7), (0, 7), and (4, 7).
Point: (3, 2), Slope: m = 0
Because m = 0, y does not change Three other points
169 C h a p te r 2 F unction s an d Thei r Gra p h s S e c t i o n 2 1 Linea r Equ a ti ons i n Two V a ria b les 169 1 ( ) ( , ( (
y 5
0 ( 10) = 4 0 2 y (− 4, 0) x 6 2 2 4 2 4 10 (0, 10) ЀȀ Ā Ā ĀĀĀ
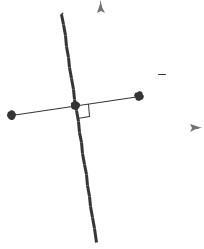
)
32. m =
m = 1.6 3.1 = 1.5
0.15 5.2 4.8 10 y
=
8
4 (4 8, 3 1)
6
(− 5 2, 1 6) −6 −4 2 2 4 x 2 4 6
1 4 3 3 1
34. m = = 3 11 7 2 2 y 3 2 3 1 − 2 3 1 x 1 4 5 6
2 11 4 2, 4
3 3 5
6
y
= 3x 2
2
1
x −2 −1 1 2 3 4 1 2 (0, 2)
are (1, 2), (10, 2), and ( 6, 2).

170 C h a p te r 2 F unction s an d Thei r Gra p h s S e c t i o n 2 1 Linea r Equ a ti ons i n Two V a ria b les 170 1 4 2 2 2 ) 4 1 1 44. Point:( 0, 10 ; m = 1 ) y 48. Point: (8, 2); m = 1 y 10 = 1 x 0 ( ) y 10 = x y 2 = 4( x 8) 8 6 4 (8, 2) y = x + 10 y y 2 = 1x 2 2 y = 1 x x 2 4 6 8 10 10 (0, 10) 8 6 4 4 6 Point: (2, 3); m = 1 y 2 2 2 4 6 8 10 2 4 3 ( 3)=− 2( x 2) 2 45. Point: 3, 6 ; m = 2 ( ) 1 x + 3 =− x + 1 2 y 6 = 2 x + 3 ) y = 2x 1 = 2 x 2 5 4 1 1 2 3 1 (2, 3) y ( 3, 6) 6 4 x 3 4 50 Point: ( 2, 5); m = 3 y + 5 = 4 3 ( x + 2) −6 −4 2 2 4 6 2 4 6 4 y + 20 = 3x + 6 4 y = 3x 14 y = 3 x 7 4 2 y 46. Point: 0, 0 ; m = 4 x ( ) 2 2 y 0 = 4 x 0 ( 2 y = 4x y 5 ( 2, 5) 4 3 2 1 (0, 0) Point: (4, 5 ); m = 0 x −3 −2 1 1 2 3 5 = 0( x 4) y 5 = 0 Point: (4, 0); m = 3 1 y 0 = 3 1 ( x 4) 1 x + y = 2 5 y 5 4 y = 3 3 4 y 4 3 2 4, 5 2 2 1 x 1 (4, 0) x 1 1 2 3 4 5 1
171 C h a p te r 2 F unction s an d Thei r Gra p h s S e c t i o n 2 1 Linea r Equ a ti ons i n Two V a ria b les 171 1 1 2 3 4 1 2


172 C h a p te r 2 F unction s an d Thei r Gra p h s S e c t i o n 2 1 Linea r Equ a ti ons i n Two V a ria b les 172 ( x 4) 2 x 52 Point: ( 2, 3 55. 5, 1, 5, 5 y ( ) 2 ); m 3 = 6 ( ) 5 + 1 8 (− 5, 5) 6 y 2 = 6( x 2) y + 1 = ( x 5) 5 5 4 y 2 3 = 6x 12 y = 6x 21 3 y = 5 ( x 5) 1 2 − 6 4 2 2 6 y y =− 3 x +2 5 2 (5, 1) 4 4 ( ) ( ) 2 (2, 3 2) 56. 4,3, 4, 4 y 4 3 ( x 4) 6 4 2 2 4 6 y 3 x 4 (4, 3) 2 7 2 y 3 = x 4 8 6 4 2 2 4 6 y 3 = 7 7 ( 4, 4) ( ) − 4 53. Point: 5 1, 1 8 ; m = 5 ( ( )) y = 7 x 1 y 1.8 = 5 x 5.1 y = 5x + 27.3 y 57 ( 7, 2), ( 7, 5) 3 m = 5 2 = 3 (− 5 1, 1 8) 2 7 ( 7) 0 1 x m is undefined −7 6 −4 3 −2 −1 1 2 y 3 4 8 5 6 (− 7, 5) ( ) 4 54. Point: 2 5,3.25; m = 0 (− 7, 2) 2 y 3.25 = ( 0 x ( 2.5 )) x 8 6 4 2 y 3 25 = 0 y = 3 25 58. ( ) ( 6, 3 , 2 ) 2, 3 8 ( ) 3 3 y 4 = 6 2 ( 6)( x + 6) ( ) (− 2 5, 3 25) 4 2 y + 3 = 0 x + 6 y + 3 = 0 x y = 3 4 2 2 4 y 2 4 2 x −6 −4 −2 2 4 2 ( 6, 3) 4 (2, 3) 6 8
Section 2 1 Linea r Equ a ti ons i n Two V a ria b les 171 C h a p te r 2 F unction s an d Thei r Gra p h s 2, 1 , 1 , 5 63. ( 2, 1 , 3 , 1 y 1 y = 1 3 1 x ) ( y 0 6 = − 8 3 8) 4 3 3 1 ) 59. y 2 2 4 3 1 ( 1 3 1 4 2 2 (2 1 5 4 y + 1 = 1 ( x 2) 2 y 2 = 1 2 ( x 2) 1 (2, 2 1 ) 2 y + 1 = 0 3 2 1 x y = 1( x 2) + 1 1 1 2 3 x 1 1 2 3 4 5 1 −1) (2, −1) 2 2 1 2 3 1 y = x + 3 The line is horizontal. 3 7 2 2 64. 7, 8, , 1 1,1, 6, 2 y 3 3 1 (− 8 ) 9 60. 4 m = = and is undefined 7 7 0 2 1 3 3 3 y 1 = 3 x 1 2 6 1( ) 1 (1, 1) x = 7 3 y 1 x 1 ( ) 1 3 1 2 1 2 3 4 (6, 2 3) The line is vertical. y 2 7 , 1 1 3 x y =− x + 4 1 12345678 3 3 2 3 1,0 6, 2, 0.6 61.( ) ) 4 5 0 6 0.6 ( x 1) 6 ( ) y = 0.4 x 1 + 0.6 7 7 65. L : y = 2 x 3 y = 0 4x + 0 2 1 3 m = 2 y 1 3 3 L2 : y = 2 x 1 3 2 m =− 2 1 (1, 0 6) 2 3 x The slopes are equal, so the lines are parallel. 3 1 2 3 ( 2, 0 6) 2 66. L1 : y = 1 x 1 4 3 m1 = 1 ( 8, 0 6 , (2, 2 4) L2 : y = 4 x + 7 62. y m2 = 4 2 4 0.6 6 Thelinesare neither parallel nor perpendicular. y 0 6 = 2 8 ( ) ( x + 8) 4 1 3 y 0 6 = 10 (− 8, 0 6) 2 67. L1 : y = x 3 ( x + 8) −10 −8 6 (2, 2 4) x m = 2 1 ( ) 1 2 10 y 6 = 3 x + 8 4 L2 : y = 1 + 1 10 y 6 = 3x 24 6 8
Section 2 1 Linea r Equ a ti ons i n Two V a ria b les 172 C h a p te r 2 F unction s an d Thei r Gra p h s
2 2
10
m = 1 10 y= 3x 18
3 y = x 9 or y = 0 3x 1 8 Thelinesare neither parallel nor perpendicular.
5
The slopes are negative reciprocals, so the lines are perpendicular.
The slopes are negative reciprocals, so the lines are perpendicular.
The lines are neither parallel nor perpendicular.
Section 2 1 Linea r Equ a ti ons i n Two V a ria b les 173 C h a p te r 2 F unction s an d Thei r Gra p h s 5 4 8 7 = 4 72 2 4 4 L1 : y = 4 x 5 m1 = 5 4 L : y = 5 x + 1 2 4
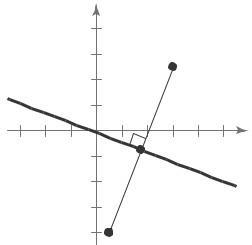
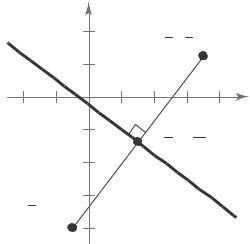
L1 : (0, 1), (5, 9) 9 + 1 73. 4 x 2 y = 3 = 2x 3 Slope: m = 2 (2, 1), m = 2 y 1 = 2( x 2) y = 2x 3 (2, 1), m = 1 2 m = = 2 1 5 0 2 ( )( ) L : 0,3,4, 1 m2 = 1 3 = 1 4 0 2
L1: ( 2, 1), (1, 5) ( ) 6 5 1 y 1 = 2 1 ( x 2) y = 2 1 x + 2 x + y = 7 = x + 7 Slope: m = 1 m = 1, ( 3, 2) y 2 = 1( x + 3) y 2 = x 3 m1 = 1 ( 2) = 3 = 2 2 ( ) ( L : 1,3, ) 5, 5 y = x 1 m = 1, ( 3, 2) m2 = 5 3 5 1 8 = 4 = 2 y 2 = 1( x + 3)
y = x + 5 Ā Ā 3x + 4 y = Ā 7 Ā Ā 1: ( 6, 3), (2, 3) m = 3 ( 3) = 0 = 0 1 = 3 x + 7 2 ( 6) 8 Slope: m = 3 4 L2:(3, 2), (6, 2 ) ( ) 1 1 1 ( 1 ) 0 2 3 , 8 7 , m = 3 L 1 and m = 2 2 = = 0 2 6 3 3 L 2 are both y 7 = 43 (x ( 23 )) = 4 3 x + 8 3 L1: (4, 8), ( 4, 2) horizontal lines, so they are parallel ( 3 , 8 ), m = 3 2 7 4 m1 = 2 8 = 6 = 3 y 8 3 (x ( 3 2 )) 4 4 8 4 1 L2 : (3, 5), 1, y = 3 4 x + 127 3 1
5) 16
m2 = 3 = 3 = 1 3 4 3
4
The slopes are negative reciprocals, so the lines are perpendicular.
Section 2 1 Linea r Equ a ti ons i n Two V a ria b les 174 C h a p te r 2 F unction s an d Thei r Gra p h s (
Section 2 1 Linea r Equ a ti ons i n Two V a ria b les 175 C h a p te r 2 F unction s an d Thei r Gra p h s 8 3 3 = 7 3 3 5x + 3 y = 0 3 y = 5x = 3 5 x Slope: m = 3 5 m = 3 8 , 4 ) 6x + 2 y = 9 2 y = 6 x + 9 = 3x + 9 2 Slope: m = 3 ( 3 9, 1 4), m = 3 3 4 = 3 5 (x 7 8 ) 24 y 18 = 40(x 7 ) 24 y 18 = 40x + 35 24 y = 40x + 53 y = 5 3 x + 53 24 y ( 1.4)= 3(x ( 3.9)) + 1.4 = 3x 11.7 = 3x 13 1 ( 3 9, 1 4), m = 1 ( 1.4)= 1 3 (x ( 3.9)) m = 5 8 , 4 ) y + 1.4 = 1 3 x + 1.3 1 4 5 (x 8 ) = 3 x 0.1 40 y 30 = 24(x 7 ) 8 40 y = 24 x + 9 y = 3 5 x + 40 9 y + 5 = 0 y = 5 x y 3 +5 = 1 15 x +y = 115 3 5 5x + 3 y 15= 0 ( 3, 0), (0, 4) Slope: m = 0 x 3 y + 4 = 1 ( 2, 4), m = 0 y = 4 ( 12) x + 12 y ( )4 =( 12) 1 ( 2, 4), m is undefined x = 2 4 x 3 y + 12 = 0 x y x 4 = 0 83. 1 6 + 2 3 = 1 x = 4 Slope: m is undefined (3, 2), m is undefined 6x + 3 y = 1 2 12x + 3 y + 2 = 0 = 3 2 , 0 , (0, 2) (3, 2), m = 0 = 2 3 y + = 1 x y = 4 y = x 4 2 3 2 3x y = 1 2 2 Slope: m =1 3x y 2 = 0 (2 5, 6.8), m = 1 y 6.8 = 1( x 2.5) y = x + 4 3 (2 5, 6.8), m = 1
Section 2 1 Linea r Equ a ti ons i n Two V a ria b les 176 C h a p te r 2 F unction s an d Thei r Gra p h s y 6.8 =( 1)( x 2.5) y = x + 9.3 85. x + y = 1, c ≠ 0 c c x + y = c 1 + 2 = c 3 = c x + y = 3 x + y 3 = 0
(a) m = 135. The sales are increasing 135 units per year.
m = 0 There is no change in sales during the year.
m = 40 The sales are decreasing 40 units per
(a) greatest increase = largest slope
(14, 182.20), (15, 233.72)
m1 = 233 72 182 20 = 51 52 15 14
So, the sales increased the greatest between the years 2014 and 2015 least increase = smallest slope
(13,170.91), (14, 182.20)
m2 =182.20 170 91 = 11 29 14 13
So, the sales increased the least between the years 2013 and 2014.
(b) (9, 42 91), (15, 233 72) year. 233 72 42.91 m = 190 81 = ≈ 31 80
15 9 6
The slope of the line is about 31 8
The sales increased an average of about $31.8 billion each year between the years 2009 and 2015
y = 10 6 x
V
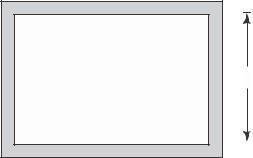
Because m = 12 , for every change in the horizontal measurement of 12 feet, the
by 1 foot.
The C-intercept measures the fixed costs of manufacturing when zero bags are produced
The slope measures the cost to produce one laptop bag
Monthly wages = 7% of the Sales plus the Monthly Salary
W = 0 07S + 5000
Section 2 1 Linea r Equ a ti ons i n Two V a ria b les 177 C h a p te r 2 F unction s an d Thei r Gra p h s x 300 600 900 1200 1500 1800 2100 y –25 –50 –75 –100 –125 –150 –175 y + 50 = 1 x + 50 12 y = 1 x 12 0 mea s u r e m en ts l (d , 0), (0, d ), ( 3, 4) x y + = 1 d d x + y = d 3 + 4 = d 1 = d x + y 1 = 0
and (b)
= 50 − ( 25)= 25 = 1
30030012 1 ( 50)=−12 ( x 600) Horizontal measurements 600 1200 1800 2400 x 50 −100 −150 −200 y 1
6 = 100 (200)= 12 feet (a)
m
600
vertical measurement decreases
1 12 ≈ 0 083 = 8 3%
(16, 3000), m = 150
grade
3000
150
V 3000 = 150t + 2400
= 150t
5400, 16
(16, 200), m = 6 50
200 = 6 50(t 16)
200 = 6 50t + 104 V = 6 5t + 96, 16 ≤ t ≤ 21
=
(t 16)
V
+
≤ t ≤ 21
V
V
Using the points (0, 875) and (5, 0), where the first coordinate represents the year t and the second coordinate represents the value V, you have
= 0 875 =−175 5 0
= 175t + 875, 0 ≤ t ≤ 5.
Using the points (0, 24,000) and (10, 2000), where the first coordinate represents the year t and the second coordinate represents the value V, you have
m = 2,000 24,000 = 22,000 = 2200 10 0 10
Since the point (0, 24,000) is the Vintercept, b = 24,000, the equation is
= 2200t + 24,000, 0 ≤ t ≤ 10
Using the points (0, 32) and (100, 212), where the first coordinate represents a temperature in degrees Celsius and the second coordinate represents a temperature in degrees Fahrenheit, you have
m = 212 32 = 180 =9 100 0 100 5
Since the point (0, 32) is the F- intercept, b = 32, the
99. (a) Total Cost = cost for cost purchase fuel and + for + cost
maintainance operator
C = 9 5t + 11 5t + 42,000
C = 21t + 42,000
(b) Revenue = Rate per hour Hours
R = 45t
(c) P=R C
P = 45t (21t + 42,000)
P = 24t 42,000
(d) Let P = 0, and solve for t.
0 = 24t 42,000
42,000 = 24t
1750 = t
The equipment must be used 1750 hours to yield a profit of 0 dollars.
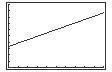
(a) Using the points (1, 970) and (3, 1270), you have 1270 970
Using the point-slope form with m = 150 and the point (1, 970), you have y
= m(t t1 ) y 970 = 150(t 1) y 970 = 150t 150 y = 150t + 820
The slope is m = 150. The slope tells you the amount of increase in the weight of an average male child’s brain each year.
Let t = 2:
= 150(2)+ 820
y = 300 + 820
y = 1120
The average brain weight at age 2 is 1120 grams.
Answers will vary.
Answers will vary Sample answer: No The brain stops growing after reaching a certain age
Because m = 8, each 1-meter increase in x will increase y by 8 meters
False The slope with the greatest magnitude corresponds to the steepest line
7 0 7
False The lines are not parallel.
Section 2 1 Linea r Equ a ti ons i n Two V a ria b les 178 C h a p te r 2 F unction s an d Thei r Gra p h s
(a) 10 m
F =
C +
C = 5 160 F x 15 m
100.
equation is
1.8
32 or
9 9
x y = 2(15 + 2x)+ 2(10 + 2x)= 8x + 50 150 m = =
3 1 2
300 = 150
1
0 10 0
2 2
1
1 8
7 ( ) (0, 4)
( 7,7): m2 = 7 ( 4 ) = 11
4
102. ( 8, 2) and ( 1, 4): m
=
=
and
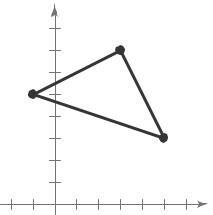
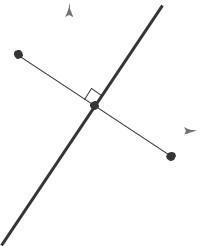
103 Find the slope of the line segments between the points 104. On a vertical line, all the pointshavethe same x-value, A and B, and B and C so when you evaluate m = y2 y1 , you would have
a zero in the denominator, and division by zero is
Since the slopes are negative reciprocals, the line segments are perpendicular and therefore intersect to form a right angle. So, the triangle is a right triangle.
Since the scales for the y-axis on each graph is unknown, the slopes of the lines cannot be determined.
107 No, the slopes of two perpendicular lines have opposite signs. (Assume that neither line is vertical or horizontal.)
Because 4 > 5 , the steeper line is the one with a 108 slope of – 4 The slope with the greatest magnitude corresponds to the steepest line
Section 2 1 Linea r Equ a ti ons i n Two V a ria b les 179 C h a p te r 2 F unction s an d Thei r Gra p h s ( m ( ) 2 2
y x2 x1 8 B(3, 7)
7 6
A(− 1, 5) 3 2 1 C(5, 3) x −2 −1 1234 5 6 m 7 5 2 1 AB =3 1 = 4 = 2 ) BC = 3 7 = 4 =− 2 5 3 2
undefined
y y b a x x 1 2 3 4 1 2 3 4 106. d 1 = ( x2 x1 )2 +( y 2 y1 )2 d 2 = ( x 2 x1)2 +( y 2 y1)2 = 1 0 ( 2 + m 0 2 = 1 0 2 + ) ( 1 ) ( ) ( m 0 2 2 ) = 1 +(m 1 )2 = 1 +(m 2 )2 Using the Pythagorean Theorem: (d1 )2 +(d2 )2 = ( ( ) distance between 1, m1 , and (1, m 2 ))2 1 +(m1 ) 1 + m 2 ( ) 2 = +(m2 m1 ) 2 2 + 2 1 1 2 +(m1 )2 + 1 +(m 2 )2 =(m2 m1 )2 (m1 )2 +(m 2 )2 + 2 = (m 2 )2 2m1m2 + (m 1 )2 2 = 2m1m2 1 m m2 = 1
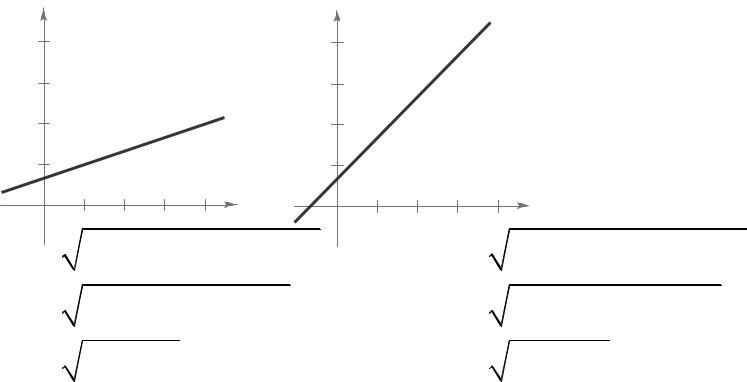
(a) Matches graph (ii).
The slope is –20, which represents the decrease in the amount of the loan each week The y-intercept is (0, 200), which represents the original amount of the loan
Matches graph (iii).
The slope is 2, which represents the increase in the hourly wage for each unit produced The yintercept is (0, 12.5), which represents the hourly rate if the employee produces no units.
Matches graph (i).
The slope is 0 32, which represents the increase in travel cost for each mile driven. The y-intercept is (0, 32), which represents the fixed cost of $30 per day for meals. This amount does not depend on the number of miles driven Matches graph (iv).
The slope is –100, which represents the amount by which the computer depreciates each year. The yintercept is (0, 750), which represents the original purchase price
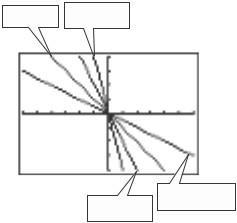
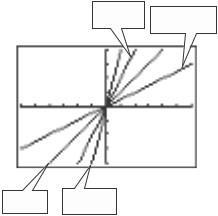
( ) ( ( ) ( 6 ( 2 109. The line y = 4 x rises most quickly y 2x y 0 5x 4 6 6 4 y x y 4x The line y = 4 x falls most quickly y = x y = 4x 4 6 6 4 y = 0 5x y = 2x
S e c t i o n 2 1 Linea r Equ a ti ons i n Two V a ria b les 177
The greater the magnitude of the slope (the absolute value of the slope), the faster the line rises or falls.
Set the distance between (4, 1) and ( x, y) equal to the distance between ( 2, 3) and ( x, y). x 4 2 + y 1 2 = x 2 2 + y 3 2 y ( ) x 4 2 + ( ) y + 1 2 ( = x + 2 ) ( ) 2 + y 3 2 (− 2, 3) 4 x 2 8x + 16 + y 2 + 2 y + 1 = x 2 + 4 x + 4 + y 2 6 y + 9 (1, 1) x 8x + 2 y + 17 = 4 x 6 y + 13 −4−2 2 4 12 x + 8 y + 4 = 0 (4, 1) ( ) 4 3x 2 y 1 = 0 3x 2 y 1 = 0 4 ( ) ( )
4, 1and 2,3 Set the distance between (6, 5) and (
(1, 8) and ( x, y) (x 6) 2 +(y ) 2 = (x ) 2 + (y ( 8 )) 2 y ( ) x 6 ( ) 2 + y 5 2 = ( ) ( x 1 2 + y ) + 8 2 8 (6, 5) 4 x 2 12x + 36 + y 2 10 y + 25 = x 2 2x + 1 + y 2 + 16 y + 64 x 2 + y 2 12x 10 y + 61 = x 2 + y 2 2x+ 16 y + 65 −6 4 −2 x 6 8 10 12x 10 y + 61 = 2 x + 16 y + 65 2 7 4 10x 26 y 4 = 0 6 3 2, 2 ( 2 5x ) + 13 y + 2 = 0 8 (1, 8) 5x + 13 y + 2 = 0
This line is the perpendicular bisector of the line segment connecting
x, y) equal to the distance between
Section 2.2 Functions
1. domain; range; function
2. independent; dependent
3 implied domain


4. difference quotient
5. Yes, the relationship is a function. Each domain value is matched with exactly one range value
6. No, the relationship is not a function The domain value of –1 is matched with two output values.
7. No, it does not represent a function. The input values of 10 and 7 are each matched with two output values.
8. Yes,thetabledoesrepresent a function Eachinputvalue is matched with exactly one output value
Input, x −2 0 2 4 6
Output, y 1 1 1 1 1
9. (a) Each element of A is matched with exactly one element of B, so it does represent a function
(b) The element 1 in A is matched with two elements, –2 and 1 of B, so it does not represent a function.
Each element of A is matched with exactly one element of B, so it does represent a function.
The element 2 in A is not matched with an element of B, so the relation does not represent a function
(a) The element c in A is matched with two elements, 2 and 3 of B, so it is not a function.
Each element of A is matched with exactly one element of B, so it does represent a function
This is not a function from A to B (it represents a function from B to A instead).
Each element of A is matched with exactly one element of B, so it does represent a function
x 2 + y 2 = 4 y =± 4 x 2
No, y is not a function of x.
x 2 y = 9 y = x 2 9
Yes, y is a function of x.
y = 16 x 2
Yes, y is a function of x.
C h a p te r 2 F unction s an d Thei r Gra p h s S e c t i o n 2 2 Functio n s 181 ) 1 4 , 8 ( ( 2 ) ( ) ( ) ( ) 113. Set the distance between 3, and x, y equalto the distance between 7, 1 and x, y x 3 2 + y 5 2 = x ( 7)2 + y 1 2 y ( ) ( 2) 2 ( ) (x 3 + y 5 2 = (x + 7 ) 2 + ( y 1 2 6 5 ) 2 (−7,1) ( 2, 4 7 4 (3, 2 x 2 6x + 9 + y 2 5 y + 4 = x 2 + 14x + 49 + y 2 2 y + 1 x 6x 5 y + 61 = 14 x 2 y + 50 −8 6 −4 2 4 6 4 24x 20 y + 61 = 56 x 8 y + 200 80x + 12 y + 139 = 0 8 ( 2 ) ( ) This line is the perpendicular bisector of the line segment connecting 3,5 and 7,1 Set the distance between ( 1 2 , 4) and ( x, y) equal to the distance between ( 7 2 , 5 4) and ( x, y) (x ( 1 2 )) 2 +( y ( 4))2 = (x 7 2 ) 2 +( y 5 4 )2 y 2 2 2 2 7 5 ( (x + 2 ) + ( y + 4) 2 =(x 7 2)+( y 5 4) 1 2, 4 2 x + x + 1 4 + y 2 +8 y + 16 = x 2 49 2 7 x + 4 + y 5 2 y 25 x + 16 −2 −1 1 3 4 2 2 x + y + x + 8 y 65 2 + 4 = x + y 2 5 7 x 2 y 221 (2, 8 + 16 1 3 11 x + 8 y + 65 = 7 x 5 2y + 221 16 2 ( 2 1 4 8x + 21 y + 39 = 0 2 16 128x + 168 y + 39 = 0


C h a p te r 2 F unction s an d Thei r Gra p h s S e c t i o n 2 2 Functio n s 182 () 3 3 ( = 3 14. y = x + 5 Yes, y is a function of x. y = 4 x Yes, y is a function of x. 23. f ( y)= 3 y (a) f (4) =3 4 = 1 (b) f (0 25) = 3 0.25 = 2 5 16 y = 4 x y = 4 x or y = (4 x) (c) f (4x 2) = 3 4x 2 = 3 2 x No, y is not a function of x 17. y = 75 or y = 75 + 0 x Yes, y is a function of x 18. x 1 = 0 x = 1 No, this is not a function of x. f ( x)= 3x 5 24. f ( x)= x +8+2 f ( 8)=( 8)+ 8 + 2 = 2 f (1)=(1)+ 8 + 2 = 5 (c) f ( x 8) = ( x 8)+ 8 + 2 = x + 2 25. q( x)= 1 x 2 9 f (1)= 3(1) 5 = 2 (a) q(0) = 1 1 = f ( 3)= 3( 3) 5 = 14 02 9 9 (b) q 3 = 1 is undefined f ( x + 2)= 3( x + 2) 5 3x + 6 5 32 9 1 (c) q( y + 3) = y + 3 2 9 1 = y 2 + 6 y V (r)= 4 πr 3 3x + 1 ( ) 2 2t + 3 26. q(t ) = t 2 3 V (3)= 4 π(3)3 = 4 π(27)= 36π (a) q(2)= ()2 = 8 3 = 11 2 2 + 3 + V(32)= 3 4 π(23)3 = 4 (27 )= 9 (2)2 4 4 3π 8 2π V (2r )= 4 π(2r )3 = 4 π(8r 3 )= 32 3 π r 3 q(0)= 2(0)2 + 3 (0)2 g (t )= 4t 2 3t + 5 g (2)= 4(2)2 3(2)+ 5 15 g (t 2)= 4(t 2)2 3(t 2)+ 5 4t 2 19t + 27 g (t ) g (2)= 4t 2 3t + 5 15 4t 2 3t 10 h(t )= t 2 + t + 1 h(2)= (2)2 +(2)+ 1 = 4 + 2 + 1 = 1 Division by zero is undefined (c) q( x)= 2( x) 2 + 3 = 2 x 2 + 3 ( x)2 x 2 27. f ( x) = x x (a) f (2) = 2 = 1 2 (b) f ( 2)= 2 = 1 2 h( 1)= ( 1)2 +( 1)+ 1 = 1 1 + 1 = 1 (c) f x 1 = x 1 1, if x < 1 h( x + 2)= ( x + 1)2 +( x + 1)+ 1 ( x 2 + 2 x + 1 )
C h a p te r 2 F unction s an d Thei r Gra p h s S e c t i o n 2 2 Functio n s 183 + x + 1 + 1 x 2 x + 1 f ( x)= x + 4 f (2)= 2 + 4 = 6 x 1 1, if x > 1 f ( 2)= 2 + 4 = 6 f (x2 )= x2 + 4 = x2 + 4
C h a p te r 2 F unction s an d Thei r Gra p h s S e c t i o n 2 2 Functio n s 184 x –2 –1 0 1 2 4 1 0 f x 9 t –5 –4 –3 –2 –1 1 0 1 1 2 2 x 1 2 3 4 5 f ( x) 8 5 0 1 2 2 2 2 ) 2 = 2 29 f ( x)= 2x + 1, x <0 33. f (x)= 1 x + 4, x ≤ 0 2x + 2, x ≥0 ( x 2)2 , x > 0 f ( 1)= 2( 1)+ 1 = 1 f (0)= 2(0)+ 2 = 2 f (2)= 2(2)+ 2 = 6 f ( 2)= 1 ( 2)+4=5 2 ( ) ( ) 2 f 1 = 1 1 +4 = 41 = 9 f (0)= 1 (0)+4=4 ( ) ( ) 30. f ( x) = 3x 3, x < 1 x2 + 2x 1, x ≥ 1 f 1 = 1 2 2 =1 f ( 2)= 3( 2) 3 = 3 f ( 1)=( 1)2 + 2( 1) 1 = 2 f (2)=(2 2) 2 = 0 ( ) 5 () () () (c) f 1 = 1 2+21 1 = 2 2 f ( x) = x 2 + 5 f ( 2)= ( 2)2 + 5 = 1 ( ) ( 1 = 12+5 = 4 f ( x)= 9 x 2 , x < 3 x 3,x ≥ 3 f 1 = 9 1 2 = 8 () () f 2 = 9 2 2 = 5 f (0)= (0)2 + 5 = 5 ( ) ( ) f 3 = 3 3=0 ( ) () 1 = 1 2+5=4 ( ) ( ) f 4 = 4 3=1 ( ) ( ) 31. f (2) = (2)2 +5=1 f 5 = 5 3=2 x –2 1 0 1 2 f ( x) 1 4 5 –4 1 32. h(t )= 1 t +3 h( 5)= 5+3 = 1 h( 4)= 4+3 1 h( 3)= 3+3 = 0 h( 2)= 2+3 1 15 3x = 0 3x = 15 = 5 f ( x)= 4x + 6 4x + 6 = 0 4x = 6 3 2 = 2 ( ) 2 x = 2 h 1 = 1 + 3 = 1 h(t ) 1 36. 3x 4 = 0 5 3x 4 = 0 4 x = 3 2 f ( x) = 12 x 8 12 x 2 = 0


C h a p te r 2 F unction s an d Thei r Gra p h s S e c t i o n 2 2 Functio n s 185 8 x 2 = 12 38. x =± 12=±2 3
= 3, which is a contradiction, since
Because f ( x) is a polynomial, the domain is all real numbers x.
f ( x)= 1 2 x 2
Because f ( x) is a polynomial, the domain is all real numbers x


49. g ( y)= y + 6
+ 6 ≥ 0
Domain: y ≥ 6
The domain is all real numbers y such that y ≥− 6.

represents the principal square root.


f (t )= 3 t + 4
Because f (t ) is a cube root, the domain is all real
S e c t i o n 2 2 Functio n s 181 Chapte r 2 F unction s an d Thei r Gra p h s ( ( f ( x)= x 2 81 x 2 81 = 0 f ( x)= g ( x) 2 x 2 = x + 2 x 2 = 81 x =±9 f ( x)= x 2 6x 16 x 2 6x 16 = 0 ( x 8)( x + 2)= 0 8 = 0 x = 8 + 2 = 0 x =− 2 x 3 x = 0 x x 2 = 0 ) ) x 2 x + 1 = 0 x 2 = 0 x + 1 = 0 x = 2 x = 1 f ( x)= g ( x) x 2 + 2x + 1 = 5x + 19 x 2 3x 18 = 0 ( x 6)( x + 3)= 0 ( ) x 6 = 0 x +3= 0 x x 2 1 = 0 ( )( ) x x + 1 x 1 = 0 x = 0, x = 1, or x = 1 f ( x)= x3 x2 3x + 3 x = 6 x = 3 45. f ( x) = g ( x) x 4 2x 2 = 2x 2 x 4 4x 2 = 0 ( ) x 3 x 2 3x + 3 = 0 x 2 ) ( ) x 2 4 = 0 )( ) x2 x 1 3 x 1 = 0 ( ) x 2 x + 2 x 2 = 0 42. ( x 1)x 2 3 = 0 x 2 = 0 x = 0 x 1 = 0 x = 1 x 2 3 = 0 x =± 3 46. f ( x)= g ( x) x 4 = 2 x x + x 6 = 0 ( x +3)( x 2)= 0 x + 3 = 0
x 2 = 0 x = 2 x =
( x)=
x
4 f
5 x 2 + 2 x 1
x + 2 = 0 x = 2 x 2 = 0 x = 2
numbers t
1
51. g ( x)= 3
y
x
x + 2
=
6 h( x
= x 2 4 x x 2 4 x ≠ 0 ) x x 4 ≠ 0 x ≠ 0 52. x 4 ≠ 0 x ≠ 4
The domain is all real numbers x except
0, x = 2.
)
The domain is all real numbers x except


S e c t i o n 2 2 Functio n s 182 Chapte r 2 F unction s an d Thei r Gra p h s Height, x Volume, V 1 484 2 800 3 972 4 1024 5 980 6 864 V o lu m e Profit
s 1 x =
(a) The
$3375. (b) P 3400 53. f (s)= s 4 3350 3300 Domain: s 1 ≥0 s ≥1 and s ≠ 4 The domain consists of all real numbers s, such that s ≥ 1 and s ≠ 4. 54. f ( x) = x + 6 3250 3200 3150 3100 x 110 130 150 170 Order size 6 + x Domain: x + 6 ≥ 0 x ≥ 6 and x ≠ 6 The domain is all real numbers x
x >
or ( 6, ∞) f ( x)= x 4 x Yes,
. (c) Profit =
price number number = (cost) per unit f units ) f units o o ( )( = 90 x 100 0 15 x 60 x, x > 100 The domain
x
x > 0 or (90 0 15x + 15) x 60 x ( ) 0, ∞ x + 2 (105 0 15x)x 60 x 105x 0 15x 2 60x 56. f ( x)= x 10 > 0 x 10 45x 0 15x 2 P , x > 100 x > 10 The domain is all real numbers x such that x > 10 57 (a) 59. A = s 2 and P = 4s 4 = s P 2 P 2 A = = 4 16 A =π r 2 , C = 2π r C r = 2 π C 2 C 2 A=π = 2π 4π
= 1024
V 1200 y = 10 1 x 2 + 3x + 6 y(25)= 10 1 (25)2 + 3(25)+ 6 = 18.5 feet If
at a
of 18 5
2 1000 62. (a) V = l w h = x y ⋅ x = x ywhere 800 600 400 200 x 1 2 3 4 5 6 Height 4 x + y = 108 So, y = 108 4 x and = x 2 (108 4 x)=108 x 2 4 x 3 Domain: 0 < x < 27 (b) 12 000
0, x =4.
maximum profit is
such that
6
P is a function of x
Revenue Cost
is all real numbers
such that
The volume is maximum when x = 4 and
cubic centimeters.
the child holds a glove at a height of 5 feet, then the ball will be over the child's head because it will be
height
feet

S e c t i o n 2 2 Functio n s 183 Chapte r 2 F unction s an d Thei r Gra p h s
x
2 Domain: 0 < x < 12 0 30 0
V is a function of x V =
(24 2x)
The dimensions that will maximize the volume of the package are 18 × 18 × 36. From the graph, the maximum volume occurs when x = 18 To find the dimension for y, use the equation y = 108 4 x
Because (0, y), (2, 1), and ( x, 0) all lie on the same line, the slopes between any pair are equal.
The domain of A includes x-values such that
By solving this inequality, the
S e c t i o n 2 2 Functio n s 184 Chapte r 2 F unction s an d Thei r Gra p h s x 2 1
= 108 4x = 108 4(18)= 108 72 = 36 A = l ⋅ w =(2 x) y = 2xy But y = 36 x 2 , so A = 2 x 36 x 2 The domain is 0 < x < 6 For 2008 through 2011, use 1 A = 2 1 bh =2 xy p(t )= 2 77t + 45 2 2008: p(8)= 2.77(8)+ 45.2 = 67.36%
2009: p(9)= 2 77(9)+ 45 2 = 70 13% 2010: p(10)= 2 77(10)+ 45 2 = 72 90% 2 0 x 2 2 x 2 2 (0, y) 3 2 For 2011 through 2014, use p(t)= 1 95t + 55 9 2012: p(12)= 1 95(12)+ 55 9 = 79 30% y = x 2 +1 (2, 1) (x, 0) 2013: p(13)= 1.95(13)+ 55.9 = 81.25% x x y = x 2 1 2 34 2 2014: p(14)= 1 95(14)+ 55 9 = 83 20% So, A = 1 x = x 2 x 2( x 2)
( x 2 2 x 2
is x > 2. >
66.
() p t = 0 757t 2 + 20 80t + 127 2 ( ) ( ) ( ) 2002: p 2 = 0.757 2 2 + 20.802 + 127.2 = $165,722 ( ) ( ) ( ) 2003: p 3 = 0 757 3 2 + 20.803 + 127.2 = $182,787 ( ) ( ) ( ) 2004: p 4( = 0 757 4 2 + 20.804 + 127.2 = $198,288 ) ( ) ( ) 2005: p 5 = 0.757 5 2 + 20.805 + 127.2 = $212,275 ( ) ( ) ( ) 2006: p 6 = 0 757 6 2 + 20.806 For 2007 through 2011, use () + 127.2 = $224,748 p t = 3 879t 2 82 50t + 605 8 ( ) ( ) ( ) 2007: p 7 = 3.8797 2 82.507 + 605.8 = $218,371 ( 2008: p 8 ( 2009: p 9 ( ) = 3.8798 2 ( = 3.8799 2 ( ) 82 50 8 ( ) 82 50 9 + 605.8 = $194,056 + 605.8 = $177,499 ( 2010: p 10 ( ) ( ) = 3 879 10 2 82 50 10 + 605.8 = $168,700 ( ) ( ) ( ) 2011: p 11 = 3 879 11 2 82 50 11 + 605.8 = $167,659 For 2012 through 2014, use
domain
0
For 2000 through 2006, use
S e c t i o n 2 2 Functio n s 185 Chapte r 2 F unction s an d Thei r Gra p h s p(t )= 4 171t 2 + 124 34t 714.2 2012: p(12)= 4 171(12)2 + 124.34(12) 714 2 = $177,256 2013: p(13)= 4 171(13)2 + 124.34(13) 714 2 = $197,321 2014: p(14)= 4.171(14)2 + 124.34(14) 714.2 = $209,044
(a) Cost = variable costs + fixed costs = 12 30 x + 98,000 Revenue = price per unit × number of units = 17 98x
= Revenue Cost = 17 98x (12 30x + 98,000) P = 5.68x 98,000
(a) Model: (Total cost)=(Fixed costs)+(Variable costs)

Labels: Total cost = C
Fixed cost = 6000 Variable costs = 0.95x Equation: C = 6000 + 0 95x


(b)
Theforce,in tons,of the wateragainst the damincreases with thedepthof the water.
It appears that approximately 21 feet of water would produce 1,000,000 tons of force
The revenue is maximum when 120 people take the trip.
S e c t i o n 2 2 Functio n s 186 Chapte r 2 F unction s an d Thei r Gra p h s n 90 100 110 120 130 140 150 R(n
$700 $715 $720 $715 $700 $675 2
) $675
Profit
C
C
0.95
x x
69. (a) (b) (3000)2 + h2 = d 2 h =d 2 (3000)2 d Domain: d ≥ 3000 (because both d ≥ 0 and d 2 (3000)2 ≥ 0) h 3000 ft 70. F ( y)= 149 76 10 y 5 2 (a) y 5 10 20 30 40 F ( y) 26,474.08 149,760.00 847,170.49 2,334,527.36 4,792,320
=
= 6000 +
x = 6000 + 0 95
x
(c) 1,000,000 = 149.76 10 y 5 2 1,000,000 = y 5 2 149.76 10 2111 56 ≈ y5 2 21 37 feet ≈ y ( ) ( ) 71. (a) R = nrate = n8 00 0 05 n 80 , n ≥ 80 n = 12 00n 0 05n2 = 12n = 240n n2 , n ≥ 80
2020
(b)
(b)
6.54millionmoretax returnswere made through e-file each year from 2007 to 2014
The algebraic model is a good fit to the actual data.

t 7 8
N 80
t 11
N 106.1 112.7
125.8 ( f m
( i n ( (
9 10
0 86 5 93 1 99 6
12 13 14
119.2
i li on s
2014
=
7 ≈ 6.54
(b) N 130 120 110 100 90 S e c t i o n 2 2 Function s 185 f ( x)= x 2 2 x + 4 f (2 + h)=(2 + h)2 2(2 + h)+ 4 4 + 4h + h2 4 2h + 4 h2 + 2h + 4 f (2)=(2)2 2(2)+ 4 = 4 f (2 + h) f (2)= h2 + 2h f (2 + h) f (2) = h 2 + 2h = h + 2, h ≠ 0 73. h h 2 80 74. f ( x)= 5x x ) ( ) ) 70 t 8 9 1011121314 Year (7 ↔ 2007) N = 6 54t + 34.2 (d) f 5 + h =55+ h 5 +h 2 25 + 5h (25 + 10h + h2 ) 25 + 5h 25 10h h2 h2 5h f (5)= 5(5) (5
2 25
5
h h h(h+ 5)= (h + 5), h ≠ 0 h
(a) f (2014) f (2007)= 125 8 − 80 0
20077
45 8
Approximately
)
25=0 f (5 + h) f (5)= h2
h
y = 6
75. f ( x) = x 3 + 3x x + h = x + h 3 + 3 x + h ) ( ) ( ) = x 3 + 3x 2h + 3xh2 + h3 + 3x + 3h f ( x + h) f ( x) h (x 3 + 3x 2 h+ 3xh2 + h3 + 3x + 3h ) (x 3 + 3x ) = h 2 + 3xh + h 2+ 3 = h (3x ) h = 3x 2 + 3xh + h2 + 3, h ≠ 0
( x)= 4 x 3 2x f ( x + h)= 4( x + h)3 2( x + h)
4(x3
3x2h
3xh2
h3 ) 2 x 2h = 4 x 3 + 12x 2h + 12 xh2 + 4h3 2x 2h
( x + h) f ( x)= (4 x +12 x h+12 xh + 4h 2 x 2h ) (4 x 2 x ) 3 2 2 3 3 h h 12x 2 h + 12 xh2 + 4h3 2h h h(12 x 2 + 12 xh + 4h2 2) h
12x 2
12xh + 4h2 2, h ≠ 0
05x + 40 0; The models are similar.
f
=
+
+
+
f
=
+
True. The set represents a function. Each x-value is mapped to exactly one y-value
By plotting the points, we have a parabola, so g ( x)

2 . Because ( 4, 32) is on the graph, you have 32
By plotting the data, you can see that they represent a
90. Because f ( x) is a function of an evenroot,theradicand cannot be negative g ( x) is an odd root, therefore the radicand can be any real number. So, the domain of g is all real numbers x and the domain of f is all real numbers x suchthat x ≥ 2. line, or f ( x)= cx Because (0, 0) and (1, 1 ) are on the line, the slope is 1 So, f ( x)= 4 x
Because the function is undefined at 0, we have r( x)= c x Because ( 4, 8) is on the graph, you have 8 = c 4 c = 32 So, r( x)= 32 x
By plotting the data, you can see that they represent h( x) = c x Because 4 = 2 and 1 = 1, and the corresponding y-values are 6 and 3, c = 3 and h( x) = 3 x
85. False The equation y 2 = x 2 + 4 is a relation between x and y. However, y =± x 2 + 4 does not represent a function


91. No; x is the independent variable, f is the name of the function


True. A function is a relation by definition.
False. The range is [ 1, ∞).
C h a p te r 2 F unction s an d Thei r Gra p h s 4 4 1 g ( x)= x 1 2 g(x) g (3) 1 1 2 f (t ) f (1) 1 = t 2 1 = x 9 x 3 x 3 = 1 2 = 1 1 1 9 x 2 f (t ) f (1) t 2 ) = 9x 2 ( x 3 ) t 1 t 1 ( = (x + 3 )( x 3) 9x 2 ( x 3 1 + t 2 =( )( ) ) t 2 t 1 x + 3 ( ) t 1 =( )( ) = 9x 2 , x ≠ 3 t 2 1 = t 2 t 1 , t ≠1 79. f ( x)= 5x f (x) f (5) = 5x 5 , x ≠ 5
x 5 x 5 The domain of f ( x)=x 1 includes x = 1, x ≥ 1 1 80. f ( x)=x2 3 + 1 () andthe domain of g ( x) = x 1 doesnot include f 8 =823 +1=5 2 3 = 1 because you cannot divide by 0 The domain of 1 f (x) f (8) = x +1 5 = x 2 3 4 , x ≠ 8 g ( x)= is x > 1 So, the
x 8 x 8 x 8 x
the
domain
functions do not have
1
same
c(
)2 c
So, g
x
= 2 x
= cx
=
4
= 2
(
)
2
92. (a) Theheight h is a function of t because for each value of t there is a corresponding value of h for 0 ≤ t ≤ 2 6
Using the graph when t = 0 5, h ≈ 20 feet and when t = 1 25, h ≈ 28 feet.
The domain of h is approximately 0 ≤ t ≤
2.6. No, the time t is not a function of the height h because some values of h correspond to more than one value of t.
(a) Yes The amount that you pay in sales tax will increase as the price of the item purchased increases.
No. The length of time that you study the night before an exam does not necessarily determine your score on the exam
C h a p te r 2 F unction s an d Thei r Gra p h s
(a) No During the course of a year, for example, your salary may remain constant while your savings account balance may vary That is, there may be two or more outputs (savings account balances) for one input (salary). Yes The greater the height from which the ball is dropped, the greater the speed with which the ball will strike the ground
Section 2.3 Analyzing Graphs of Functions
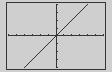
A vertical line intersects the graph more than once, so y is not a function of x.
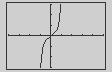
A vertical line intersects the graph at most once, so y is a function of x
= 3x + 18
]
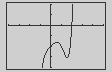
A vertical line intersects the graph at most once, so y is a function of x y is not a function of x Some vertical lines intersect the graph twice
( ) S e c t i o n 2 3 Analyzi ng Grap h s of Funct i ons 187
Vertical
decreasing
Line Test zeros
maximum average rate of change; secant odd
f
Domain: ( 2, 2]; Range: [ 1, 8] f ( 1)= 1
(0)= 0 f (1)= 1
f ( x)
3x + 18 = 0 3x = 18 = 6 f ( x)= 15 2 x 15 2 x = 0 2 x = 15 15 = 2 f (2)= 8 Domain : [ 1, ∞); Range: ( ∞ , 7] f ( 1)= 4 f (0) = 3 f (1) = 6 f (3)= 0 Domain: ( ∞ , ∞); Range: ( 2, ∞) f (2) = 0 f (1) = 1 f (3)= 2 f ( x
= 2
2 7
30 2x 2 7 x
= 0 (2 x + 5 )( x 6
= 0 2 x + 5 = 0 or x 6 = 0 x = 5 x = 6 2 f ( x)= 3x 2 + 22 x 16 3x 2 + 22x 16 = 0 (3x 2)( x + 8)= 0 3x 2 = 0 x = 2 3 x + 3 f ( 1
3 19. f (x )= 2 x 2 6
x + 3 = 0 2 x 2 6 x + 3 = 0 x = 3 2 20. f ( x) = x 9 x + 14 4 x
)
x
x
30
)
)=
Domain: ( ∞ , ∞); Range: (–∞ , 1
f ( 2)= 3 f (1)= 0 f (0)= 1
f (2)= 3
x 2 9 x + 14 = 0 4 x )( x 7 x 2 = 0 x 7 = 0 x = 7 x 2 = 0 x = 2


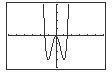
C h a p te r 2 F unction s an d Thei r Gra p h s Sectio n 2 3 Analyzi ng Grap h s of Funct i ons 191 27. (a) 6 – 2 10 3 x = 2 ) 2 ) 21. f ( x)= 1 3 x 3 2 x 1 3 x 2 x = 0 (3)(31 x 3 2x)= 0(3) x 3 6 x = 0 x(x 2 6)= 0 x = 0 or x 2 6 = 0 –10 Zeros: x = 0, 6 f ( x)= x 2 2 6x x 2 = 6 x =± 6 f ( x)= 25x 4 + 9 x 2 x2 (25x2 9)= 0 x 2 = 0 or 25x 2 9 = 0 x = 0 25x 2 = 9 2 9 25 x =± 3 5 23. f ( x)= x 3 4x 2 9x + 36 x 6x = 0 x( x 6)= 0 x = 0 x = 0 x 6 = 0 x = 6 28. (a) 5 – 4 10 –30 Zeros: x = 0 5, 7 f ( x)= 2 x 2 13x 7 2 2 x 13x 7 = 0 x 3 4x 2 9x + 36 = 0 ) ( x 2 x 4 9 x 4 = 0 ( (2 x + 1)( x 7)= 0 2 x + 1 = 0 x = 1 (x 4) x 2 9 = 0 x 4 = 0 x = 4 x 2 9 = 0 x =±3 24 f ( x)= 4x 3 24x 2 x + 6 4x 3 24x 2 x + 6 = 0 x 7 = 0 x = 7 29. (a) 5 6 3 ( ) 1 4x 2 x 6 1 x 6 = 0 ( ( x 6) 4x 2 1 = 0 Zero: x = 5.5 ( x 6 )( )( ) 2 x + 1 2x 1 = 0 (b) f ( x) = 2x + 11 x 6 = 0 or 2x + 1 = 0 or 2x 1 = 0 x = 6 x = 1 x = 1 2x + 11 = 0 2x + 11 = 0 2 25. f ( x) = 2 x 1 2 x 1=0 2 30 (a) x = 11 4 2 x = 1 2 x = 1 x = 1 2 26. f ( x)= 3x + 2 3x + 2 = 0 3x + 2 = 0 2 3 = x


C h a p te r 2 F unction s an d Thei r Gra p h s Sectio n 2 3 Analyzi ng Grap h s of Funct i ons 192 4 28 12 Zero: x = 26 f ( x)=3x 14 8 3x 14 8 = 0 3x 14 = 8 3x 14 = 64 x = 26
The function is decreasing on ( ∞ , 2) and increasing on (2,


The
The function is decreasing on (
The function is decreasing on ( 2, 1) and ( 1, 0) and increasing on (


and (0,
The function is decreasing on (−∞ , 1) and increasing on (
The function is increasing on ( ∞ , 0) and (2, ∞) and decreasing on (0, 2)
C h a p te r 2 F unction s an d Thei r Gra p h s Sectio n 2 3 Analyzi ng Grap h s of Funct i ons 193 x –2 1 0 1 2 g ( x) –2 –1 0 1 2 3, 2 3 31. (a) 5 – 4 10 – 30 Zero: x = 0 3333 f ( x)= 3x 1 6 3x 1 = 0 x 6 3x 1 = 0 f ( x)= x + 1 + x 1
function is increasing
(1, ∞).
function is constant
( 1, 1).
on
The
on
∞
, 1)
∞
2x + 1, x ≤ 1 39. f ( x)= 2 x 1 2, x > 1 x = The function is decreasing on ( 1, 0) and
on ( ) ( ) ∞ , 1 and 0,∞ 32 (a) 10 15 25 x + 3, x ≤ 0 40. f ( x) = 0 < x ≤ 2 30 2 x + 1, x > 2 ( ) ( ) Zeros: x =±2.1213
function is increasing on ∞ , 0 and 2,∞
f ( x)= 2 x2 9 3 x 2 x 2 9 = 0 3 x 2 x 2 9 = 0 x =± 3 2 =±2 1213
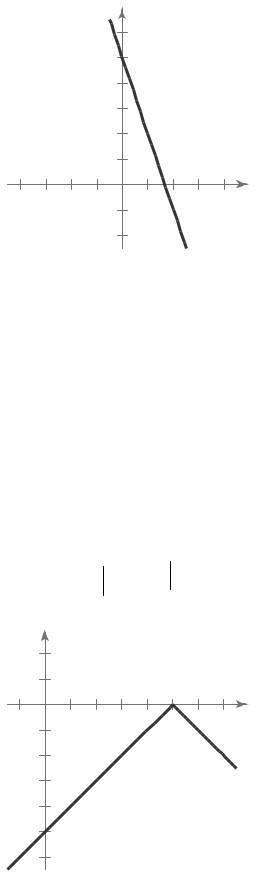
41. f ( x) = 3 4 0,2 2 f ( x)= 1 x 3
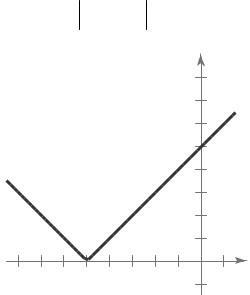
f ( x)= x 2 4 x
∞ , 2)
).
increasing
The
( )
The function is constant on
The function is decreasing on ( ∞ , ∞).
35 f ( x)= x 2 1 3 3 0 Constant on ( ∞ , ∞) x –2 1 0 1 2 f ( x) 3 3 3 3 3 42. g ( x)= x
∞)
∞
. 2 3 3 f ( x)= x 3 3x 2 + 2
1,
)
2 Increasing on ( ∞ , ∞)


C h a p te r 2 F unction s an d Thei r Gra p h s Sectio n 2 3 Analyzi ng Grap h s of Funct i ons 194 x –3 2 –1 0 1 f ( x) 0 –2 –1 414 0 2 x –2 1 0 1 2 g ( x) 1 5 2 3 5 2 1 x –2 –1 0 1 2 f ( x) 1 59 1 0 1 1 59 x –3 2 –1 0 1 f ( x) 2 3 2 1 0 43 g ( x)= 1 x 2 3 6 – 8 8 46 f ( x)= x x + 3 9 – 6 ( Decreasing on ) ∞,0 9 9 3 Increasing on ( 2, ∞); Decreasing on ( 3, 2) ( ) Increasing on 0,∞ f ( x)= x 3 2 f ( x)= 3x 4 6 x 2 4 6 6 4 Increasing on ( 1, 0), (1, ∞); Decreasing on ( ∞ , 1), (0, 1) x –2 1 0 1 2 f ( x) 24 –3 0 –3 24 45. f ( x)= 1 x 3 4 0 6 0 Increasing on(0,∞) x 0 1 2 3 4 f ( x) 0 1 2.8 5.2 8 f ( x)= x 2 3 6 6 6 4 2 1 Decreasing on ( ∞ , 1) 2 Decreasing on f ( x)= x( x + 3) 4 ( ) –∞,0; Increasing on ( ) 0, ∞ 5 7 4 Relative minimum: ( 1.5, 2.25)


S e c t i o n 2 3 Analyzi ng Grap h s of Funct i ons 191 ) 2 50. f ( x) =− x 2 + 3x 2 55. f ( x) = 4 x ] f ( x ≥ 0 on , 4 2 −∞ 3 6 y 5 4 4 ( ) 3 Relative maximum: 1 5, 0 25 2 1 51. h( x) = x 3 6 x 2 + 15 x 1 12 345 1 20 10 10 56. f ( x) = 4x + 2 ( ) 2 ) y f x ≥ 0 on 1 , ∞ 20 Relative minimum: 4 (4, 17) 4 x + 2 ≥ 0 ( ) 4 x ≥ 2 3 Relative maximum: 0, 15 x ≥ 1 2 52. f ( x)= x 3 3x 2 x + 1 1 2, ∞ 3 x 2 1 1 2 7 8 57. f ( x)= 9 x 2 7 Relative maximum: ( ) 0 15, 1 08 ( ) x ≥0 on y 10 [ ] 3, 3 Relative minimum: ( 2.15, ) 5.08 6 53. h( x)=( x 1) x 4 2 10 x 6 4 2 2 4 6 2 2 4 x 1 10 58. f ( x)= x 1 ( ) f x ≥ 0 on ∞ , 0 and 4, ∞ Relative minimum: 0.33, 0 38 ( ) ( ] [ ) x 2 4x ≥ 0 y 54. g ( x)= x 4 x x (x 4) ≥ 0 x 5 ( ][ ) 1 2 3 ∞,0, 4, ∞ 1 2 3 ( ) 4 Relative maximum: 2 67,3 08
To find the average rate of change of the amount the U.S. Department of Energy spent for research and development from 2010 to 2014, find the average rate of change from (0, f (0)) to (


The amount the U.S Department of Energy spent on research and development for defense decreased by about $6.14
As the time traveled increases, the distance increases rapidly, causing the average speed to increase with each time increment. From t = 0 to t = 4, the average speed is less than from t = 4 to t = 9 Therefore, the overall average from t = 0 to t = 9 falls below the average found in part (b)

2 2 ( ) 3 3 ) 192 C h a p te r 2 F unction s an d Thei r Gra p h s 59. f ( x) = x 1 ( ) [ 61. f ( x)= 2 x + 15 = = 2 f x ≥ 0 on 1,∞ f (3) f (0) 9 15 x 1 ≥ 0 3 0 3 1, ∞ [ x 1 ≥ 0 x ≥ 1 62. The average rate of change from x1 2. f ( x)= x 2 x +8 0 to x2 = 3 is f 5 f 1 16 = 23 7 = = 4 () () 5 1 4 4 60. f ( x) = x + 5 y The average rate of change from x1 1 to x2 = 5 is 4 8 63 f ( x)= x 3 3x 2 x 6 f (2) f ( 1) 4 2 = 6 ( 3)= 3 1 x1 The average rate of change from 1 1 to x2 = 2 8 6 4 2 x is 1. f ( x) 64. f ( x)= x 3 + 6 x 2 + x isalways greater than orequal to0 f ( x) ≥0 for f 6 f 1 all x. ( ) () = 6 6=0 ( ∞ , ∞) 6 1 5 1 to x2 = 6 is 0 65. (a) 100 0 4 50 The average rate of change from x1
f (4
) f 4 f 0 ) )= = = 6 1364 4 0 4 4
66
rate of change = s(t2 ) s(t1 ) t2 t1 = s(9) s(0) 9 0 = 540 0 9 0 = 60 feet per second
4,
)
billion each year from 2010 to 2014.
Average
The slope of the secant line through (3, s(3)) and (5, s(5)) is negative
The
5
(c) The average rate of change from t = 0 to t = 4:
0 4 4 second = 8 feet per
The slope of the secant line through (0, s(0)) and (4, s(4)) is positive.


The equation of the secant line:
(c) The average rate of change from t = 1 to t = 2:
1 16 64 48 = = = 48 feet
The slope of the secant line through (1, s(1)) and (2, s(2)) is negative


The equation of the secant line: m = 48
Using (1, s(1))=(1, 64) we have y 64 = 48(t 1)
y = 48t + 112 (f
0 3 0 ) = 2 1 1 1 s0 = 6, v0 = 64 s = 16t 2 + 64t + 6 100 0 5 0 s(3) s(0) = 54 6 = 16 3 03
e c
o n 2 3 Analyzi ng Grap h s of Funct i ons 193
0 = 120, s0 = 0 s = 16t 2 + 120t 270 0 8 0
The
of
from t = 3 to t = 5: s 5 s 3
S
t i
v
(c)
average rate
change
s(0)= 6, m = 16 5 3 2 = second 2 = 8 feet per Secant line:
y = 16t + 6 (f ) 100 0 5 0
s =
t 2
t +
100
The slope of the secant line is positive
y 6 = 16(t 0)
(a)
16
+ 72
6.5
(f )
equation of the secant line: m = 8
y 200 =
t 5
y = 8t + 240 270 0 5 0
Using (5, s(
))=(5, 200) we have
8(
)
s(4
5
0 8 0
s = 16t 2 + 80 120
) s(0) = 38
6.5 = 32
(a)
4
m
) 100 0 5 0
= 8, y = 8t + 6.5 (f
s 2 s
per second
120 0 3 0
)
C h a p te r 2 F unction s an d Thei r Gra p h s
f ( x)= x6 2 x2 + 3
f ( x)=( x)6 2( x)2 + 3
x 6 2 x 2 + 3
f ( x)
The function is even y-axis symmetry
g ( x)= x 3 5x
g ( x)=( x)3 5( x) x 3 + 5x
The function is odd Origin symmetry
h( x)= x x + 5
h( x)=( x) x + 5
x 5 x
≠ h( x)
The function is neither odd nor even. No symmetry.
The graph of f ( x)= 9 is symmetric to the y-axis, which implies f ( x) is even


f ( x)= 9 f ( x)
The function is even
78. f ( x)= 5 3x
The function is odd Origin symmetry
The graph displays no symmetry, which implies f ( x) is
neither
Thefunction is even y-axissymmetry
The graph displays no symmetry, which implies f ( x) is neither odd nor even
1 1 3 4
g ( x)
77. y 2 −6 −4 −2 246 2 4 6 8 10
=
y
5
4 3
≠ h( x)
2 1
1
2 x f
1 ( x
2 4 −3 2 1 2
74. f ( x) = x
x
( x)= x
)
=
1
2
odd nor even = f
f ( x
= 5 3 x ) ( ) = 5 + 3x 75. f (s) = 4s 3 2 ≠ f ( x) ( ) ≠− f ( x) = 4 s 3 2 ≠ f (s)
s
79.
y 2 76. g (s) = 4s 2 3 1 ( ) ( ) 2 3 1 1 x g s = 4 s = 4s 2 3 1 234567 2 3 = g (s) 4 5
x
x
( x)
The function is neither even nor odd ≠ f (
)
f ( x) = x 5 The function is neither odd nor even. No symmetry.
6
f ( x)=
5 = − x 5 ≠ f ( x) ≠ f ( x)
( x)
The function is neither even nor odd
The graph displays y-axis symmetry, which implies h( x) is even


The graph displays no symmetry, which implies f ( x) is neither odd nor even
f ( x )=3 ( x) 4
3 x 4
3 ( x +4)
3 x + 4
f ( x)
f ( x)
The function is neither even nor odd
h = top bottom
3 (4x x 2 )
The graph displays origin symmetry, which implies
3 4x + x 2
h = top bottom
The error is that 2x 3

x 3 5) The correct process is as follows. f

S e c t i o n 2 . 3 Analyzi ng Grap h s of Funct i ons 195 h( x)= x 2 4 y 82. f ( x)= 3 x 4 y 8 6 4 2 8 6 4 x 4 6 8 4 x 2 6 8 6 8
( x)=( x)2 4 = x 2 4 = h( x)
function is even 81. f ( x) = 3 4 x y 4 2 x 4 2 2 4 2 4
h
The
( x)
4
f
is odd
( x)= 3 4( x) 3 4 x (4x x2 ) 2x 3 4 x f ( x)
function is odd 2x x 2 L = right left 2 3 2 y
= right left 2 y 0 2 y
f
The
L
≠−(2
( x)= 2x 3 5 f ( x)= 2( x)3 5 2x 3 5 (2 x 3 + 5) ( f x ) ≠ f ( ) ( x and f x ) ( ) ≠ f x
( x)= 2 x 3 5
5
, so the function f
is neither odd nor even.
(a) For the average salary of college professors, a scale of $10,000 would be appropriate.
For the population of the United States, use a scale of 10,000,000
The
The
increases until 6
( x = 20 to x =
The maximum temperature according to the model is about 63.93°F. According to the data, it is 64°F. The minimum temperature according to the model is about 33.98°F. According to the data, it is 34°F. Answers may vary Temperatures will depend upon the weather patterns, which usually change from day to day.
91. False The function f ( x)= x 2 + 1 has a domain of all real numbers.


False An odd function is symmetric with respect to the origin, so its domain must include negative values.
True A graph that is symmetric with respect to the yaxis cannot be increasing on its entire domain

94. (a) Domain: [ 4, 5); Range: [0, 9] (3, 0)
Increasing: ( 4, 0)∪(3, 5); Decreasing: (0, 3)
Relative minimum: (3, 0)
Relative maximum: (0, 9)
Neither is unemployed, use a scale of 10%
For the number of games a college football ( 3 5 , 7)
team wins in a single season, single digits would be appropriate
For each of the graphs, using the suggested scale would show yearly changes in the data clearly
If f is even, another point is (5 , 7)
If f is odd, another point is ( 5 3 , 7) (2a, 2c) ( 2a, 2c) ( 2a, 2c)
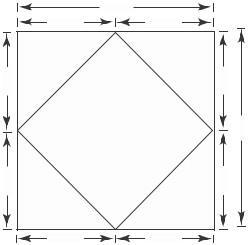
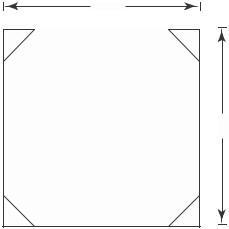
2 3 196 C h a p te r 2 F unction s an d Thei r Gra p h s 88. 8 m x x 90. (a) 70 x x 8 m x x x x 0 24 0
model is an excellent fit
temperature was increasing from 6 A M
A =(8)(8) 4( 1 )(x)( x)= 64 2x 2 noon ( x = 0 to x = 6). Then it decreases until 2 A M ( x =6 to x =20) Then the temperature Domain: 0 ≤ x ≤ 4 (b) 80 0 4 0 Range: 32 ≤ A ≤ 64 (c) When x = 4, the resulting figure is a square 8 m 4 4 4 4 8 m 4 s 4 4 4
until
42 + 42 = s 2 s = 32 = 4 2 meters
By the Pythagorean Theorem,
For the percent of the civilian workforce that A M
24)
All the graphs pass through the origin The graphs of the odd powers of x are symmetric with respect to the origin and the graphs of the even powers are symmetric with respect to the y-axis As the powers increase, the graphs become flatter in the

Equations of odd functions contain only odd powers of x Equations of even functions contain only even powers of x
Odd functions have all variables raised to odd powers and even functions have all variables raised to even powers. A function that has variables raised to even and odd powers is neither odd nor even
(a) Even The graph is a reflection in the x-axis.
Even The graph is a reflection in the y-axis.
Even The graph is a vertical translation of f

Neither. The graph is a horizontal translation of f
Section 2.4 A Library of Parent Functions
S e c t i o n 2 3 Analyzi ng Grap h s of Funct i ons 197 C h a p te r 2 F unction s an d Thei r Gra p h s p 97 (a) y = x (b) y = x 2 (c) y = x 3 4 4 4 6 6 6 6 6 6 4 4 4 (d) y = x 4 (e) y = x 5 (f ) y = x 6 4 4 4 6 6 6 6 6 6 4 4 4
interval 1 < x < 1. 2 98. 2 3 f g 4 5 h 3 3 4 5 4 2 3 f ( x) = x 2 x 4 is even. g ( x) = 2 x 3 +1 is neither h( x) = x 5 2 x 3 + x is odd 3 2 3 j k 4 5 4 5 4 5 3 4 3 j( x) = 2 x 6 x 8 is even k ( x) = x 5 2 x 4 + x 2 is neither p( x) = x 9 +3x 5 x 3 + x is odd
Greatest integer function 6. Constant function
Identity function 7 Absolute valuefunction
Reciprocal function 8. Cubic function
Squaring function 9. Linear function
Square root function 10. linear
1.
2.
3.
4.
5.
