


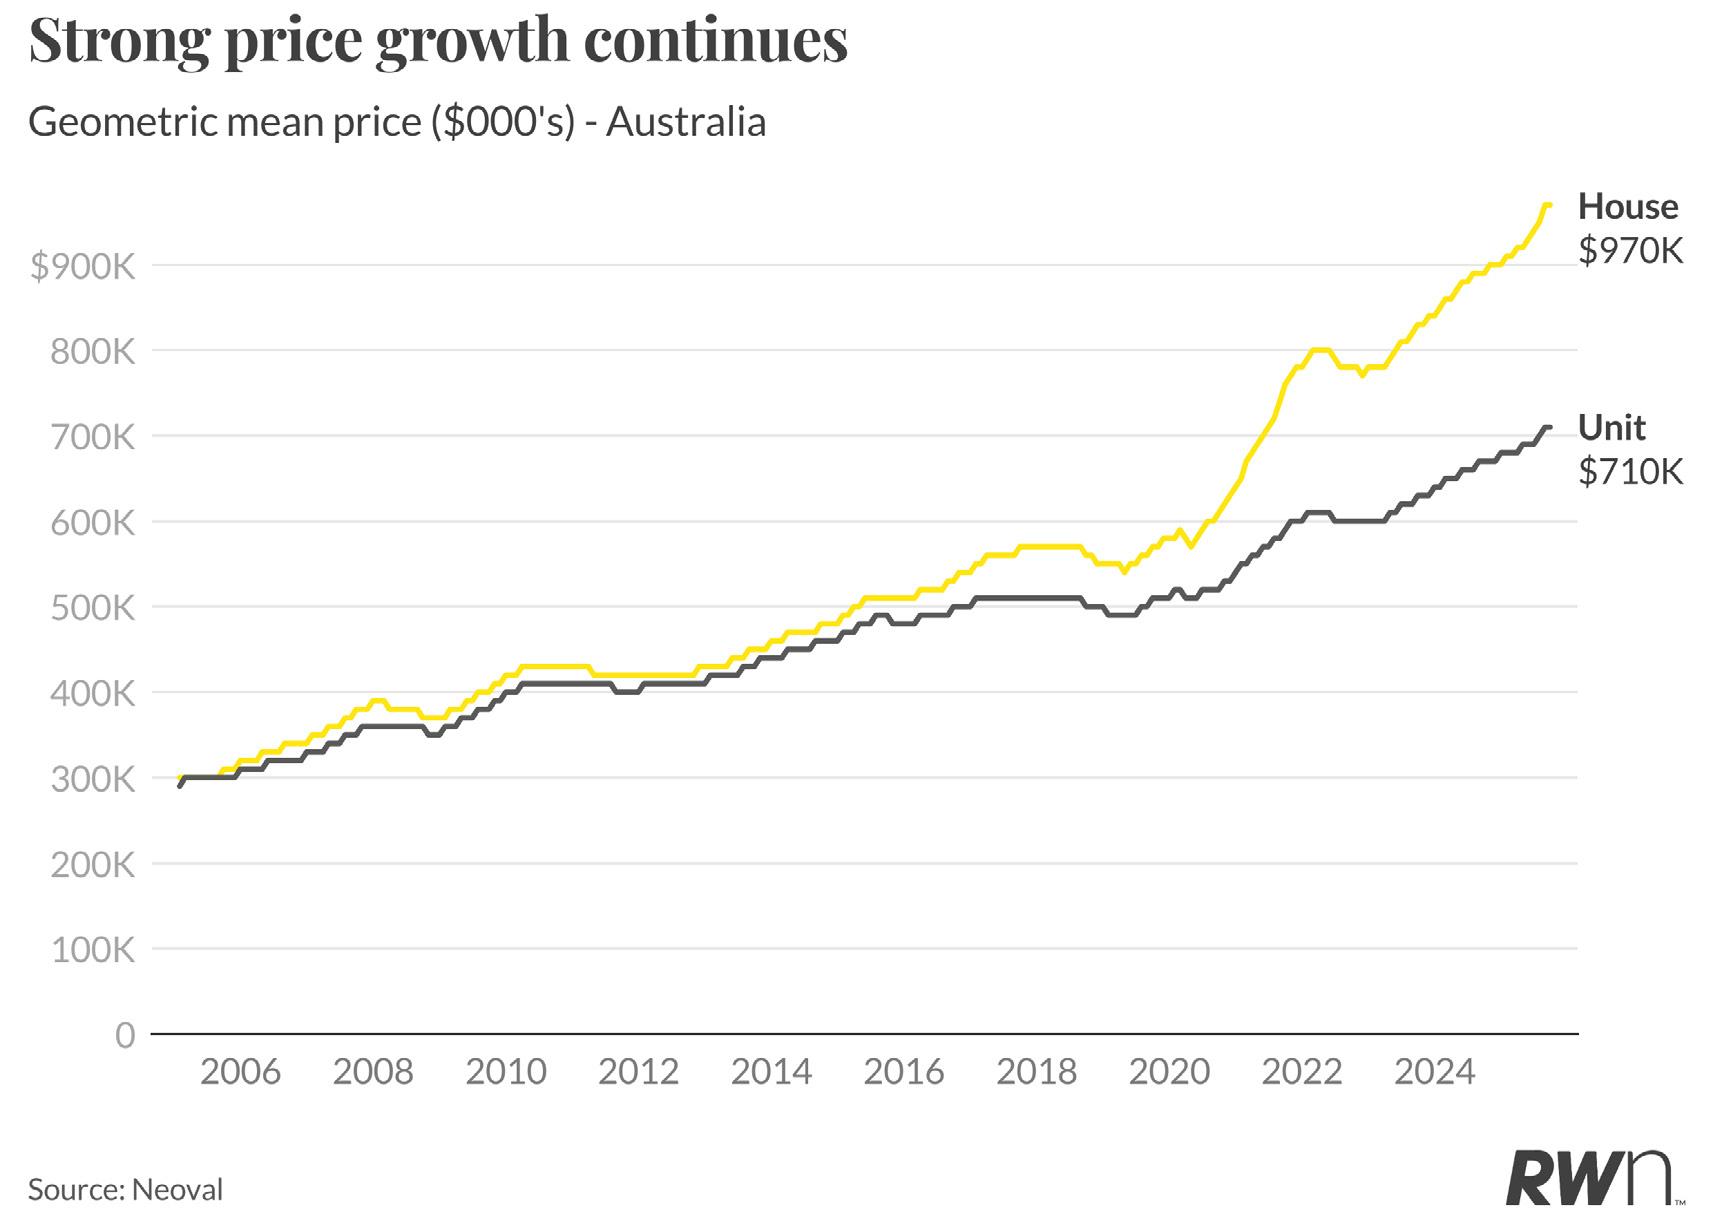
Australia’s property market has reached a significant milestone in September, with the national median house price hitting $970,000, reflecting a 0.6 per cent monthly increase and 8.9 per cent annual growth. Units have similarly reached $710,000, posting a 0.5 per cent monthly gain and 6.9 per cent year-on-year appreciation. This sustained momentum comes despite the Reserve Bank’s decision to hold the cash rate at 3.60 per cent in September, demonstrating the market’s resilience in the face of these interest rates.
The RBA’s decision to hold reflects mixed economic signals, with softening employment data balanced against persistent inflation concerns. However, the federal government’s announcement of expanded support for first home buyers, including access to properties with just five per cent deposits, has injected fresh optimism into the market. This policy initiative, combined with anticipation of potential rate cuts in coming months, appears to be supporting both buyer and vendor confidence as spring selling activity intensifies. The consistent upward trajectory across both houses and units underscores the fundamental supply-demand imbalance driving the Australian property market, with demographic pressures mounting and construction activity remaining subdued.
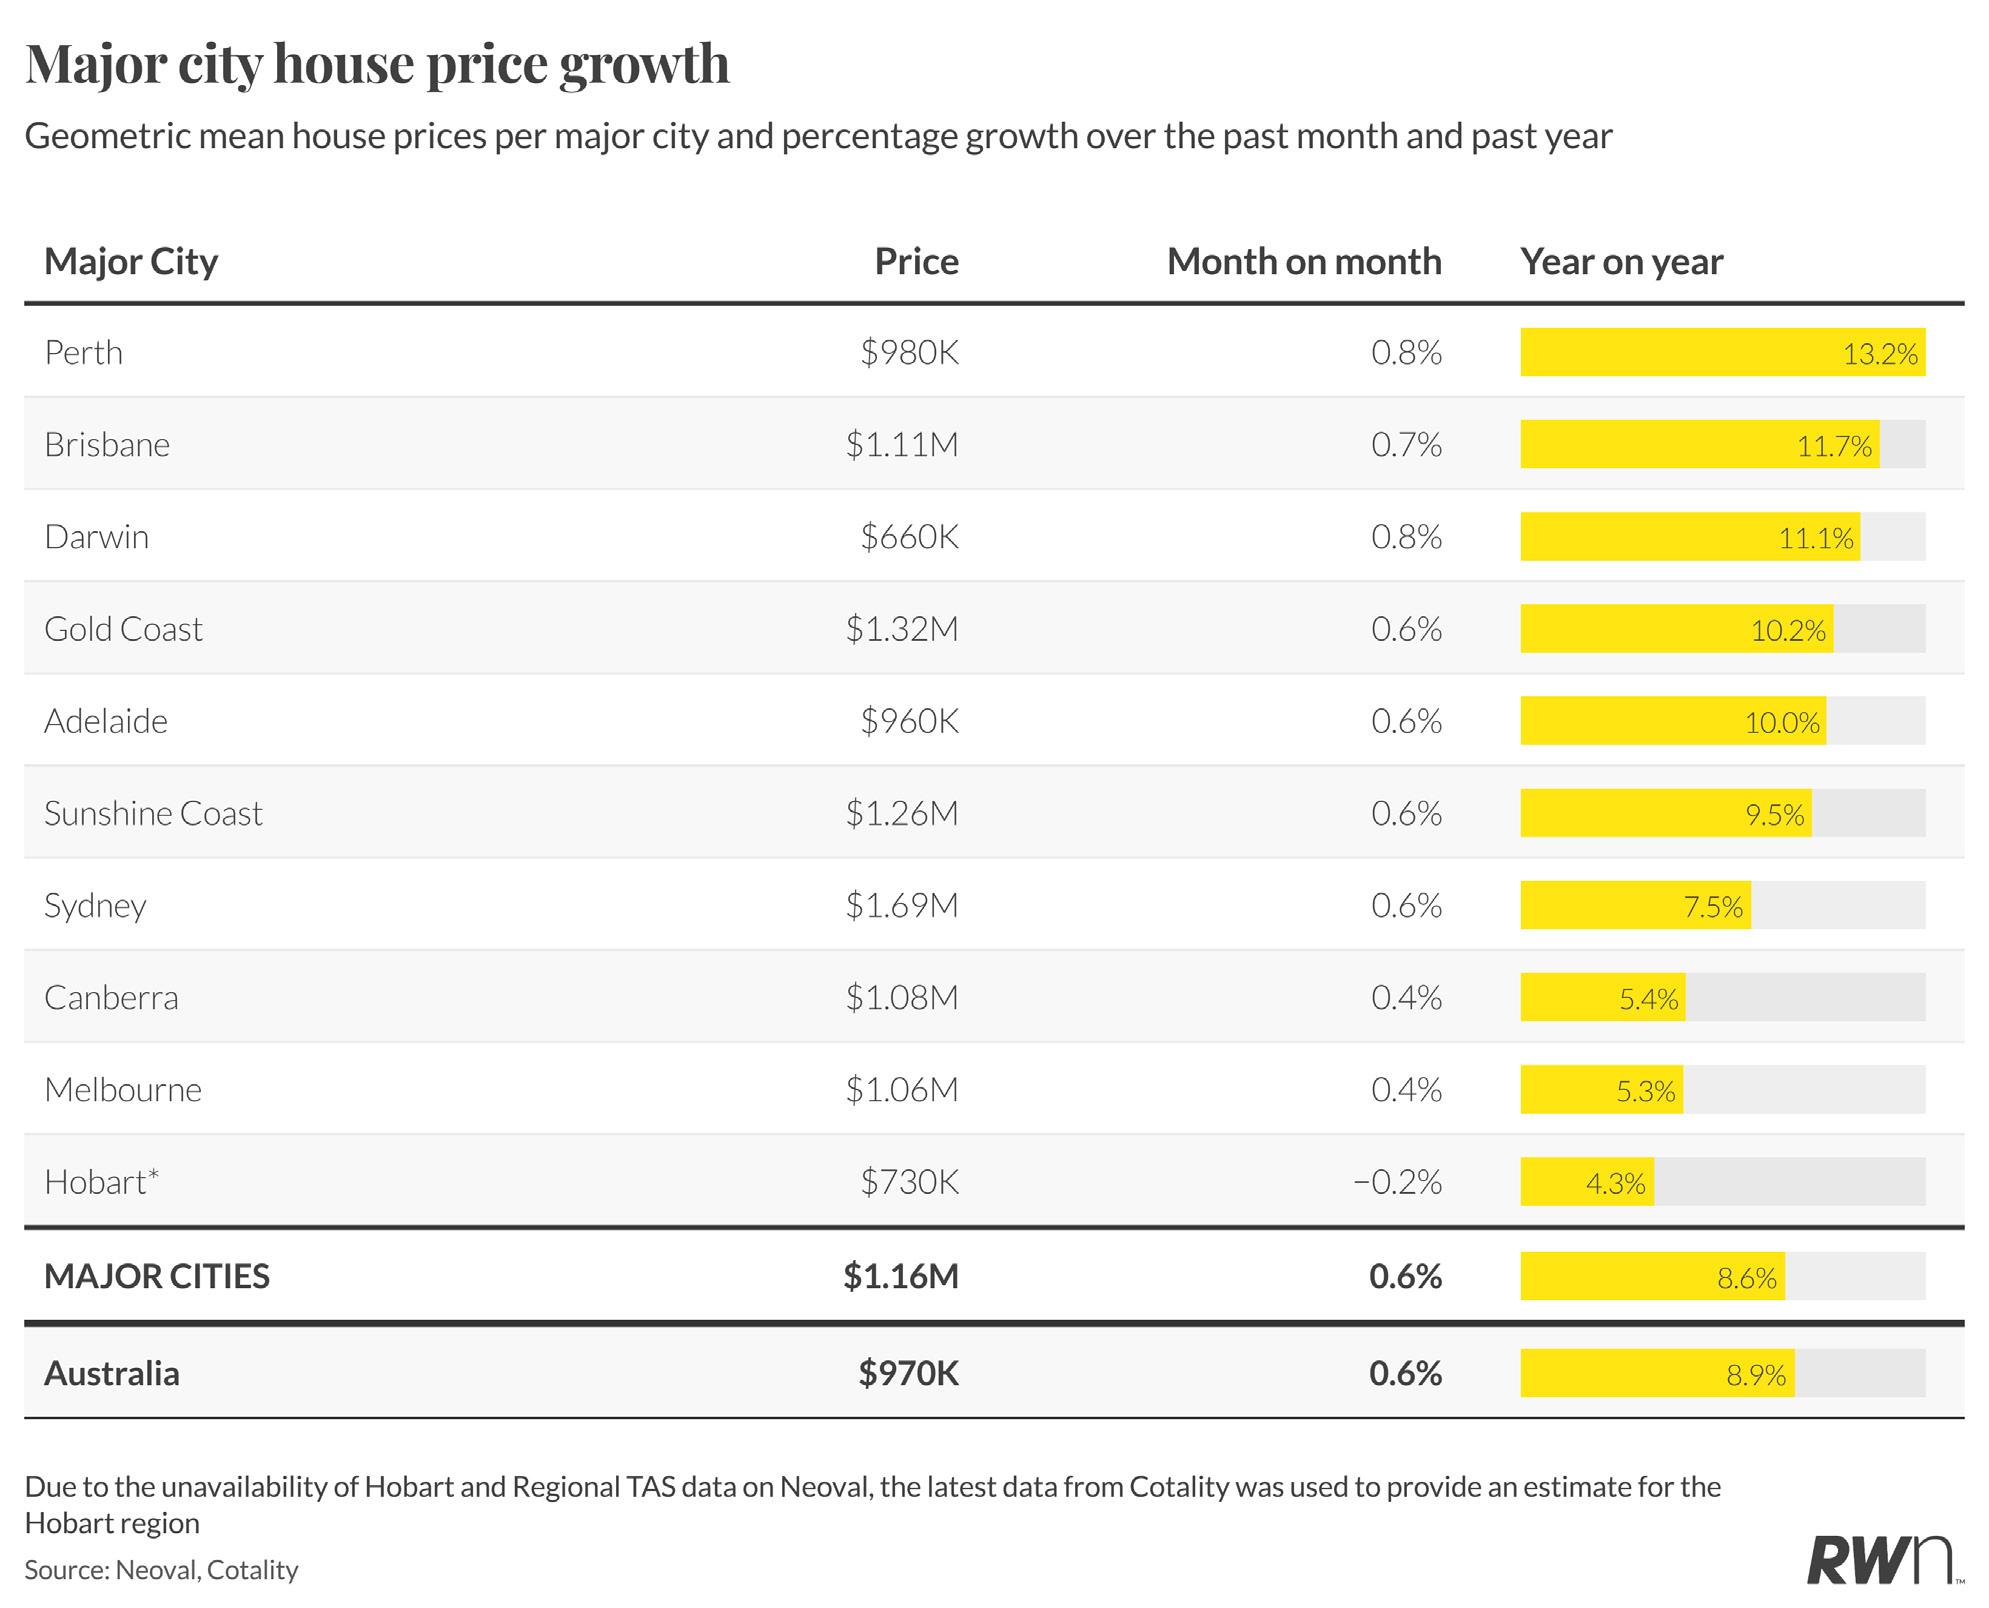
Metropolitan house prices recorded a uniform 0.6 per cent monthly increase across many major cities in September, masking divergent annual performance across capitals. Perth continues to lead the nation with 13.2 per cent annual growth, reaching a median of $980,000, while Brisbane follows at 11.7 per cent growth with prices now exceeding $1.11 million. Darwin has emerged as a strong performer with 11.1 per cent annual appreciation, reaching $660,000.
The traditional powerhouses of Sydney and Melbourne show more moderate growth, with Sydney recording 7.5 per cent annual gains to reach $1.69 million, while Melbourne posts just 5.3 per cent growth at $1.06 million. Canberra and Hobart remain the weakest markets year-on-year, though both recorded positive monthly movements. Adelaide’s 10.0 per cent annual growth to $960,000 reflects its continued appeal as an affordable alternative to the eastern seaboard capitals. The combined major cities figure of $1.16 million represents an 8.6 per cent annual increase, demonstrating the broad-based nature of current price appreciation despite varying regional dynamics.

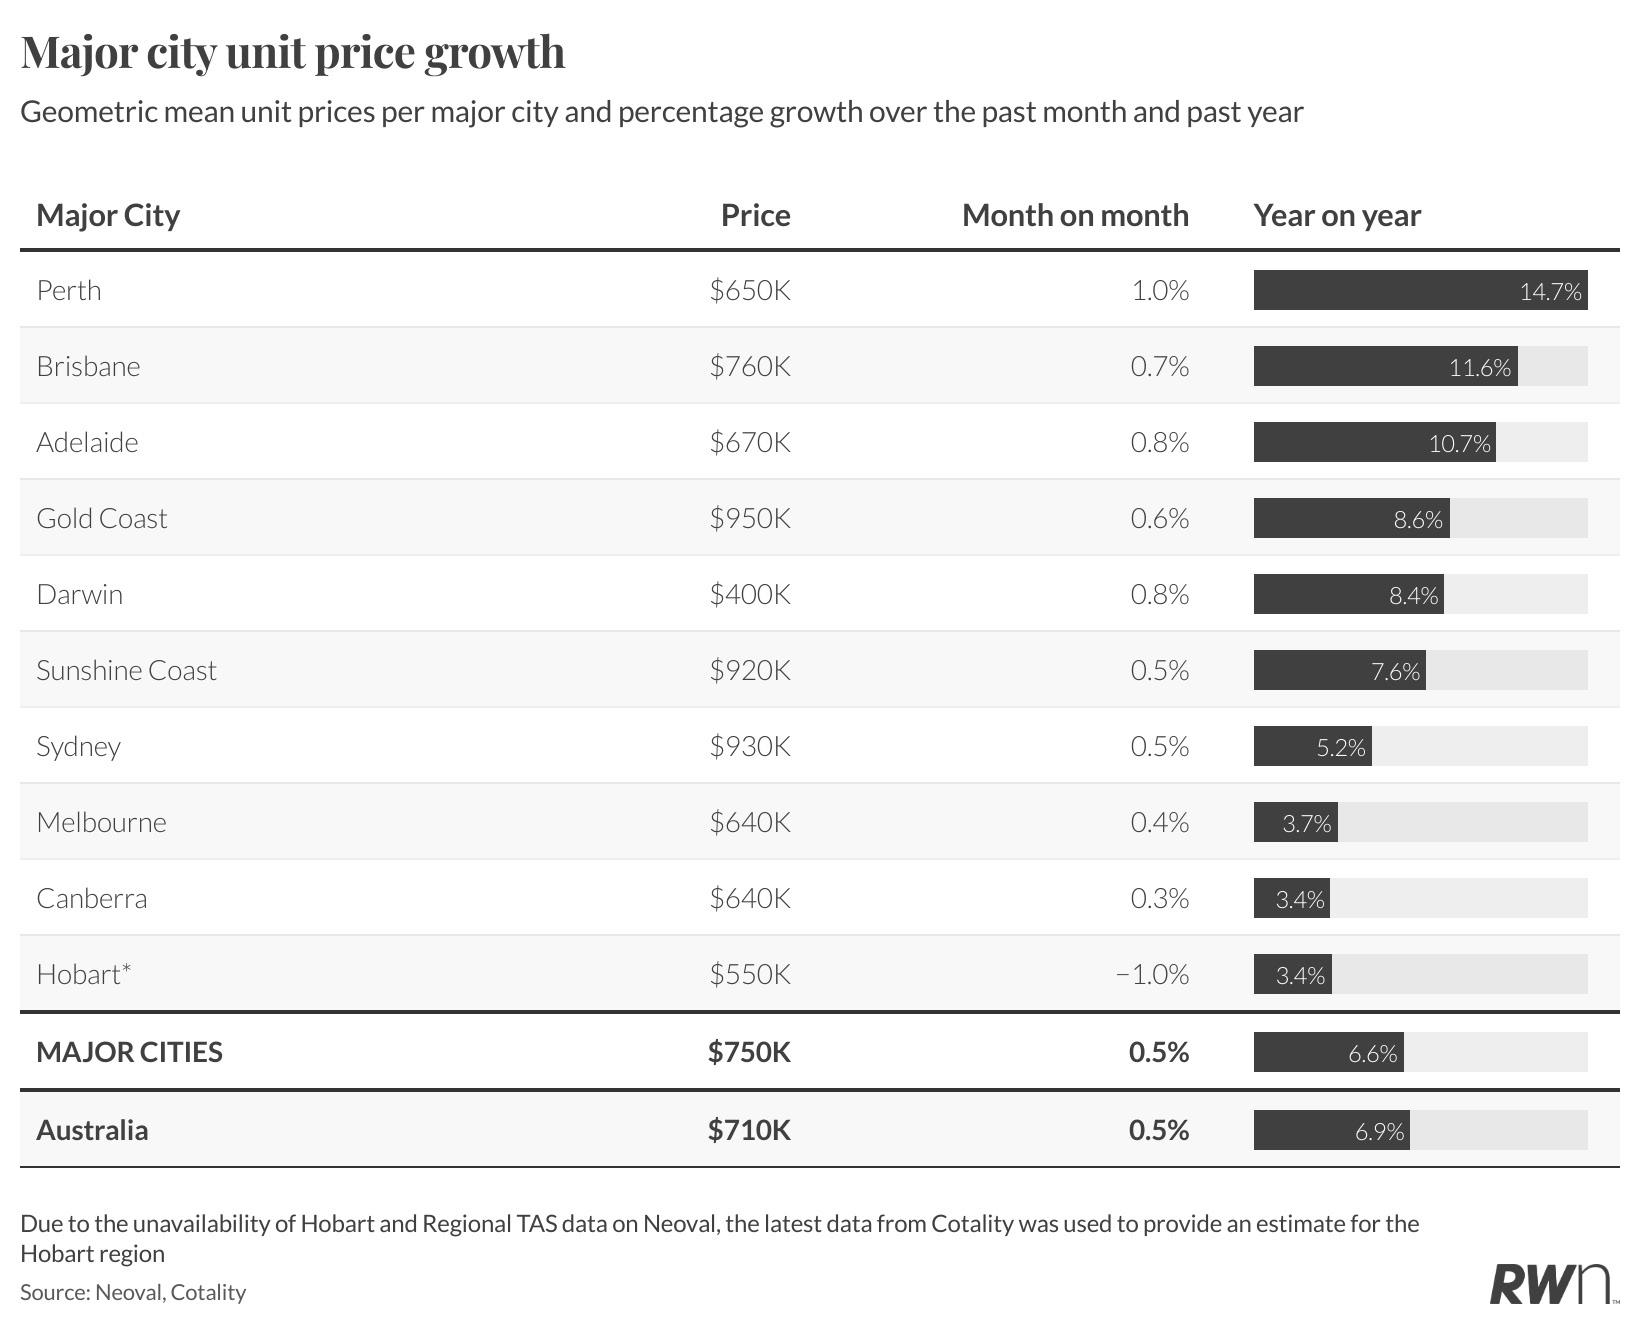
Perth’s unit market continues to demonstrate exceptional strength, posting a 1.0 per cent monthly increase and leading the nation with 14.7 per cent annual growth, reaching a median of $650,000. Brisbane follows with 0.7 per cent monthly growth and 11.6 per cent annually at $760,000, while Adelaide recorded 0.8 per cent monthly and 10.7 per cent annual appreciation to reach $670,000.
Sydney and Melbourne units both posted 0.5 per cent and 0.4 per cent monthly gains respectively, translating to more modest annual increases of 5.2 per cent and 3.7 per cent, with medians now at $930,000 and $640,000. The Gold Coast and Darwin markets showed solid momentum with 0.6 per cent and 0.8 per cent monthly increases and annual growth of 8.6 per cent and 8.4 per cent respectively. Hobart recorded a slight monthly decline of 1.0 per cent, though annual growth remains positive at 3.4 per cent. Major cities combined posted a 0.5 per cent monthly increase and 6.6 per cent annual growth to reach $750,000, slightly ahead of the national unit median.

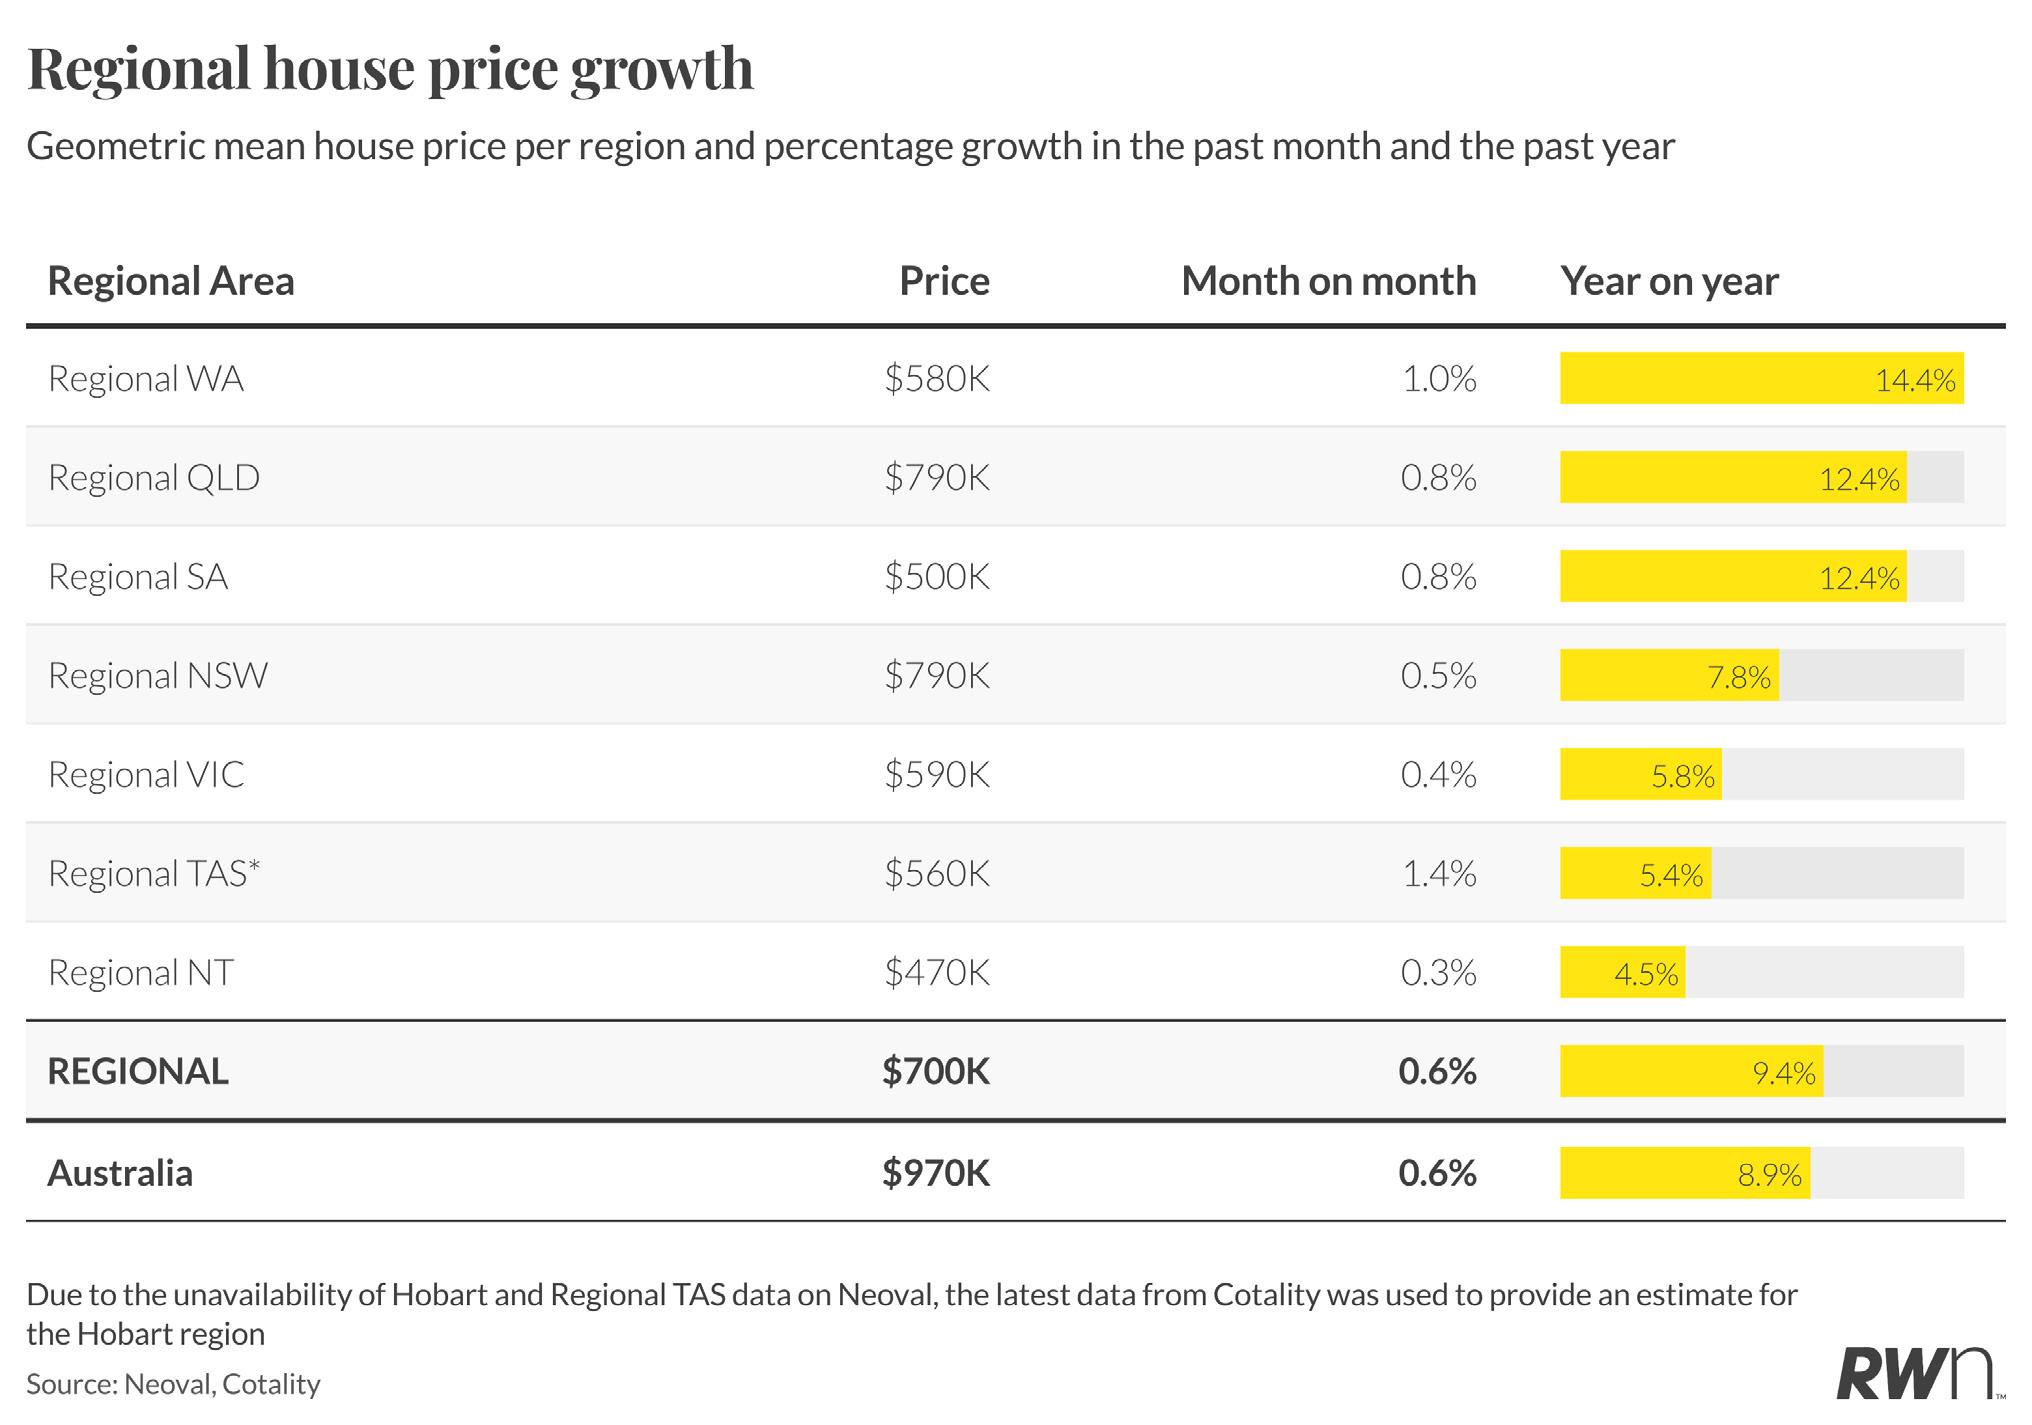
Regional Western Australia has surged to the forefront of regional markets, recording a robust 1.0 per cent monthly increase and 14.4 per cent annual growth, with median house prices reaching $580,000. This exceptional performance reflects the state’s ongoing mining related prosperity and internal migration patterns. Regional Queensland and South Australia both posted 0.8 per cent monthly gains, with annual growth of 12.4 per cent each, reaching medians of $790,000 and $500,000 respectively.
Regional New South Wales recorded a more modest 0.5 per cent monthly increase, translating to 7.8 per cent annual growth and a median of $790,000. Regional Victoria and Tasmania show more constrained growth at 0.4 per cent and 1.4 per cent monthly respectively, with annual increases of 5.8 per cent and 5.4 per cent. Regional Northern Territory posted the smallest monthly gain at 0.3 per cent, though annual growth of 4.5 per cent remains positive. The combined regional median of $700,000 represents a 0.6 per cent monthly increase and 9.4 per cent annual growth, outpacing the national figure and highlighting the continued appeal of regional lifestyle opportunities.

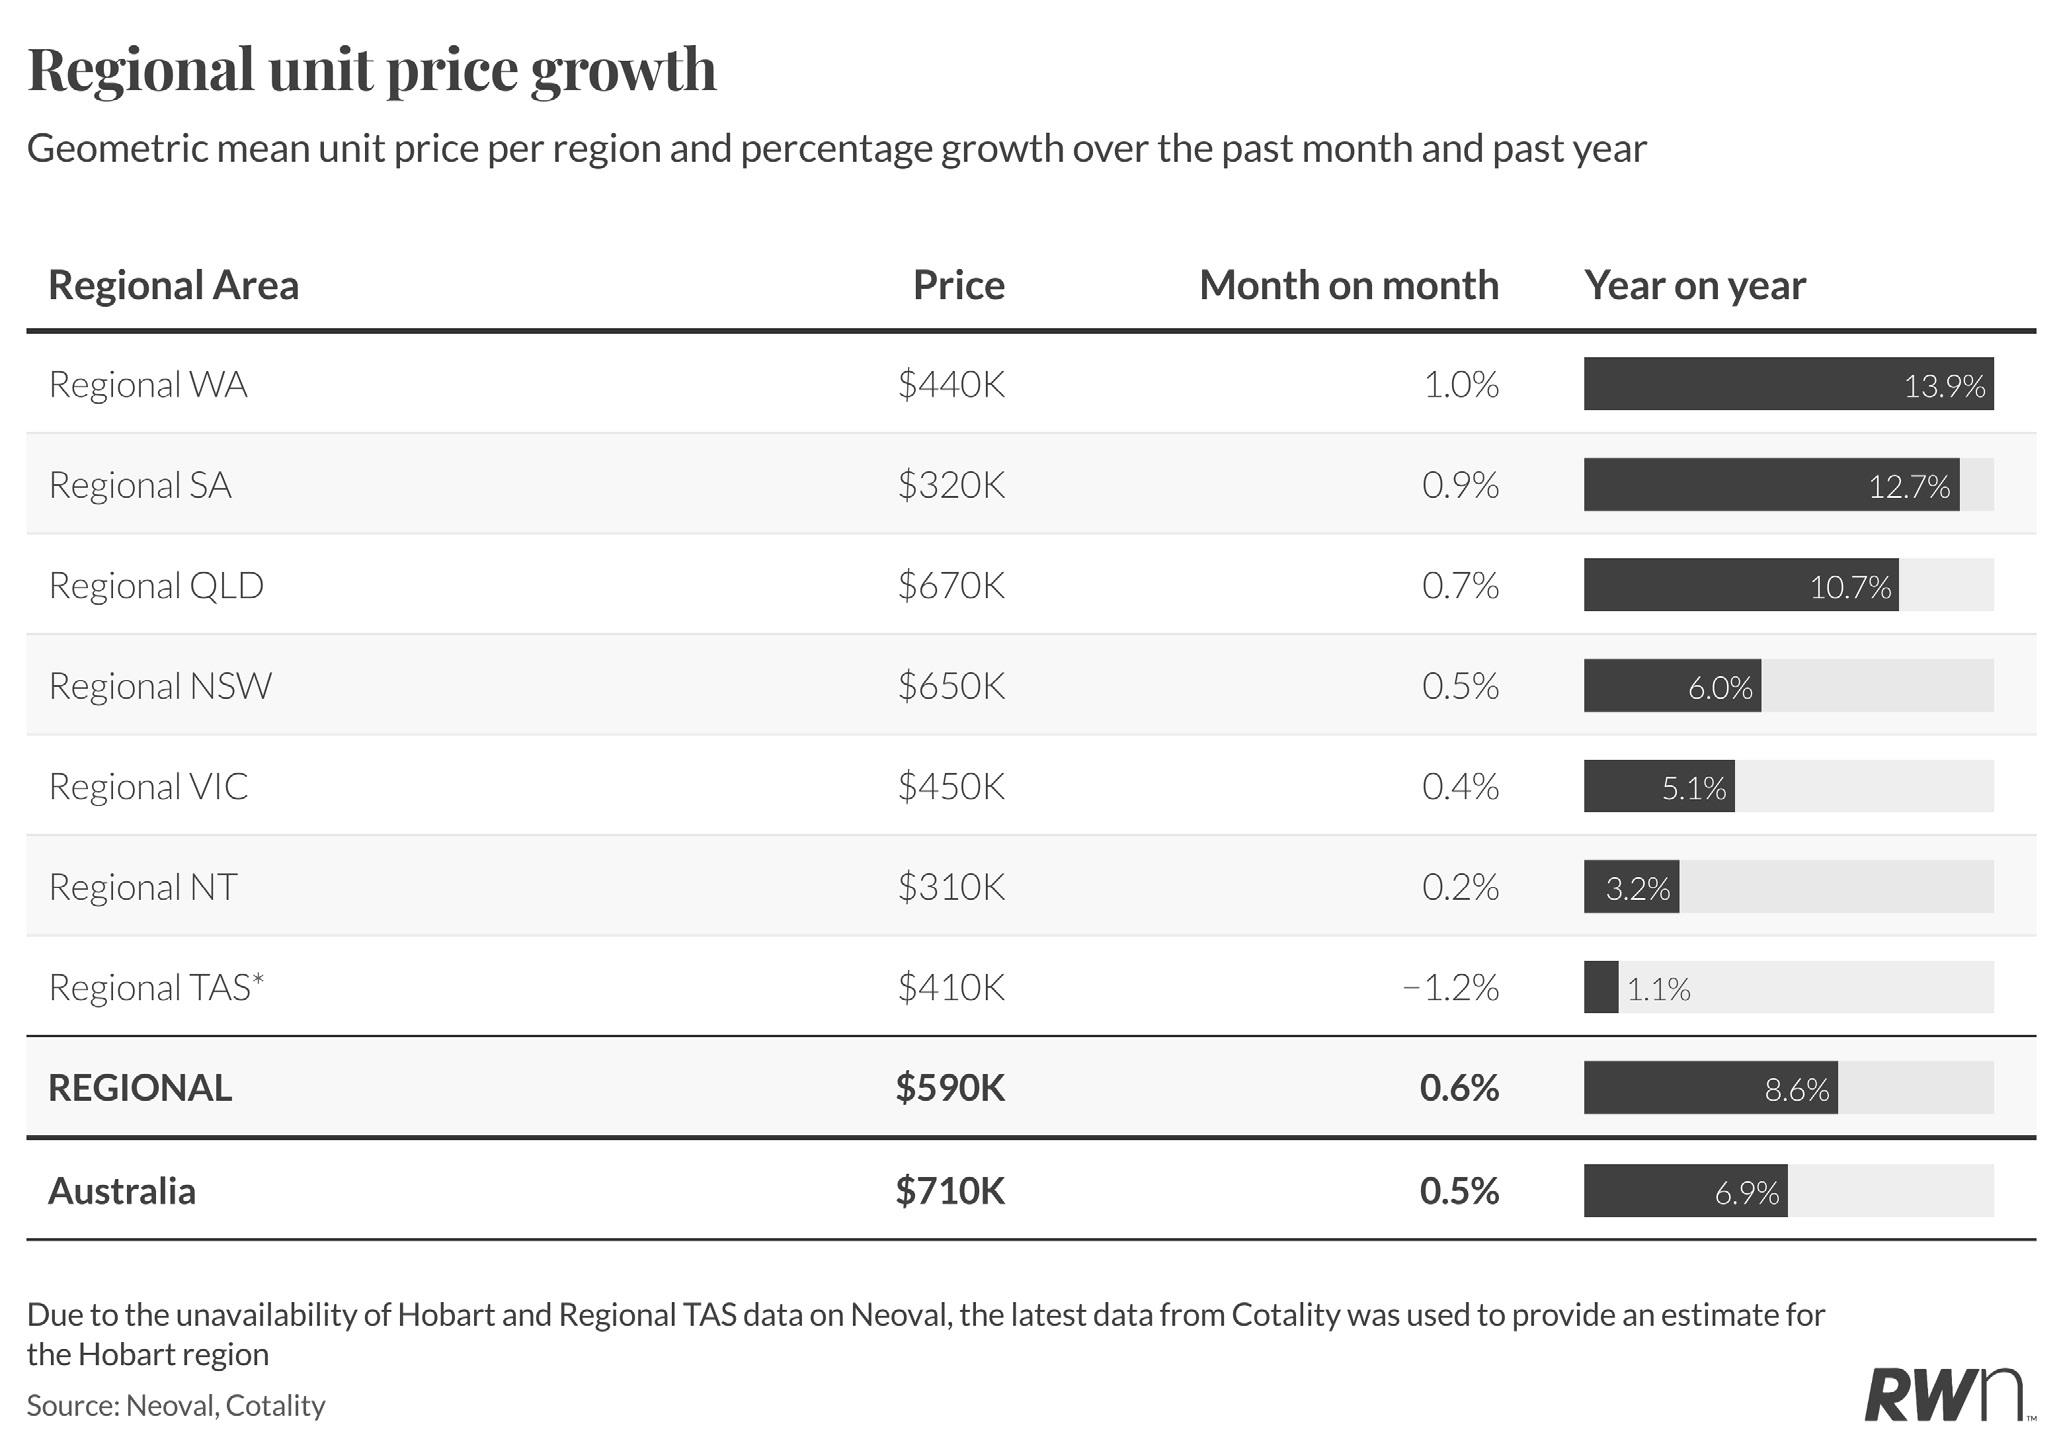
Regional Western Australia continues to dominate the regional unit sector, posting a 1.0 per cent monthly increase and impressive 13.9 per cent year-on-year growth, with units now averaging $440,000. Regional South Australia follows with 0.9 per cent monthly growth and 12.7 per cent annually, reaching $320,000, demonstrating the ongoing appeal of more affordable regional markets.
Regional Queensland recorded a 0.7 per cent monthly increase and 10.7 per cent annual growth at $670,000, while regional New South Wales posted 0.5 per cent monthly and 6.0 per cent annual appreciation, reaching $650,000. Regional Victoria showed modest momentum with 0.4 per cent monthly growth and 5.1 per cent annually at $450,000.
Regional Tasmania recorded a slight monthly decline of 1.2 per cent, though annual growth remains minimal at 1.1 per cent with units averaging $410,000. The combined regional unit median of $590,000 represents a 0.6 per cent monthly increase and 8.6 per cent annual growth, continuing to outperform metropolitan unit markets.
MAJOR CITY HOUSE PRICES (%CHANGE) | SINCE LAST MONTH
$ GEOMETRIC MEAN PRICE % CHANGE IN PRICE
Source: Neoval
as of
REGIONAL HOUSE PRICES (%CHANGE) | SINCE LAST MONTH
REGIONAL AUSTRALIA
$700,000 0.6%
Source: Neoval

LISTINGS ACTIVITY
September has delivered encouraging news for property supply, with national listing volumes climbing to 41,433 properties, representing a solid increase from August’s 36,500 levels. While this remains below September 2024’s 46,551, it significantly exceeds September 2023’s 39,009, demonstrating improved vendor participation compared to the tightly constrained conditions of two years ago.
The upward trajectory from August to September breaks the typical seasonal pattern of declining listings during this transitional period, suggesting vendors are responding to sustained buyer demand and elevated prices by bringing properties to market. The 2025 trend line has tracked consistently above 2023 levels throughout the year, with monthly volumes ranging between 34,000 and 42,000 properties. This improved supply position relative to 2023, combined with strong clearance rates and continued price growth, indicates a market finding better balance than the severely constrained conditions that drove exceptional price appreciation in previous years.


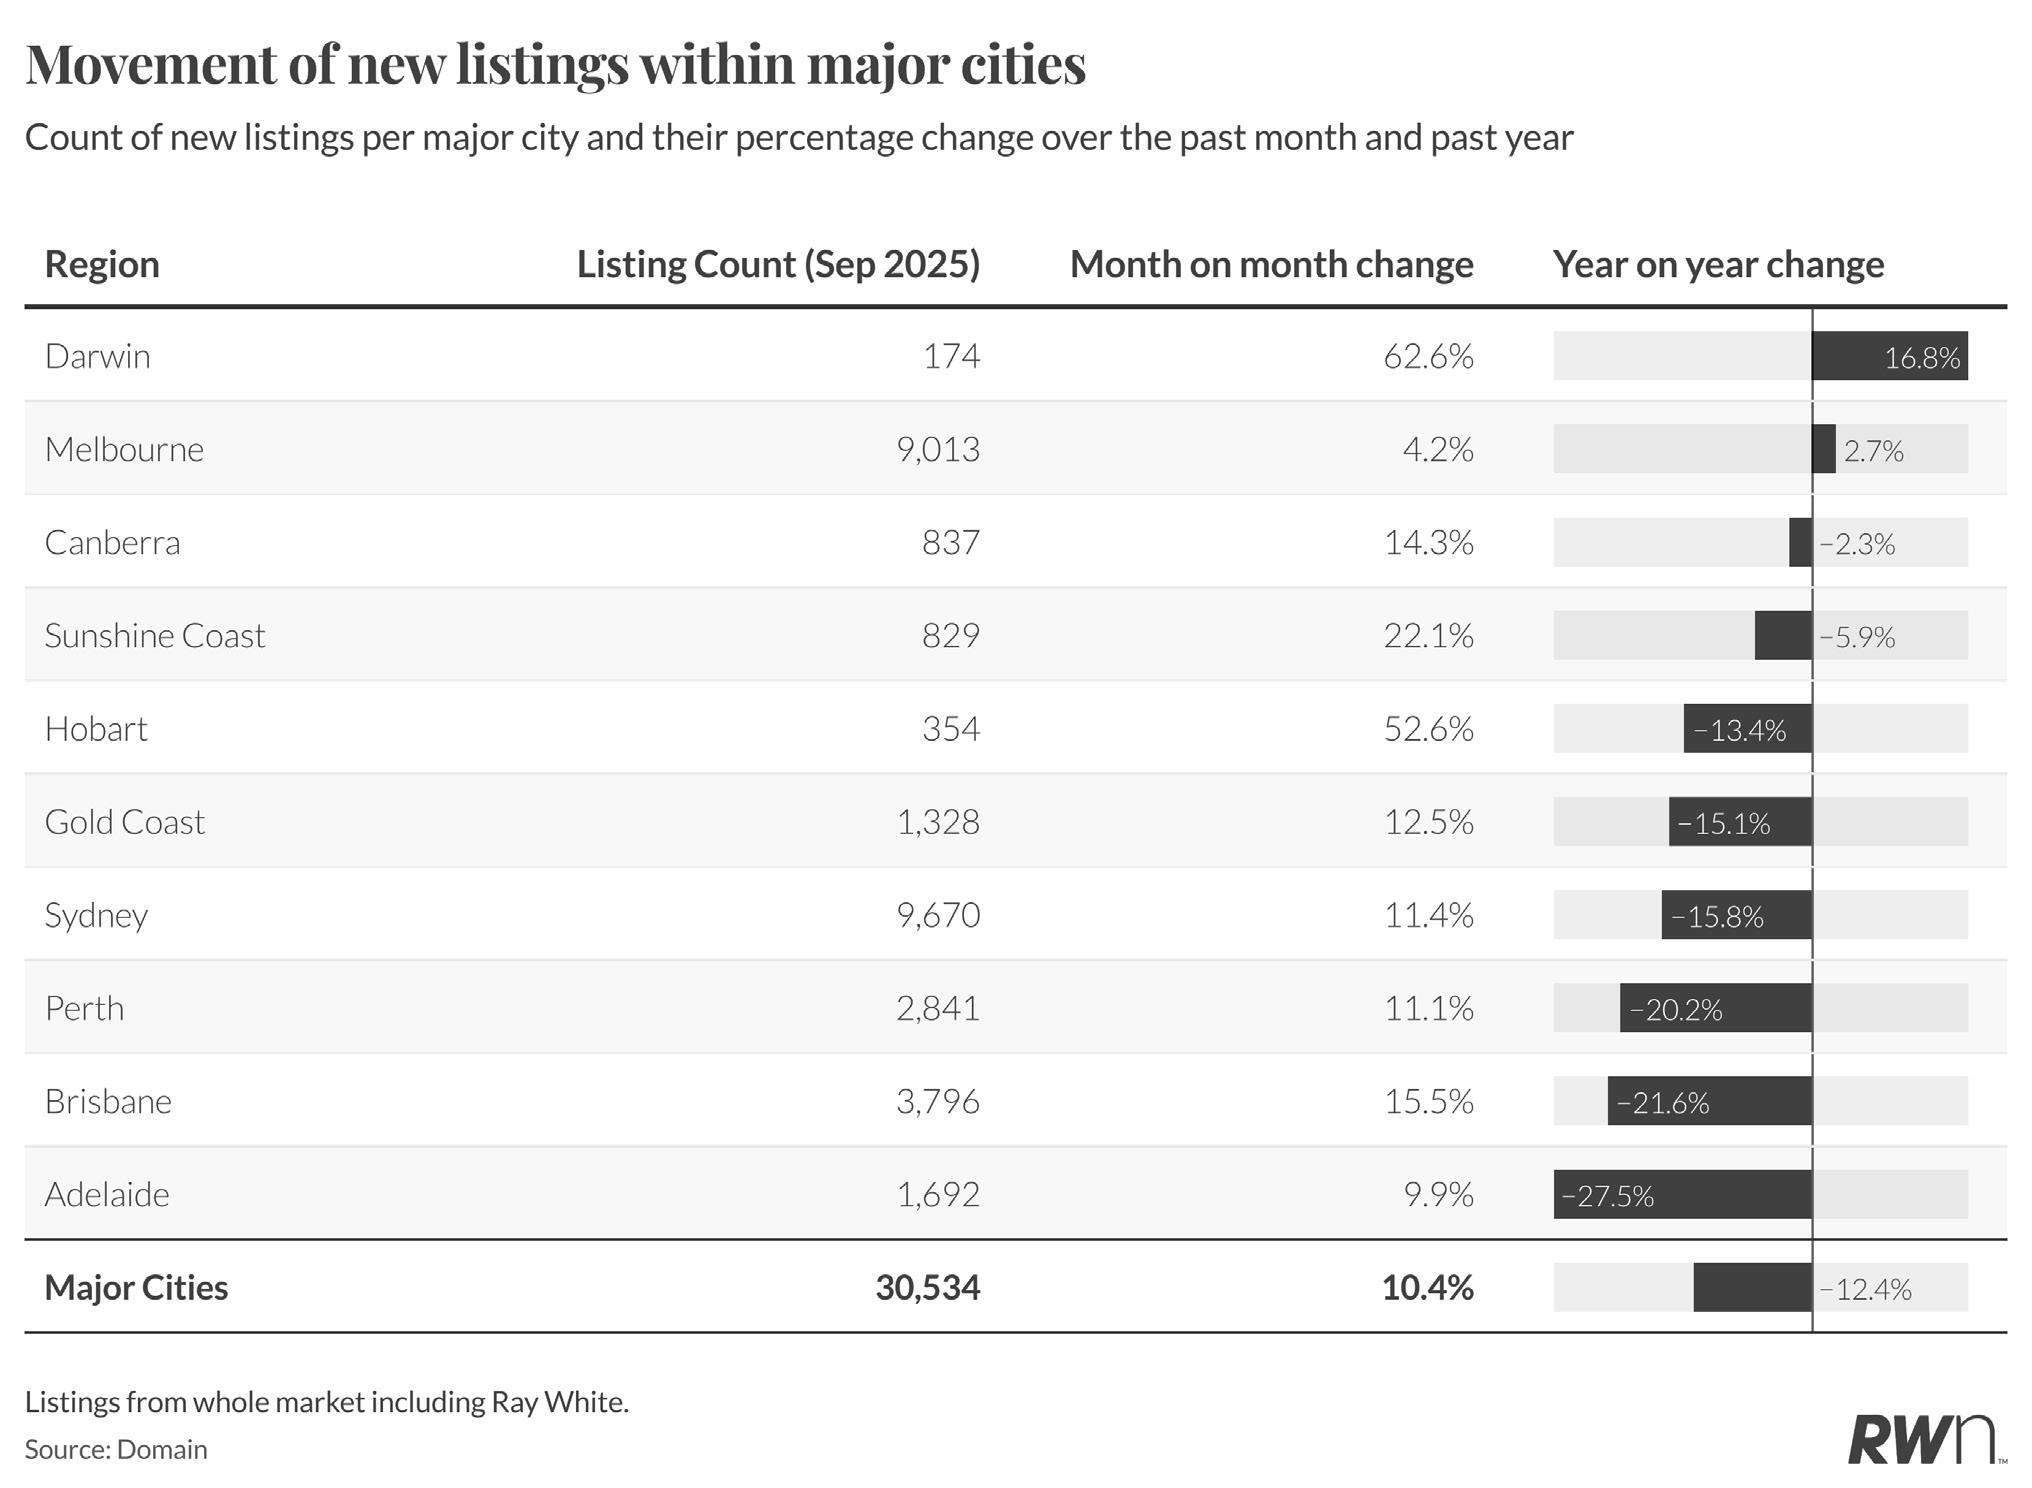
Darwin has recorded an extraordinary 62.6 per cent monthly surge in listings to 174 properties, though this increase stems from a relatively small base and reflects seasonal volatility in the smaller capital. Melbourne posted a modest 4.2 per cent monthly increase to 9,013 listings, maintaining its position as the highest volume metropolitan market. Canberra recorded strong monthly growth of 14.3 per cent to 837 listings, while the Sunshine Coast saw a 22.1 per cent increase to 829 properties.
However, most major cities show significant year-on-year declines, with Adelaide down 27.5 per cent to 1,692 listings despite a 9.9 per cent monthly increase. Brisbane fell 21.6 per cent annually to 3,796 listings, Perth declined 20.2 per cent to 2,841 properties, and Sydney dropped 15.8 per cent to 9,670 listings. The Gold Coast recorded a 15.1 per cent annual decline to 1,328 listings. Combined major cities reached 30,534 listings with a 10.4 per cent monthly increase, though annual figures remain 12.4 per cent below September 2024 levels, highlighting the persistent supply constraints affecting metropolitan markets.
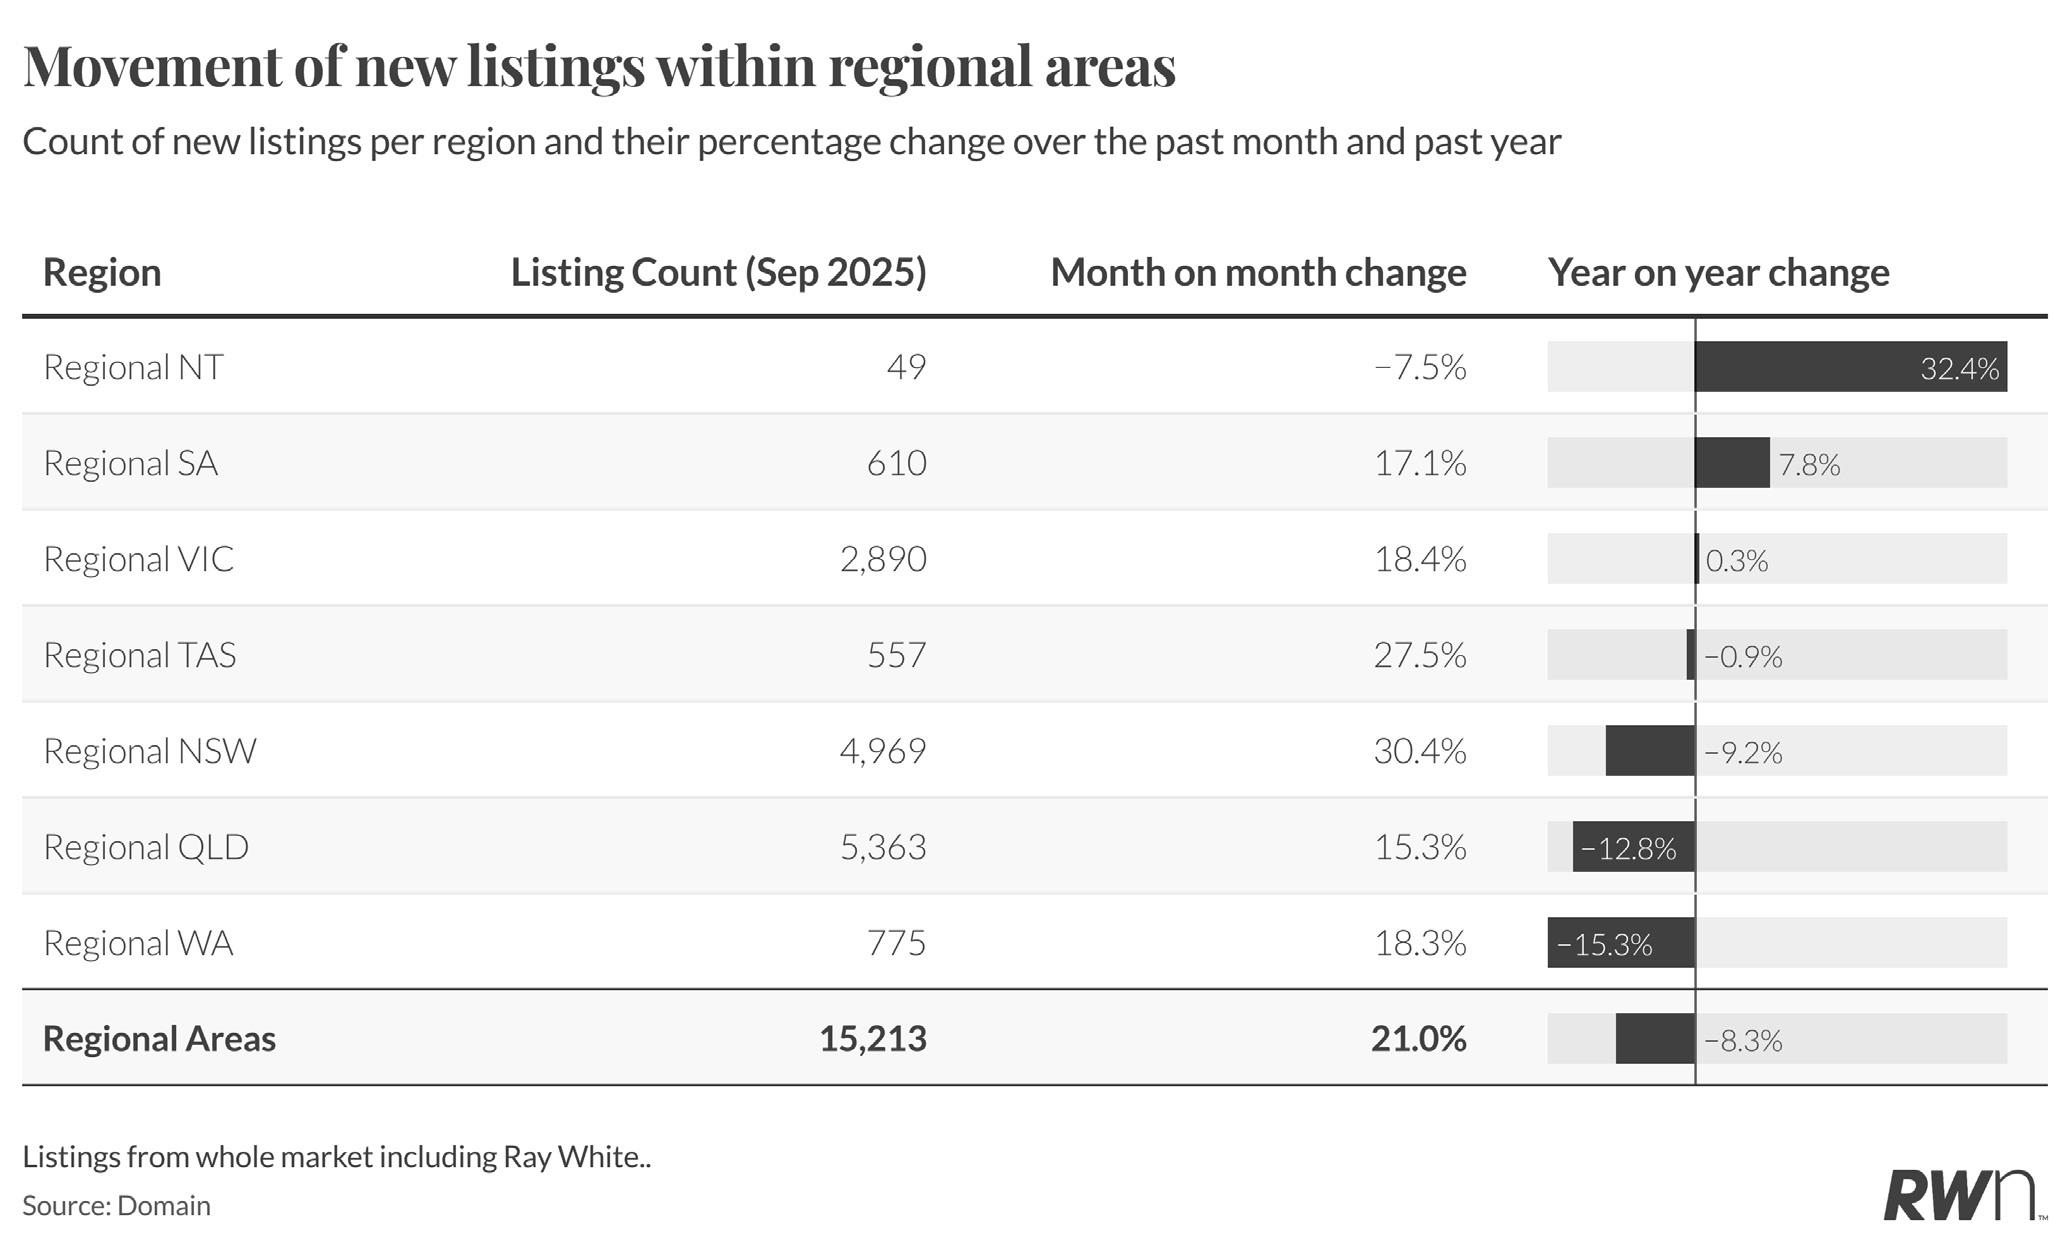
Regional markets have experienced substantial monthly growth in September, with several states recording doubledigit increases. Regional Tasmania surged 27.5 per cent to 557 listings, while regional New South Wales posted a 30.4 per cent monthly increase to 4,969 properties. Regional Victoria recorded an 18.4 per cent rise to 2,890 listings, and regional Western Australia grew 18.3 per cent to 775 properties. Regional South Australia increased 17.1 per cent to 610 listings.
Despite these strong monthly results, annual comparisons reveal ongoing supply constraints across most regional markets. Regional Western Australia declined 15.3 per cent year-on-year, regional Queensland fell 12.8 per cent to 5,363 listings, and regional New South Wales dropped 9.2 per cent annually. Regional Victoria recorded minimal annual change at 0.3 per cent, while regional Northern Territory showed exceptional annual growth of 32.4 per cent, albeit from a small base of 49 listings. Combined regional areas reached 15,213 listings with a 21.0 per cent monthly increase, though annual figures remain 8.3 per cent below September 2024 levels.

AUCTION INSIGHTS
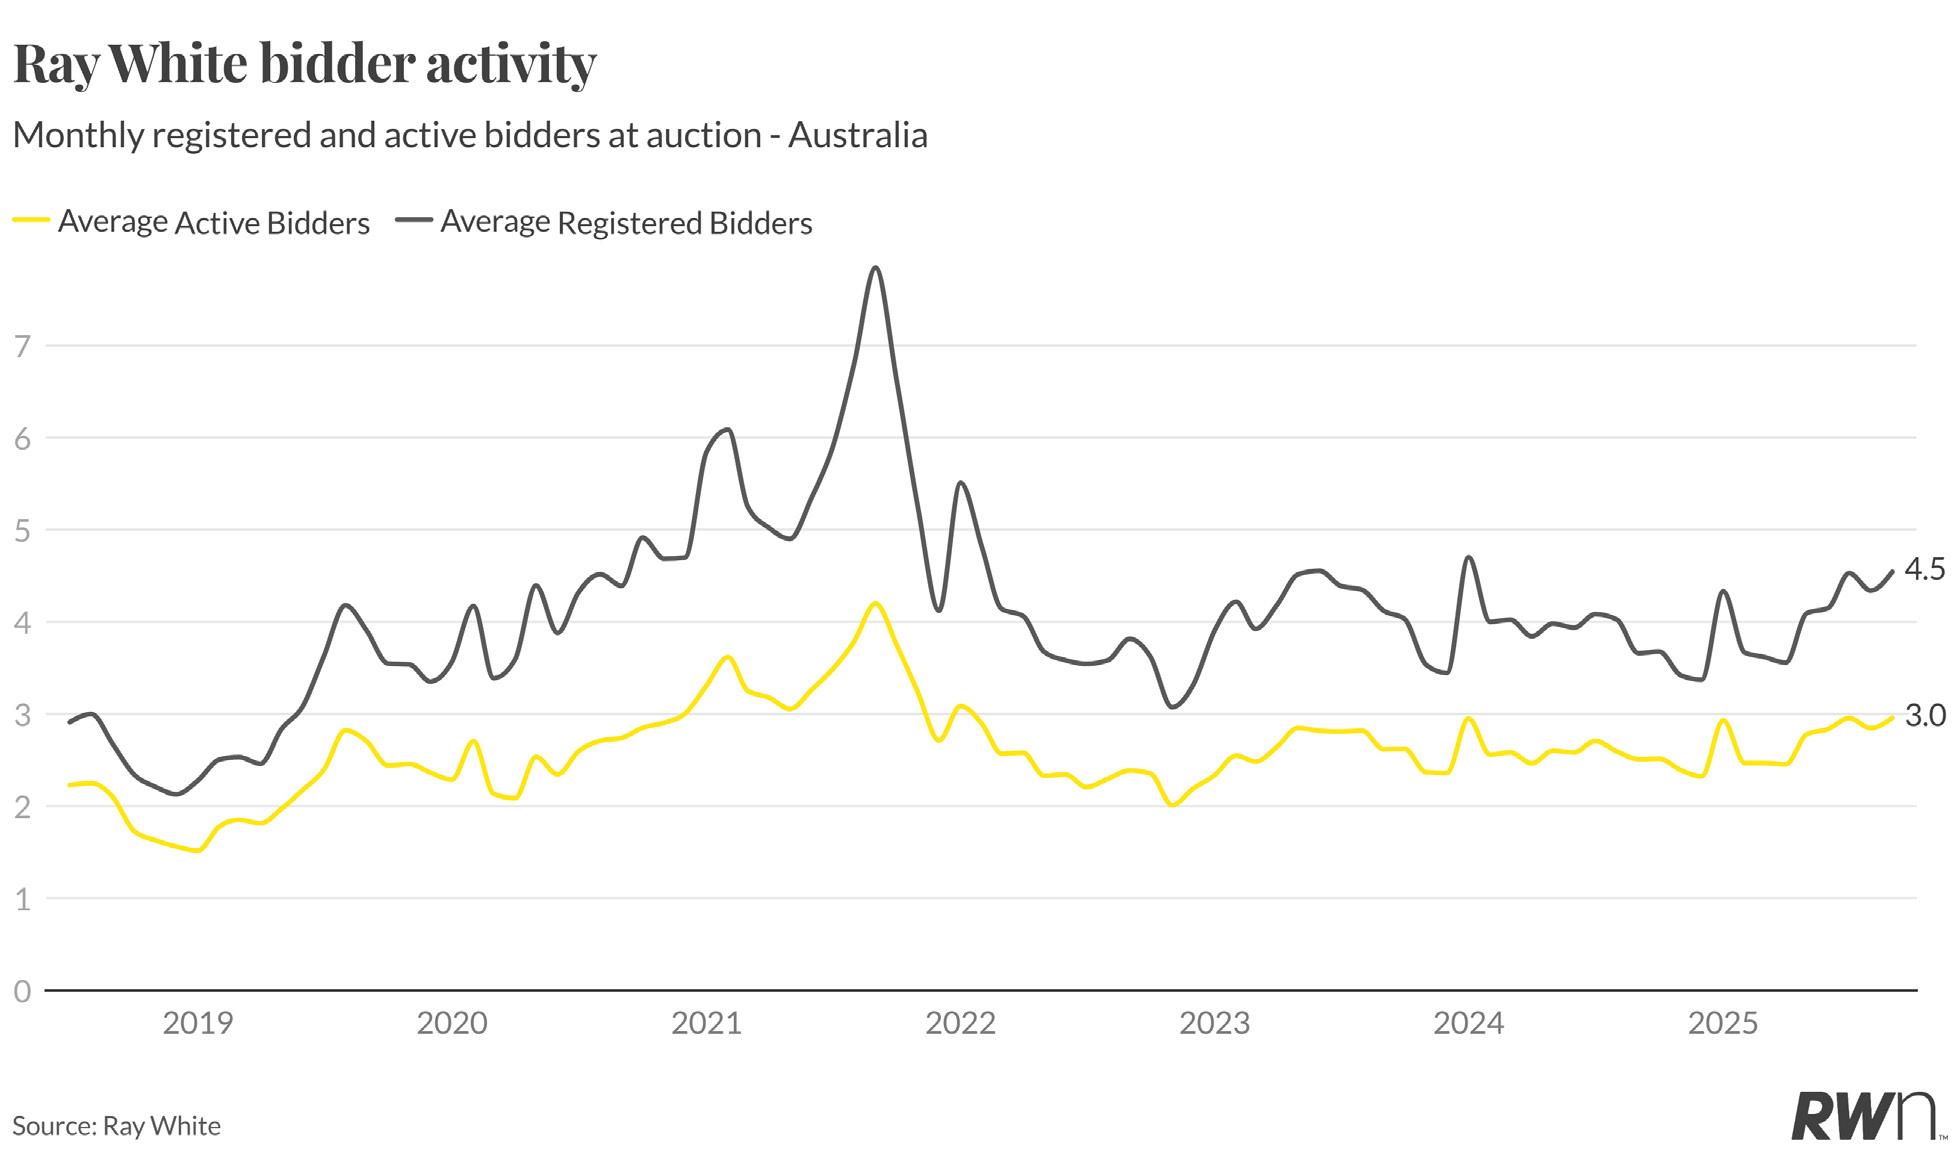
Bidder participation has shown modest improvement in recent months, with registered bidders per property reaching 4.5 and active bidders averaging 3.0 in September. These figures represent a gradual increase from the lows experienced through 2023 and early 2024, though they remain well below the exceptional peaks of 6-7 registered bidders witnessed during the 2021-2022 period.
The steady nature of current bidder activity suggests a market finding equilibrium between buyer capacity and property availability. While registered bidder numbers have recovered from their 2023 trough, the gap between registered and active bidders remains relatively stable, indicating consistent conversion rates at auctions. This pattern of participation supports the elevated clearance rates observed in 2025, with sufficient buyer competition to maintain upward price pressure without the excessive speculation that characterised the immediate post-pandemic period.

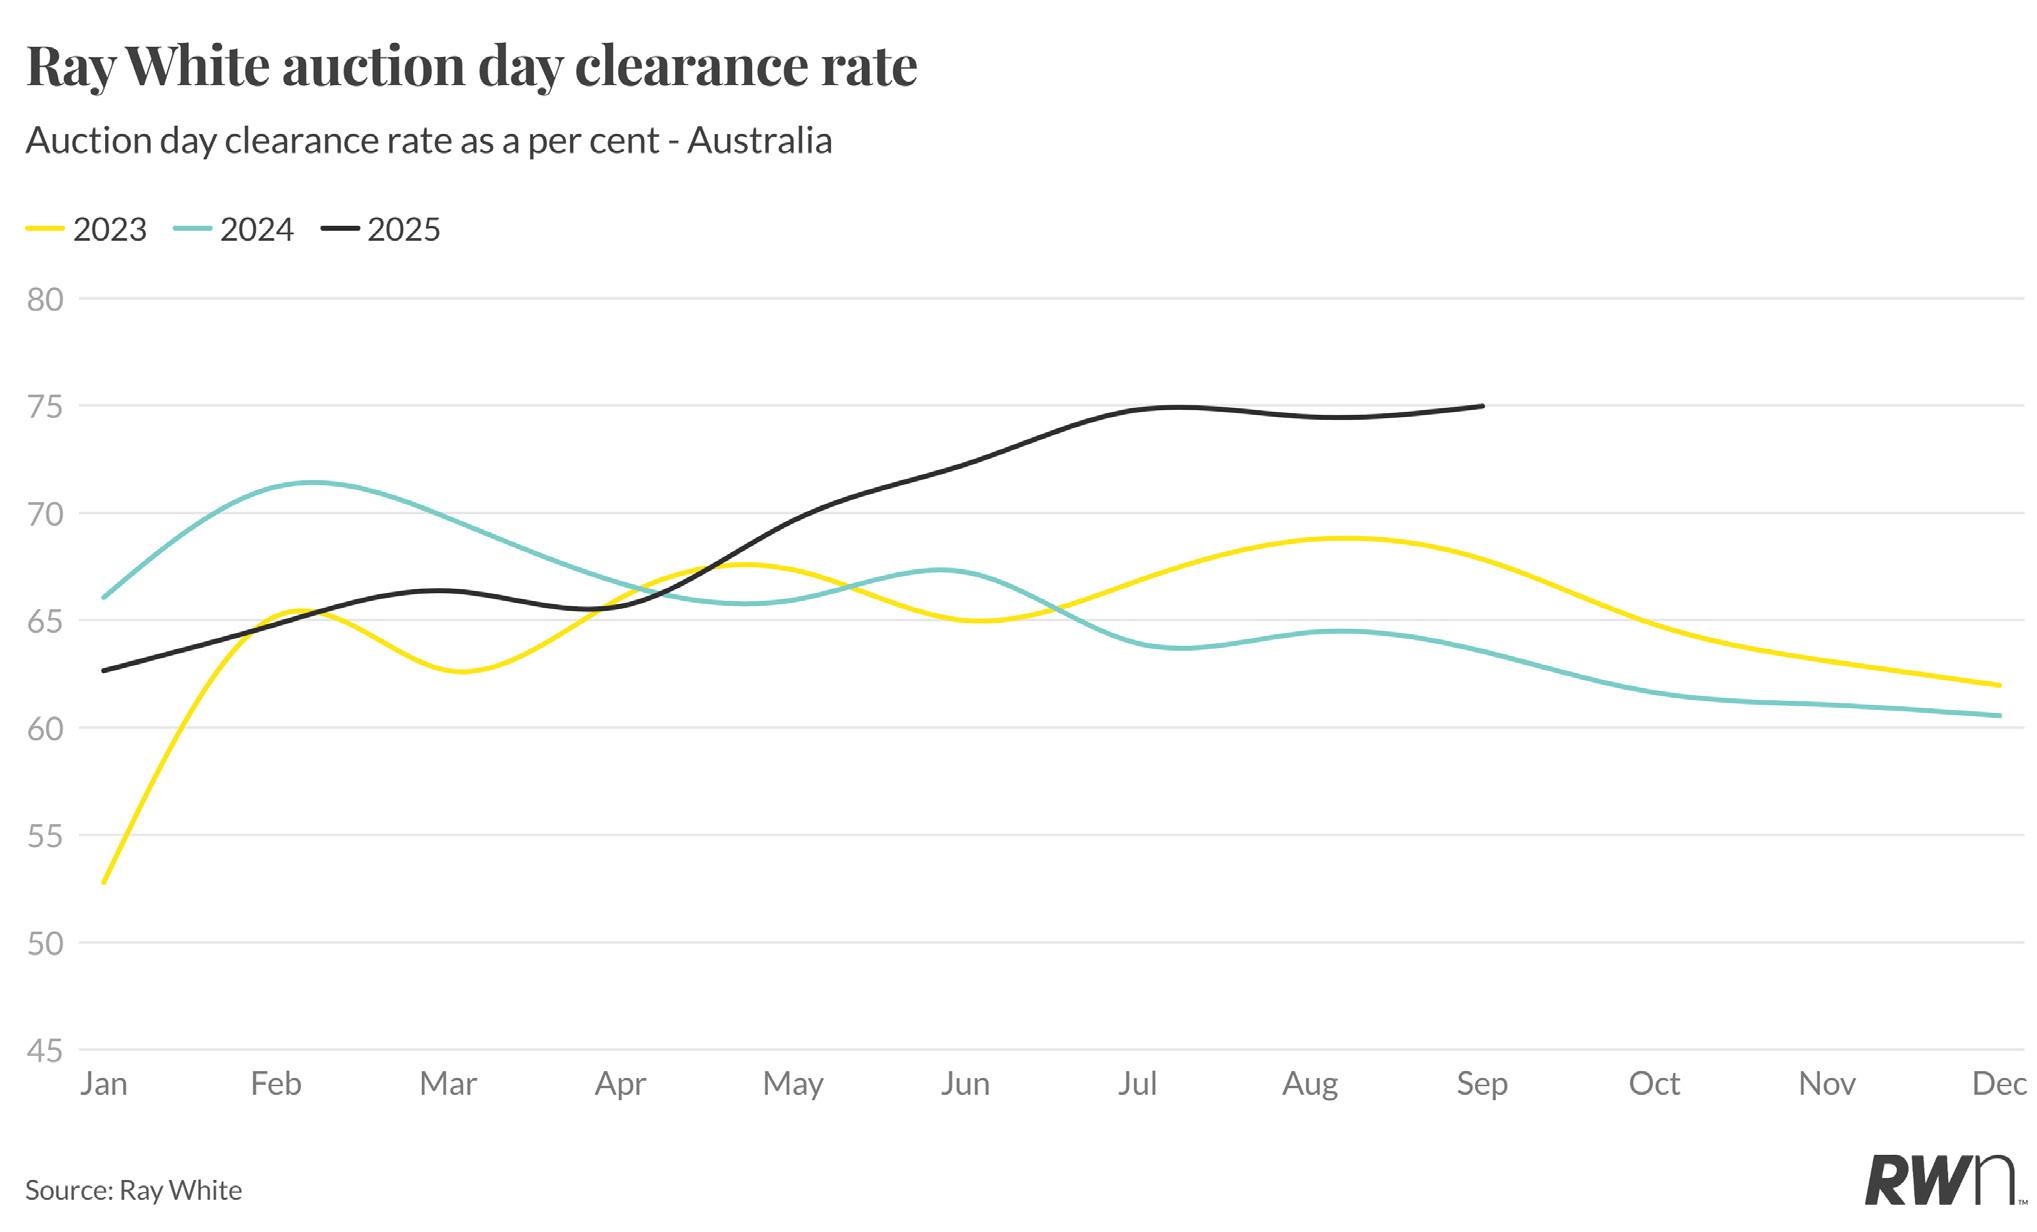
Ray White auction clearance rates have maintained their exceptional performance through September, holding at approximately 75 per cent, significantly outpacing both 2023 and 2024 results for the corresponding period. The 2025 clearance rate trajectory has remained remarkably stable since mid-year, tracking consistently above 70 per cent and demonstrating sustained competitive tension despite increased spring listing volumes.
This exceptional clearance rate performance stands in stark contrast to the deteriorating patterns evident in 2024, where rates declined through the second half of the year to finish around 61 per cent. The substantial gap between 2025 and prior years reflects the combination of constrained supply, pent-up buyer demand, and growing anticipation of rate cuts following the RBA’s September hold. The announcement of the government’s expanded first home buyer support, including five per cent deposit access, has further bolstered market sentiment. The consistency of current clearance rates suggests auction markets remain well-supported heading into the final quarter.

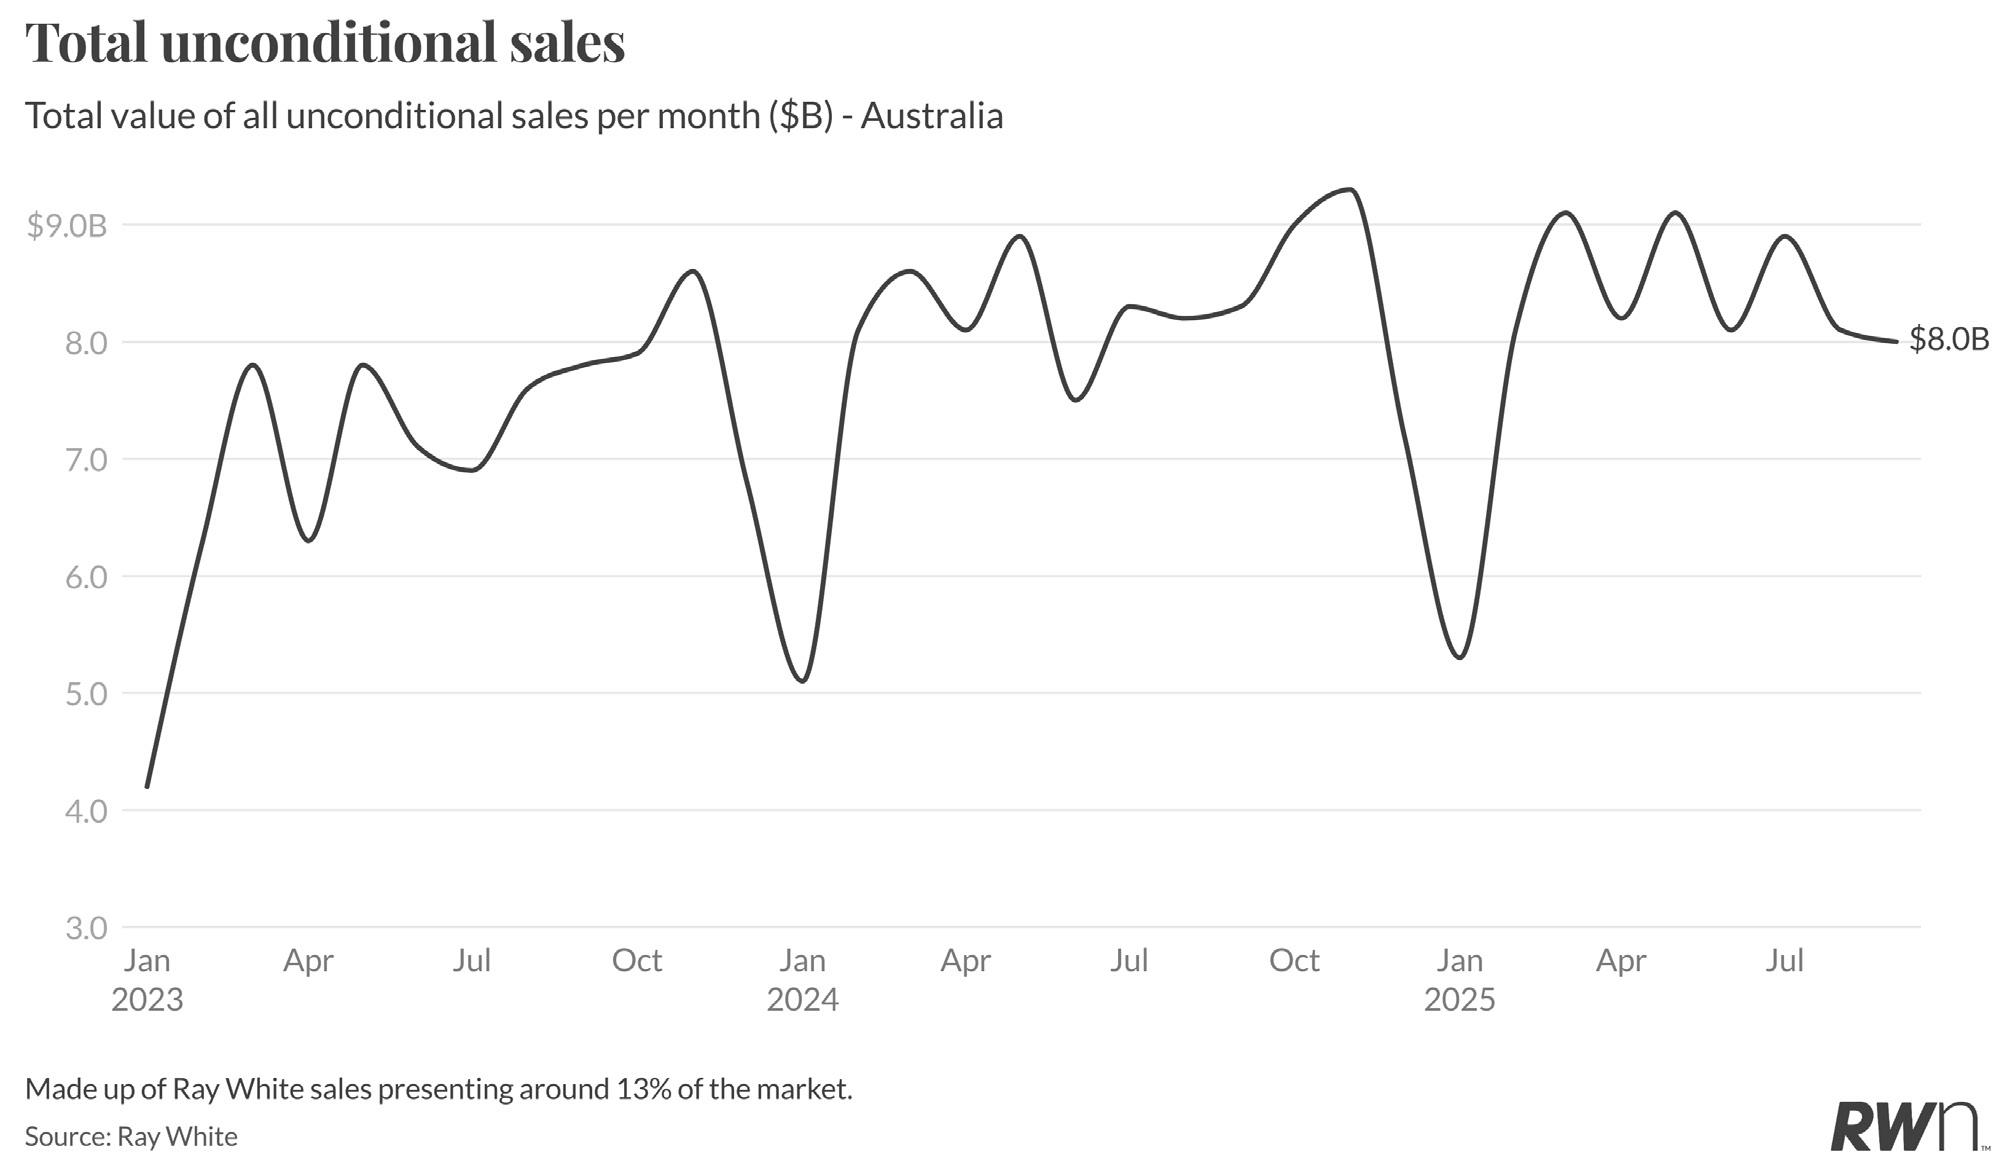
Ray White’s unconditional sales reached $8.0 billion in September, maintaining the elevated performance levels established through winter and spring 2025. This result positions September 2025 ahead of the corresponding periods in both 2023 and 2024, demonstrating sustained transaction momentum despite the broader economic headwinds and elevated interest rates.
The consistency of sales values above $8.0 billion through the second half of 2025 reflects both strong transaction volumes and continued price appreciation contributing to overall market value. While seasonal patterns typically see some moderation from spring peaks, the current trajectory suggests robust market activity extending into the traditionally quieter final quarter. This performance across Ray White’s network, representing approximately 13 per cent of the market, indicates healthy underlying conditions across the broader Australian property sector.

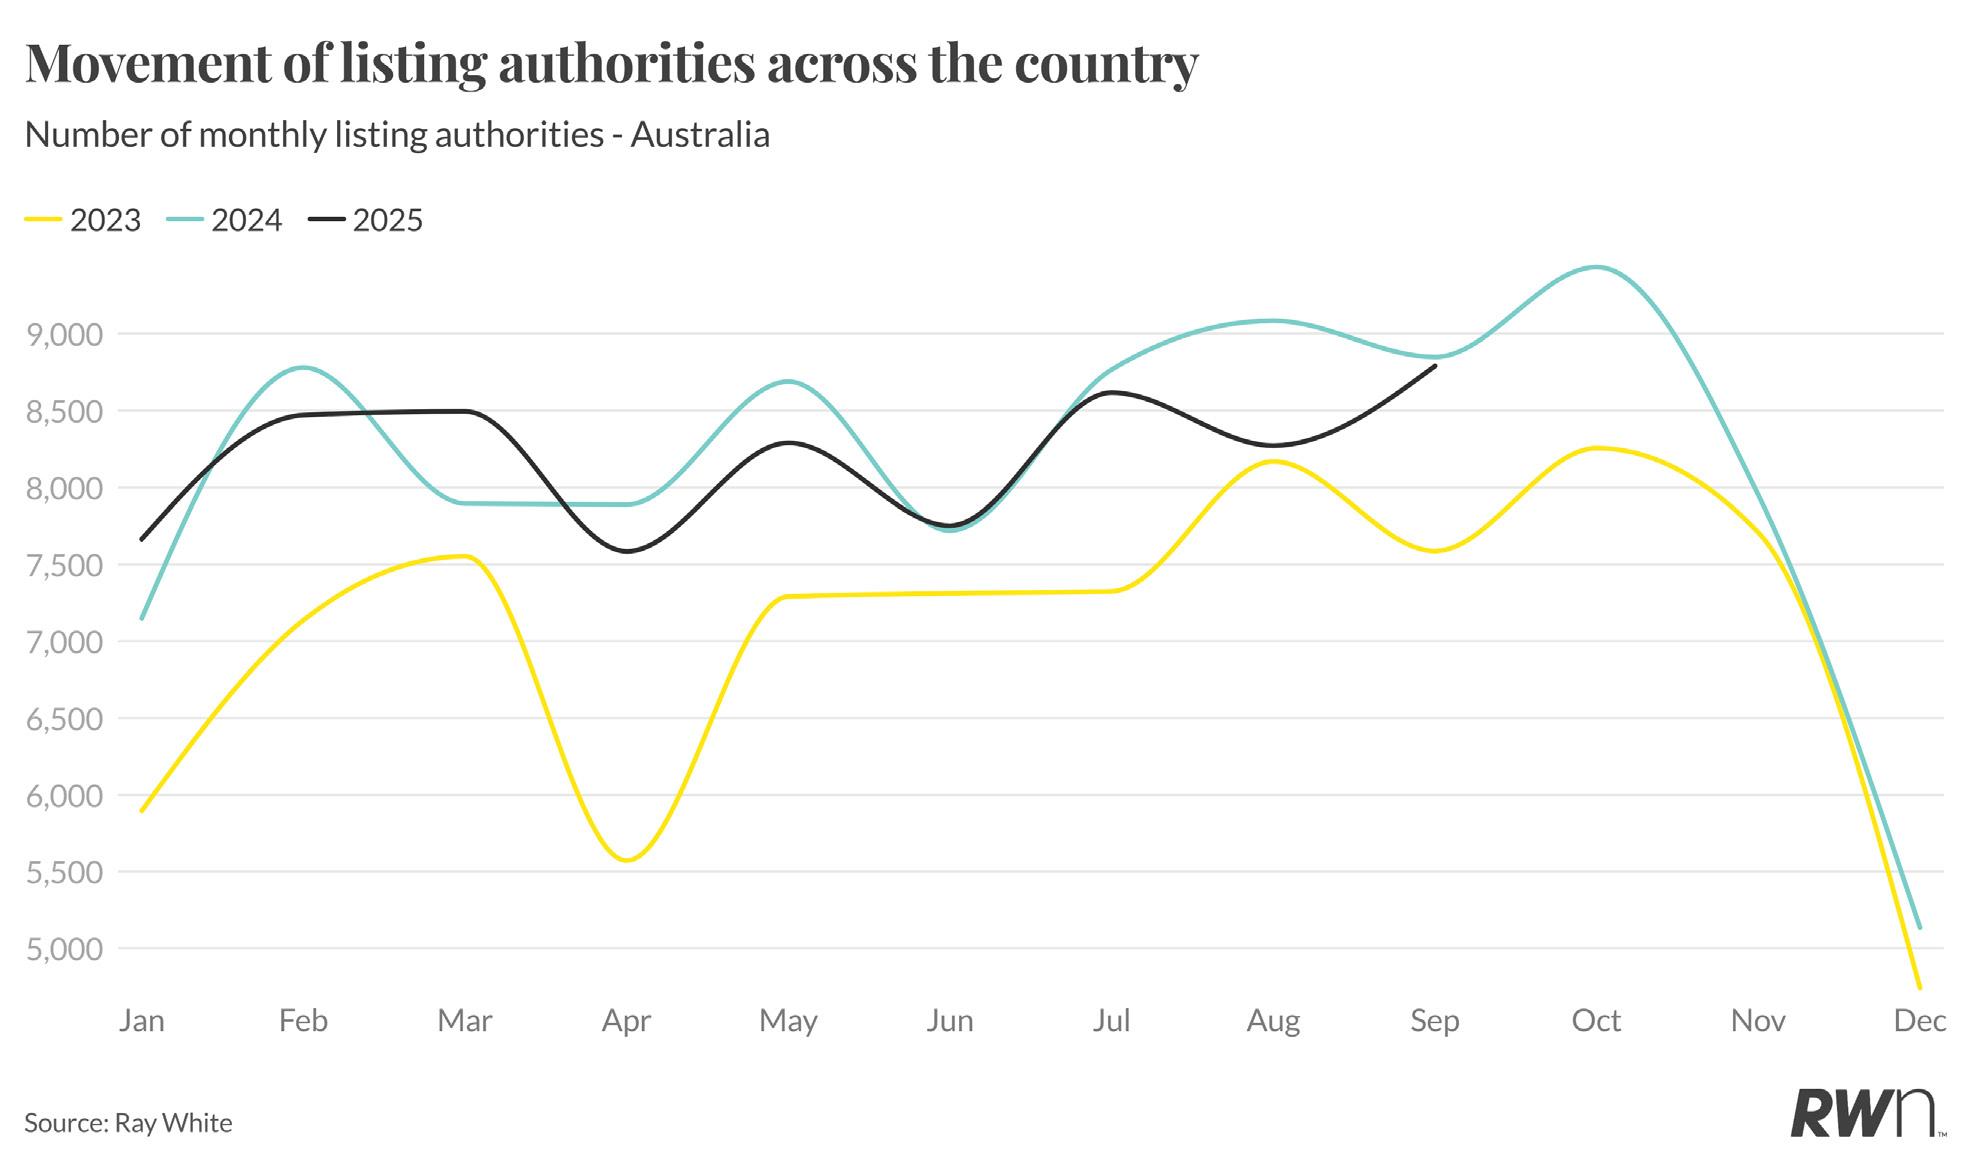
Ray White’s listing authorities present an encouraging supply story, with September 2025 recording 8,791 new authorities, up from August’s 8,272 and tracking ahead of September 2023’s 7,586. This monthly increase is particularly significant as it comes during a period when vendor engagement typically declines as the market transitions from spring into the final quarter.
The 28-day rolling sum shows 2025 consistently outpacing 2023 levels, with sustained vendor participation evident through winter and spring. February posted 8,471 authorities, March reached 8,496, and May recorded 8,290, demonstrating consistent engagement despite affordability challenges. This leading indicator, drawn from Ray White’s commanding 15 per cent market share, suggests vendors are recognising the opportunity created by strong buyer demand and elevated clearance rates. The recent uptick signals potential for an extended selling season, offering buyers improved choice heading into the final quarter.