
JARED MALAN | 0420 602 936 RAY WHITE MALAN & CO.

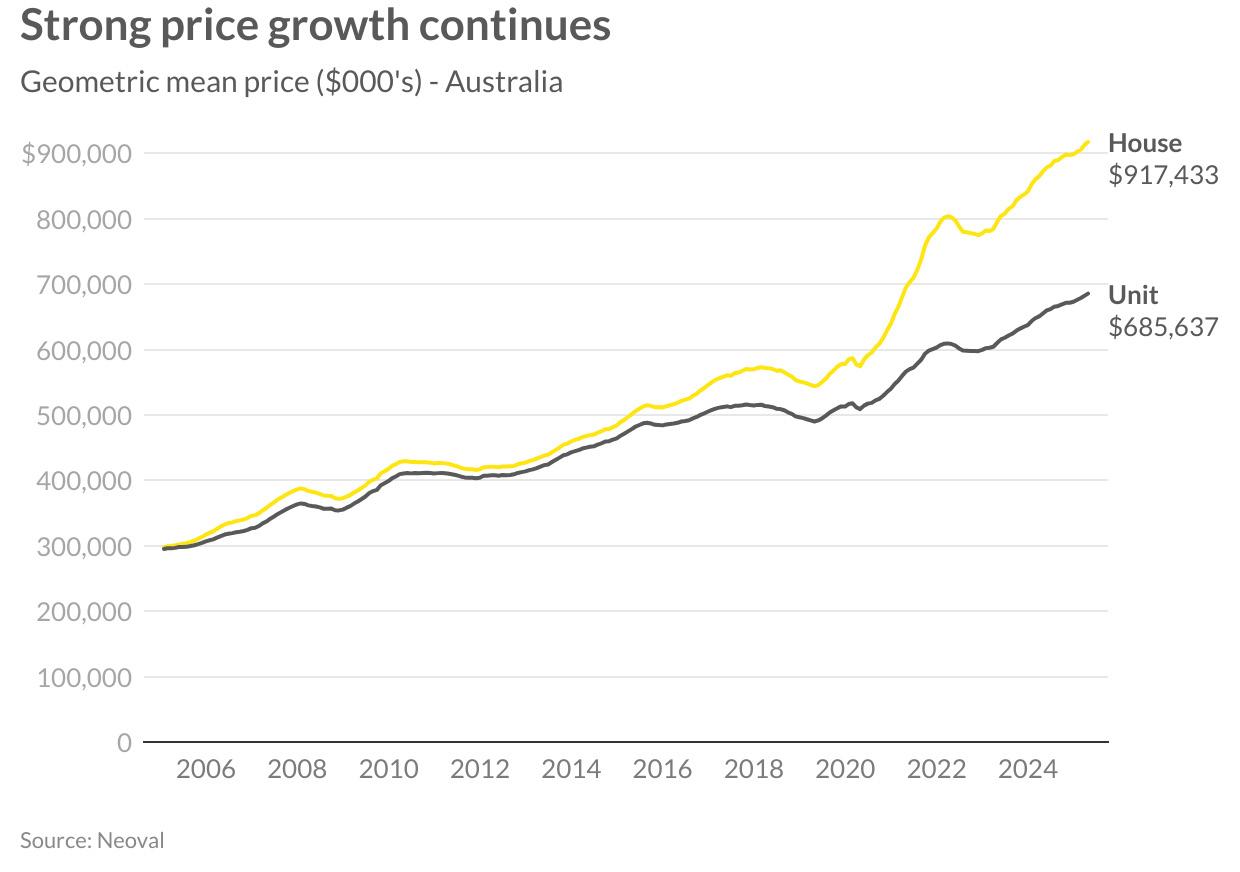
Australian property prices have continued their upward trajectory in April, with both houses and units posting solid gains amid a backdrop of significant political and economic shifts. House prices nationally rose by 0.4 per cent to reach a median of $917,433, representing an annual growth of 5.2 per cent. The unit market showed even stronger monthly momentum with prices increasing by 0.5 per cent to $685,637, delivering a yearly growth rate of 4.6 per cent.
This sustained price growth has occurred in Australia’s election year, with Labor’s win expected to expand housing policies. Markets are also anticipating an almost certain interest rate cut at the May RBA meeting. These factors, combined with persistent housing supply challenges, are creating conditions for continued price growth despite some seasonal reductions in listing volumes.

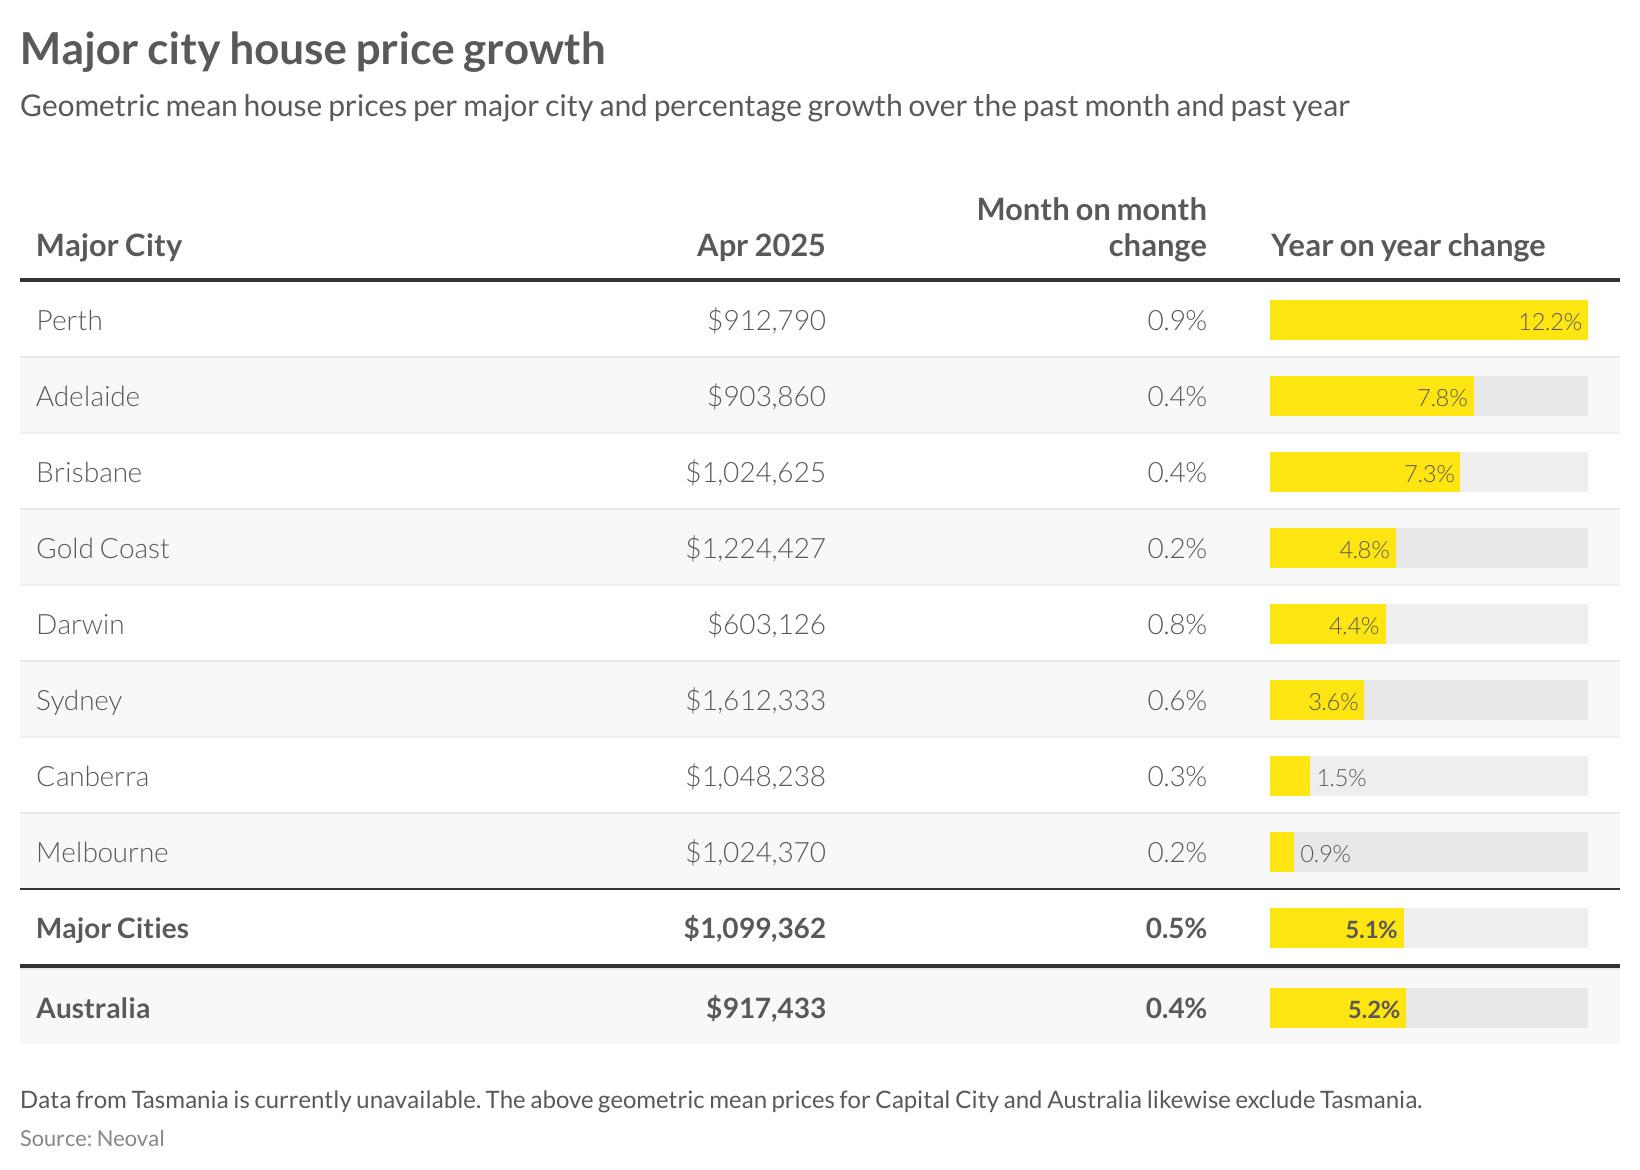
The capital city housing market continues to display varied performance across Australia’s major cities, with Perth maintaining its position as the standout performer. With a mean price of $912,790, Perth recorded a robust 0.9 per cent monthly gain and an impressive 12.2 per cent year-on-year increase, reflecting the ongoing economic strength in Western Australia’s mining sector and its relative affordability compared to eastern states capitals.
Adelaide remains a strong performer, with its mean house price of $903,860 representing a 0.4 per cent monthly increase and solid 7.8 per cent annual growth. This strong performance continues to reflect Adelaide’s connection to the mining sector and relative affordability. Brisbane has firmly established itself as a million-dollar city, with its average of $1,024,625 reflecting a 0.4 per cent monthly gain and 7.3 per cent annual growth, driven by consistent population growth and housing demand.
The Gold Coast maintains premium values at $1,224,427, rising 0.2 per cent for the month and 4.8 per cent annually, while Sydney continues as Australia’s most expensive market at $1,612,333 with a more substantial 0.6 per cent monthly increase but more modest annual growth of 3.6 per cent. Melbourne shows the least momentum among major capitals, recording just 0.9 per cent annual growth despite a 0.2 per cent monthly improvement. The two-speed market that characterised 2024 persists but is showing signs of convergence as even the slower southern capitals begin to demonstrate more consistent growth.
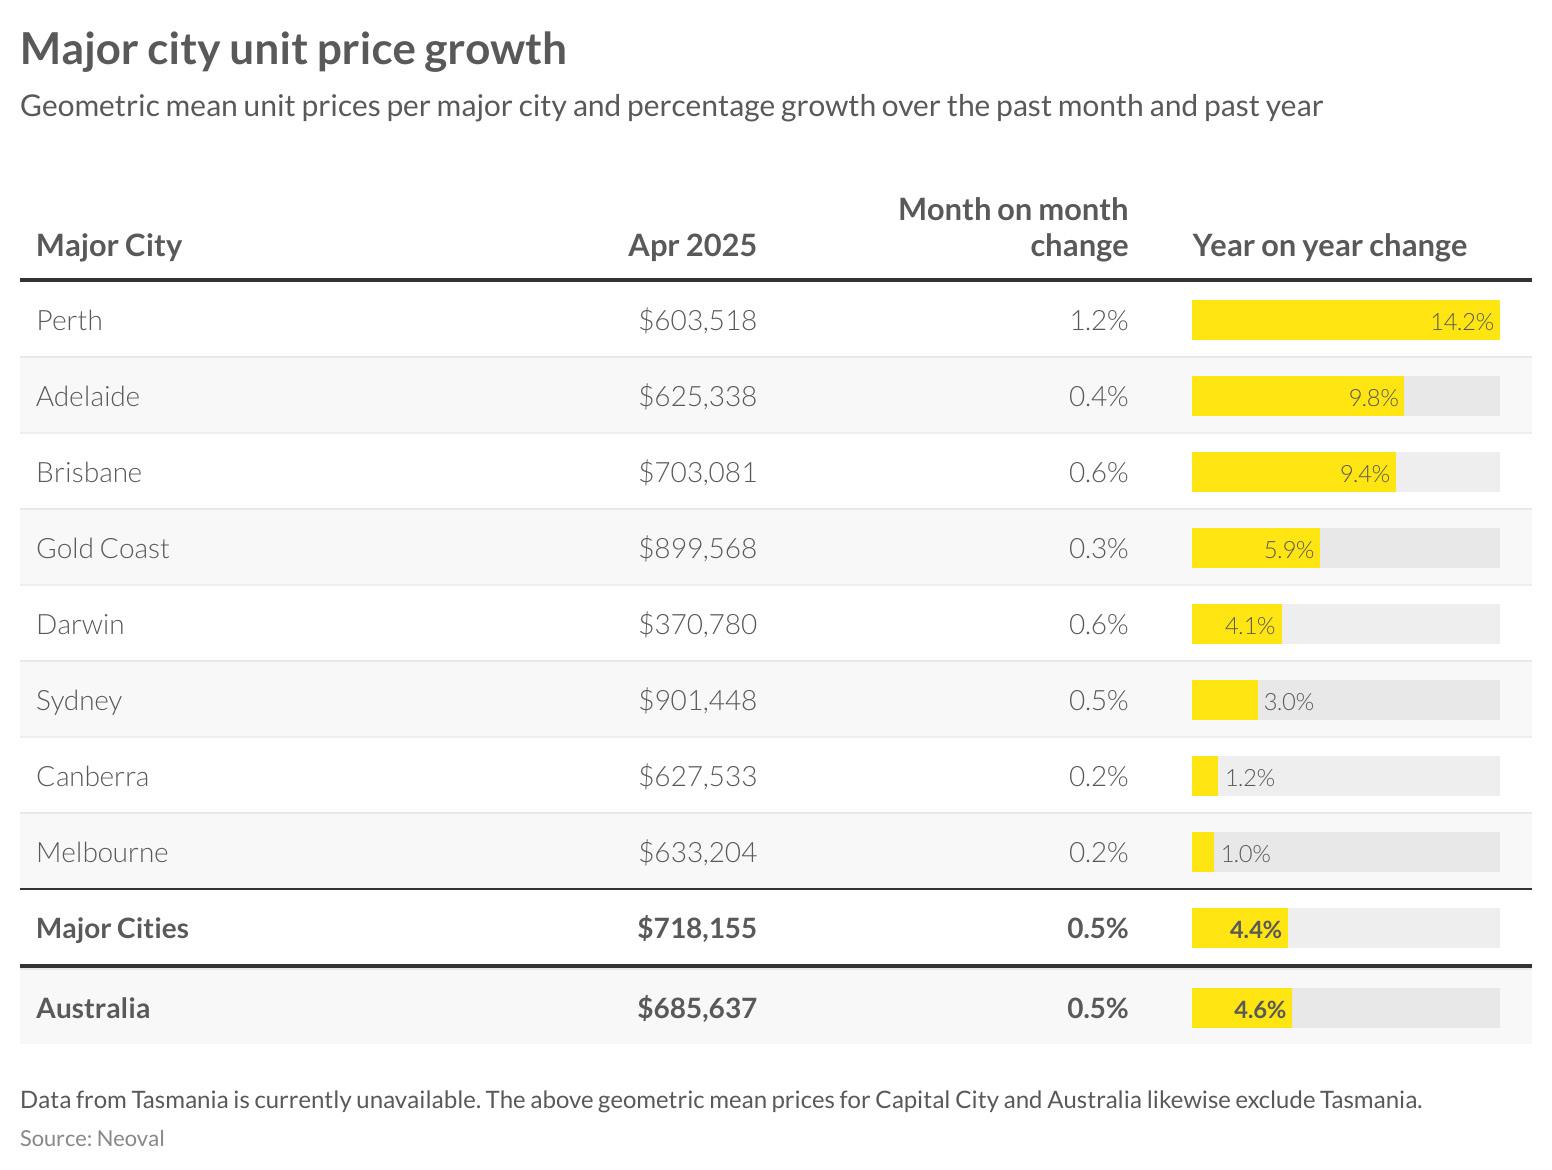
The unit market across major cities has demonstrated similar patterns, with Perth units once again leading the charge with a remarkable 14.2 per cent annual growth rate and a substantial 1.2 per cent monthly gain. This outstanding performance outpaces even Perth’s strong house market, suggesting investors and first home buyers are increasingly targeting the more affordable unit sector in this high-growth city.
Adelaide and Brisbane continue to show strong performance with annual growth of 9.8 per cent and 9.4 per cent respectively. Brisbane’s unit market performance is particularly notable due to continued strong population growth driving demand for more affordable housing options. The Gold Coast maintains its position as a premium unit market with a median of $899,568, while Sydney remains the most expensive at $901,448, though showing a more modest annual growth of 3.0 per cent.
Melbourne continues to display the most subdued performance among capital cities with annual growth of just 1.0 per cent, highlighting the varied recovery patterns across Australia’s unit markets. The recent Labor victory in the Federal election is expected to bring new housing policies that may stimulate further activity in this market, particularly with expanded first home buyer support measures.

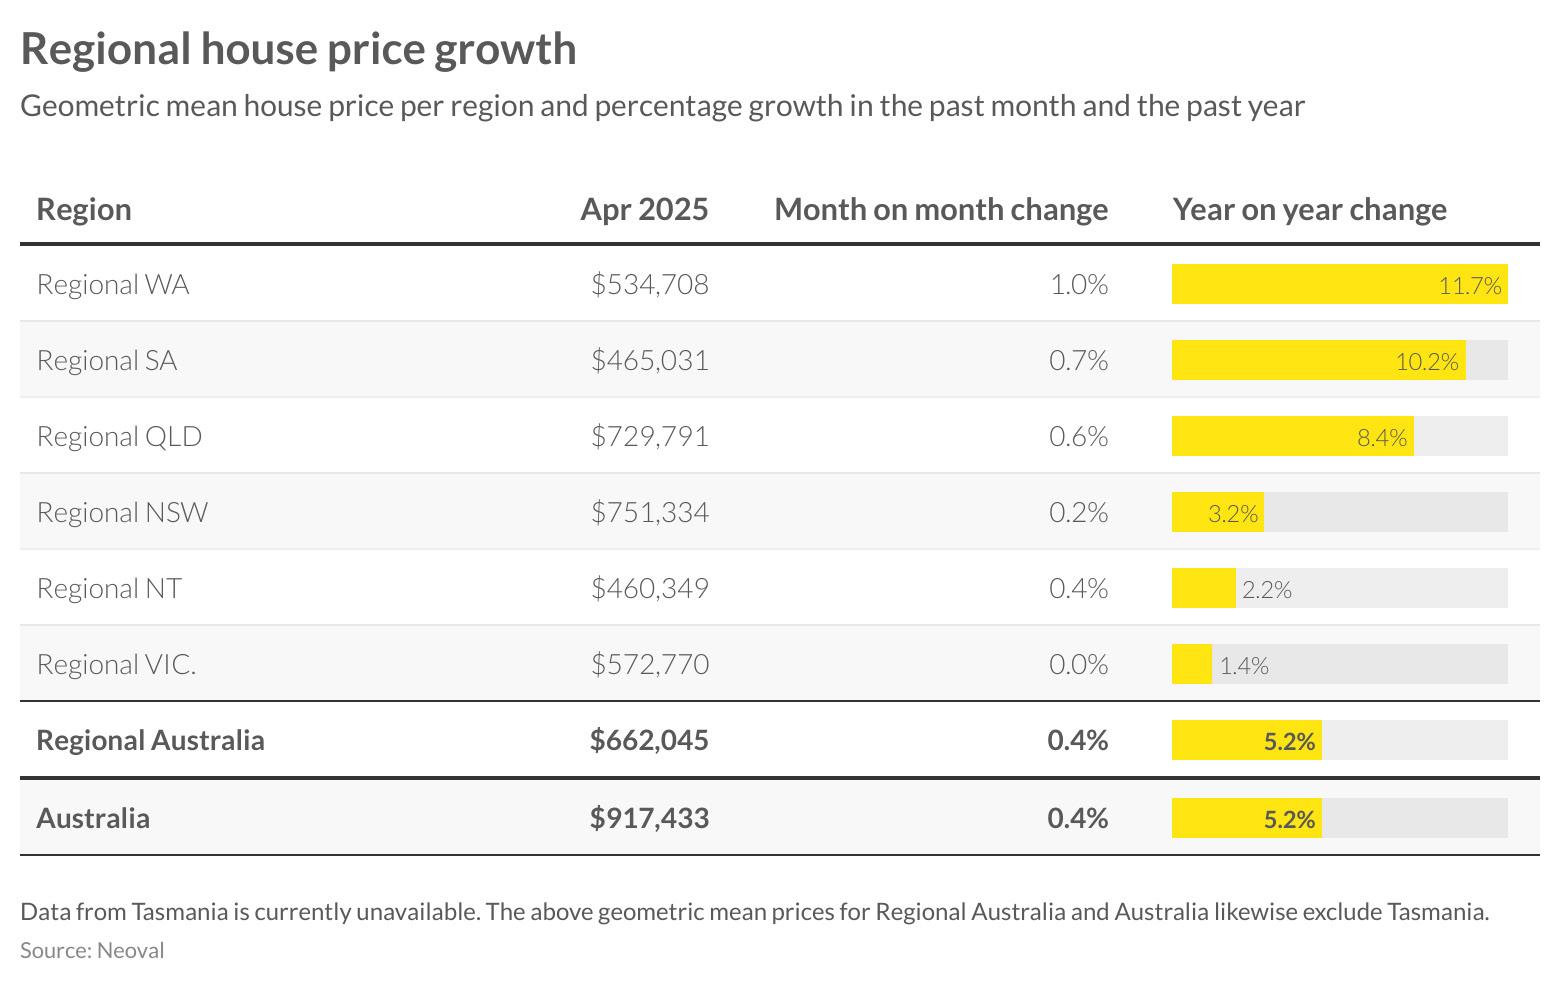
Regional housing markets continue to mirror the trends seen in their metropolitan counterparts, with resource-rich states maintaining their leadership positions. Regional Western Australia is the standout performer with 11.7 per cent annual growth and a strong 1.0 per cent monthly increase, bringing the mean price to $534,708. This robust performance continues to be driven by the strength of the mining sector, including both traditional iron ore production and expanding lithium operations supporting the global transition to green energy.
Regional South Australia follows closely with 10.2 per cent annual growth and a 0.7 per cent monthly gain, bringing the mean to $465,031. The strong performance in this market continues to be underpinned by copper production and its positive impact on local employment and population growth. Queensland’s regional markets remain robust with 8.4 per cent annual growth and a 0.6 per cent monthly increase, bringing the average to $729,791. This reflects the ongoing popularity of Queensland’s coastal lifestyle locations, though the rate of growth has moderated from the pandemic-era peaks.
Regional New South Wales and Victoria show more modest annual increases of 3.2 per cent and 1.4 per cent respectively, highlighting the varying impact of local economic conditions on property markets. Regional Victoria recorded no price movement in April, suggesting a potential plateauing in this market after several years of pandemic-driven growth and subsequent normalisation.

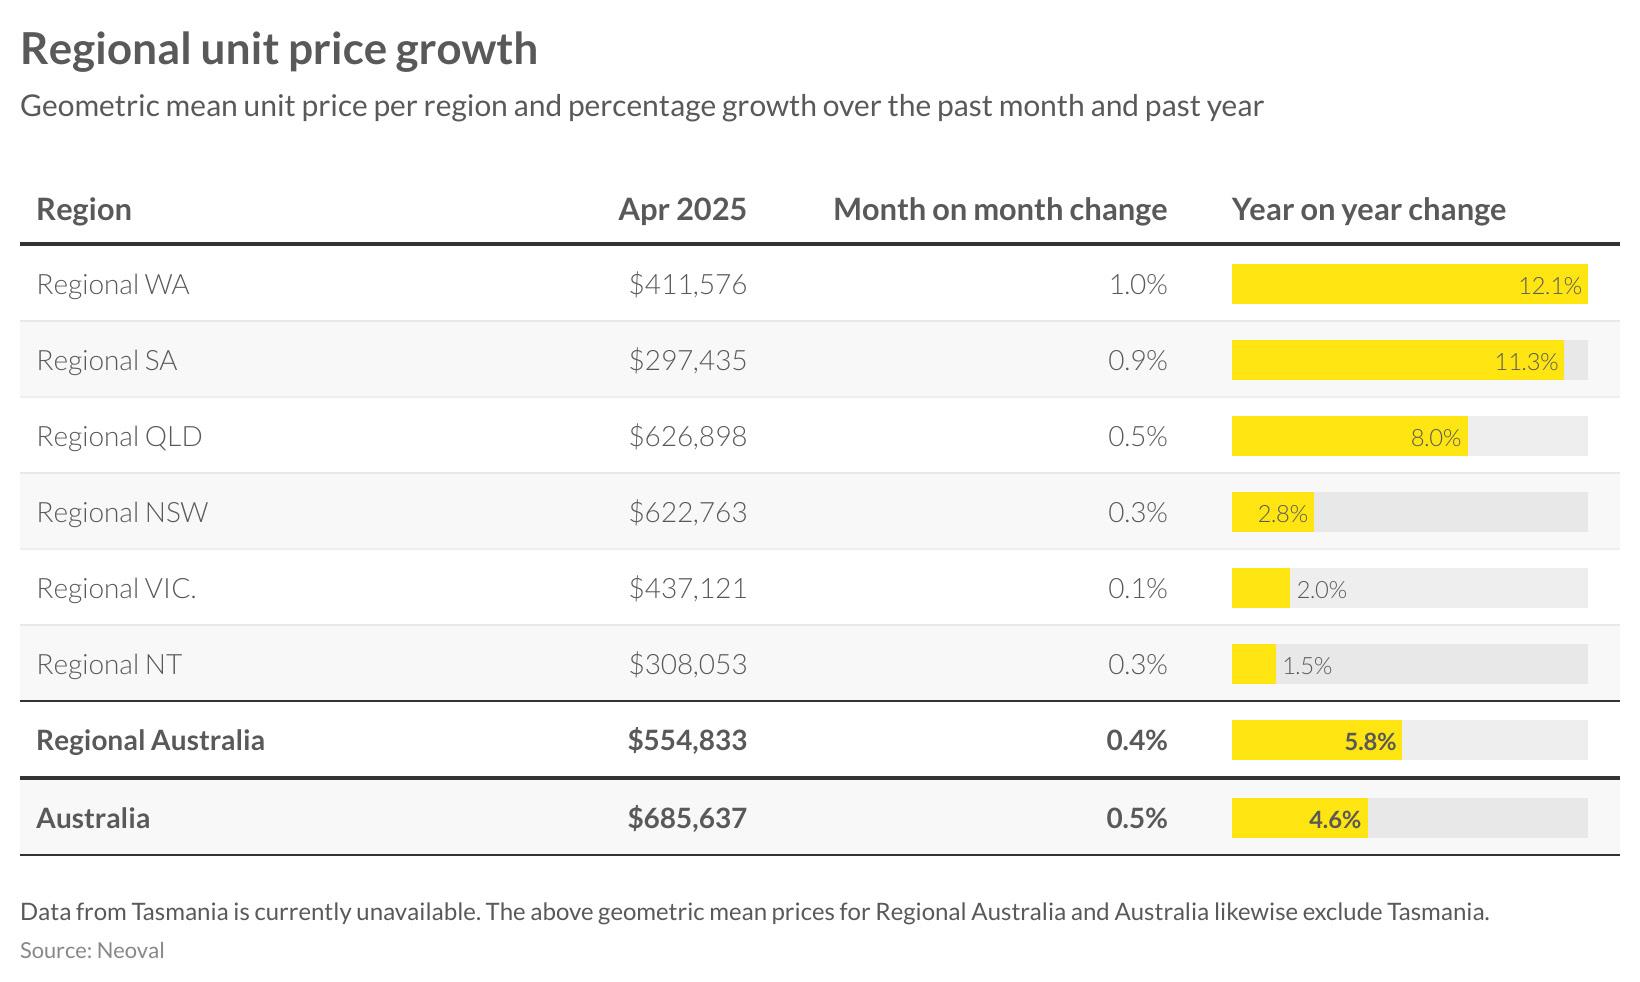
The regional unit market exhibits similar patterns, with Western Australia and South Australia leading annual growth at 12.1 per cent and 11.3 per cent respectively. Both regions recorded substantial monthly increases of 1.0 per cent and 0.9 per cent in April, continuing their strong momentum. Regional Queensland maintains strong market conditions with 8.0 per cent year-on-year growth and a 0.5 per cent monthly increase, bringing its mean to $626,898.
Regional New South Wales and Victoria show more modest annual increases of 2.8 per cent and 2.0 per cent respectively, with monthly gains of 0.3 per cent and 0.1 per cent. The Northern Territory recorded the lowest annual growth at 1.5 per cent despite a 0.3 per cent monthly increase. These varying growth rates across regional markets reflect their different economic drivers and demographic trends, with resource-rich regions continuing to outperform areas more dependent on lifestyle and tourism factors.

LISTINGS ACTIVITY
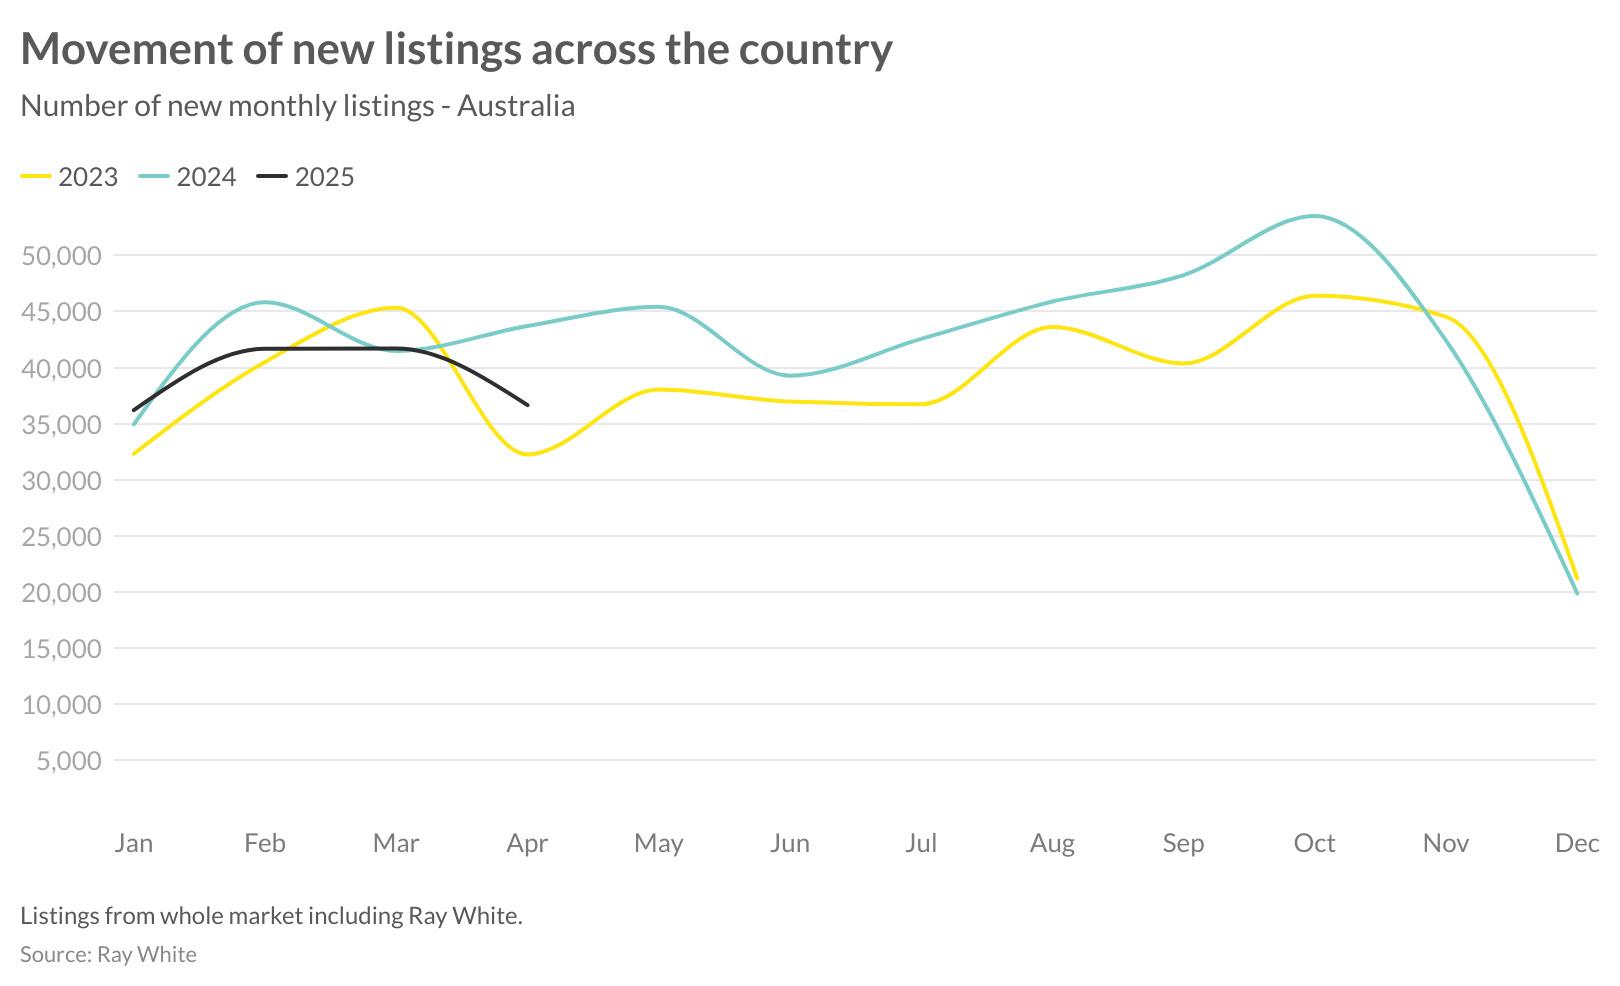
April listing data reveals a notable seasonal decline across most markets. The movement of new listings across the country illustrates that while 2025 started strongly with listing volumes exceeding 2023 levels, April has seen a more substantial seasonal decline than 2024 albeit still trending above 2023 results. Looking at the data, April 2025 recorded 36,655 new listings nationally, compared to 43,785 in April 2024 and 32,247 in April 2023. This intermediate position between the previous two years suggests a market that’s normalising from the heightened activity of 2024 but remains more active than during the subdued conditions of 2023. This supply constraint continues to be a significant factor supporting price growth despite other market headwinds.

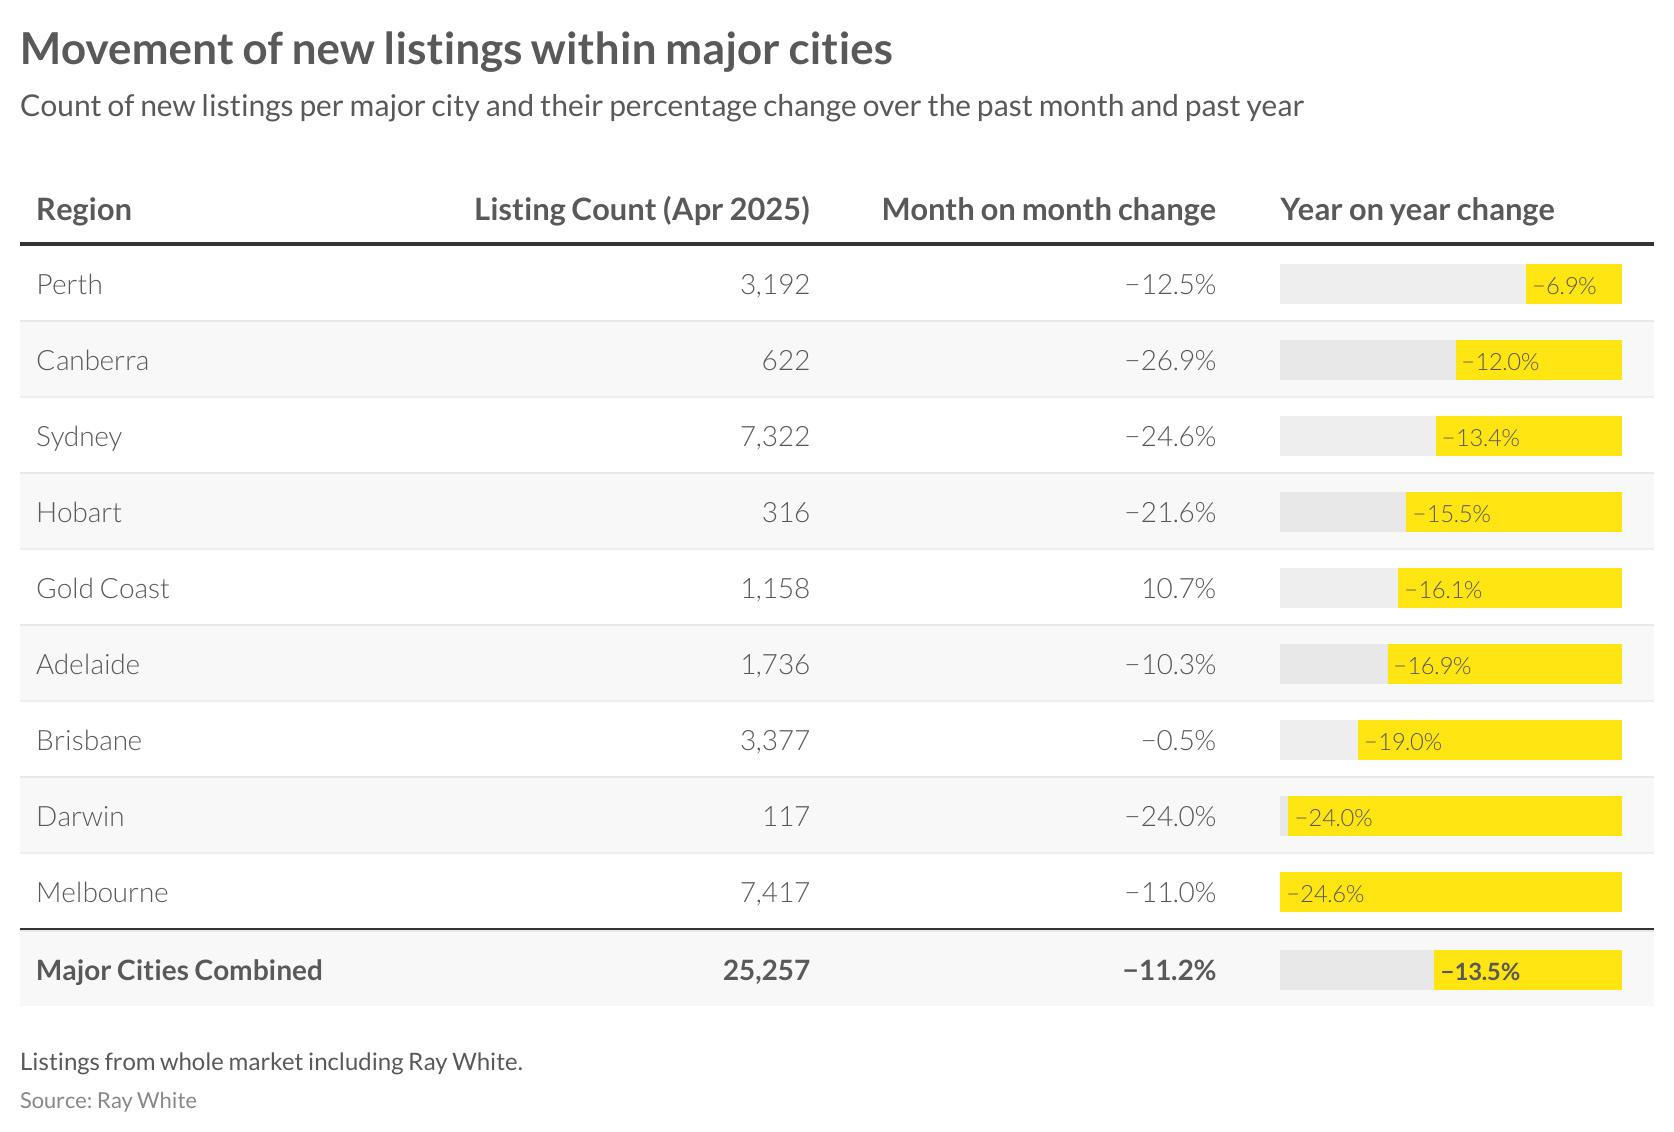
Sydney and Melbourne continue to dominate in absolute numbers with 7,322 and 7,417 new listings respectively, though both experienced substantial monthly declines of 24.6 per cent and 11.0 per cent. Canberra recorded the largest monthly decrease at 26.9 per cent, followed closely by Darwin at 24.0 per cent. The Gold Coast stands as the only major market to record a monthly increase in listings, up 10.7 per cent, though still down 16.1 per cent year-onyear.
The most substantial annual declines were recorded in Melbourne (24.6 per cent), Darwin (24.0 per cent), and Brisbane (19.0 per cent), reflecting particularly tight supply conditions in these markets compared to last year. The persistent shortage of available properties in high-growth markets like Brisbane and Perth is likely contributing to their continued strong price performance despite affordability challenges.
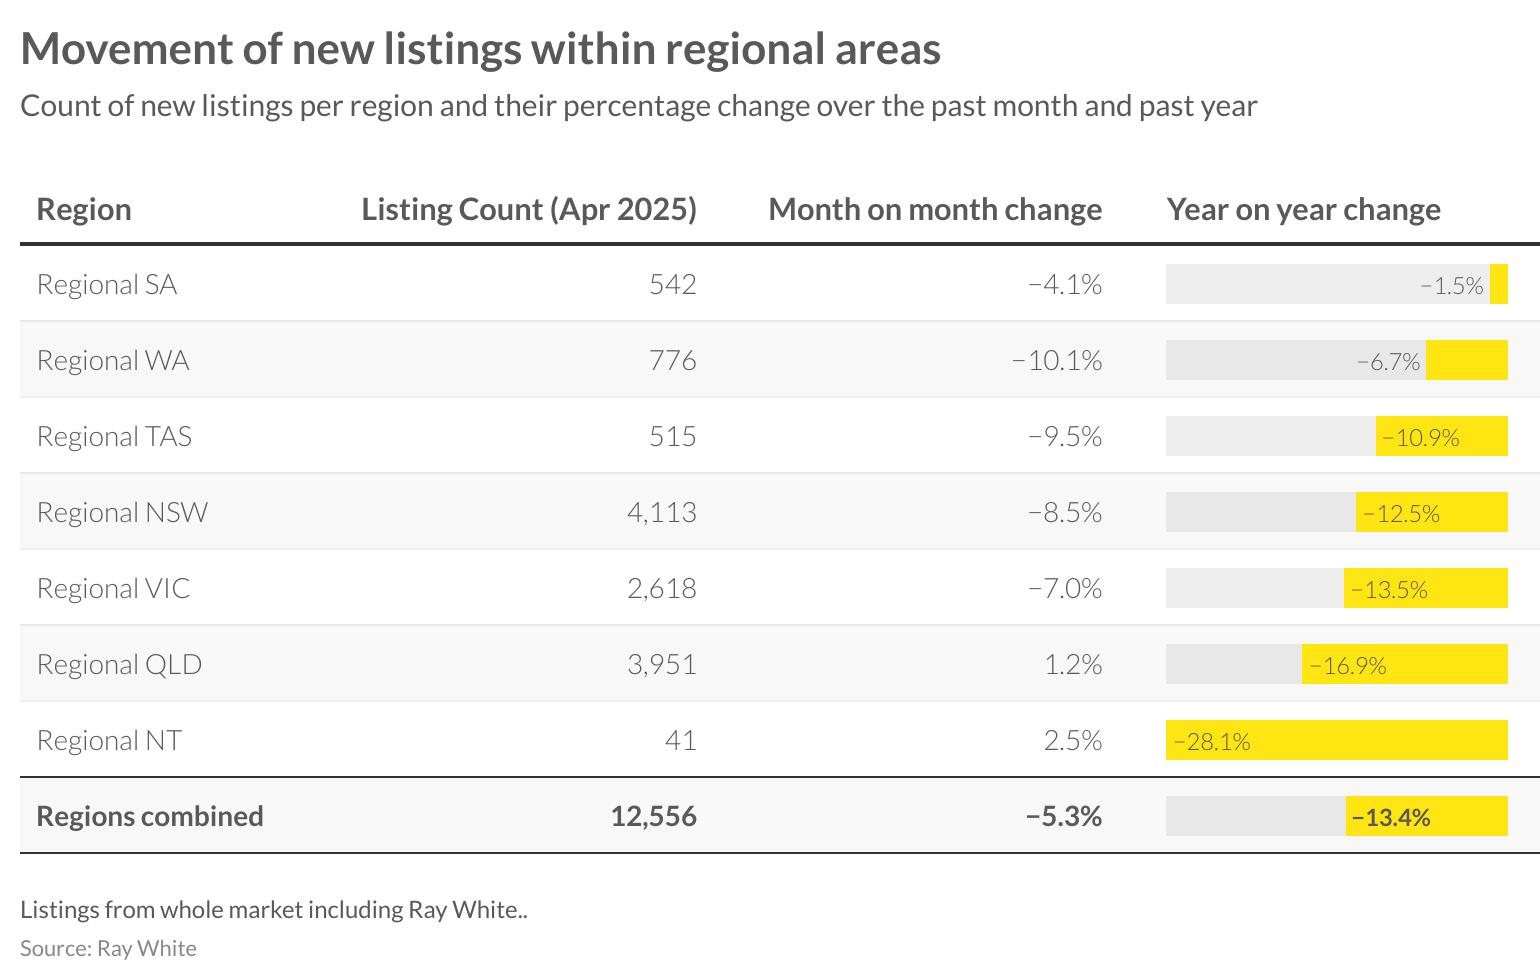
Regional markets show a similar pattern with combined listings down 5.3 per cent for the month to 12,556 properties and 13.4 per cent annually. Regional Queensland and Northern Territory recorded modest monthly increases in listing activity at 1.2 per cent and 2.5 per cent respectively, though both regions remain well below their 2024 levels with year-on-year declines of 16.9 per cent and 28.1 per cent.
Regional Western Australia and Tasmania saw the largest monthly decreases at 10.1 per cent and 9.5 per cent respectively, while regional South Australia demonstrated the smallest annual decline at just 1.5 per cent. These varying listing patterns reflect the different stages of market cycles across regional Australia, with the overall trend pointing to continued supply constraints supporting price growth.

AUCTION INSIGHTS
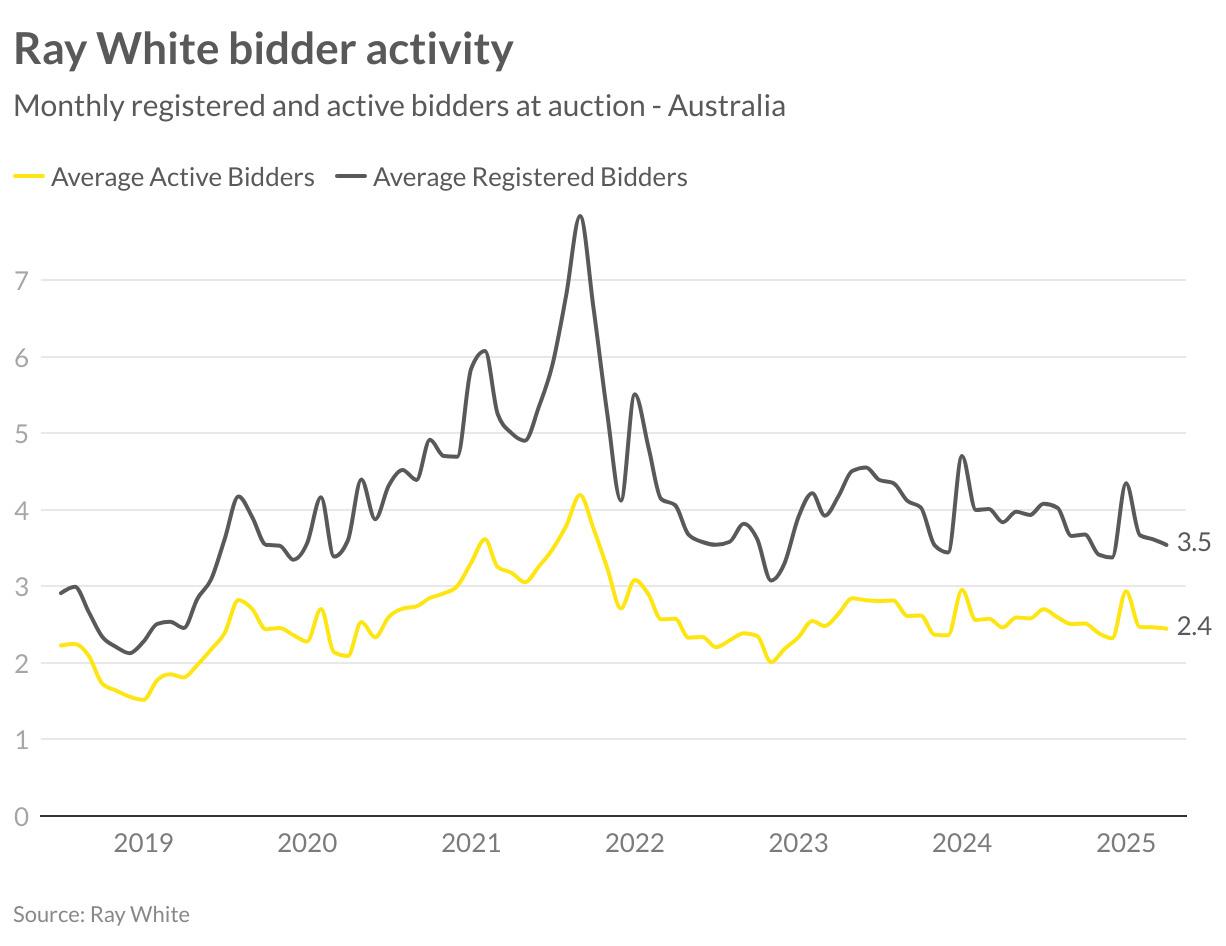
Bidder participation at auctions in April remained relatively stable with registered bidders averaging 3.5 per property and active bidders at 2.4 per auction. These figures represent a slight decline from the previous month but remain indicative of steady competition in a market that continues to see relatively few properties available relative to buyer demand.
The longer-term trend shows bidder numbers sitting comfortably above the levels seen through most of 2022-2023, though below the exceptional peaks observed during the post-pandemic boom. This level of buyer participation reflects a market where serious buyers are continuing to compete for limited stock, creating the conditions for sustained price growth despite affordability challenges.

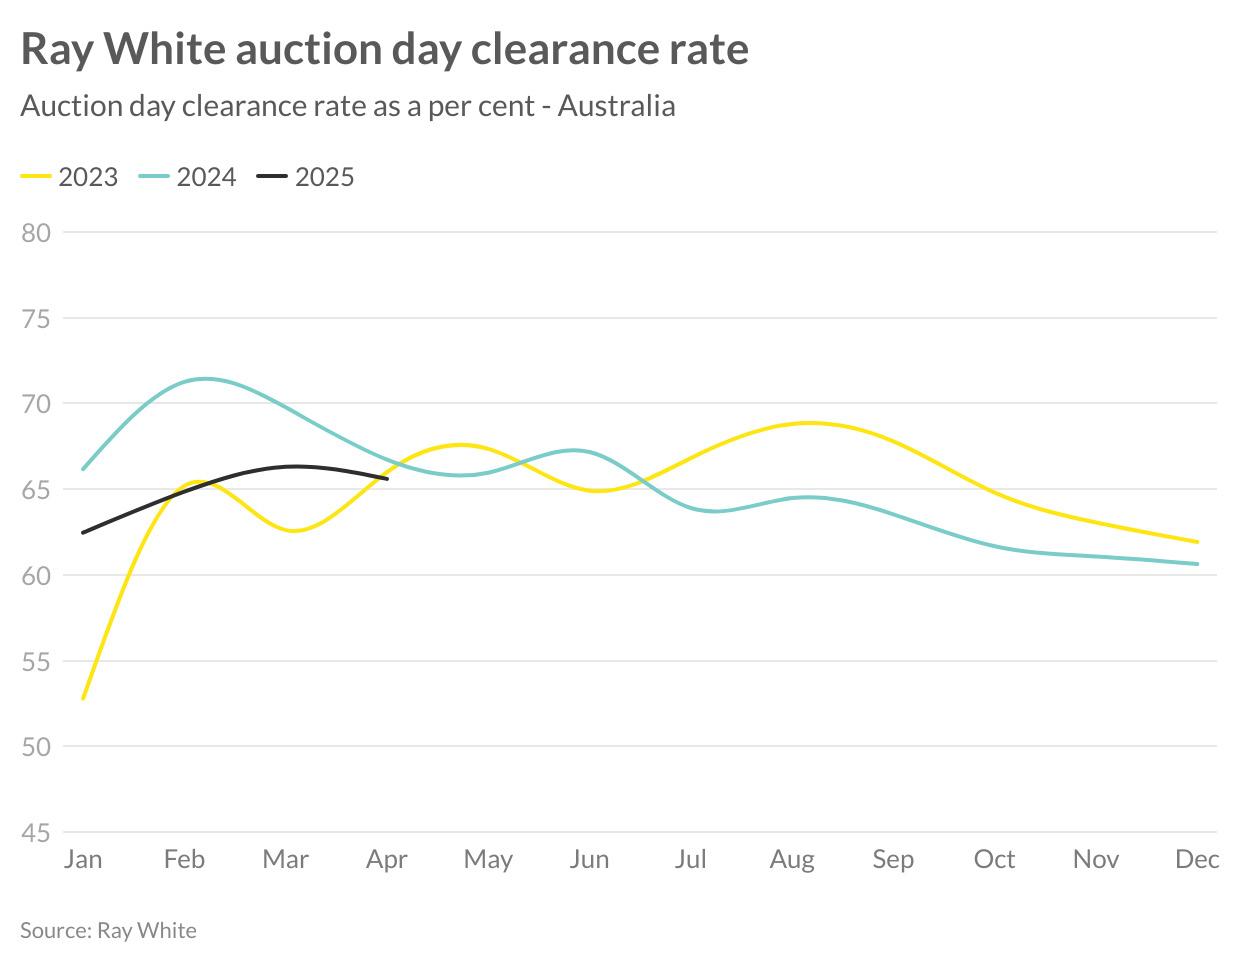
Auction clearance rates have stabilised at 65.9 per cent in April, showing a modest improvement from the first quarter of 2025. While this represents a decrease from the particularly strong results in April 2024, it remains above the levels seen in 2023, reflecting a market with healthy buyer demand. The trend line indicates a consistent performance trajectory through the first four months of 2025, with clearance rates tracking between those recorded in 2023 and 2024.
With the expected interest rate cut in May, auction performance could see renewed strength as buyer capacity improves. Labor’s anticipated housing policies following the election could also inject additional demand into the market, particularly at the first home buyer end, potentially driving stronger clearance rates in the traditionally quieter winter months ahead.

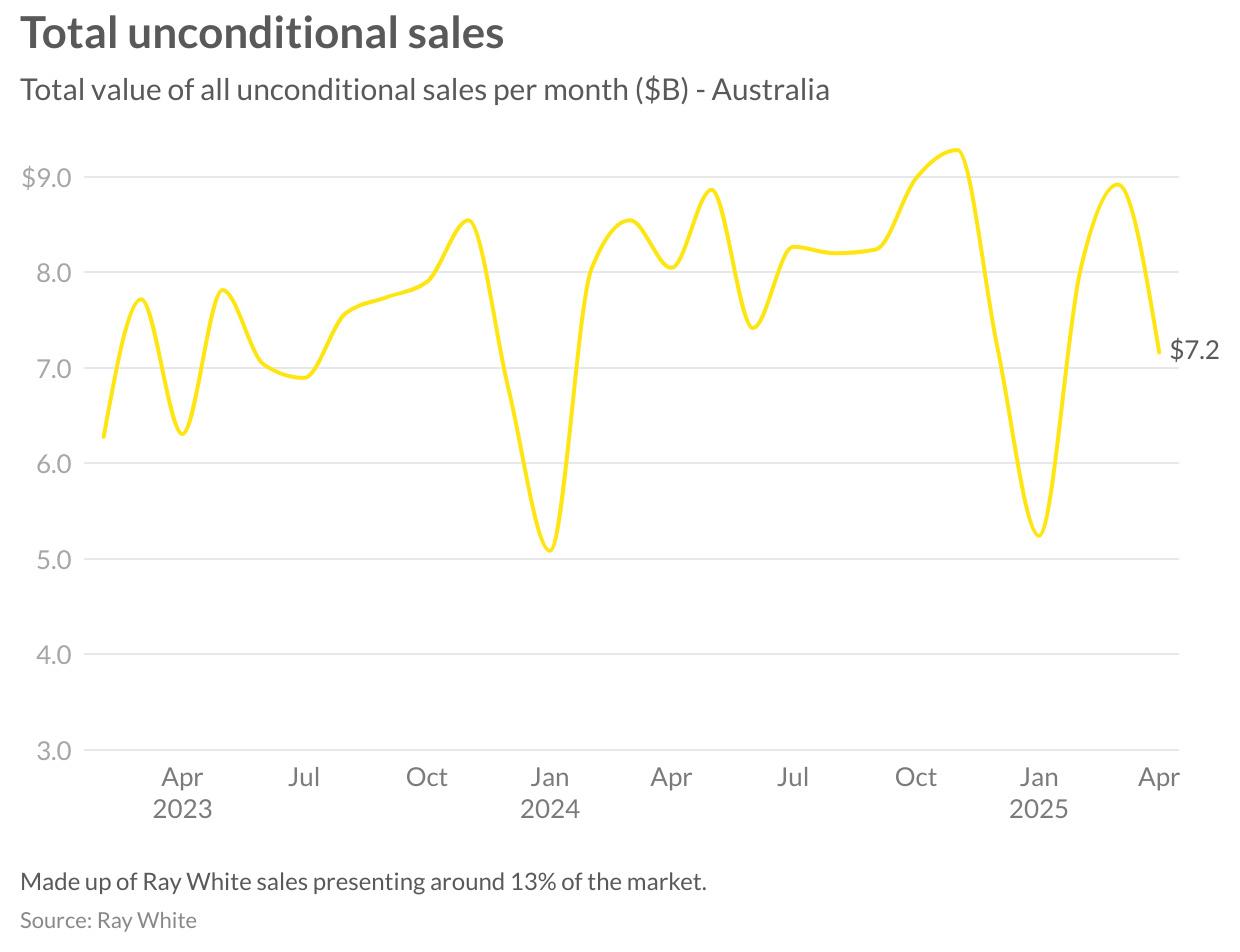
The Ray White Group’s sales performance demonstrated some moderation in April, with unconditional sales reaching $7.2 billion. This represents a decrease from March’s $8.3 billion but reflects typical seasonal patterns as the market transitions from the peak autumn selling period. Despite this seasonal adjustment, the figure represents solid performance in a market characterised by reduced listing volumes.
Looking at the longer-term trend, we can see that sales volumes in early 2025 have generally matched or exceeded those from the same periods in 2023 and 2024, indicating a market with robust underlying demand despite affordability challenges. The January dip was more pronounced this year, but recovery has been strong through February, March, and now April.
The combination of continued price growth and steady transaction volumes suggests a market with balanced dynamics between buyers and sellers. The anticipated interest rate cut in May could provide further stimulus, potentially supporting sales volumes through the traditionally quieter winter period ahead. Similarly, the Labor victory in the recent election could bring policy changes that stimulate additional market activity, particularly with the proposed expansion of first home buyer support measures.
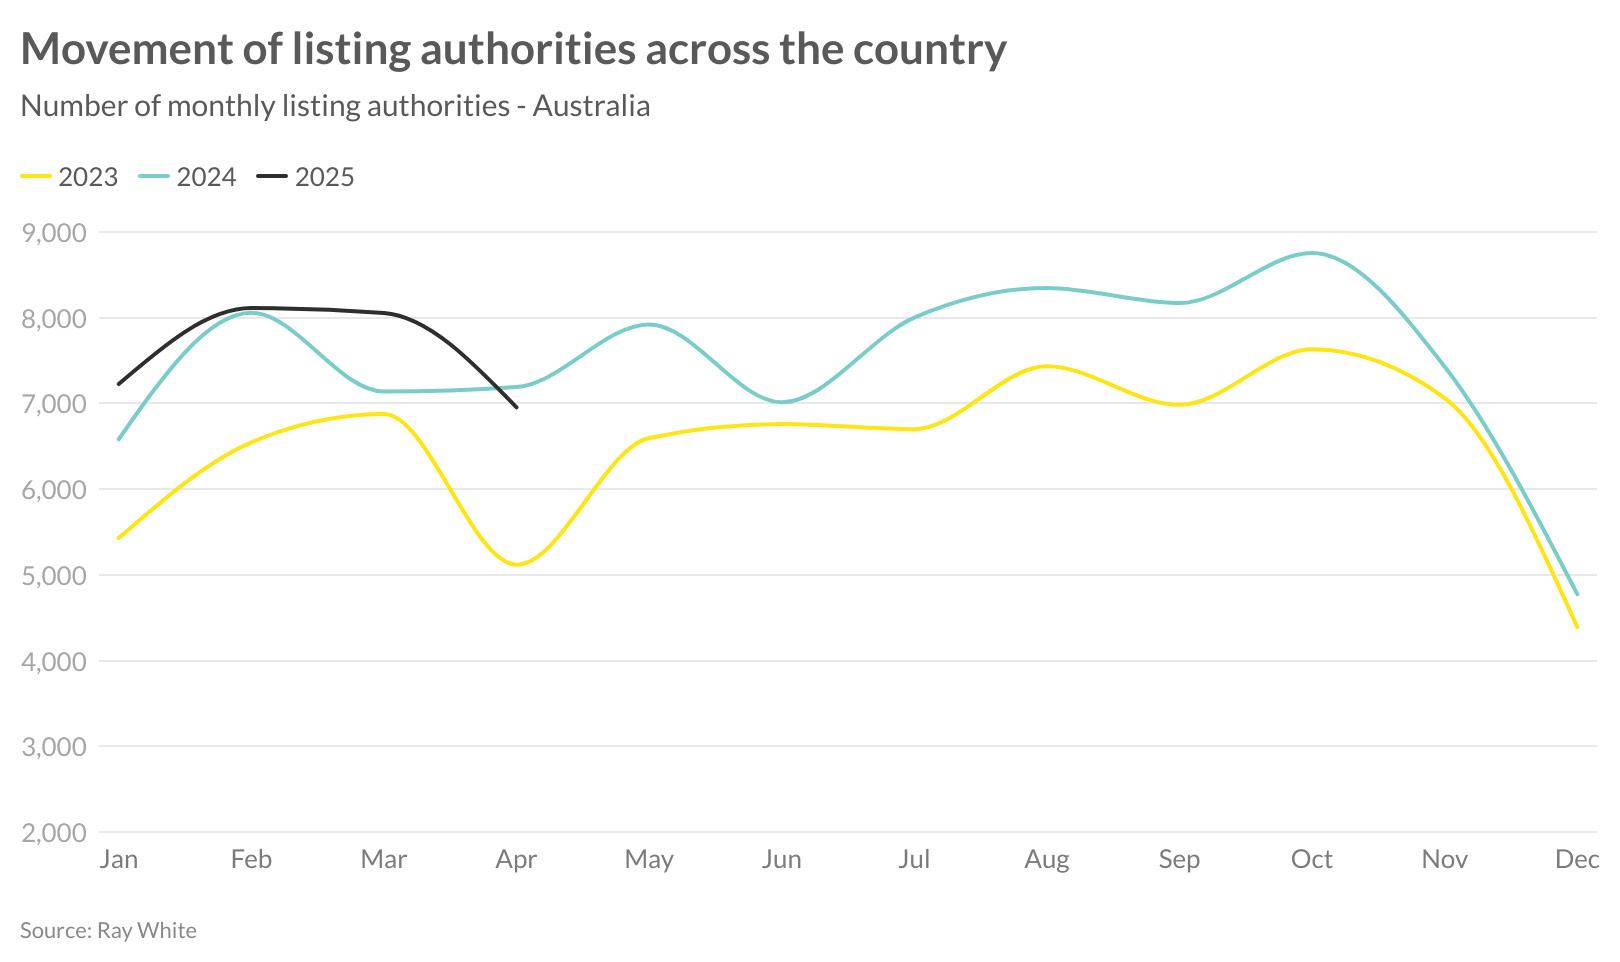
Ray White listing authorities, an important forward indicator for market supply, show a notable decline in April, dropping to approximately 7,000 from the previous month’s 8,000. This seasonal pattern aligns with historical trends, though at levels higher than those seen in 2023, suggesting a market that’s more active than recent years despite the monthly reduction. The current level of listing authorities suggests we may see some moderation in the rate of decline for new listings in the coming months, potentially easing some of the supply pressures currently driving price growth.
The anticipated interest rate cut in May could stimulate additional market activity, potentially encouraging more homeowners to list their properties as buyer demand strengthens. Similarly, post-election housing policies, particularly Labor’s expected expansion of the five per cent deposit scheme without income caps, could bring many more first-time buyers into the market, changing the dynamics for entry-level properties.