


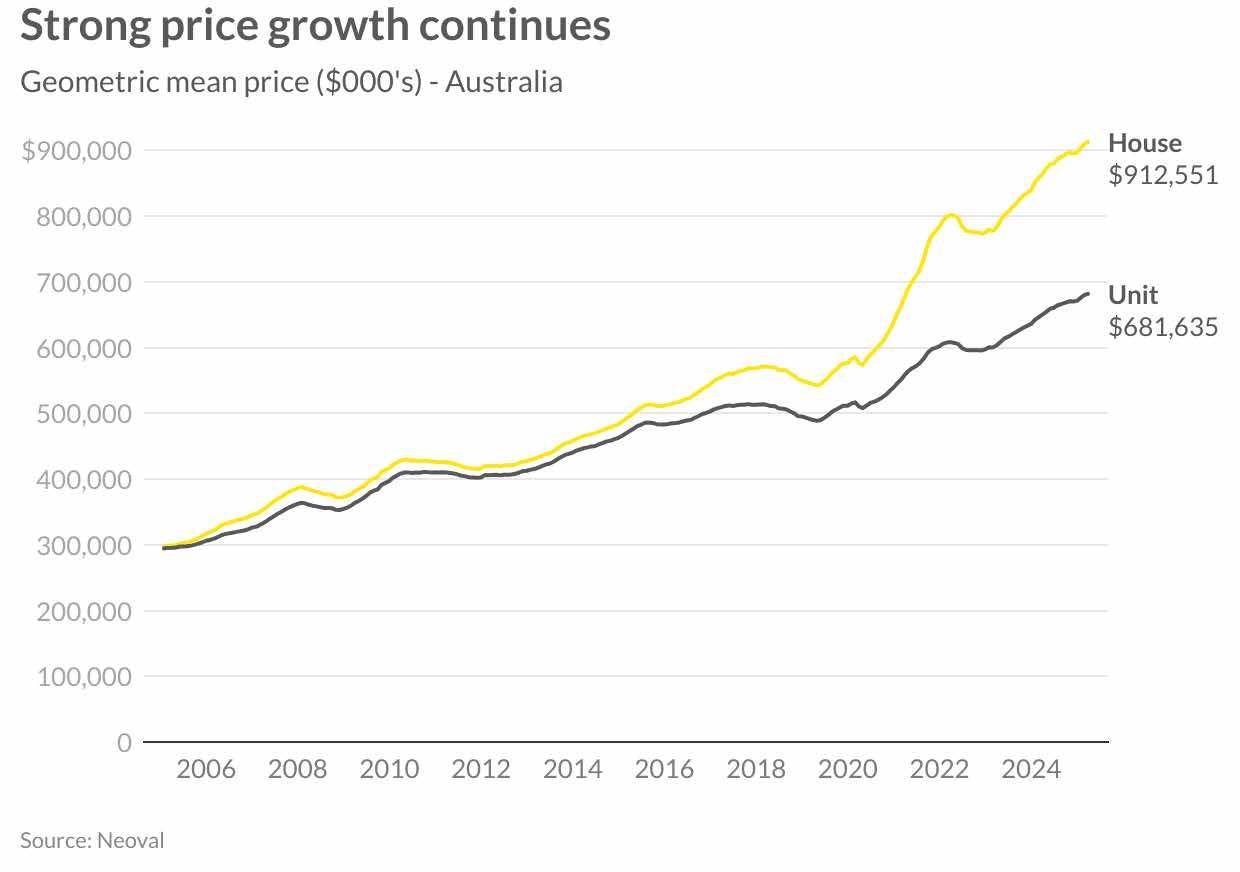
Australian property prices continue to demonstrate resilience in March 2025, with house prices recording a 0.3 per cent monthly increase, bringing the national mean to $912,551. Unit values rose similarly by 0.3 per cent to reach $681,635. This steady growth reflects ongoing supply constraints balancing against affordability challenges, with both market segments remaining well above their previous peak values.
The recent interest rate cut by the Reserve Bank of Australia has begun to influence market dynamics, supporting continued price growth. This monetary policy shift, coupled with the federal government’s 2025 budget housing measures announced in late March, could further shape market conditions. The budget’s expansion of the Help to Buy scheme, with increased income and property price caps, along with incentives for trade apprenticeships to address construction workforce shortages, aims to improve both affordability and supply constraints. However, concerns remain about measures potentially discouraging foreign investment in housing development.
Despite these policy interventions, the fundamental imbalance between housing supply and strong population growth continues to drive price appreciation across most markets in the first quarter of 2025.

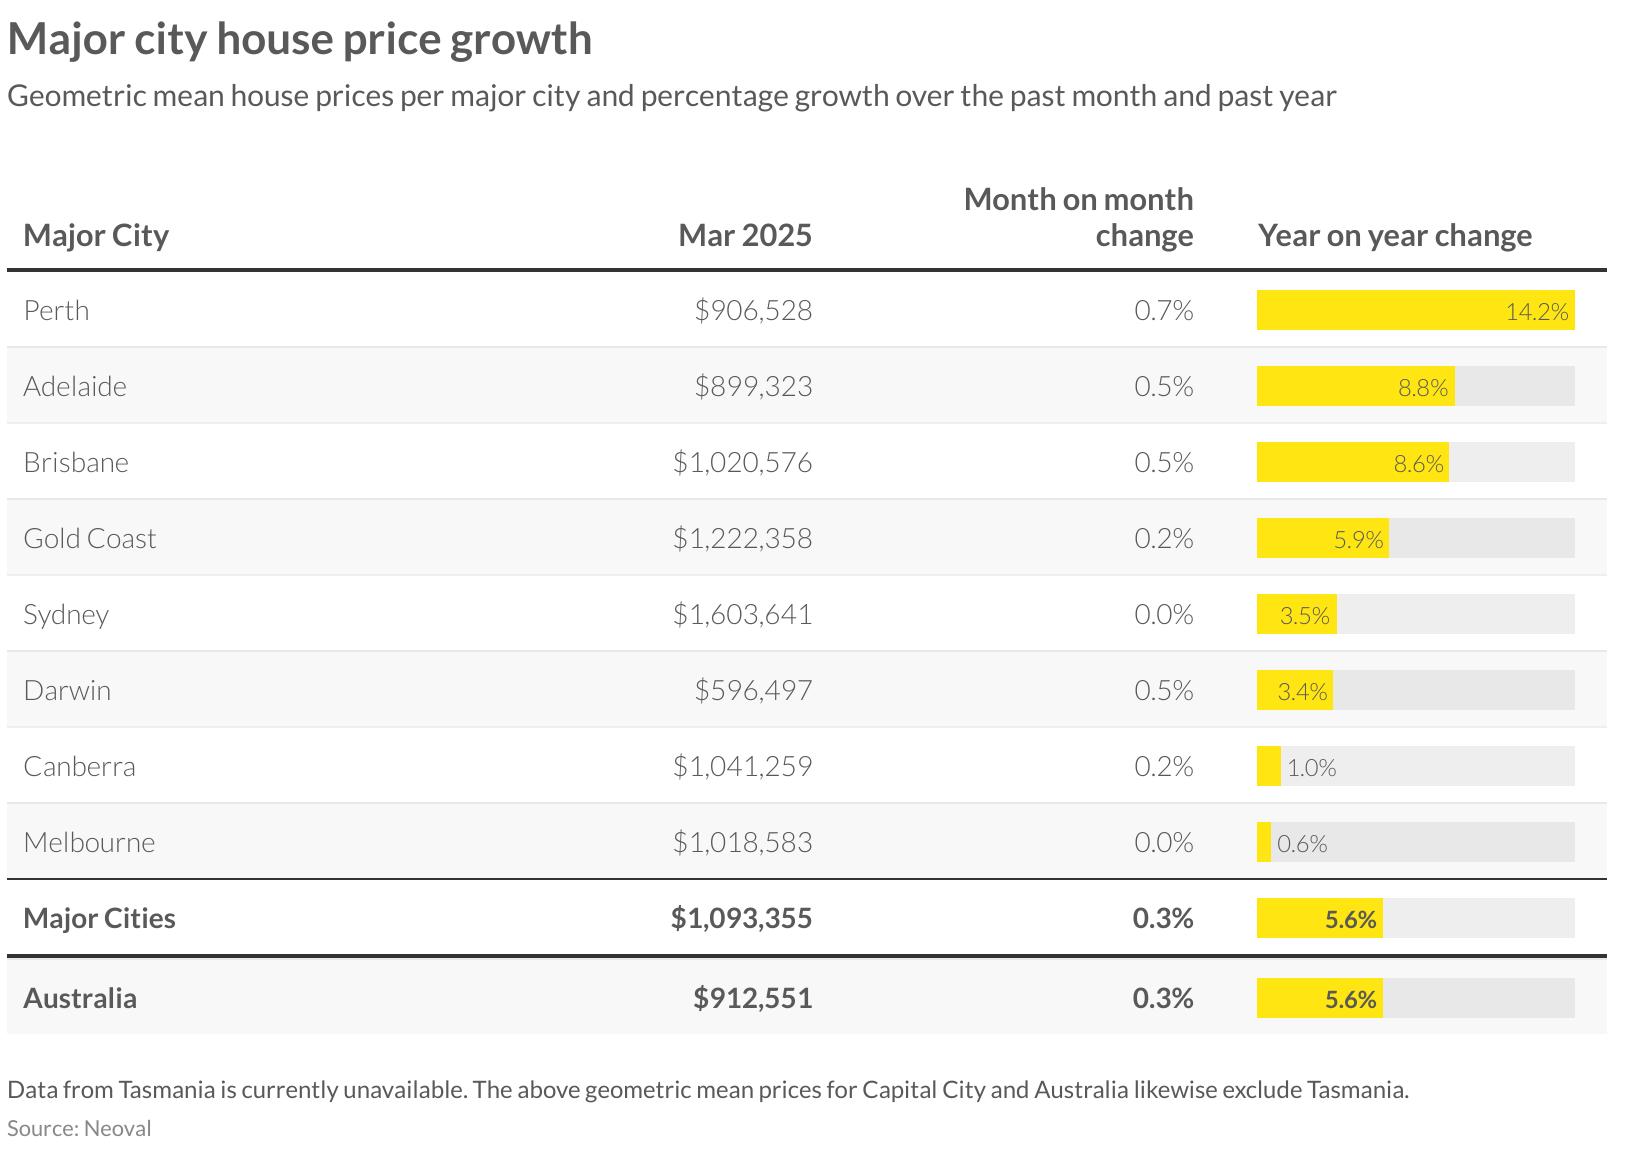
The capital city housing market continues to display varied performance across Australia’s major cities, with Perth maintaining its position as the standout performer. With a mean price of $906,528, Perth recorded a 0.7 per cent monthly gain and an impressive 14.2 per cent year-on-year increase, reflecting the ongoing economic strength in Western Australia’s mining sector.
Adelaide remains in strong territory, with its mean house price of $899,323 representing a 0.5 per cent monthly increase and solid 8.8 per cent annual growth. Brisbane has firmly established itself with a mean above $1 million at $1,020,576, reflecting a 0.5 per cent monthly gain and 8.6 per cent annual growth.
The Gold Coast continues to command premium values at $1,222,358, rising 0.2 per cent for the month, while Sydney maintains its position as Australia’s most expensive market at $1,603,641 with a more modest annual growth of 3.5 per cent. Melbourne shows the least momentum among major capitals, recording flat growth for the month and just 0.6 per cent annually despite its $1,018,583 mean.
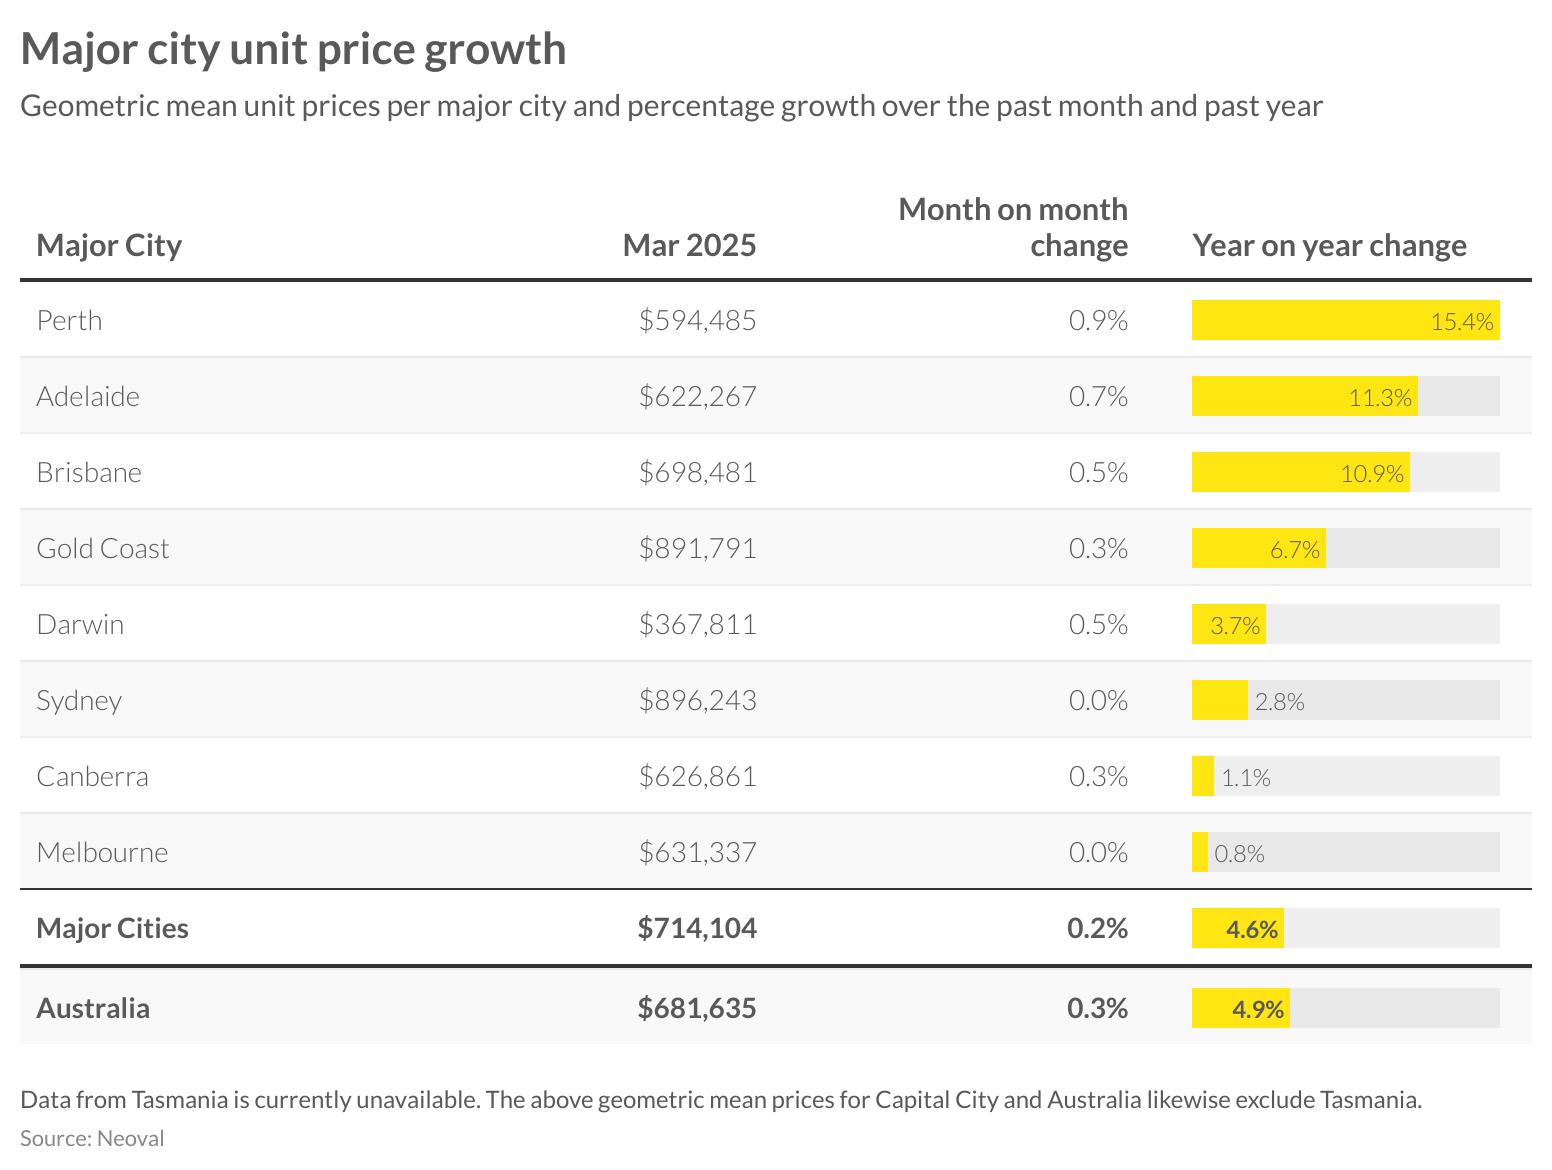
The unit market has performed variably across major cities in March, with Perth continuing to lead year-on-year growth metrics at 15.4 per cent, showing a strong 0.9 per cent gain for the month to reach $594,485. Adelaide follows with 11.3 per cent annual growth and a 0.7 per cent monthly increase, bringing its mean to $622,267.
Brisbane units recorded a robust 10.9 per cent annual increase with prices rising 0.5 per cent in March to $698,481. The Gold Coast maintains its premium position with a mean of $891,791, while Sydney remains the most expensive unit market at $896,243, though showing no movement for the month and modest 2.8 per cent annual growth.
Darwin recorded a solid 0.5 per cent monthly gain despite more moderate annual growth of 3.7 per cent. Canberra and Melbourne continue to show the most subdued performance among capital cities, with annual growth of just 1.1 per cent and 0.8 per cent respectively, highlighting the varied recovery patterns across Australia’s unit markets.
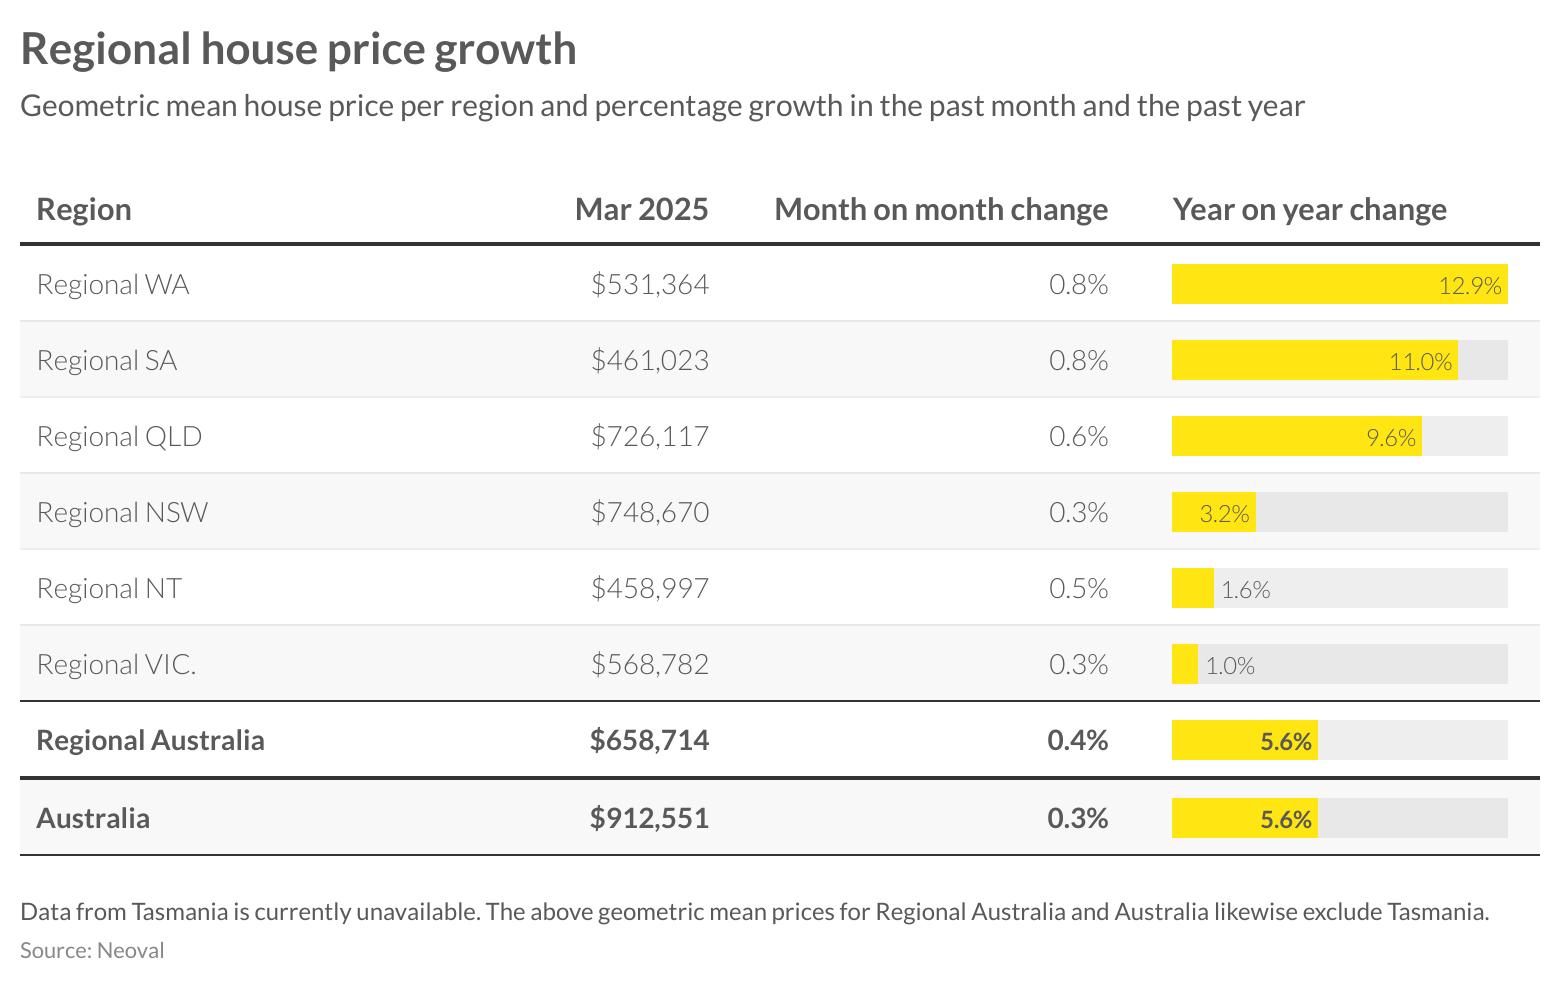
Regional housing markets continue to show significant variation in performance, with resource-rich states maintaining their leadership positions. Regional Western Australia leads with 12.9 per cent annual growth and a mean price of $531,364, recording a 0.8 per cent monthly increase. Regional South Australia follows closely with 11.0 per cent annual growth and also posted a 0.8 per cent monthly gain, bringing its mean to $461,023.
Queensland’s regional markets remain strong with 9.6 per cent annual growth and a 0.6 per cent monthly increase, bringing the mean to $726,117. This represents the second highest mean value among regional markets, reflecting the ongoing popularity of Queensland’s coastal lifestyle locations.
Regional New South Wales maintains the highest mean value at $748,670 but shows more modest annual growth of 3.2 per cent with a 0.3 per cent monthly increase. Victoria’s regional market recorded the same monthly growth but remains subdued on an annual basis at just 1.0 per cent, while the Northern Territory showed slightly stronger monthly movement at 0.5 per cent but minimal annual growth of 1.6 per cent.

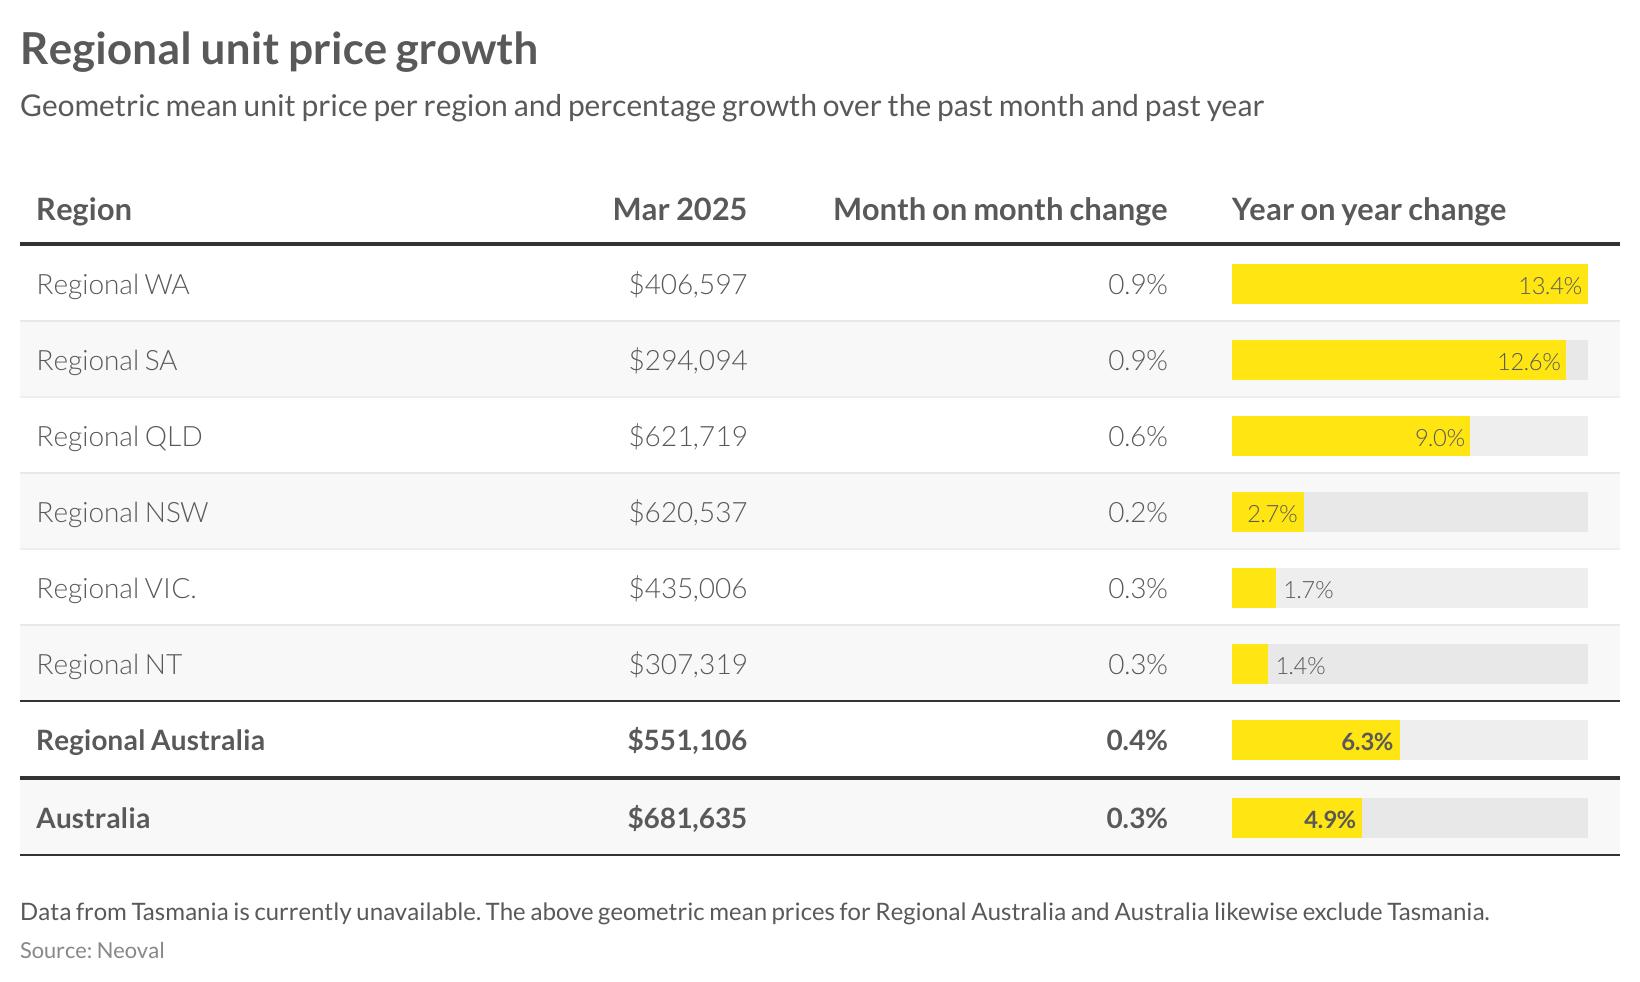
The regional unit market continues to mirror trends seen in the regional housing sector, with Western Australia and South Australia leading annual growth at 13.4 per cent and 12.6 per cent respectively. Both regions recorded a 0.9 per cent monthly increase in March, bringing their mean unit values to $406,597 and $294,094.
Regional Queensland maintains strong market conditions with 9.0 per cent year-on-year growth and a 0.6 per cent monthly increase, bringing its mean to $621,719. Regional New South Wales recorded more modest growth at 0.2 per cent for the month and 2.7 per cent annually, with a mean of $620,537.
Regional Victoria and Northern Territory showed slight monthly improvements of 0.3 per cent each, though annual growth remains subdued at 1.7 per cent and 1.4 per cent respectively. Overall, regional Australia’s unit market continues to outperform the national mean, with annual growth of 6.3 per cent exceeding the broader Australian figure of 4.9 per cent.
CAPITAL
LISTINGS ACTIVITY
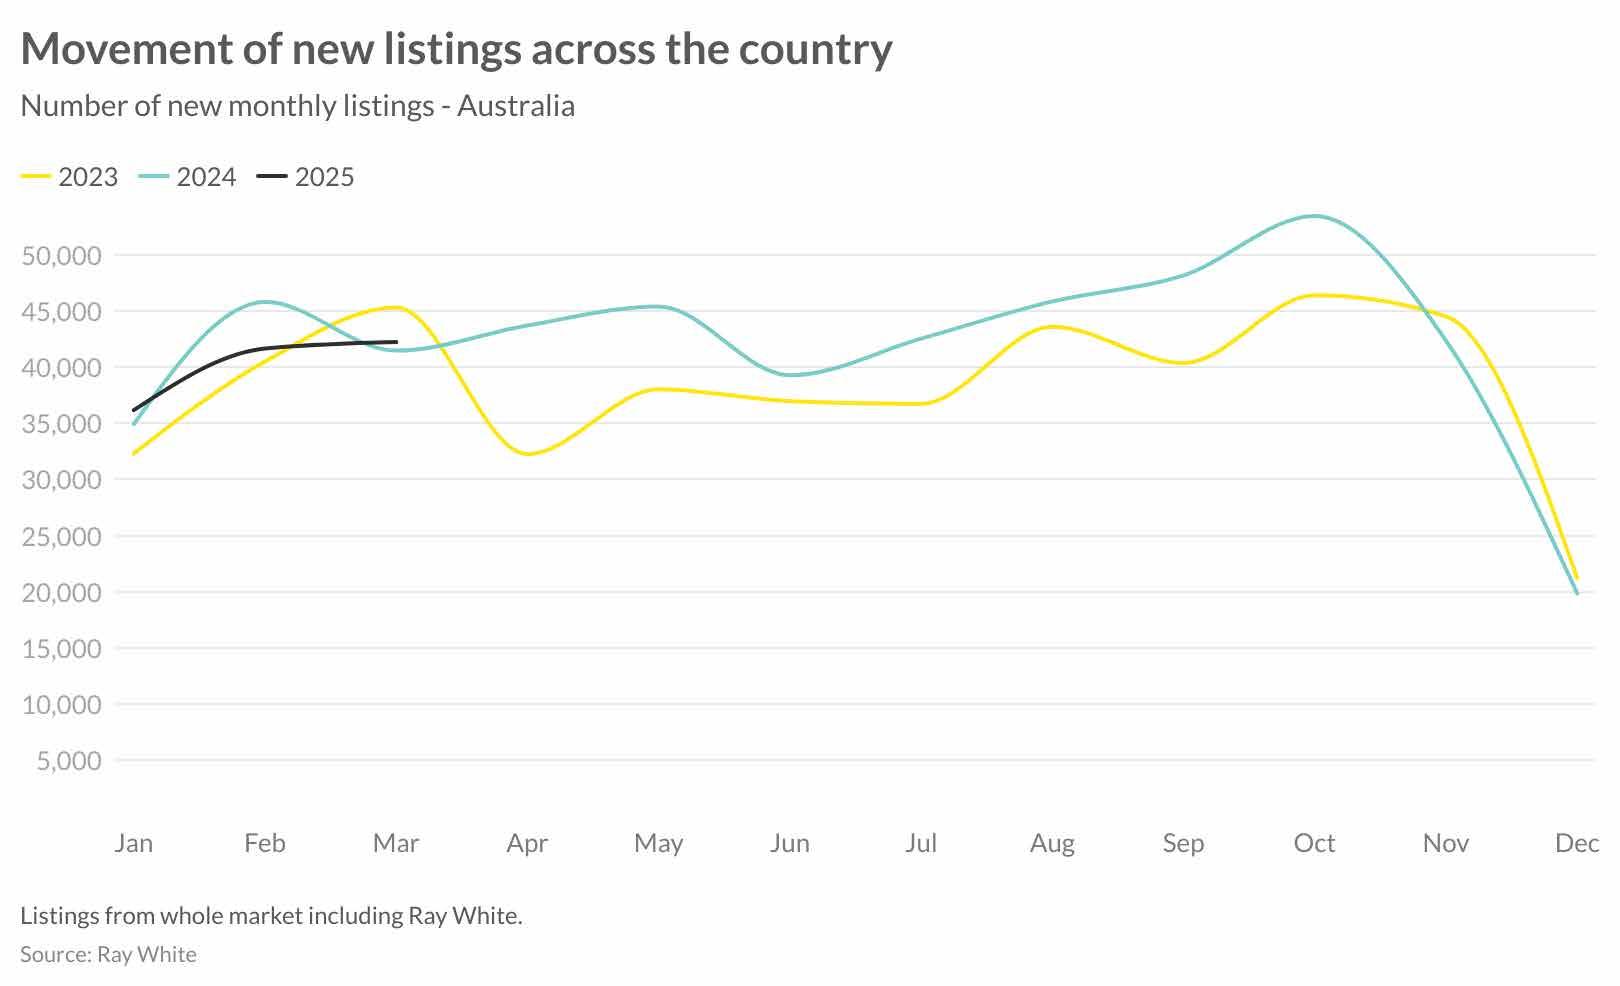
March listing data reveals continued momentum in the Australian property market with approximately 42,220 new properties coming to market. This represents a modest 1.8 per cent increase compared to March 2024, although still behind the 2023 result which eclipsed 45,000.
The upward trajectory seen in the first quarter, suggests growing vendor confidence, potentially influenced by the recent interest rate reduction and sustained price growth across most markets. The newly announced budget measures, particularly the expanded Help to Buy scheme that will open for applications in late 2025, may encourage more listings as current homeowners look to upgrade, knowing there will be greater support for first time buyers entering the market.

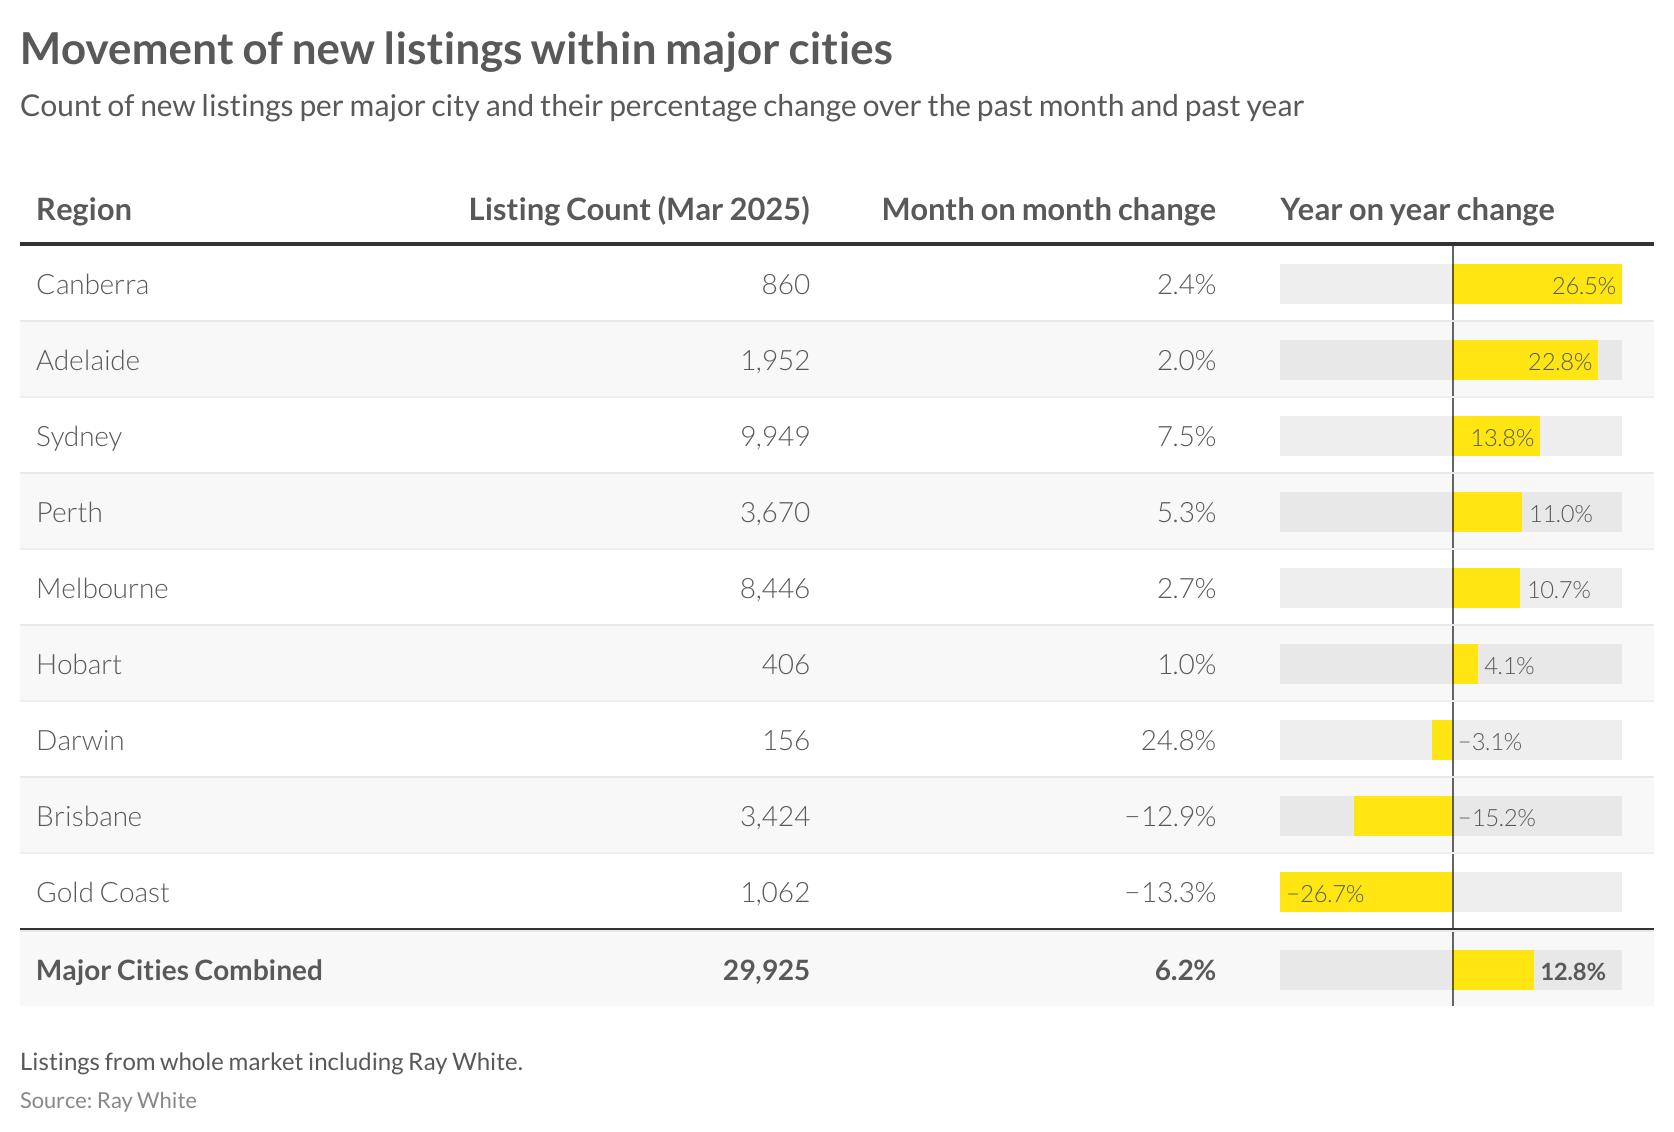
Major cities recorded 29,925 new properties in March, representing a 6.2 per cent increase from February and a substantial 12.8 per cent growth compared to March 2024. This strong year-on-year improvement indicates renewed seller confidence across metropolitan markets.
Canberra led capital cities with a remarkable 26.5 per cent annual increase in listings, followed by Adelaide at 22.8 per cent and Sydney at 13.8 per cent. Sydney continues to dominate in absolute numbers with 9,949 new listings, while Melbourne contributed 8,446 properties to the market. Perth also demonstrated solid growth with 11.0 per cent more listings year-on-year.
However, some markets displayed contrasting trends. Brisbane experienced a 12.9 per cent monthly decline and a 15.2 per cent annual decrease, while the Gold Coast recorded the most significant reductions with listings down 13.3 per cent for the month and 26.7 per cent year-on-year. These divergent patterns highlight the localised nature of property market dynamics even amid a broader national recovery.
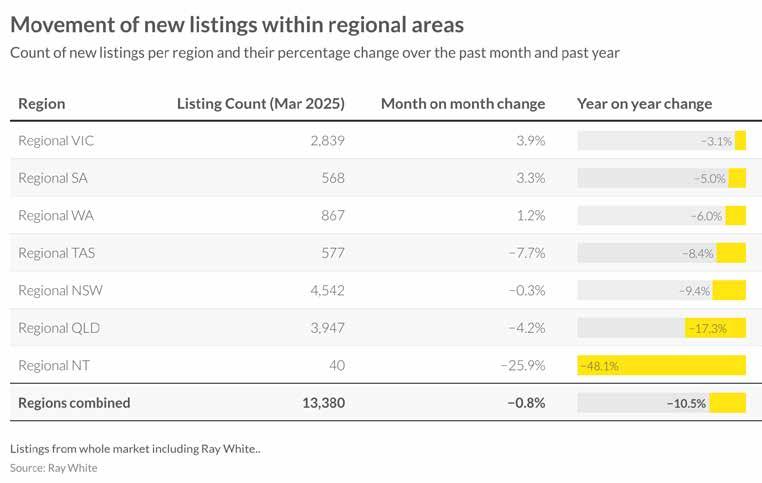
Regional listing activity showed a contrasting pattern to metropolitan markets in March, with combined regional areas recording 13,380 new listings. This represents a marginal 0.8 per cent monthly decline and a more substantial 10.5 per cent decrease compared to March 2024.
Regional Victoria led with 2,839 new listings, showing a 3.9 per cent monthly increase despite a 3.1 per cent annual decline. Similarly, regional South Australia posted a 3.3 per cent monthly gain but remained 5.0 per cent below last year’s levels. Regional Western Australia followed this pattern with a modest 1.2 per cent monthly increase against a 6.0 per cent annual decrease.
The most significant contractions occurred in regional Queensland, down 4.2 per cent month-on-month and 17.3 per cent year-on-year, and regional Northern Territory, which experienced a steep 25.9 per cent monthly decline and a dramatic 48.1 per cent annual reduction. These figures suggest continued tight supply conditions in these regional markets despite broader listing improvements in metropolitan areas.
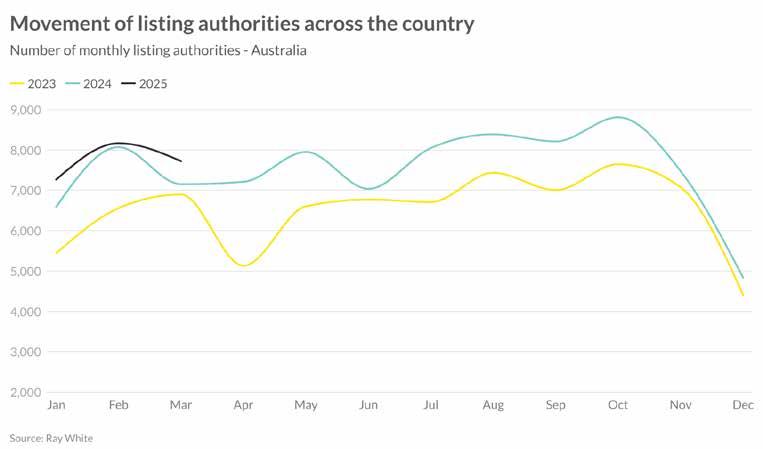
Ray White listing authorities, a key forward indicator for market supply, have shown notable movements in the first quarter of 2025. After reaching a peak in February at 8,142 authorities, March experienced a moderate decline to around 7,900. Despite this monthly reduction, the figures for early 2025 remain significantly elevated compared to the corresponding periods in both 2023 and 2024.
This trend represents a strong vote of confidence from potential vendors, likely influenced by the recent interest rate cut and sustained price growth across most markets. The level of listing authorities in March 2025 sits approximately 10 per cent above March 2024 figures, suggesting we can expect robust listing volumes to continue into the autumn selling season.
The trajectory of listing authorities provides a positive outlook for market activity in the coming months. While we typically see some moderation in April and May before a winter slowdown, the current elevated levels indicate stronger-than-usual vendor intent. This suggests the autumn selling season could extend with greater momentum than in previous years, particularly as sellers respond to improved borrowing conditions and sustained buyer demand.

AUCTION INSIGHTS
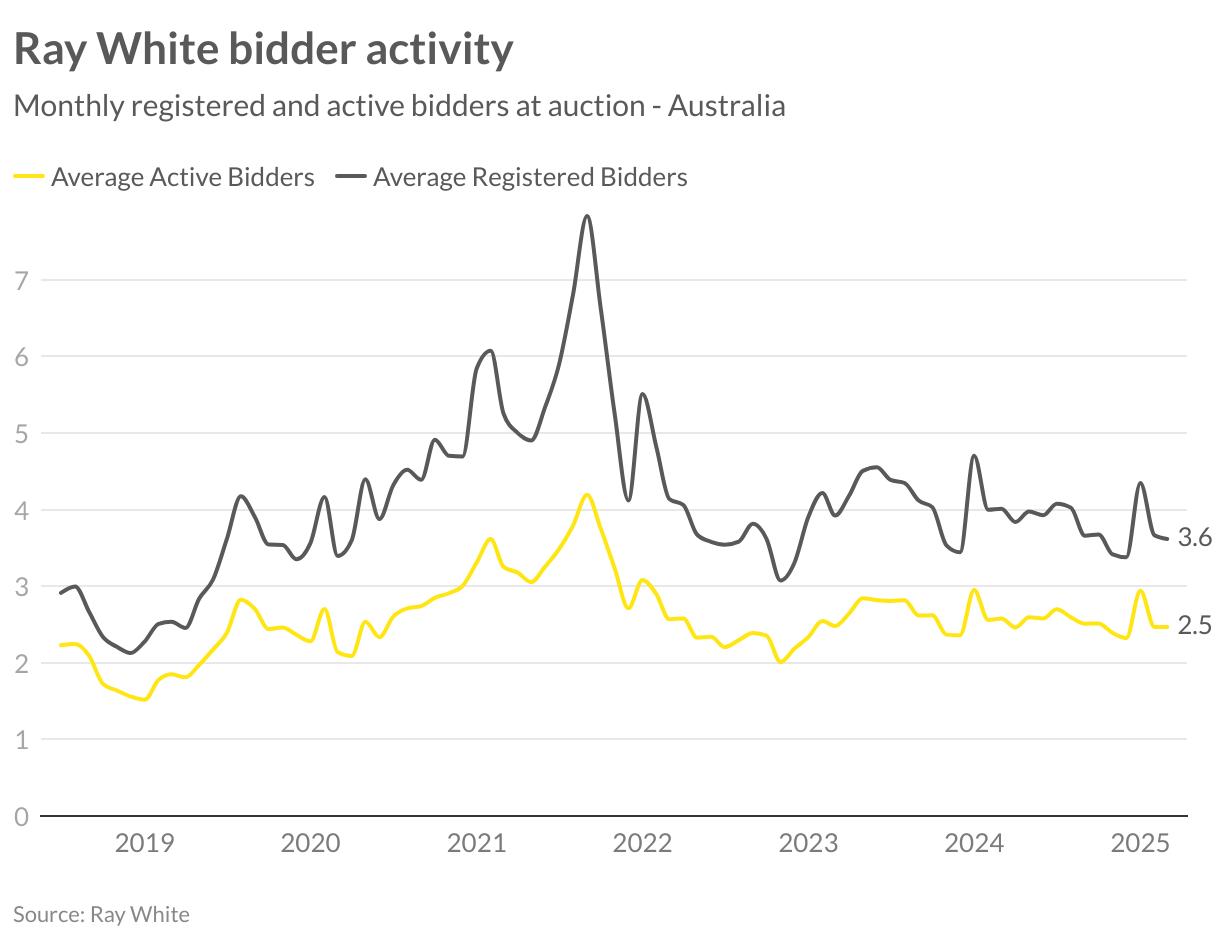
Bidder participation at auctions in March remained steady with registered bidders averaging 3.6 per property and active bidders holding at 2.5 per auction. These figures represent a continuation of the stable patterns established in recent months, following the more volatile activity seen through 2022 and 2023.
The consistency in bidder numbers throughout early 2025 suggests a market that has found equilibrium, with buyer interest maintaining steady levels despite increasing property availability. The ratio of active to registered bidders (approximately 70 per cent) indicates serious buyer intent, with most registered participants actively engaging in the bidding process.

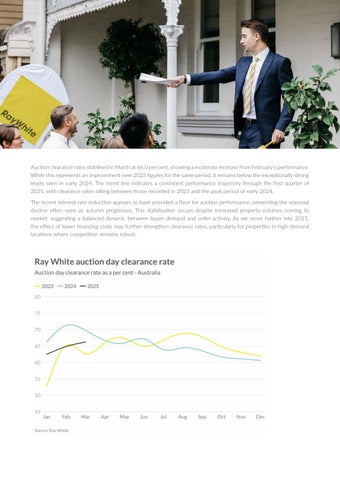
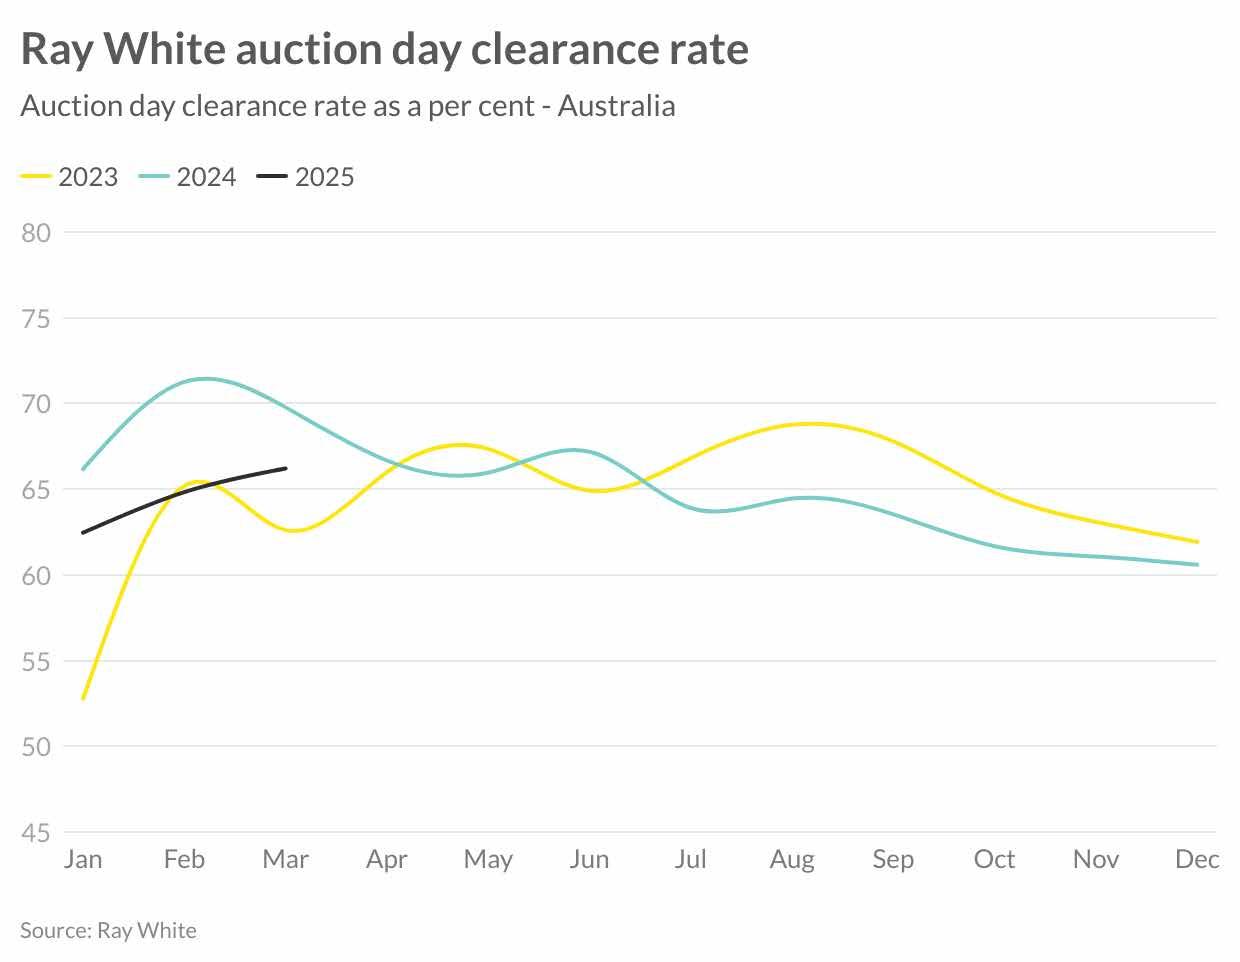
Auction clearance rates stabilised in March at 66.0 per cent, showing a moderate increase from February’s performance. While this represents an improvement over 2023 figures for the same period, it remains below the exceptionally strong levels seen in early 2024. The trend line indicates a consistent performance trajectory through the first quarter of 2025, with clearance rates sitting between those recorded in 2023 and the peak period of early 2024.
The recent interest rate reduction appears to have provided a floor for auction performance, preventing the seasonal decline often seen as autumn progresses. This stabilisation occurs despite increased property volumes coming to market, suggesting a balanced dynamic between buyer demand and seller activity. As we move further into 2025, the effect of lower financing costs may further strengthen clearance rates, particularly for properties in high-demand locations where competition remains robust.

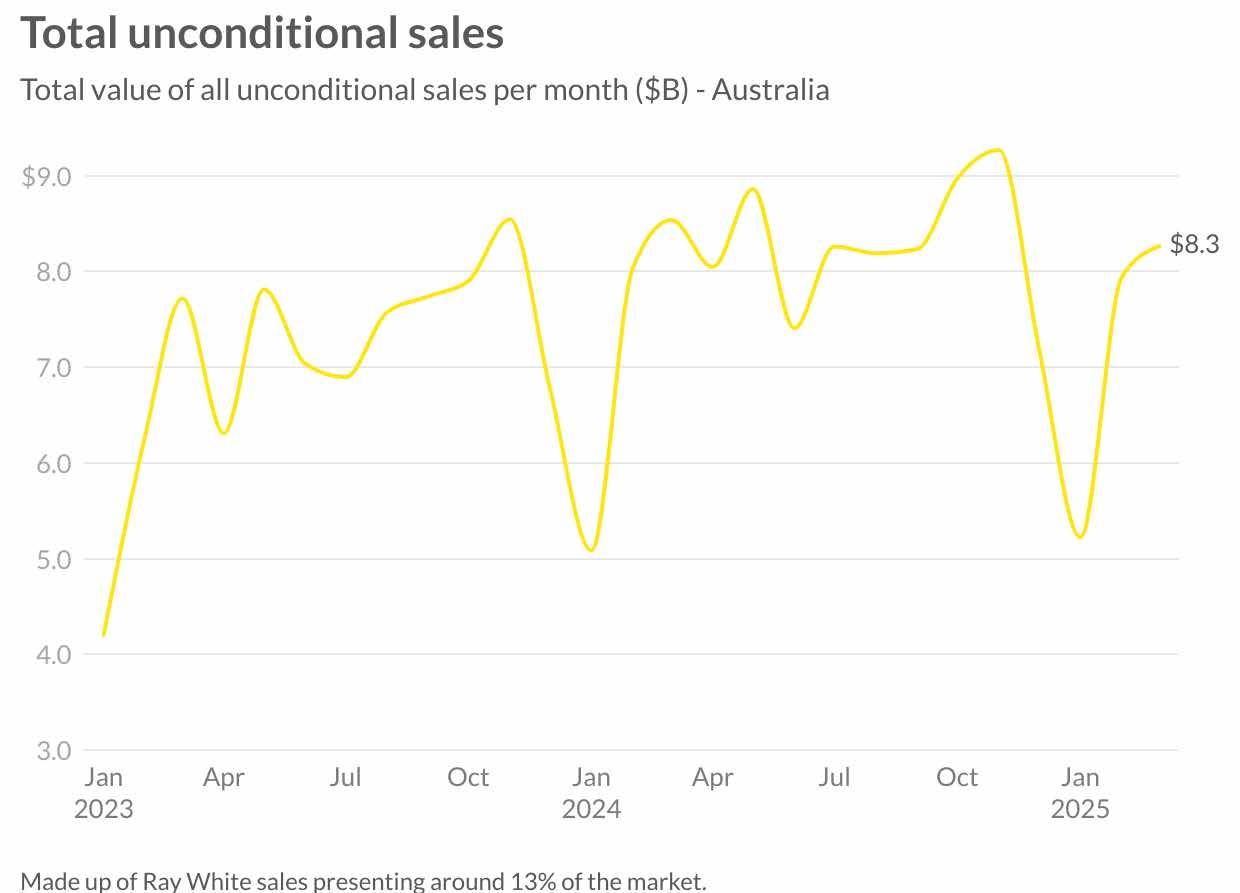
Ray White Group’s sales performance strengthened in March, with unconditional sales reaching $8.3 billion. This demonstrates continued momentum following the seasonal recovery from January’s results, signalling robust market activity as the first quarter concludes.
The March figure represents a strong recovery from the seasonal lows experienced in January and aligns with typical market patterns that show strengthening conditions during the autumn selling season. This performance reflects both sustained price growth and increasing transaction volumes across most markets, particularly in Perth, Adelaide and Sydney.
With interest rates now beginning their downward cycle, this momentum appears well-positioned to continue through the cooler months, traditionally a period of more moderate market activity. The substantial improvement since January highlights growing market confidence following the first interest rate reduction in over three years.