S E L L E R ' S


property report ilya rasner President, The Rasner Group 6178239780 ilya@rasnergroupcom Keller Williams Boston Metro 607 BoylstonSt, 5th Fl Boston, MA 20114
125 B St, Unit 3B, South Boston, MA 02127

Legend: Subject Property
Off Market Sold Date: 5/2/2017, Public Record

Current
Estimated Value Your Comp Analysis
$924,430
Last RVM® Update: 8/29/2023

RVM® Est. Range: $832K – $1.02M
RVM® Confidence:
RVM® Change - Last 1 Month: $2,800
RVM® Change - Last 12 Months: 0.45%
$963,493
Last Edited: 9/10/2023
$913
Your Comp Analysis Range
Price per Sq. Ft.
$841K – $1.09M
This report contains data and information that is publicly available and/or licensed from third parties and is provided to you on an "as is" and "as available" basis The information is not verified or guaranteed Neither this report nor the estimated value of a property is an appraisal of the property. Any valuation shown in this report has been generated by use of proprietary computer software that assembles publicly available property records and certain proprietary data to arrive at an approximate estimate of a property's value. Some portions of this report may have been provided by an RPR user; RPR is not responsible for any content provided by its users RPR and its information providers shall not be liable for any claim or loss resulting from the content of, or errors or omissions in, information contained in this report
Property Report 125 B St, Unit 3B, South Boston, MA 02127 Copyright 2023 Realtors Property Resource® LLC All Rights Reserved Information is not guaranteed Equal Housing Opportunity 9/10/2023


Copyright 2023 Realtors Property Resource® LLC All Rights Reserved Information is not guaranteed Equal Housing Opportunity 9/10/2023 LEGEND: Subject Property 125 B St, Unit 3B South Boston, MA 02127 Pending Proxim. –Days Date in RPR – –For Sale or For Lease Amoun t –Distressed Recent Sale Off Market $/sq ftLiving AreaLot SizeBedsBathsBuilt $8761,055 sq ft1,055 sq ft221899 Closed Comps and Adjustments This Property
Current Listings


Copyright 2023 Realtors Property Resource® LLC All Rights Reserved Information is not guaranteed Equal Housing Opportunity 9/10/2023 Active Active Active Active Pending Pending Pending Pending Pending Pending Address 196 W 6th St, Apt 1 Boston, MA 02127 196 W 6th St, Apt 2 Boston, MA 02127 196 W 6th St, Apt 3 Boston, MA 02127 171 W 4th St, Unit 5 South Boston, MA 02127 20 W 5th St, Apt 5E South Boston, MA 02127 340 W 2nd St, Apt 13 South Boston, MA 02127 120 W 7th St, Apt 505 South Boston, MA 02127 14 W Broadway, Unit 607 Boston, MA 02127 14 W Broadway, Unit 703 Boston, MA 02127 14 W Broadway, Unit 803 Boston, MA 02127 37 Mi E .37 Mi. S 41 Mi S .41 Mi. S 41 Mi S .17 Mi. W71 days7/1/2023 List Date 22 Mi NW95 days6/7/2023 List Date 124 days5/9/2023 List Date 22 Mi NW30 days8/11/2023 List Date Days Proxim.in RPRDate 13 Mi SW75 days6/27/2023 List Date 22 Mi NW135 days4/28/2023 List Date 88 days6/14/2023 List Date 134 days4/29/2023 List Date 133 days4/30/2023 List Date 133 days4/30/2023 List Date Amount $979,000 List Price $950,00 0 List Price $849,90 0 List Price $929,00 0 List Price $939,00 0 List Price $949,00 0 List Price $1,119,00 0 List Price $1,250,00 0 List Price $1,165,00 0 List Price $1,099,00 0 List Price $940 $935 $797 $845 $854 $863 1,190 sq ft–$1,0021,247 sq ft–$1,0321,129 sq ft–$1,0181,080 sq ft–1,016 sq ft–1,100 sq ft–1,100 sq ft–1,100 sq ft–2 2 2 2 2 1,066 sq ft1,066 sq ft2 2 2 2 2 2 2 2 2 2 2 2 2 2020 Same 2018 Same 2018 Same 2018 Same 2020 Same 1910 Same 1910 Same 1910 Same 1910 Same Comp vs $/sq ftLiving AreaLot SizeBedsBathsBuiltSubject $8281,183 sq ft1,191 sq ft222010Same
Recently Sold


Copyright 2023 Realtors Property Resource® LLC All Rights Reserved Information is not guaranteed Equal Housing Opportunity 9/10/2023 Closed Closed Closed Closed Closed Closed Closed Closed Address 45 W 3rd St, Apt 417 South Boston, MA 02127 213 W 2nd St, #2 South Boston, MA 02127 39 A St, Unit 2 South Boston, MA 02127 2 W 6th St, Unit 406 South Boston, MA 02127 125 B St, Unit 4C South Boston, MA 02127 235 Gold St, Unit 2 South Boston, MA 02127 279 W 3rd St, Unit 1 South Boston, MA 02127 14 W Broadway, Unit 406 Boston, MA 02127 – Mi E 13 Mi E – 7/12/2023 $999,375 $884 Closed DateClosed Price 14 Mi W99 days6/15/2023$920,000$898 Closed DateClosed Price 22 Mi SW84 days6/13/2023$1,130,000$942 Closed DateClosed Price 22 Mi NW40 days7/18/2023$1,135,000$910 Closed DateClosed Price 60 days6/16/2023$925,000$877 Closed DateClosed Price Closed.39 Mi. SE60 days8/7/2023$1,112,000$989 Closed DateClosed Price 410 W Broadway, Unit 502 South Boston, MA 02127 42 Mi SE105 days8/16/2023$846,000$833 Closed DateClosed Price .37 Mi. SE47 days7/17/2023$955,000$873 Closed DateClosed Price 1,025 sq ft–1,200 sq ft–1,247 sq ft–1,124 sq ft–Days Proxim.in RPRDateAmount$/sq ftLiving AreaLot Size 09 Mi NW60 days7/31/2023$1,050,000$1,0321,017 sq ft–Closed DateClosed Price 1,130 sq ft1,130 sq ft2 2 2 2 1,055 sq ft1,055 sq ft1 2 1,015 sq ft1,015 sq ft2 1,094 sq ft1,094 sq ft2 2 2 2 2 2 2 2 2 2009 Same 2018 Same 2017 Same 2018 Same 1899 Same 2019 Same 2009 Same 2013 Same Comp vs BedsBathsBuilt Subject 2 2 2018Same
Property History

This graphic displays property estimates for a market area and a subject property, where one has been selected. Estimated property values are generated by a valuation model and are not formal appraisals
Legal Description
SBOS W:06 P:01360 S:020
Copyright 2023 Realtors Property Resource® LLC All Rights Reserved Information is not guaranteed Equal Housing Opportunity 9/10/2023
Property South Boston Suffolk County Massachusetts Sales History
This
Median Estimated Home Value Assessed Values 5/2/2017 8/18/2015 5/30/2012 4/18/2008 $855,000 $700,000 $515,000 $530,000
Data Source: Public records, and MLS sources where licensed Update Frequency: Monthly $81 0 $66 3 $48 8 $50 2
CD 250250612.031023 CITY/MUNI/TWP:BOSTON-SOUTH BOSTON South Boston, MA
202 3 202 2 202 1 202 0 201 9 201 8 201 7 201 6 201 5 201 4 201 3 201 2 201 1 200 9 200 8 $800,300 $777,000 $771,700 $759,100 $702,900 $663,200 $614,000 $579,800 $529,800 $472,900 $437,800 $493,600 $493,600 $392,400 $392,400 –––––––––––––––$800,300 $777,000 $771,700 $759,100 $702,900 $663,200 $614,000 $579,800 $529,800 $472,900 $437,800 $493,600 $493,600 $392,400 $392,400 $8,595 $8,454 $8,234 $8,016 $7,409 $6,950 $1,104 $6,378 $6,416 $5,949 $5,753 $6,437 $6,313 ––Sales Date APN Zoning Census Tract Abbreviated Description City/Municipality/Township Sales Amount Price per sq. ft. Date ImprovementsLand Total Tax
02127
Neighborhood: Housing Stats and Charts
02127South Boston
Estimated Home Value
Home Value 12-Month Change
List Price
Price 1-Month Change List Price 12-Month Change Median Home Age Own Rent

$ Value of All Buildings for which Permits Were Issued
% Change in Permits for All Buildings % Change in $ Value for All Buildings
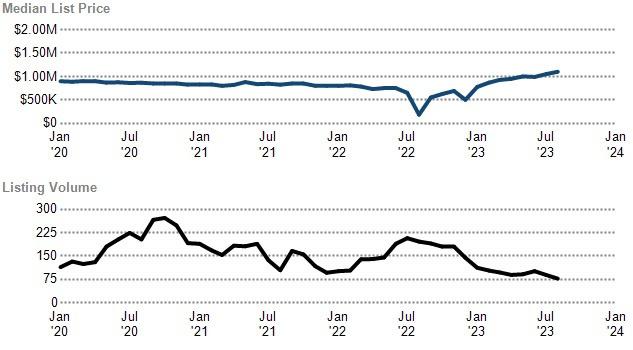
This chart compares a ZIP code's median estimated home value with the median listing price of Active listings Estimated home values are generated by a valuation model and are not formal appraisals Data Source: Public Record and
Copyright 2023 Realtors Property Resource® LLC All Rights Reserved Information is not guaranteed Equal Housing Opportunity 9/10/2023 Median
Value
Estimated
Median List Price Median Estimated Home Value vs. Median Listing Price
data Update
$789K $789K -2 3% -2 3% $1 1M $920K +4 9% -2 6% +510 3% +31 6% 7373 44%–56%–– –– –– –$672K -0 8% $929K +2 7% +77% 79 36% 64% $1 64B -16% +164% $606K +3% $750K +2 9% +42 9% 61 62% 38% $4 76B +4% +29% $352K +1 8% –––43 65% 35% $307B +13% +10%
Listing
Frequency: Monthly
Median
Estimated
Median
List
Suffolk County Massachusetts USA
Median Sales Price vs. Sales Volume
This chart compares the listings and public records sales price trend and sales volume for homes in an area
Data Source: Public Record and Listing data
Update Frequency: Monthly
Median Sales Price
Public Records
Median Sales Price Listings
Sales Volume

Public Records
Sales Volume Listings
Median Listing Price vs Listing Volume
This chart compares the listings and public records sales price trend and sales volume for homes in an area.

Data Source: Public Record and Listing data
Update Frequency: Monthly
Median List Price Listing
Volume
Listing Inventory
This chart shows the number of For Sale listings in a ZIP code by Property Type
Data Source: On- and off-market listings sources
Update Frequency: Daily
ZIP Count Listings by PropertyType
Copyright 2023 Realtors Property Resource® LLC All Rights Reserved Information is not guaranteed Equal Housing Opportunity 9/10/2023
Median Sales Price by Square Footage
This chart shows the median price of homes reported sold in the past six months, according to the size of the living space (square footage sourced from public records). The amount shown for the subject property is sold data where available, or the property's estimated value when sales data are unavailable (such as non-disclosure states) or provided in range format.
Data Source: Public records and MLS data where licensed
Update Frequency: Monthly
This Property Comps
Price per Bedroom of Comps Sold
This chart shows the distribution of homes reported sold in the past six months at different prices per bedroom in the area of your search The amount shown for the subject property is sold data where available, or the property's estimated value when sales data are unavailable (such as a non-disclosure state) or provided in range format
Data Source: Public records and MLS data where licensed


Update Frequency: Monthly
This Property Comps
Price per Square Foot of Comps Sold
This chart shows the distribution of homes reported sold in the past three months at different prices per square foot.
Data Source: Public records data
Update Frequency: Daily

This Property Comps
Copyright 2023 Realtors Property Resource® LLC All Rights Reserved Information is not guaranteed Equal Housing Opportunity 9/10/2023
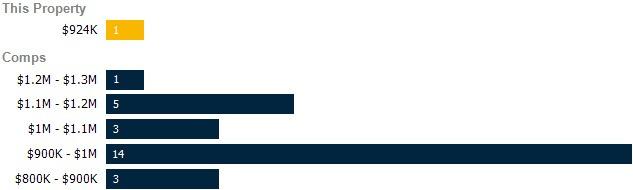
Price Range of Comps Sold
This chart shows the distribution of homes reported sold in the past three months within different price ranges in the area of your search The amount shown for the subject property is sold data where available, or the property's estimated value when sales data is unavailable (such as a non-disclosure state) or provided in range format.
Data Source: Public records data
Update Frequency: Daily
This
Age Range of Comps Sold

This chart shows the distribution of homes reported sold in the past three months of different age ranges in the area of your search.
Data Source: Public records data
Update Frequency: Daily
This Property Comps

Size of Homes Sold
This chart shows the distribution of homes reported sold in the past three months of different sizes in the area of your search
Data Source: Public records data
Update Frequency: Daily
Sales Count By Living Area
Number of Bedrooms in Homes Sold
This chart shows the distribution of homes reported sold in the past three months, compared by the number of bedrooms, in the area of your search
Data Source: Public records data

Update Frequency: Daily
Sales Count by Bedroom
Copyright 2023 Realtors Property Resource® LLC All Rights Reserved Information is not guaranteed Equal Housing Opportunity 9/10/2023
Property Comps
Neighborhood: Economic Stats and Charts

02127South BostonSuffolk County Income Per Capita Median Household Income
Rate
Unemployment Rate
This chart shows the unemployment trend in the area of your search. The unemployment rate is an important driver behind the housing market. Data Source: Bureau of Labor
Suffolk County Massachusett
s USA
Occupational Categories
This chart shows categories of employment within an area

Data Source: U S Census
Update Frequency: Annually
02127
Copyright 2023 Realtors Property Resource® LLC All Rights Reserved Information is not guaranteed Equal Housing Opportunity 9/10/2023
Statistics Update
–$131,198 ––––––––––$47,916 $80,260 2 9% 13 3K 442K 455K $48,617 $89,026 2 8% 106K 3 64M 3 74M $37,638 $69,021 3 6% –––
Frequency: Monthly
Unemployment
Unemployment
Employment
Labor
Massachusetts USA
Number
Number
Force Number
Consultation
Discuss needs, timeline and any updates/repairs that need to be completed prior to listing
This timeline is a quick overview of the selling process
If you have any questions, please reach out!
4 3 2
Staging and Prep
Any necessary repairs, staging and cleaning to maximize aesthetics prior to photos/videos/showings
Photos/Videos/Matterport
Professional photos, video walkthrough and 3D Matterport Floorplans
Establish Pricing
Review comparable listings and recent sales together to determine a competitive price you are comfortable with
Offers and Negotiations
We will present all offers and assist you in negotiating the best overall terms possible
6 7 8
Purchase and Sale Agreement
Once you have signed the P&S you are pending closing and you're on your way to closing
Showings and Open Houses
Be as flexible as possible to get as may prospective buyers through your property
5
Listing
Your property will go "LIVE" and be viewable online by prospective buyers
9
Final Details
Start packing and we will communicate deadlines and work through any concerns that may arise
10
Closing
Attend closing, transfer keys and congratulations!
SELLER'S
1 Timeline
Testimonials
Highly recommend as both a buyer and seller's agent - Ilya and his team helped both the purchase and sale of our condo and did a great job in both roles The service was above and beyond and made a normally unpleasant and stressful process as stress free as it could be.
Brian W.
Working with The Rasner Group was a great experience. Ilya was able to guide us through a highly competitive market to find the house of our dreams His advice was invaluable at every step of the process and he was able to connect us with other professionals who were excellent as well. I’m addition to helping us find our ideal new home, Ilya’s guidance enabled us to sell our prior home for more than we ever thought possible Overall, in a volatile market The Rasner Group delivered exceptional service and we would work with Ilya and his team on any future transactions.
~ Kori D
Ilya is delightful He and his team made the stressful and intense process of searching for and buying a home easy and fun. His knowledge and experience in real estate are a great resource whether you're buying or selling a home I could not recommend him enough If we ever decide to move again, we will be going back to Ilya 100%.
Timothy
S
Ilya and his team helped my family find our dream home. Through patience, diligence, and a network of allies Ilya was able to move mountains in navigating the complex process that is buying a home We couldn't be more happy with Ilya's professionalism and guidance in the process. He was never pushy, always offering objective feedback and observations.
~
Dylan S
The Rasner group sets the standard for buying or selling a home in Cambridge Ilya knows the market better than anyone, gives expert advice on price, marketing, repairs, and his team (Kimberly and Kristine) are incredibly effective at coordinating all the pieces together Seeing all of the work they did on my behalf (including physical labor to clear off my balcony!) made it clear that choosing the right partner is essential. Extremely trustworthy, highly respected in the community, and always put my interests first Highest recommendation
~
Max W
CLIENT
