Epidemiology and Economy: Covid-19 at One Year and Beyond Country Study: Japan Raoul Kennedy ABSTRACT Policies to fully reopen economies are contingent upon perceived progress against SARS-CoV-2. This is an excerpt of a year-long Japan study. The analysis also aims to incorporate maxima and tail exposures. Estimates to February 2021 suggest a sustained rise in reported fatalities casting into doubt a thesis of transition into an endemic phase of the virus. A marked drop in daily cases classified as critically ill in the current period is noted. Re-examination of the reporting and/or qualitative aspects of the underlying observations may be warranted. Protecting the elderly and/or the immunocompromised remains paramount; persons aged 60+ comprise 96% of fatalities. Note: The Appendix has been expanded to update the findings to April 2021.
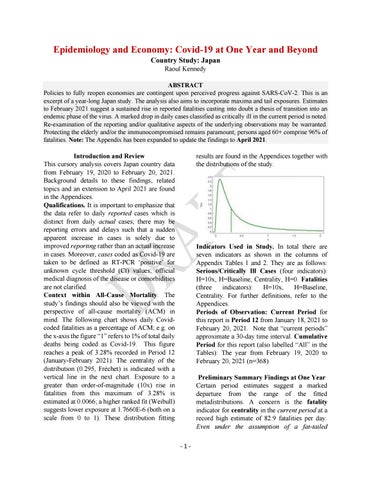
Introduction and Review This cursory analysis covers Japan country data from February 19, 2020 to February 20, 2021. Background details to these findings, related topics and an extension to April 2021 are found in the Appendices. Qualifications. It is important to emphasize that the data refer to daily reported cases which is distinct from daily actual cases; there may be reporting errors and delays such that a sudden apparent increase in cases is solely due to improved reporting rather than an actual increase in cases. Moreover, cases coded as Covid-19 are taken to be defined as RT-PCR ‘positive’ for unknown cycle threshold (Ct) values; official medical diagnosis of the disease or comorbidities are not clarified. Context within All-Cause Mortality. The study’s findings should also be viewed with the perspective of all-cause mortality (ACM) in mind. The following chart shows daily Covidcoded fatalities as a percentage of ACM; e.g. on the x-axis the figure “1” refers to 1% of total daily deaths being coded as Covid-19. This figure reaches a peak of 3.28% recorded in Period 12 (January-February 2021). The centrality of the distribution (0.295, Fréchet) is indicated with a vertical line in the next chart. Exposure to a greater than order-of-magnitude (10x) rise in fatalities from this maximum of 3.28% is estimated at 0.0066; a higher ranked fit (Weibull) suggests lower exposure at 1.7660E-6 (both on a scale from 0 to 1). These distribution fitting
results are found in the Appendices together with the distributions of the study.
Indicators Used in Study. In total there are seven indicators as shown in the columns of Appendix Tables 1 and 2. They are as follows: Serious/Critically Ill Cases (four indicators): H=10x, H=Baseline, Centrality, H=0. Fatalities (three indicators): H=10x, H=Baseline, Centrality. For further definitions, refer to the Appendices. Periods of Observation: Current Period for this report is Period 12 from January 18, 2021 to February 20, 2021. Note that “current periods” approximate a 30-day time interval. Cumulative Period for this report (also labelled “All” in the Tables): The year from February 19, 2020 to February 20, 2021 (n=368). Preliminary Summary Findings at One Year Certain period estimates suggest a marked departure from the range of the fitted metadistributions. A concern is the fatality indicator for centrality in the current period at a record high estimate of 82.9 fatalities per day. Even under the assumption of a fat-tailed -1-