
Topic 2
Motion in One Dimension
QUICK QUIZZES
2.1 (a) 200 yd (b) 0 (c) 0
2.2 (a) False. The car may be slowing down, so that the direction of its acceleration is opposite the direction of its velocity.
(b) True. If the velocity is in the direction chosen as negative, a positive acceleration causes a decrease in speed.
(c) True. For an accelerating particle to stop at all, the velocity and acceleration must have opposite signs, so that the speed is decreasing.
If this is the case, the particle will eventually come to rest. If the acceleration remains constant, however, the particle must begin to move again, opposite to the direction of its original velocity. If the particle comes to rest and then stays at rest, the acceleration has become zero at the moment the motion stops. This is the case for a braking car the acceleration is negative and goes to zero as the car comes to rest.
2.3 The velocity-vs-time graph (a) has a constant slope, indicating a constant acceleration, which is represented by the acceleration-vs.-time graph (e).
Graph (b) represents an object whose speed always increases, and does so at an ever-increasing rate. Thus, the acceleration must be increasing, and the acceleration-vs-time graph that best indicates this behaviour is (d).
Graph (c) depicts an object which first has a velocity that increases at a constant rate, which means that the object’s acceleration is constant. The motion then changes to one at constant speed, indicating that the acceleration of the object becomes zero. Thus, the best match to this situation is graph (f).
2.4 Choice (b). According to graph b, there are some instants in time when the object is simultaneously at two different x-coordinates. This is physically impossible.
2.5 (a) The blue graph of Figure 2.14b best shows the puck’s position as a function of time. As seen in Figure 2.14a, the distance the puck has traveled grows at an increasing rate for approximately three time intervals, grows at a steady rate for about four time intervals, and then grows at a diminishing rate for the last two intervals.
(b) The red graph of Figure 2.14c best illustrates the speed (distance
traveled per time interval) of the puck as a function of time. It shows the puck gaining speed for approximately three time intervals, moving at constant speed for about four time intervals, then slowing to rest during the last two intervals.
(c) The green graph of Figure 2.14d best shows the puck’s acceleration as a function of time. The puck gains velocity (positive acceleration) for approximately three time intervals, moves at constant velocity (zero acceleration) for about four time intervals, and then loses velocity (negative acceleration) for roughly the last two time intervals.
2.6 Choice (e). The acceleration of the ball remains constant while it is in the air. The magnitude of its acceleration is the free-fall acceleration, g = 9.80 m/s2.
2.7 Choice (c). As it travels upward, its speed decreases by 9.80 m/s during each second of its motion. When it reaches the peak of its motion, its speed becomes zero. As the ball moves downward, its speed increases by 9.80 m/s each second.
2.8 Choices (a) and (f). The first jumper will always be moving with a higher velocity than the second. Thus, in a given time interval, the first jumper covers more distance than the second, and the separation distance
between them increases. At any given instant of time, the velocities of the jumpers are definitely different, because one had a head start. In a time interval after this instant, however, each jumper increases his or her velocity by the same amount, because they have the same acceleration. Thus, the difference in velocities stays the same.
ANSWERS TO EVEN NUMBERED CONCEPTUAL QUESTIONS
2.2 Yes. The particle may stop at some instant, but still have an acceleration, as when a ball thrown straight up reaches its maximum height.
2.4 (a) No. They can be used only when the acceleration is constant.
(b) Yes. Zero is a constant.
2.6 (a) In Figure (c), the images are farther apart for each successive time interval. The object is moving toward the right and speeding up. This means that the acceleration is positive in Figure (c).
(b) In Figure (a), the first four images show an increasing distance traveled each time interval and therefore a positive acceleration. However, after the fourth image, the spacing is decreasing, showing that the object is now slowing down (or has negative acceleration).
(c) In Figure (b), the images are equally spaced, showing that the object moved the same distance in each time interval. Hence, the velocity is constant in Figure (b).
2.8 (a) At the maximum height, the ball is momentarily at rest (i.e., has zero velocity). The acceleration remains constant, with magnitude equal to the free-fall acceleration g and directed downward. Thus, even though the velocity is momentarily zero, it continues to change, and the ball will begin to gain speed in the downward direction.
(b) The acceleration of the ball remains constant in magnitude and direction throughout the ball’s free flight, from the instant it leaves the hand until the instant just before it strikes the ground. The acceleration is directed downward and has a magnitude equal to the freefall acceleration g.
2.10 Once the ball has left the thrower's hand, it is a freely falling body with a constant, nonzero, acceleration of a = g. Since the acceleration of the ball is not zero at any point on its trajectory, choices (a) through (d) are all false and the correct response is (e).
2.12 The initial velocity of the car is v0 = 0 and the velocity at the time t is v.
The constant acceleration is therefore given by
and the average velocity of the car is
In the special case where a = 0 (and hence v = v0 = 0), we see that statements (a), (b), (c), and (d) are all correct. However, in the general case (a ≠ 0, and hence v ≠ 0) only statements (b) and (c) are true. Statement (e) is not true in either case.
2.1 We assume that you are approximately 2 m tall and that the nerve impulse travels at uniform speed. The elapsed time is then
the distance light travels in
Comparing the result of part (a) to the diameter of the Earth, DE, we find
2.3 Distances traveled between pairs of cities are
Δx1 = v1(Δt1) = (80.0 km/h)(0.500 h) = 40.0 km
Δx2 = v2(Δt2) = (100.0 km/h)(0.200 h) = 20.0 km
Δx3 = v3(Δt3) = (40.0 km/h)(0.750 h) = 30.0 km
Thus, the total distance traveled is Δx = (40.0 + 20.0 + 30.0) km = 90.0 km, and the elapsed time is Δt = 0.500 h + 0.200 h + 0.750 h + 0.250 h = 1.70 h
(a) v = Δx Δt = 90.0 km 1.70 h = 52.9 km /h
(b) Δx = 90.0 km (see above)
2.4 (a) The player runs 100 yards from his own goal line to the opposing team’s goal line. Then he runs an additional 50 yards back to the fiftyyard line, all in 18.0 s. Substitute values into the definition of average speed to find
Average speed = path length elapsed time = 100 yards + 50 yards 18.0 s = 8.33 yards/s
(b) After returning to the fifty-yard line, the player’s displacement is Δx = xf xi = 50.0 yards 0 yards = 50.0 yards. Substitute values into the definition of average velocity to find
© 2018 Cengage Learning. All Rights Reserved. May not be scanned, copied or duplicated, or posted to a publicly accessible website, in whole or in part.
yards/s
2.5
(a) Boat A requires 1.0 h to cross the lake and 1.0 h to return, total time
2.0 h. Boat B requires 2.0 h to cross the lake at which time the race is over. Boat A wins, being 60 km ahead of B when the race ends.
(b) Average velocity is the net displacement of the boat divided by the total elapsed time. The winning boat is back where it started, its displacement thus being zero, yielding an average velocity of zero .
2.6 The average velocity over any time interval is

2.9 The plane starts from rest (v0 = 0) and maintains a constant acceleration of a = +1.3 m/s2. Thus, we find the distance it will travel before reaching the required takeoff speed (v = 75 m/s), from
Since this distance is less than the length of the runway, the plane takes off safely.
2.10 (a) The time for a car to make the trip is t =
. Thus, the difference in the times for the two cars to complete the same 10 mile trip is
(b) When the faster car has a 15.0 min lead, it is ahead by a distance equal to that traveled by the slower car in a time of 15.0 min. This distance is given by Δx1 = v1(Δt) = (55 mi/h)(15 min)
The faster car pulls ahead of the slower car at a rate of
Thus, the time required for it to get distance Δx1 ahead is
Finally, the distance the faster car has traveled during this time is
after starting from rest is
2.14
(a) At the end of the race, the tortoise has been moving for time t and the hare for a time t 2.0 min = t 120 s. The speed of the tortoise is vi = 0.100 m/s, and the speed of the hare is vh = 20 vt = 2.0 m/s. The tortoise travels distance xt, which is 0.20 m larger than the distance xh traveled by the hare. Hence, xt = xh + 0.20 m
which becomes vtt = vh(t 120 s) + 0.20 m
or (0.100 m/s)t = (2.0 m/s)(t 120 s) + 0.20 m
This gives the time of the race as t = 1.30 × 10² s
(b) xt = vtt = (0.100 m/s)(1.3 × 102 s) = 13 m
2.15 The maximum allowed time to complete the trip is
The time spent in the first half of the trip is
Thus, the maximum time that can be spent on the second half of the trip is
© 2018 Cengage Learning. All Rights Reserved. May not be scanned, copied or duplicated, or posted to a publicly accessible website, in whole or in part.
s = 10.5
and the required average speed on the second half is
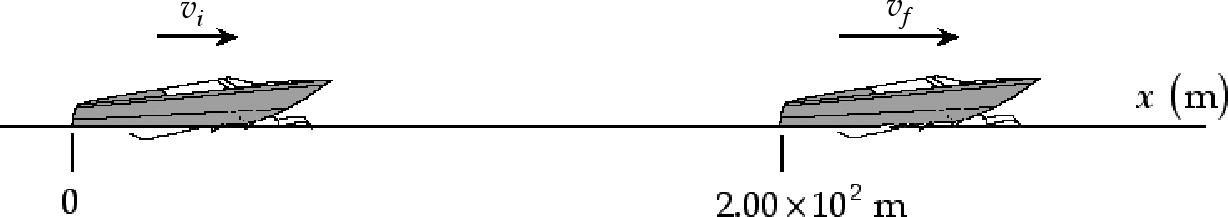
2.16 (a) From the first kinematic equation with v0 = 0, t = 7.00 × 10⁻⁷ s, and a = 5.30 × 10⁷ m/s2, the maximum speed is v
2.17 The instantaneous velocity at any time is the slope of the x vs. t graph at that time. We compute this slope by using two points on a straight segment of the curve, one point on each side of the point of interest.
(b) We will use a 0.400 s interval centered at t = 400 s. We find at t = 3.80 s, x = 60.2 m and at t = 4.20 s, x = 76.6 m. Therefore,
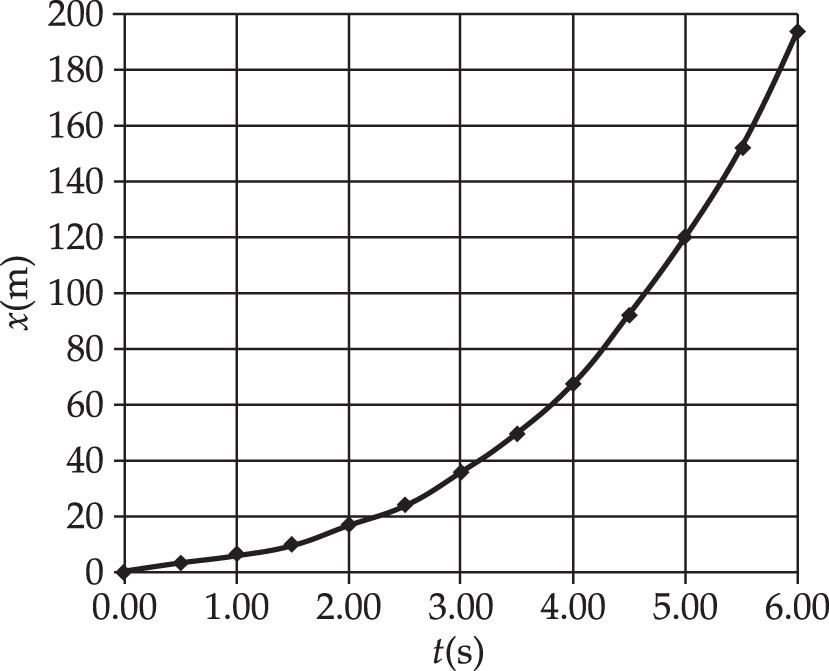
Using a time interval of 0.200 s, we find the corresponding values to be: at t = 3.90 s, x = 64.0 m and at t = 4.10 s, x = 72.2 m. Thus,
=
For a time interval of 0.100 s, the values are: at t = 3.95 s, x = 66.0 m, and at
=
s, x = 70.1 m. Therefore,
(c) At t = 4.00 s, x = 68.0 m. Thus, for the first 4.00 s,
© 2018 Cengage Learning. All Rights Reserved. May not be scanned, copied or duplicated, or posted to a publicly accessible website, in whole or in part.