Ongoing progress in the restoration of Manchester Town Hall
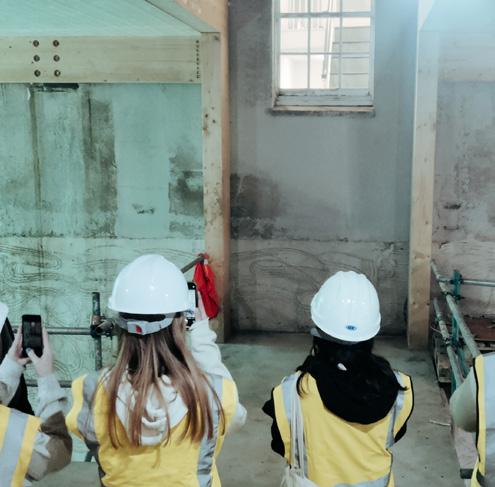
Cover image: Repairing the mosaic floor at the National Portrait Gallery
Recognising the hard work of our teams at the Practice Day Out, Nevill Holt Hall, June 2024
AT A GLANCE
Throughout 2024 we continued to advocate for positive action across all regions. Building on our expertise of facilitating sensitive change in the historic built environment, we were at the forefront of discussions around heritage retrofit and adaptive reuse. 2024 saw the official launch of our Heritage Building Retrofit Toolkit , an open-source guide to reducing carbon emissions and building climate resilience in heritage buildings. In addition, we coauthored Historic England’s Handbook in Energy Efficiency Measures for Older and Traditional Buildings aimed at upskilling readers on the risks and opportunities of heritage retrofit.
Whilst we didn’t see the continued year-on-year reduction in emissions relating to our own operations, our commitment to carbon reduction targets remains a priority, and we made good progress towards B Corp Certification throughout 2024. Aligned with this, we joined Article 25’s More Than a Building initiative to help address the challenges faced by underserved regions around the world.
On our projects, we continued to champion building and material reuse as the industry-wide drive towards a more circular economy gained momentum. Many of our clients are leading the way with their own ambitious net-zero targets, and our unique expertise of finding solutions to complex problems within heritage estates has enabled us to help many on their decarbonisation journey.
We logged 410 days of social value activities from skills development to pro-bono services.
We established our Justice, Equity, Diversity and Inclusion (JEDI) Steering Group.
We improved our understanding of our projects through design and post occupancy.
We started our journey to B Corp certification collating and submitting evidence.
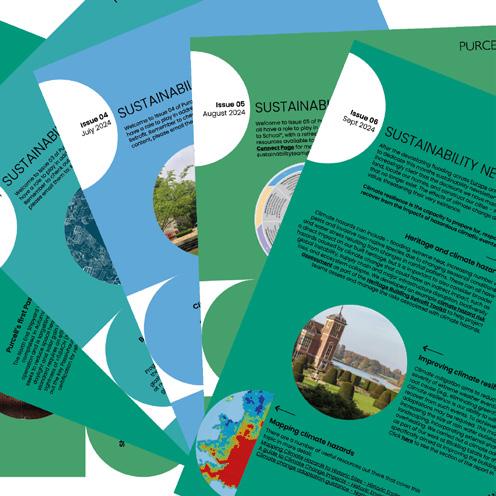
We carried out our third climate literacy survey and launched our Sustainability Newsletter.
We continued to help our clients on their decarbonisation and retrofit journeys.
We contributed to resources on heritage retrofit, sharing solutions to climate resilience.
We were named a frontrunner practice in the first Regenerative Architecture Index.
OUR COMMITMENTS
We recognise that we are operating in a climate emergency. Without a thriving planet, we will not have a functioning business.
Purcell is an organisation that demonstrably balances purpose and profit. We continue to be a practice that drives our business as a force for good amongst the places and communities we work. We have a responsibility to influence the built environment and to make a positive contribution to society.
Our Collective Ambition sets out our evolutionary journey and reaffirms our commitment to embrace sustainability in its many forms. We engage with clients and communities to design influential projects which creatively confront challenges of social and environmental responsibility.
Our first Carbon Governance Strategy was published in 2010, then updated in 2019 setting a clear target to half our operational emissions (from our 2019 total) by 2030. In 2020, we committed to the declarations set out by Architects Declare and Heritage Declares, recognising the greatest impact we have is through our projects. At the same time, we became signatories of the RIBA 2030 Climate Challenge and
have been working hard towards meeting these commitments since. We aspire to be renowned as global leaders in enabling positive social change through our projects and practice, and advocate for regenerative principles across projects.
This report reflects on our 18th annual carbon footprint assessment as we continuously strive to improve our working practices, our project impacts, and how we assess and report our impacts. We know we have a long way to go, and there is lots more we can be doing. Each year we gain a better understanding of what works and what doesn’t, sharing our lessons and holding ourselves accountable.
OUR ACTION ROUTEMAP
OUR FOOTPRINT
Purcell has been calculating the carbon emissions associated with our business operations since 2007, and our understanding of the carbon impact of our work has been growing ever since.
After a significant decrease in our operational footprint in 2023, last year saw an unfortunate reversal in that trend, with an overall increase in emissions across all areas, the greatest shown in travel emissions, particularly air travel.
Whilst disappointing, this must be viewed within the context of our continued strong business growth and growing international presence. Our total operational footprint was still down 40% from our benchmark year, and our commitment to achieving a target of halving our emissions (from our 2019 total) by 2030 remains achievable.
The 2024 analysis, provided in more detail within the ‘Extras’ section of this report, highlights the need for us all to take greater responsibility in understanding and reducing our collective impact. We must all make decisions that seek to balance the needs of the business, against the needs of the planet, because without a thriving planet, we won’t have a functioning business.
With this in mind, we are putting clear actions in place for 2025 to respond to the main areas of increase and ensure we get back on track.
Key figures from our 2024 carbon footprint are summarised here and on page 11, with the full report included from page 22
includes emissions within Purcell’s direct control (business travel, waste disposal, water and paper
STAFFCOMMUTING ENERGYEMISSION
HOW OUR FOOTPRINT IS BROKEN DOWN
Review and update our sustainable business travel policy and consider more rigorous enforcement of targets.
Develop an energy efficiency and decarbonisation strategy for each studio and map actions against our near term and long-term carbon reduction targets.
Implement ‘quick win’ energy efficiency measures in each studio, including a management plan that includes regular checks of thermostats, programme settings and power down procedures.
Engage landlords in discussions about the strategy, particularly highlighting need for suitable submetering and energy efficiency improvements.
The Heritage Building Retrofit Toolkit was launched at the Merchant Taylors Livery Hall in March 2024. This collaboration with the City of London Corporation aims to faclitate climate action within the Square Mile’s heritage buildings.
Based on extensive engagement, the open-source digital toolkit provides a nine-step methodology aimed at empowering building owners to initiate the adaptations necessary to reduce carbon emissions and build climate resilience in their heritage buildings. The work has been followed by numerous conversations and collaborations with policy makers to establish different mechanisms for enabling the sensitive adaptation of our built heritage to respond to our changing climate.
EMBEDDING LONG-TERM THINKING
For 77 years Purcell’s approach has been one of creative custodianship - learning from the rich history of the buildings we work with and innovatively imagining ways to ensure their long-term enjoyment, accessibility and funcitonality for future generations. In other words, understanding the past in order to project forward into the future in the most positive way. Never has this approach been more relevant.
2024 saw an increased focus on how learning from our past can better prepare us for our future, with a focus on building climate resilience, eliminating fossil fuel use and making better use of the resources we already have. A small selection from the year are shown here.
Winchester Cathedral dates back to the 11th century. Today, after countless changes –both to its own fabric and the world around it – the cathedral remains an icon for people visiting from across the globe. In 2024, we completed a masterplan for the precinct which included a sustainability strategy aligned with the aspiration to decarbonise the estate over the coming decade.
National Portrait Gallery was shortlisted for the Stirling Prize in 2024. Building on this success, Purcell was part of a team putting together an application for funding to decarbonise the whole estate through the Public Sector Decarbonisation Fund. Our study looked at opportunities to improve the energy efficiency of the existing fabric in order to reduce energy demand. Proposals sought to minimise disruption to the day-today opperations.
Hull Maritime Museum is part of a citywide cultural regeneration and placemaking project to reconnect Hull to its prevalent maritime history. The project is safeguarding Hull’s maritime history and our interventions are helping Hull City Council reach their 2030 Carbon Neutral aspirations. This includes the construction of a new Passivhaus visitor centre to sit alongside the historic shipyard. Construction got underway in 2024, with completion set for 2025.
Hong Kong Cricket Club Gap Pavilion is being sensitively adapted to prolong the usable life of the building and ensure it is enjoyed for years to come. The brief aimed to preserve and enhance the pavilion’s functionality by enclosing it to create a controlled interior environment, giving the space a new lease of life, whilst making it more comfortable and energy efficient. Solar panels were installed on the roof to maximise onsite energy generation.
Queen Mary University Mile End Library was completed in 2024. We carried out a detailed post-occupancy evaluation, drawing from the experiences of the design team and the various building user groups. We identified a number of positive lessons that can be taken forward into future projects, sharing these across the team. The project cleverly utilised the existing library structure to extend upwards, providing 500 additional study spaces with minimal environmental impact.
The refurbishment of the Grade II listed Camden Town Hall for the London Borough of Camden takes a holistic view of retrofit. The project reimagines this culturally important building to bring about significant environmental, economic and social benefits to the borough and local area.
By retaining the building’s civic functions and incorporating new uses like small to medium enterprise work spaces, and event rooms, the refurbishment ensures the buildings long-term viability. Coupled with a whole building approach to energy efficiency - which incorporates measures to eliminate fossil fuels, reduce energy use and build climate resilience - the building is now future-proofed and ready to be enjoyed for the next 100 years.
Bridewell Magistrates’ Court in Bristol fell into disrepair and was left vacant for 20 years. It is now being transformed by The Creative Youth Network, a registered charity based in Bristol and South Gloucestershire that helps young people from marginalised and diverse backgrounds to reach their potential. Led by Purcell, Phase 1 of the project completed in May 2024, turning the former court building into a creative enterprise hub for young people.
Purcell prioritised youth engagement by continuously involving the young people the charity works with in the design process, with the aim of creating spaces that truly reflect their cultural and social identities while preserving the building’s heritage.
Our commitment to developing the skills and expertise of our staff continued with our annual Conservation School , first established in 2016, and hosted this year in Canterbury Cathedral. The school ensures that Purcell’s legacy of conservation and design expertise continues into the next generation of architects and heritage consultants.
In addition, our Design Programme, now in it’s seventh year was hosted at Hooke Park. Learning was focused around sustainable uses of timber, offering an opportunity to learn, share ideas, collaborate and innovate without the constraints of a live project.
412 DAYS OF SOCIAL VALUE
In 2024, we set up our Social Value Steering Group.
Aided by a network of Social Value Champions, we have been recording our broader impact across our work. Our recording methodologies are in the process of being refined as part of our commitment to B Corp certification, and we continue to strive to ensure our data is accurately captured and reported. In addition, we are working to develop more robust guidance and policies to help us deliver more impactful social value.
We logged 412 days of social value activities in 2024. These range from pro-bono services to charitable organisations, hosting work experience students, offering career support to young people, and advocating for climate action in the built environment. A few examples are described here.
192 hours delivering careers training and advice to students
Including mentoring, career advice, work placements, site tours and practical training opportunities.
278 hours of climate advocacy
In addition to the launch of our Heritage Building Retrofit Toolkit in collaboration with the City of London, we hosted several events focused on discussing solutions to climate change in heritage buildings in Cambridge and Manchester, and how to maximise social value in Oxford. We also contributed to policy discussions and campaigned for faster action across the industry.
£167,241 in pro-bono services
Including donations of time and expertise by Purcell staff to heritage groups like the Cathedral Fabric Commission for England, Enfield Society Heritage and Conservation Group, and the Diocese of Chelmsford Advisory Committee. As well as working with climate action groups like Architects Declare and LETI to upskill the built environment sector.
£12,811 donated to charitable causes
Including donations to CRASH Christmas appeal, Article 25, Indigenous Literacy Foundation in Australia, and Love21 in Hong Kong. A cash donation was made to UK Architects Declare, and £1,208 was raised for the Neville Holt Charity at our Practice Day Out. We also hosted charity events in Oxford and Bristol.
Under the hood at Manchester Town Hall
After the significant decrease in our total footprint in 2023, this year has seen a reversal in trend. This must be viewed within the context of our continued strong business growth. However, staff numbers increased by 11% whilst the operations footprint per FTE increased by 15%. All major footprint components have increased, but the biggest increase is from travel emissions, arising mainly from an 98% increase in air miles travelled.
Carbon Governanace Strategy Target/Performance
1,000 1,500 2,000 2,500 3,000 3,500
differ from the annual footprint total. 02 This is our main measure of our footprint performance and excludes the footprint components that are outside of Purcell’s direct control, ie. commuting and homeworking. These components are included on the Overall Footprint analyses (adjacent). 03 Net footprint excludes international air travel
OVERALL CARBON FOOTPRINT (tonnesCO2e) (Operations Footprint plus Commuting and Homeworking)
OUR ROUTE TO 2030
ACTIONS TO-DATE
ENERGY (SCOPES 1-3)
• Energy efficient studio relocations: Bristol, Cambridge, London, Norwich, Oxford & York
• Upgraded heating systems. New boiler in Canterbury in late 2022. 2023 saving = 0.7 tCO2e pa
• Migrated from office to cloud-based servers
• Energy efficiency awareness raising across all studios
• Overall reduction in energy use per m2 of 45% since 2007
OTHER SCOPE 3
• Hotel Stays: Measured for first time in 2023, emissions in 2024 = 8.1 tCO2eq
• Paper use: down 93% through electronic document management & employee commitment
• Waste: <1% of footprint.
• Water use previously monitored (<1%) but only data from 3 offices available
• Energy & Travel WTT emissions are included in Energy/Travel (above)
TRAVEL (SCOPES 3)
• Reduction in private car use from 64% to 29% (was lower pre-pandemic & is reducing).
• Reduced average business miles per FTE from around 4,000 to consistently less than 2,000 pa
• Investment in video conferencing and remote working technology
• Emphasis on minimising non-essential travel (especially for internal meetings)
The following Scope 3 items have been evaluated but are not included within the Operations Footprint. These are primarily controlled by the lifestyle demands and decisions of our staff.
COMMUTING
• Originally measured from 2007 to 2012. Staff survey re-commenced from 2022.
• Average commute per FTE -21% on 2012
• Commuting distance & emission are marginally increased on 2023
• Compared with 2012, the use of private cars for commuting has decreased by 21% & walk/bike is +75%
HOMEWORKING
• Data from the commuting survey is used to estimate average homeworking time (1.18 days)
• Estimated homeworking emissions = 40.3 tCO2e (+38% on 2023)
OUR ACTIONS FOR THE FUTURE
ENERGY (SCOPES 1-3)
• Our ‘Route to 2030’ target for 2024 requires average energy emissions of 31 kgCO2e/m2. The actual emissions were 33 kgCO2e/m2, so this target was not met in 2024 (for the first time since it was set)
• The planned reductions in energy emissions will require the conversion factors for calculating emissions to continue reducing overall as the associated energy generation infrastructure becomes more carbon efficient. This is beyond our control but the following actions can be applied by the practice to promote future energy use reductions
• Instigate a process to ensure that studios carry-out regular checks of their heating system settings to ensure that the settings used are efficient and that any temporary changes are reversed. Specific checks should be made in the Canterbury and Oxford studios, which had the greatest increases in 2024
• Well in advance of lease renewals, review the energy efficiency potential of all properties, to assess whether the properties would be able to achieve energy efficiency improvements, or whether relocation would be the only option to provide improved energy efficiency. Have discussions with the landlords to determine their commitment to energy improvement for the properties (or risk losing Purcell as a tenant)
• Review the options to obtain more direct information from landlords in shared properties to improve the accuracy of the estimated elements of our energy use. 40% of our total energy use is based on estimated data because the landlords are not providing the raw data. The following offices do not provide the raw data: Bristol, Cambridge, Edinburgh, Manchester and all Asia-Pacific offices. If the total energy usage is known for a building, the proportion for Purcell’s occupancy can be used in our calculations
• Achieve the target of a minimum EPC standard of C for all UK studios by 2030. This is linked to the previous two points. If energy efficiency improvements and/or raw energy data are not feasible, office relocations will be needed to meet this target and the overall target for carbon footprint reductions
TRAVEL (SCOPE 3)
TRAVEL (SCOPE 3)
• Monitor the ongoing travel performance against target and consider any future reduction as appropriate. Consider more rigorous enforcement of the target of at least 75% of travel being for projects, to minimise non-essential travel
• Encourage/incentivise use of EVs for business travel. Only four individuals declared business travel by EV through staff expenses in 2024 and only seven out of 255 car hires were for EVs
The following Scope 3 items have been evaluated but are not included within the Operations Footprint. These are primarily controlled by the lifestyle demands and decisions of our staff.
COMMUTING
• Review options for incentivising efficient methods of commuting
• Work with landlords to have end-of-trip facilities installed in all studios
• Communicate commuting findings and promote awareness
• Work with landlords to get water meters installed in studios
• Review options for measuring other Scope 3 components: Other Goods & Services, Investments. Estimation of Data Storage emissions has been considered but there is insufficient data
OTHER SCOPE 3
OTHER SCOPE 3
COMMUTING & HOME WORKING
BUSINESS TRAVEL
• Total business miles increased by 23% in 2024, whilst our turnover increased by almost 29%.
• On a per FTE basis, the miles travelled was up 11% on last year.
• However, net miles per FTE (excluding international air travel) were down by almost 2%. The differing performance on the total and net distances is attributable to a 98% increase in international air travel from last year, arising from a significantly increased travel pattern in Asia-Pacific.
• The total number of trips in 2024 was up by 13%, but this was only an increase of 2% on a per FTE basis. The average trip distance was up by 9%.
• The miles travelled by all regions was below the target of 3,000 miles per FTE. However, only Asia-Pacific exceeded the 75% target for the proportion of travel that was for project work.
• Due to the increased business mileage and the high level of international air travel, total emissions from business travel increased by 35%.
• An 8% reduction in car mileage means we are now back within our target of 30% overall mileage in private cars, although we are still above the level that was being achieved pre-pandemic.
Business Miles
Turnover % of Business Miles Charged to Projects (excluding Group Travel & INternational Flights)
SCOPE 3 EMISSIONS | WITHIN PURCELL’S CONTROL
• Total paper use was up by 67% in 2024. The increase on a per FTE basis was 50%. Although the impact on our total footprint is small, this is the first significant increase in paper use per FTE since 2012.
• Emissions from paper use are 0.78 tCO2e (0.2% of Gross Footprint).
• The relative level of paper use compared to 2007 is -93%.
• There were 780 hotel nights recorded in the year, which equates to 8.1 tCO2eq (2.1% of Total Footprint).
• The calculated emissions from all forms of waste in 2024 were 5.3 tCO2eq (1.4% of Total Footprint). There was an increased level of detail made available within the waste records this year, with more waste collectors providing numerical amounts on the Waste Transfer Notes than in previous years.
• Water use has not been measured in 2024 as only four studios have water meters fitted. Historical data has shown Purcell’s water use to be low and not of significance to the total footprint.
• Commentary on the Scope 3 WTT emissions is covered by the Energy & Business Travel sections above.
3 EMISSIONS | OUTSIDE OF PURCELL’S CONTROL
• For the staff commuting survey in 2024 there were 263 valid responses, which is 87% of the year-end staff headcount. This is a significant improvement on 2023.
• Staff commuting mileage was estimated to be around 1,037,000 miles pa. This is an average of about 3,565 miles pa for every employee; equivalent to a 15-mile daily round trip. There was no significant change from last year.
• The estimated emissions from commuting are 116 tCO2e, or 0.40 tCO2e per FTE (+1% on last year). NB. This total is not included in the Operations Footprint total.
• Commuting by car was increased from 28% of miles to 30% of the commuting mileage. The proportion of car mileage in electric/hybrid cars increased from only 2% in 2023, to 15% in 2024. However, this was offset by an increase in the use of large cars (19% of miles vs. 7% in 2023).
• Analysis of the number of days that people commute into the office indicates an average of 1.2 days per week homeworking. This gives an estimate of 40.3 tCO2e emissions from home working, or 0.14 tCO2e per FTE. NB. This total is not included in the Operations Footprint total.
Commuting Travel Mode
ANNEXES
ANNEXES
ENERGY USE
Heating Energy & Temperature
Overall energy use was up in 2024. Whilst the strong increase in staff numbers would generate some demand for additional electricity use, the increase in gas use (notably in Canterbury and Oxford) was not supported by an equivalent increase in HDD
Overall energy use was up in 2024. Whilst the strong increase in staff numbers would generate some demand for additional electricity use, the increase in gas use (notably in Canterbury and Oxford) was not supported by an equivalent increase in HDD
East
A S T
The overall energy performance for the East region looks consistent but this is masking the anomaly over the Norwich studio energy efficiency (see page 34).
E A S T
London & SE
The overall energy performance for the East region looks consistent but
ef ciency (see below).
There is no heating data for London, so that chart is for Canterbury only. The upturn in gas use in Canterbury is not in-line with the HDD data.
L O ND O N & S E
&
Overall energy use was up in 2024. Whilst the strong increase in staff numbers would generate some demand for additional electricity use, the increase in gas use (notably in Canterbury and Oxford) was not supported by an equivalent increase in HDD
The overall energy performance for the East region looks consistent but this is masking the anomaly over the Norwich studio energy ef ciency (see below).
E A S T
Power & FTE
L O ND O N & S E
The overall energy performance for the East region looks consistent but this is masking the anomaly over the Norwich studio energy ef ciency (see below).
L O ND O N & S E
There is no heating data for London, so that chart is for Canterbury only. The HDD data.
N O R T H
Overall energy use was up in 2024. Whilst the strong increase in staff numbers would generate some demand for additional electricity use, the increase in gas use (notably in Canterbury and Oxford) was not supported by an equivalent increase in heating degree day (HDD) (a measurement designed to quantify the demand for energy needed to heat a building).
The overall energy performance for the East region looks consistent but this is masking the anomaly over the Norwich studio energy ef ciency (see below).
O ND O N & S E
There is no heating data for London, so that chart is for Canterbury only. The upturn in gas use in Canterbury is not in-line with the HDD data.
N O R T H
There is no heating data for London, so that chart is for Canterbury only. The upturn in gas use in Canterbury is not in-line with the HDD data. N O R T H
The new Edinburgh studio has been added to the Region in 2024 however all use for the new York studio is signi cantly improved on the old location, ther the metering of the overall building has been found not to be as originally
Furthermore, all data for the Manchester of ce is estimated, therefore the
NB. In the charts above, the FTE numbers are based on the number of staff who are based within the studios. This includes Group & Central staff who are based in the studios, but excludes staff based in the Manchester Town Hall and Palace of Westminster locations.
There is no heating data for London, so that chart is for Canterbury only. The upturn in gas use in Canterbury is not in-line with the HDD data
The new Edinburgh studio has been added to the Region in 2024 however all energy use data is estimated. Although total energy use for the new York studio is signi cantly improved on the old location, there is signi cant uncertainty on the accuracy of the data as the metering of the overall building has been found not to be as originally expected. Work is ongoing to resolve this issue.
Furthermore, all data for the Manchester of ce is estimated, therefore the accuracy of the whole North region’s data is poor.
The new Edinburgh studio has been added to the Region in 2024 however all energy use data is estimated. Although total energy use
Electrical
North
ks consistent but this is masking the anomaly over the Norwich studio energy
West
Bristol
The new Edinburgh studio has been added to the region in 2024, however all energy use data is estimated. Although total energy use for the new York studio is significantly improved on the old location, there is significant uncertainty on the accuracy of the data as the metering of the overall building has been found not to be as originally expected. Work is ongoing to resolve this issue. Furthermore, all data for the Manchester office is estimated, therefore the accuracy of the whole North region’s data is poor.
The data appears to show good energy management performance.
There is no heating data for London, so that chart is for Canterbury only. The upturn in gas use in Canterbury is not in-line with the HDD data.
N O R T H
r Canterbury only. The upturn in gas use in Canterbury is not in-line with the
The data appears to show good energy management performance.
The data appears to show good
Heating data is estimated and has not been updated since 2019 but is consistent with the HDD data. The small increase in electrical power use (equipment and lighting) is not directly supported by increased staffing.
management performance
r i s t o l
The data appears to show good energy management performance.
The new Edinburgh studio has been added to the Region in 2024 however all energy use data is estimated. Although total energy use for the new York studio is signi cantly improved on the old location there is signi cant uncertainty on the accuracy of the data as the metering of the overall building has been found not to be as originally expected Work is ongoing to resolve this issue Furthermore, all data for the Manchester of ce is estimated, therefore the accuracy of the whole North region’s data is poor.
The data appears to show good energy management performance.
l
on in 2024 however all energy use data is estimated. Although total energy n the old location, there is signi cant uncertainty on the accuracy of the data as to be as originally expected. Work is ongoing to resolve this issue. ated, therefore the accuracy of the whole North region s data is poor.
Heating data is estimated and has not been updated since 201 power use (equipment & lighting) is not directly supported by
C
m b r i d g e
Heating data is estimated and has not been updated since 2019 but is consistent with the HDD data. The small increase in electrical power use (equipment & lighting) is not directly supported by increased staf ng.
Heating data is estimated and has not been updated since 2019 but is consistent with the HDD data. The small increase in electrical
is not
supported by increased
No data has been received from the landlord’s agents for gas use since 2013 the FTE level. C a n t e r b u r y
Heating data is estimated and has not been updated since 2019 but is consistent with the HDD data. The small increase in electrical power use (equipment & lighting) is not directly supported by increased staf
No data has been received from the landlord’s agents for gas use since 2013 Electrical power usage is consistent with the FTE level
No data has been received from the landlord’s agents for gas use since 2013 Electrical power usage is consistent with the FTE level
2023 was the rst full year after the studio’s boiler was replaced and
However, there has been an upturn in gas use in 2024 that is not supported by t consistent with the FTE level.
London
No data is available on heating energy, but this is understood to be low due to the adiabatic nature of the studios heating/cooling system. Total energy use is consistent with staff numbers and is the lowest per m2 of all studios.
L o n do n
Manchester
No data is available for the Manchester office. Estimated usage is included in the overall footprint but variations in energy efficiency cannot be identified from these estimates.
Norwich
No data is available on heating energy, but this is under stood to be low d heating/cooling system. Total energy use is consistent with staff numbers
No data is available for the Manchester of ce. Estimated usage is included ef ciency cannot be identi ed from these estimate s
Energy use in Norwich is consistent with the relevant indicators and has been consistent since the relocation, however, the total energy use not consistent with the improved EPC rating of the new studio (C vs. E). The landlord is providing a full set of energy bills each year and the only estimate that is used in the analysis is the proportion of total usage that is relevant to Purcell’s occupancy (and is considered correct).
No data is available on heating energy, but this is under stood to be low due to the adiabatic nature of the stu dios heating/cooling system. Total energy use is consistent with staff numbers and is the lowest per m2 of all stu dios. M a n c h e
No data is available for the Manchester of ce. Estimated usage is included in the overall footprint but variations in energy ef ciency cannot be identi ed from these estimate s.
No data is available on heating energy, but this is under stood to be low due to the adiabatic nature of the stu dios heating/cooling system. Total energy use is consistent with staff numbers and is the lowest per m2 of all stu dios.
M a n c h e s t e r
No data is available for the Manchester of ce. Estimated usage is included in the overall footprint but variations in energy ef ciency cannot be identi ed from these estimate s.
Energy use in Norwich is consistent with the relevant indicators and has b total energy use not consistent with the improved EPC rating of the new set of energy bills each year an d the only estimate that is use d in the
relevant to Purcell’s occupancy (and is con sidered correct).
Energy use in Norwich is consistent with the relevant indicators and has been consistent since the relocation, however, the total energy use not consistent with the improved EPC rating of the new studio ( C vs E) The landlord is providin g a full set of energy bills each year an d the only estimate that is use d in the analysi s is the proporti on of total usage th at is relevant to Purcell’s occupancy (and is con sidered correct)
Energy use in Norwich is consistent with the relevant indicators and has been consistent since the relocation, however, the total energy use not consistent with the improved EPC rating of the new studio ( C vs E) The landlord is providin g a full set of energy bills each year an d the only estimate that is use d in the analysi s is the proporti
relevant to Purcell’s
(and is con sidered correct)
s
Oxford
stimated usage is included in the overall footprint but variations in energy ate s.
The upturn is gas use is not consistent with the HDD data.
York
Asia Pacific
The upturn is gas use i s not consistent with the HDD data
The York studio relocated at the end of 2022 and is now in an all-electric building. No data is available to assess heating/ power use separately. Total energy use is down due to the improved energy efficiency of the new location but the actual energy use by Purcell is currently under review as the building metering is not consistent with expectations.
Energy use in Norwich is consistent with the relevant indicators and has been consistent since the relocation, however, the total energy use not consistent with the improved EPC rating of the new studio ( C vs. E). The landlord is providin g a full set of energy bills each year an d the only estimate that is use d in the analysi s is the proporti on of total usage th at is relevant to Purcell’s occupancy (and is con sidered correct)
evant indicators and has been consistent since the relocation, however, the ed EPC rating of the new studio ( C vs. E). The landlord is providin g a full te that is use d in the analysi s is the proporti on of total usage th at is ed correct).
The upturn is gas use i s not consistent with the HDD data
No raw data is being received for the Asia-Pacific studios as these are sub-lets of desk space. Totals for these studios have been included in the footprint by using estimates provided for the Hobart and Melbourne studios (derived from overall building usage), and general estimates for Sydney and Hong Kong, and converting these using Australia/Hong Kong energy factors.
The York studio relocated at the end of 2022 and is now in an all-electric building. No data is available to assess heating/power use se par ately. Total energy use is down due to the improve d energy ef ciency of the new location but the actual energy use by Purcell is currently under review as the building metering is not con sistent with expectations
The York studio relocated at the end of 2022 and is now in an all-electric building. No data is available to assess heating/power use se par ately. Total energy use is down due to the improve d energy ef ciency of the new location but the actual energy use by Purcell is currently under review as the building metering is not con sistent with expectations
nd is now in an all-electric building. No data is available to assess is down due to the improve d energy ef ciency of the new location but the
as the
metering is not
BUSINESS TRAVEL
BUSINESS TRAVEL
All plots: Business miles per FTE, excluding international flights. Travel by Group staff is excluded from each applicable studio and shown separately from 2013 onwards. Travel for Manchester Town Hall and Palace of Westminster are included with the Manchester and London studios, respectively. Travel for HCT staff is included with the studio/region where they are based.
REGIONS
This year we have continued to purchase offsets for the emissions we have calculated that are within our direct control. We have chosen to continue our support for a carefully selected range of projects from within the Americas region that have strong additional benefits beyond reducing carbon emissions. These include health benefits and reducing deforestation. All projects in this portfolio are certified to either the Verified Carbon Standard or the Gold Standard and include energy efficiency, reducing deforestation and clean drinking water projects. All certified credits follow the stringent requirements of the Quality Assurance Standard (QAS) for carbon offsetting.
We recognise that purchasing offsets can have positive impacts and generate much-needed investments that help reduce climate change, for example in nature climate solutions. However, we acknowledge the challenges with the voluntary carbon market and do not see this as a substitute for the stringent emission-reduction requirements that need to be achieved collectively. We remain committed to reducing the impact of our business as much as possible before offsetting.
offset
244 tonnes of carbon dioxide by supporting
27 March 2025
John Buckley Managing Director, Carbon Footprint Ltd www.carbonfootprint.com
This certificate acknowledges that Purcell Architecture Ltd (Purcell)
Gold Standard Community Based Verified Carbon Reduction Projects
Helping to combat climate change and sustain our environment for future generations