The Inefficiency of Inequality
3.
Chapter V
The urgent need to increase the rate of decarbonization
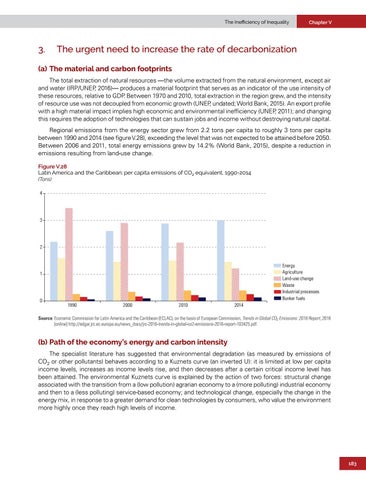
(a) The material and carbon footprints The total extraction of natural resources —the volume extracted from the natural environment, except air and water (IRP/UNEP, 2016)— produces a material footprint that serves as an indicator of the use intensity of these resources, relative to GDP. Between 1970 and 2010, total extraction in the region grew, and the intensity of resource use was not decoupled from economic growth (UNEP, undated; World Bank, 2015). An export profile with a high material impact implies high economic and environmental inefficiency (UNEP, 2011); and changing this requires the adoption of technologies that can sustain jobs and income without destroying natural capital. Regional emissions from the energy sector grew from 2.2 tons per capita to roughly 3 tons per capita between 1990 and 2014 (see figure V.28), exceeding the level that was not expected to be attained before 2050. Between 2006 and 2011, total energy emissions grew by 14.2% (World Bank, 2015), despite a reduction in emissions resulting from land-use change. Figure V.28 Latin America and the Caribbean: per capita emissions of CO2 equivalent, 1990-2014 (Tons) 4
3
2
Energy Agriculture Land-use change Waste Industrial processes Bunker fuels
1
0
1990
2000
2010
2014
Source: Economic Commission for Latin America and the Caribbean (ECLAC), on the basis of European Commission, Trends in Global CO2 Emissions: 2016 Report, 2016 [online] http://edgar.jrc.ec.europa.eu/news_docs/jrc-2016-trends-in-global-co2-emissions-2016-report-103425.pdf.
(b) Path of the economy’s energy and carbon intensity The specialist literature has suggested that environmental degradation (as measured by emissions of CO2 or other pollutants) behaves according to a Kuznets curve (an inverted U): it is limited at low per capita income levels, increases as income levels rise, and then decreases after a certain critical income level has been attained. The environmental Kuznets curve is explained by the action of two forces: structural change associated with the transition from a (low pollution) agrarian economy to a (more polluting) industrial economy and then to a (less polluting) service-based economy; and technological change, especially the change in the energy mix, in response to a greater demand for clean technologies by consumers, who value the environment more highly once they reach high levels of income.
183