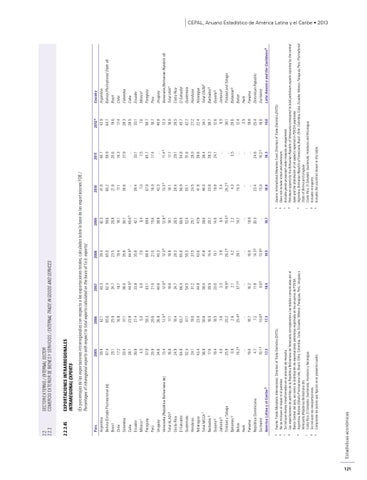
2005 39.9 67.4 25.1 17.2 33.5 26.1 30.8 4.5 57.8 20.9 34.6 13.4 16.8 24.9 64.8 52.4 24.1 43.4 36.9 17.6 19.4 4.0 25.9 0.9 16.2 g ... 19.0 4.7 10.1 g 17.3
2006 42.1 65.6 25.9 16.8 31.1 23.8 27.4 5.0 59.3 20.6 36.9 12.5 d 17.1 18.4 63.7 47.1 19.0 23.0 30.6 16.5 18.5 3.6 20.2 2.6 25.4 g ... 18.7 7.2 10.6 g 17.3
2007 40.3 62.4 24.7 16.7 36.0 44.5 b 33.8 6.0 63.1 21.0 40.6 12.0 d 18.0 24.7 66.4 54.5 31.2 44.8 38.5 39.5 20.0 3.3 19.9 g 2.1 37.7 g ... 16.2 11.8 9.0 g 18.4
Fuente: Fondo Monetario Internacional, Direction of Trade Statistics (DOTS). No se incluyen el níquel ni el petróleo. Se incluyen bienes transformados en el proceso de maquila. Las exportaciones de petróleo de la República Bolivariana de Venezuela corresponden a las totales comunicadas por el Banco Central del país, así como la distribución de exportaciones petroleras registrada en los anuarios de PDVSA. Argentina, Bolivia (Estado Plurinacional de), Brasil, Chile, Colombia, Cuba, Ecuador, México, Paraguay, Perú, Uruguay y Venezuela (República Bolivariana de). Costa Rica, El Salvador, Guatemala, Honduras y Nicaragua. Se incluyen las reexportaciones. Comprende los países que figuran en el presente cuadro.
País Argentina Bolivia (Estado Plurinacional de) Brasil Chile Colombia Cuba Ecuador México c Paraguay Perú Uruguay Venezuela (República Bolivariana de) Total ALADI e Costa Rica El Salvador Guatemala Honduras Nicaragua Total MCCA f Barbados g Guyana g Jamaica g Trinidad y Tabago Bahamas g Belice Haití Panamá República Dominicana Suriname América Latina y el Caribe h
Estadísticas económicas
h
g
f
e
d
c
b
a
EXPORTACIONES INTRARREGIONALES INTRAREGIONAL EXPORTS
2.2.2.45
2008 39.4 65.0 23.5 19.4 35.8 44.9 b 35.8 7.0 68.9 21.0 40.3 12.3 d 18.9 28.3 65.8 55.3 37.5 43.6 41.8 15.4 15.1 3.9 26.2 g 4.2 26.1 ... 16.0 14.3 g 13.9 g 19.5
2009 42.3 59.6 20.9 18.1 30.7 49.0 b 42.1 6.4 69.6 15.6 38.9 12.8 d 18.1 26.5 66.9 52.4 25.1 47.9 39.0 20.7 14.6 6.4 19.4 g 2.2 10.7 ... 18.6 20.3 ... 18.7
h
g
f
e
d
c
b
a
2011 40.7 59.9 20.6 16.3 27.9 ... 33.1 7.5 65.7 17.4 ... 11.4 d 17.7 29.1 54.8 51.6 28.0 39.6 39.4 28.3 24.1 ... ... 3.5 ... ... ... 24.6 16.2 g 18.3
2012 a 42.9 64.7 19.6 17.4 28.3 28.5 33.1 7.6 58.7 18.7 40.8 12.3 18.0 28.5 45.7 42.7 27.2 22.4 34.1 38.7 12.6 6.5 38.1 28.6 12.4 2.5 19.8 25.4 16.6 19.0
Country Argentina Bolivia (Plurinational State of) Brazil Chile Colombia Cuba Ecuador Mexico c Paraguay Peru Uruguay Venezuela (Bolivarian Republic of) Total LAIA e Costa Rica El Salvador Guatemala Honduras Nicaragua Total CACM f Barbados g Guyana g Jamaica g Trinidad and Tobago Bahamas g Belize Haiti Panama Dominican Republic Suriname Latin America and the Caribbean h Source: International Monetary Fund, Direction of Trade Statistics (DOTS). Does not include nickel and petroleum. Includes goods processed under maquila arrangements. Petroleum exports by the Bolivarian Republic of Venezuela correspond to total petroleum exports reported by the central bank and the distribution of oil exports reported in PDVSA yearbooks. Argentina, Bolivarian Republic of Venezuela, Brazil, Chile, Colombia, Cuba, Ecuador, Mexico, Paraguay, Peru, Plurinational State of Bolivia and Uruguay. Costa Rica, El Salvador, Guatemala, Honduras and Nicaragua. Includes re-exports. Includes the countries shown in this table.
2010 41.8 60.2 21.8 17.1 26.6 ... 39.4 7.0 67.9 16.9 42.3 13.3 d 18.1 28.4 56.9 55.1 24.5 41.8 40.0 23.8 19.8 5.4 26.2 g 4.3 15.3 ... ... 23.4 15.0 18.8
(En porcentajes de las exportaciones intrarregionales con respecto a las exportaciones totales, calculadas sobre la base de las exportaciones FOB / Percentages of intraregional exports with respect to total exports calculated on the basis of f.o.b. exports)
SECTOR EXTERNO / EXTERNAL SECTOR COMERCIO EXTERIOR DE BIENES Y SERVICIOS / EXTERNAL TRADE IN GOODS AND SERVICES
2.2 2.2.2
CEPAL, Anuario Estadístico de América Latina y el Caribe • 2013
121