Published by Psi Chi, The International Honor Society in Psychology ®
PSI CHI JOURNAL OF PSYCHOLOGICAL RESEARCH
WINTER 2025 | VOLUME 30, NUMBER 4
EDITOR
STEVEN V. ROUSE, PhD
Pepperdine University
Telephone: (310) 506-7959
Email: steve.rouse@psichi.org
ASSOCIATE EDITORS
JENNIFER L. HUGHES, PhD Agnes Scott College
STELLA LOPEZ, PhD University of Texas at San Antonio
TAMMY LOWERY ZACCHILLI, PhD Saint Leo University
ALBEE MENDOZA, PhD Delaware State University
KIMBERLI R. H. TREADWELL, PhD University of Connecticut
ROBERT R. WRIGHT, PhD Brigham Young University-Idaho
EDITOR EMERITUS
DEBI BRANNAN, PhD Western Oregon University
MANAGING EDITOR BRADLEY CANNON
DESIGNER JANET REISS
EDITORIAL ASSISTANT EMMA SULLIVAN
ADVISORY EDITORIAL BOARD
GLENA ANDREWS, PhD RAF Lakenheath USAF Medical Center
AZENETT A. GARZA CABALLERO, PhD Weber State University
MARTIN DOWNING, PhD Lehman College
HEATHER HAAS, PhD University of Montana Western
ALLEN H. KENISTON, PhD University of Wisconsin–Eau Claire
MARIANNE E. LLOYD, PhD Seton Hall University
DONELLE C. POSEY, PhD Washington State University
LISA ROSEN, PhD Texas Women's University
CHRISTINA SINISI, PhD Charleston Southern University
ABOUT PSI CHI
Psi Chi is the International Honor Society in Psychology, founded in 1929. Its mission: "recognizing and promoting excellence in the science and application of psychology." Membership is open to undergraduates, graduate students, faculty, and alumni making the study of psychology one of their major interests and who meet Psi Chi’s minimum qualifications. Psi Chi is a member of the Association of College Honor Societies (ACHS), and is an affiliate of the American Psychological Association (APA) and the Association for Psychological Science (APS). Psi Chi’s sister honor society is Psi Beta, the national honor society in psychology for community and junior colleges.
Psi Chi functions as a federation of chapters located at senior colleges and universities around the world. The Psi Chi Headquarters is located in Chattanooga, Tennessee. A Board of Directors, composed of psychology faculty who are Psi Chi members and who are elected by the chapters, guides the affairs of the Organization and sets policy with the approval of the chapters.
Psi Chi membership provides two major opportunities. The first of these is academic recognition to all inductees by the mere fact of membership. The second is the opportunity of each of the Society’s local chapters to nourish and stimulate the professional growth of all members through fellowship and activities designed to augment and enhance the regular curriculum. In addition, the Organization provides programs to help achieve these goals including conventions, research awards and grants competitions, and publication opportunities.
JOURNAL PURPOSE STATEMENT
The twofold purpose of the Psi Chi Journal of Psychological Research is to foster and reward the scholarly efforts of Psi Chi members, whether students or faculty, as well as to provide them with a valuable learning experience. The articles published in the Journal represent the work of undergraduates, graduate students, and faculty; the Journal is dedicated to increasing its scope and relevance by accepting and involving diverse people of varied racial, ethnic, gender identity, sexual orientation, religious, and social class backgrounds, among many others. To further support authors and enhance Journal visibility, articles are now available in the PsycInfo®, EBSCO®, Crossref®, and Google Scholar databases. In 2016, the Journal also became open access (i.e., free online to all readers and authors) to broaden the dissemination of research across the psychological science community.
JOURNAL INFORMATION
The Psi Chi Journal of Psychological Research (ISSN 23257342) is published quarterly in one volume per year by Psi Chi, Inc., The International Honor Society in Psychology. For more information, contact Psi Chi Headquarters, Publication and Subscriptions, 651 East 4th Street, Suite 600, Chattanooga, TN 37403, (423) 7562044. https://www.psichi.org; psichijournal@psichi.org
Statements of fact or opinion are the responsibility of the authors alone and do not imply an opinion on the part of the officers or members of Psi Chi.
Advertisements that appear in Psi Chi Journal do not represent endorsement by Psi Chi of the advertiser or the product. Psi Chi neither endorses nor is responsible for the content of thirdparty promotions. Learn about advertising with Psi Chi at https://www.psichi.org/Advertise
COPYRIGHT
Permission must be obtained from Psi Chi to reprint or adapt a table or figure; to reprint quotations exceeding the limits of fair use from one source, and/or to reprint any portion of poetry, prose, or song lyrics. All persons wishing to utilize any of the above materials must write to the publisher to request nonexclusive world rights in all languages to use copyrighted material in the present article and in future print and nonprint editions. All persons wishing to utilize any of the above materials are responsible for obtaining proper permission from copyright owners and are liable for any and all licensing fees required. All persons wishing to utilize any of the above materials must include copies of all permissions and credit lines with the article submission.
317 Environmental Enrichment and Forced-Exposure Training With Pigeons: Responding to the Replication Crisis
Isabella Berrebi1, Sarah Leizear1, Jeffrey Pisklak*2, Margaret A. McDevit*1
1Department of Psychology, McDaniel College
2Department of Psychology, University of Alberta
327 Effect of Feeding Frequency on Anxiety-Like Behavior and Cortisol Levels in Group-Housed Zebrafish (Danio rerio)
Emma Meekma, Adeel Shafiq, and Maureen L. Petrunich-Rutherford*
Department of Psychology, Indiana University Northwest
335 Subjective Social Status and Ambulatory Blood Pressure Among African American Emerging Adults
Madeleine R. Zilligen1, Nataria T. Joseph*1, and Laurel M. Peterson*2
1Department of Psychology, Pepperdine University
2Department of Psychology & Health Studies, Bryn Mawr College
345 Attitudes Towards Psilocybin: A General Population’s Opinions on Psilocybin and Psilocybin-Assisted Therapies
Madison M. H. Simounet and Joy R. Drinnon*
Department of Psychology, Milligan University
356 Higher System Justification Beliefs Predict Greater Acceptance of Economic Inequality Among University Students
Kayla Neubert1 and Amanda R. Burkholder*2
1Department of Psychology, University of Oregon
2Department of Psychology, Furman University
369 Exploring the Interplay Between Lexical Context and Attentional Allocation in the Lexical Decision Task
Olivia Sroka, Kaye Deenihan, Mariah Fraser, and Zane Zheng*
Department of Psychology, Lasell University
382 Empowered to Choose: Investigating Job Autonomy and Parental Burnout in the Context of Work-Family Conflict
Brielle R. Croke and Adam H. Smiley*
Department of Psychological Science and Neuroscience, Belmont University
391 Perceptions of Sex Work: What Drives Opposition?
Tiffany R. Abrams, Lauren M. Banicki, and Angela G. Pirlott*
Department of Psychology, Saint Xavier University
403 “Where Are You REALLY From?” Navigating Rejection Sensitivity, Perceiving Microaggressions, and Anxiety Among South Asian Students
Megha Datta1, Zeena R. Whayeb1, Pam McAuslan*2, and Robert Hymes*2
1University of Michigan-Dearborn
2Department of Behavioral Sciences, University of Michigan-Dearborn
Environmental
Enrichment and Forced-Exposure Training With Pigeons: Responding to the Replication Crisis
Isabella Berrebi1, Sarah Leizear1, Jeffrey Pisklak*2, Margaret A. McDevitt*1
1Department of Psychology, McDaniel College
2Department of Psychology, University of Alberta
ABSTRACT. Recent attention to the reliability of scientific literature has focused renewed attention on the role of replications. The present study aimed to evaluate 2 variables that appear to affect suboptimal choice in pigeons but have yet to be replicated. Pigeons were presented with a standard suboptimal choice task in which the suboptimal alternative led to a signaled delivery of food 50% of the time and the optimal alternative always led to food. The type of housing (enriched vs. isolated) and type of training (presence vs. absence of forcedexposure trials) was manipulated. Based on previous research, pigeons housed in isolation and trained with forced exposure trials were predicted to make the most suboptimal choices of the four groups. Instead, birds in enriched housing and trained with forced exposure trials chose the suboptimal alternative most frequently. A balanced 2 x 2 ANOVA found that both the main effect of housing, F(1, 8) = 4.52, p = .066, ω2 = .18, and training, F(1, 8) = 5.21, p = .052, ω2 = .22, did not reach significance, nor did their interaction, F(1, 8) = 0.37, p = .562, ω2 < .01. However, Bayes factors indicated weak evidence in support of both the main effect of housing (BF10 = 1.22) and the main effect of training (BF10 = 1.46), but not the interaction (BF10 = 0.5). The present results highlight the need to determine the degree to which initial results are reliable and generalizable prior to becoming cited and viewed as an established finding.
RESUMEN. La atención reciente a la confiabilidad de la literatura científica ha centrado una atención renovada en el papel de las replicaciones. El presente estudio tiene como objetivo evaluar 2 variables que parecen afectar la elección subóptima en las palomas pero que aún no se han replicado. A las palomas se les presentó una tarea estándar de elección subóptima en la que la alternativa subóptima conducía a una entrega señalizada de alimento el 50% de las veces y la alternativa óptima siempre conducía a comida. Se manipuló el tipo de vivienda (enriquecida versus aislada) y el tipo de capacitación (presencia versus ausencia de ensayos de exposición forzada). Según investigaciones anteriores, se predijo que las palomas alojadas en aislamiento y entrenadas con pruebas de
Preregistration, Open Data, and Open Materials badges earned for transparent research practices. Preregistration, data, and materials can be viewed at https://osf.io/3e24b/
exposición forzada tomarían las decisiones menos óptimas de los cuatro grupos. En cambio, las aves en alojamientos enriquecidos y entrenados con pruebas de exposición forzada eligieron con mayor frecuencia la alternativa subóptima. Un ANOVA equilibrado 2 x 2 encontró que tanto el efecto principal de la vivienda, F(1, 8) = 4,52, p = 0,066, ω 2 = 0,18, como el de la formación, F (1, 8) = 5,21, p = 0,052 , ω2 = .22, no alcanzaron significancia, ni tampoco su interacción, F(1, 8) = 0.37, p = .562, ω2 < .01. Sin embargo, los factores de Bayes indican evidencia débil que respalda tanto el efecto principal de la vivienda (BF10 = 1,22) como el efecto principal de la capacitación (BF10 = 1,46), pero no la interacción (BF10 = 0,5). Los resultados actuales resaltan la necesidad de determinar el grado en que los resultados iniciales son confiables y generalizables antes de ser citados y vistos como un hallazgo establecido.
The replication crisis in psychology has increased attention in recent years on not only the replicability of research reports, but more generally the degree to which scientific inquiry functions to selfcorrect (Vazire & Holcombe, 2022). Selfcorrecting science refers to the cyclical nature of scientific inquiry; inevitable limitations of an individual study can be corrected by the collective process of scientific investigation if new evidence, insights, and critiques continually shape understanding. Without the proper dissemination and discussion of replication studies and nonsignificant results, science cannot selfcorrect, leaving the literature limited and incomplete, if not distorted.
Replications are often categorized as either direct or conceptual (e.g., Chambers, 2019). Direct replications attempt to recreate a study using procedures as similar as possible to the original research. In contrast, conceptual replications aim to confirm and extend previous findings by incorporating new or altered manipulations and variables. As direct replication studies are crucial in demonstrating internal validity (causality), conceptual replications are crucial in demonstrating external validity (generality; Fabrigar et al., 2020). Throughout this paper, the replication studies discussed will be categorized based on these definitions.
Despite the importance of both direct and conceptual replications, there is often indifference, or even hostility, towards replications (Chambers, 2019). Instead, researchers tend to study novel variables, which are understandably more interesting to readers, and are
therefore more likely to be published. The unfortunate result is few replications are conducted to confirm findings. For example, Makel et al. (2012) examined 500 articles from the top 100 psychology journals and found that only about 1% were replication studies. Even when replications are published, they are often ignored. For example, von Hippel (2022) analyzed 98 replication studies published in 2015 and found that failed replications only reduced citations of the original study by less than 10%. Also concerning, von Hippel discovered that less than 3% of articles citing an original study also cited the replication.
Another issue is publication bias for statistically significant results, which makes it difficult for the scientific record to self correct once spurious results become published. Studies yielding nonsignificant results are considered failed experiments rather than sources of valuable information regarding the absence of an effect (Locascio, 2017). This is particularly problematic because nonsignificant results, especially in replication studies, can provide crucial information about the existing literature. If replication studies are not produced and disseminated, false positives will continue to be cited without correction. Given that false positives have been estimated to occur about 61% of the time (Simmons et al., 2011), this is a prevalent and ongoing problem.
Various research practices have been suggested to help make scientific research more reliable. For example, LeBel (2015) proposed that one of every five studies conducted by individual researchers should attempt to replicate findings in their area of expertise. The field
Environmental Enrichment and Forced-Exposure | Berrebi, Leizear, Pisklak, and McDevitt
of psychology would benefit, he argued, even if only a minority of researchers adopt his approach. Similarly, Chambers recommended individual researchers adopt specific practices to improve the reliability of psychological research (2019, p. 213). His first recommendation urged caution regarding findings that have not been replicated, and for researchers to preregister their hypotheses and planned analyses on the Open Science Framework. Preregistering a study before it is conducted is used to reduce the occurrence of “phacking” and other forms of hidden flexibility that increase unreliable findings. The present research is a response to these calls for reform. Our preregistered study examined two variables related to suboptimal choice behavior that have not yet been successfully replicated.
Suboptimal choice refers to the wellestablished but surprising finding that pigeons (Columba livia) will choose and even favor an option that yields lower overall reinforcement (i.e., food) when predictive cues signal its delivery after a delay (for a recent review see Dunn et al., 2024). Figure 1 shows a standard suboptimal choice procedure (Kendall, 1985; Spetch et al., 1990) and the one used in the present study. In this procedure, pigeons can choose between suboptimal (50% food) and optimal (100% food) alternatives by pecking one of the square stimuli shown in Figure 1. When the suboptimal alternative
(shown on the left of Figure 1) is chosen, it always leads to a 30s delay. The delay always ends with food when the keylight is red, but never ends with food when the keylight is white. Thus, the suboptimal alternative provides food only half of the time, but importantly the stimulus color presented during the delay is perfectly correlated with the outcomes, signaling whether the trial will end in food or no food. When the optimal alternative (shown on the right of Figure 1) is chosen, one of two keylights (yellow or green) is presented during a 30s delay and is always followed by food. In contrast to the suboptimal alternative, food is provided 100% of the time, making it a dependable choice for securing food. If hungry pigeons are only motivated by food, they would have an exclusive preference for the optimal alternative. However, extensive research has shown that once they have sufficient experience with the two alternatives, they frequently prefer the suboptimal alternative (e.g., Sears et al., 2022; Stagner & Zentall, 2010). This suggests that the choice behavior is controlled more by the stimuli that predict the food than the food itself. In this case, suboptimal preference occurs because choice of the suboptimal alternative immediately provides informative stimuli (i.e., signals correlated with the food and no food outcomes). When the signals are not predictive of the outcomes on the suboptimal alternative, pigeons strongly prefer the optimal alternative (e.g., Stagner & Zentall, 2010).
Although suboptimal choice behavior in pigeons has been widely replicated (see Dunn et al., 2024; McDevitt et al., 2016; Vasconcelos et al., 2018; Zentall, 2016, for reviews), some of the variables that appear to modulate it have not. One study found that environmental enrichment slowed down the acquisition of suboptimal preference (Pattison et al., 2013). Enrichment has been operationalized in many different forms, but generally refers to added environmental or social stimulation (e.g., toys, platforms, stimuli, exposure to other animals, larger living area).
Note. Schematic detailing the contingencies experienced when the suboptimal (shown left) and optimal (shown right) alternatives were selected. Example: A choice trial started with an illuminated square on the left and right response keys. If the left square was pecked (the suboptimal alternative), half the time it was replaced with a red stimulus and half the time it was replaced by a white stimulus. When it turned red, it remained illuminated for 30 s and then food was delivered and the trial ended. When it turned white, it remained illuminated for 30 s, no food was delivered, and then the trial ended. If the right square was pecked (the optimal alternative), a green or yellow response key was illuminated for 30 s and the trial always ended with food. In forced-exposure trials, only one alternative was presented. In choice trials, each trial consisted of a choice between the two alternatives. The alternatives were counterbalanced such that the suboptimal alternative was on the left side for half the birds and the right for the other half.
Pattison et al. (2013) trained two groups of four pigeons in the same suboptimal choice task, but the birds in the control group were housed in isolation and birds in the other group were provided with enriched housing prior to training and throughout data collection. The enriched housing consisted of a large flight cage that held four pigeons at a time and included places to perch, providing social and environmental enrichment. Pattison et al. found that subjects in the enriched group took significantly longer, 18 sessions on average, to develop a reliable suboptimal preference compared to isolated subjects, which took only 3.2 sessions. Only after 30 sessions of training did the groups have equivalent terminal levels of preference. In other words, both groups of birds ended training with a strong
FIGURE 1
Experiment Procedure
Leizear,
preference for the suboptimal alternative, but birds in the enriched housing took, on average, substantially more sessions to acquire that preference.
Laude and colleagues (2014) attempted to conceptually replicate the enrichment manipulation used in Pattison et al. (2013). They used a suboptimal choice procedure in which a suboptimal alternative provided signaled food 20% of the time and an optimal alternative provided food 100% of the time. The housing conditions were nearly identical to Pattison et al. but included additional enrichment in the form of extra perches and opportunities to bathe. Laude et al. found no significant difference between the two groups of four pigeons in the rate at which preference for the suboptimal alternative developed.
A large literature on the effects of enrichment on learning in nonhuman subjects consistently shows that enrichment is neurologically beneficial, improving a species’ ability to learn different contingencies. For example, Woodcock and Richardson (2000) found that rats reared in an enriched environment processed contextual information faster than rats reared in isolated/ standard housing during a preshock period. Rats living in enriched housing appeared to be able to form a complex representation of the conditioning context and demonstrated improved discrimination between two similar contexts. Cortese et al. (2018) found that even shortterm exposure to enrichment has significant effects on hippocampal function. They found that a single month of enriched housing for adult rats improved learning and memory in the Morris water maze and objectrecognition behavioral tests. These effects are not just behavioral, but also extend to neurological changes. For example, Cortese et al. found that rats in socially and environmentallyenriched housing showed enhanced metabotropic glutamate receptordependent hippocampal longterm potentiation compared to rats housed with only social enrichment. Xu et al. (2022) found that environmental enrichment may moderate neurological effects of early life stress by regulating histone acetylation in the hippocampus and amygdala. Thus, many studies examining different facets of enrichment consistently support the general finding that enrichment enhances learning and memory along with corresponding neurological changes (e.g., Bramati et al., 2023; HeimerMcGinn et al., 2020). Environmental enrichment also appears to mitigate the negative effects of stress and aging (for reviews of these effects, see Hannan, 2014; Macartney et al., 2022; Sahini et al., 2024).
As noted above, research has consistently shown that environmental enrichment leads to enhanced learning. This appears to conflict with Pattison et al.’s (2013) findings, which demonstrated slower acquisition of suboptimal preference, a behavior now considered
McDevitt
adaptive rather than “suboptimal” in pigeons’ natural environments (Vasconcelos et al., 2015, 2018; see discussion below). Given that Laude et al. (2014) did not replicate that result, the fact that the original study is frequently cited, and the breadth of literature suggesting the opposite effect, it is especially important to investigate the influence of environmental enrichment on suboptimal choice. According to our analysis (see Berrebi et al., 2025 for a full description) using Google Scholar, Pattison et al. has been cited approximately 87 times. Of these, 18 journal articles have also cited Laude et al., but the majority (12 of the 18) only cited the Pattison et al. article in support of an enrichment effect on suboptimal choice. Of the six articles that cited both, only three indicated any inconsistency in the results of the two studies.
A more recent study, also related to suboptimal choice, found that the types of trials presented during training appear to modulate the degree of suboptimal preference. McDevitt et al. (2022) compared groups of pigeons with varying numbers of forcedexposure and choice trials during training. A forcedexposure trial presents only one of the two possible choice alternatives at a time; either the suboptimal or optimal alternative is presented. This allows the researcher to ensure that, across trials, each subject has equal exposure to the contingencies associated with each alternative. The drawback is that, by themselves, forced exposure trials do not provide the researcher with a measure of preference. By contrast, a choice trial presents both the suboptimal and optimal alternative simultaneously, thus allowing the subject to choose between them and providing a measure of preference. However, in the absence of forcedexposure trials, the degree to which the alternatives are experienced is much more dependent on the pigeons’ behavior, which can lead to unequal exposure to the contingencies. McDevitt et al. found that sessions consisting of 67% or 100% of forcedexposure trials led to stronger preference for the suboptimal alternative, but the absence of forcedexposure trials (i.e., only choice trials) resulted in greater choice of the optimal alternative. Research on suboptimal choice typically utilizes both types of trials to ensure a subject has been exposed to each alternative while evaluating preference for one or the other (Fortes et al., 2018; LópezTolsa & Orduna, 2021; Macías et al., 2021), but McDevitt et al. is the only study to date that examined whether trial types impact preference. Thus, there have been no replication attempts with respect to forcedexposure training and inconclusive results from the two enrichment studies that have been conducted.
The present study sought to conceptually replicate the effects of both environmental enrichment and forcedexposure training on suboptimal choice in pigeons using a balanced 2×2 independent analysis of variance (ANOVA) design. Determining an appropriate sample
size in nonhuman animal research involves balancing the need for sufficient statistical power against ethical and practical constraints (National Research Council, 2011). The earlier studies on enrichment (Pattison et al., 2013; Laude et al., 2014) and training type (McDevitt et al., 2022) employed small sample sizes (n = 4 birds per group), which is common in nonhuman animal research due to the strong experimental control obtained and the preference in animal research towards detecting large effects, both of which enhance statistical power. In the study reported here, 12 pigeons were randomly assigned to four groups: enriched with forcedexposure trials, enriched with choice trials, isolated with forcedexposure trials, and isolated with choice trials (i.e., three subjects per cell). This provided a slightly larger sample for each main effect tested (n = 6) compared to Pattison et al. and McDevitt et al. Although a larger sample size would have been preferable, practical constraints within the context of an undergraduate teaching laboratory limited the sample to N = 12, which included all of the pigeons available in the lab.
A conceptual replication was chosen for several reasons. First, the two previous research studies (Pattison et al., 2013 and McDevitt et al, 2022) used different variants of the suboptimal choice procedure, making it impossible to study both variables with a direct replication. Given that a significant effect of forcedexposure training was repeated in a second experiment in McDevitt et al, 2022, we opted to employ a suboptimal choice procedure closer to the one used by Pattison et al. (2013). Second, large ceiling effects and heterogeneous variances were observed in the prior studies by Pattison et al. and McDevitt et al., which complicated the analyses of the results and makes an a priori determination of an appropriate sample size difficult. To avoid a ceiling effect, we employed the original suboptimal choice paradigm by Kendall (1974) because it produces less extreme suboptimal preference in pigeons and should promote more homogeneous variances. As a result, our procedure involved a choice between a suboptimal alternative that provided 50% food and an optimal alternative that provided 100% food, which was similar to Pattison et al.’s procedure involving choice between a 50% suboptimal alternative and a 75% optimal alternative.
Based on the Pattison et al. (2013) study, we expected diminished suboptimal choice for subjects housed in the enriched environment. Conversely, following McDevitt et al. (2022), we expected increased suboptimal choice with subjects exposed to training with forcedexposure trials. The present study was preregistered on the Open Science Framework, and all data and analyses are publicly available there (Berrebi et al., 2025).
Method
Subjects
The subjects were 12 adult pigeons with experience in concurrent chains and simple discrimination procedures and were cared for in accordance with the Guide for the Care and Use of Laboratory Animals (National Research Council, 2011). They were maintained at approximately 85% of their freefeeding weights by grain obtained during experimental sessions and immediate postsession feedings when necessary. Half of the pigeons were housed in individual cages and half in a larger group cage, all under a 12hr light/dark cycle, with water and grit freely available.
Apparatus
Eight operant chambers (approximately 360 mm wide, 320 mm long, and 350 mm high) were used. Three translucent response keys, 25 mm in diameter, were mounted on the front panel 260 mm above the floor and 72.5 mm apart. Each side key could be illuminated from the rear by standard IEE 28V 12stimulus projectors. A 28V 1W miniature lamp, located 87.5 mm above the center response key, provided general chamber illumination for the duration of each session, except during blackout periods as noted below. Directly below the center key and 95 mm above the floor was an opening (57 mm high by 50 mm wide) that provided access to a solenoid operated grain hopper filled with mixed grain. When activated, the food hopper was raised for 5 s and illuminated from above with white light by a 28V 1W miniature lamp. A computer and a MEDPC interface, located in an adjacent room, controlled experimental events.
Procedure
Pretraining
Prior to beginning the experiment, each bird received pretraining for seven days during which keypecks to the stimuli used in the experiment were reinforced according to a fixedratio (FR) schedule. To ensure that each subject was reliably pecking all stimuli before starting the experiment, the schedule was gradually increased from FR 1 to FR 20.
Training
An overview of the procedure is shown in Figure 1. Two alternatives were presented in training. The suboptimal alternative was presented on one side key and consisted of a square stimulus that, when chosen with a single peck, was replaced with one of two possible delay stimuli (e.g., a red or white keylight) that remained illuminated for 30 s. The delay stimuli appeared equally often (p = .50). One stimulus (e.g., red) was always followed by
Berrebi, Leizear, Pisklak, and McDevitt |
5s access to the food hopper. The other (e.g., white) was followed by 5s termination of the houselight (blackout) and no food. Overall, the suboptimal alternative ended with food 50% of the time, and the color of the delay stimuli signaled which outcome would be presented.
The optimal alternative was presented on the other side key and consisted of a square stimulus that, when chosen, was replaced with a color delay stimulus (e.g., a green or yellow keylight) that remained illuminated for 30 s. Both delay stimuli appeared equally often (p = .50) and were always followed by 5s access to the food hopper. Thus, the optimal alternative ended with food 100% of the time.
The stimulus locations were constant (green and yellow on one response key, white and red on the other), but the side associated with each alternative was counterbalanced across subjects so that the optimal alternative was presented on the left for half of the birds and the right for the others. A 5s intertrial interval separated each trial. Each bird completed 22 sessions and each session was terminated at the completion of 80 trials or 90 min, whichever occurred first.
Independent Variables
The 12 birds were randomly assigned to one of four groups manipulating two variables as per a balanced 2 x 2 independent ANOVA design. The four groups (n = 3) consisted of enriched housing with only forcedexposure trials, enriched housing with only choice trials, isolated housing with only forcedexposure trials, and isolated housing with only choice trials.
Enrichment Manipulation. Environmental enrichment consisted of a group cage with three chambers that totaled 24.6 ft3 (.7 m3), housing three birds at a time. This cage also included various enrichment toys including bells, swings, perches at different heights, ropes, cardboard boxes, and a tub of water for bathing. Birds in the isolation
group were housed in individual cages of approximately 1 ft3 (.03 m3). There were no birds on either side of the isolated subjects’ cages. All subjects were housed individually prior to the study.
Forced-Exposure Manipulation. A forcedexposure trial consisted of the presentation of a single alternative (i.e., a square stimulus on either the right or the left response key). A choice trial consisted of the presentation of both alternatives (i.e., a square stimulus on both the right and left response keys).
For subjects that received only forcedexposure trials, each block of four trials consisted of two presentations of the suboptimal alternative and two presentations of the optimal alternative. The order of trials within each block was randomly determined. These subjects received two test sessions at sessions 11 and 22. Test sessions consisted of only choice trials.
For subjects that received only choice trials during training, all sessions were identical and consisted of only choice trials. In sum, for FEonly subjects, sessions 1–10 and 12–21 each consisted of 80 forcedexposure trials, half optimal alternative, and half suboptimal alternative. For sessions 11 and 22, the FEonly group received only choice trials to test progress. For the only choice group, all 80 trials for all 22 sessions were choice trials. Figure 2 provides an overview of the trial types presented during training and testing.
Dependent Variable
The dependent variable was the proportion of choices made to the suboptimal alternative. Choice proportion was calculated as the number of responses to the suboptimal alternative divided by the total number of choice responses for each subject during test sessions 11 and 22. Only sessions 11 and 22 permitted comparisons across all groups of birds because those were the only sessions in which birds in
FIGURE 2
Overview of Training and Testing
forcedexposure training made choices. The test sessions allowed for an assessment of preference at both an early and later stage of training.
Results
Graphical and statistical analyses were conducted using R software (v4.3.2) and the ‘tidyverse’ (v2.0.0) ,‘effsize’ (v0.8.1), and ‘BayesFactor’ (v0.9.12.4.7) packages (Morey & Rouder, 2024; R Core Team, 2024; Torchiano, 2020; Wickham et al., 2019). Copies of both the data and R code are readily accessible to the public via the Open Science Framework (Berrebi et al., 2025). To mitigate the influence of ceiling and floor effects, all inferential analyses were conducted with an arcsine transformation applied (Kirk, 2013). All descriptive statistics are presented in their original untransformed state. All Bayes factor calculations (BF10) were conducted using the default medium JeffreysZellnerSiow prior scale (Morey & Rouder, 2024). For the twoway ANOVA, each main effect and the interaction were tested against an interceptonly null model.
Figure 3 shows the obtained suboptimal preference across the manipulations of housing and training type for sessions 11 and 22 respectively. The consistency in preference demonstrated in Figure 3 across the two testing sessions suggests the pigeons’ preferences had stabilized by session 11. This is supported by responses made to the delay stimuli in the five sessions preceding session 11, with all pigeons but one exhibiting clear discrimination of the food predictive stimulus on the suboptimal alternative; t(11) = 5.52, p < .001, g = 1.47, BF10 >150. Consequently, to streamline the analyses, the results of both session 11 and 22 were averaged.
Across the 6 birds tested in each type of housing,
Note. Interaction plots displaying the mean proportion of suboptimal choice for each test session, shown by housing condition and trial type manipulations. Choice proportions were calculated as the number of suboptimal choices divided by the total number of choices made in the session. Both the housing and trial type manipulations were conducted using independent groups. Error bars represent one standard error above and below the mean. Parallel lines indicate the absence of an interaction.
enriched subjects showed higher levels of suboptimal preference (M = 0.51, SD = 0.30) than the isolated subjects (M = 0.24, SD = 0.24). The type of training received showed similarly discrepant preferences as birds exposed to only choice trials exhibited lower levels of suboptimal choice (M = 0.23, SD = 0.27) than birds given forcedexposure trials only (M = 0.51, SD = 0.26). A balanced 2 x 2 ANOVA found that both the main effect of housing, F(1, 8) = 4.52, p = .066, ω2 = .18, and training, F(1, 8) = 5.21, p = .052, ω2 = .22, did not reach significance, nor did their interaction, F (1, 8) = 0.37, p = .562, ω2 < .01. However, Bayes factors indicate weak evidence in support of both the main effect of housing (BF10 = 1.22) and the main effect of training (BF10 = 1.46), but not the interaction (BF10 = 0.5).
Discussion
The present study evaluated two variables of interest, of which the effects have limited support. These variables were selected in an effort to increase the reliability of psychological research in the wake of the replication crisis (Chambers, 2019). Pigeons were trained on a suboptimal choice procedure in which one alternative always led to food and the other, suboptimal alternative, led to food only half of the time. Previous research has demonstrated that pigeons will frequently choose the suboptimal alternative when it provides differential signals (i.e., one stimulus that always precedes food delivery and a different stimulus that always precedes no food). During training, two variables were manipulated: housing (enriched vs. isolated) and forcedexposure training (all forcedexposure trials vs. all choice trials).
Overall, birds in enriched conditions exhibited a greater choice of the suboptimal alternative than those in isolated housing. Although the main effects were not statistically significant and the evidence remains weak, it is notable that the results are directionally opposite to those reported by Pattison et al. (2013), who found delayed suboptimal preference with enriched housing. This contrast is intriguing given that one of the most widely supported explanations for pigeons’ suboptimal preferences is that it is due to the conditional reinforcement provided by the suboptimal alternative (Dunn et al., 2024). Thus, the development of suboptimal preference can be understood as a form of learning that, although not particularly adaptive within an operant chamber, likely offers advantages in natural environments.
Specifically, through a conditioning process, the pigeons learn which stimuli predict food and direct their choices towards those stimuli. In the wild, animals benefit from both pursuing clear signals for food and disengaging in response to clear signals for the absence of food. This allows them to conserve energy and focus their efforts on Environmental Enrichment and Forced-Exposure
FIGURE 3
Session 11 and 22 Results
Berrebi, Leizear,
Pisklak,
and
McDevitt
| Environmental Enrichment and Forced-Exposure
more promising areas (Vasconcelos et al., 2015, 2018). In contrast, within the constraints of an experimental chamber, animals cannot escape from the nofood signal, making the selection of the “suboptimal” alternative appear maladaptive in this artificial context. Given this and the broader enrichment literature, enriched housing might be expected to accelerate the acquisition of “suboptimal” preference, not delay it as Pattison et al. found. Consequently, Pattison et al.’s findings are, in some respects, counterintuitive. If suboptimal choice behavior reflects an adaptive process as is argued, the trend toward stronger suboptimal preference observed under the enrichment condition in the present study would align with the numerous nonhuman enrichment studies suggesting that enrichment benefits learning. However, if suboptimal preference is viewed as undesirable, delaying the acquisition of that preference may be considered an adaptive advantage.
To summarize the evidence relevant to the question of whether environmental enrichment affects suboptimal choice, one study reported that enrichment delayed, but did not change the final level of preference (Pattison et al.), and two studies (Laude et al., 2014 and the present study) found no significant effects. It is not clear what may account for the discrepancy in the results of the three studies, but it does not seem likely that it is due to the strength of the enrichment manipulation. Pigeons in Pattison et al. (2013) were placed in the group cage for 4 hr per day, 5 days per week. Laude et al. (2014) extended the duration to up to 6 hr per day, and the present study extended it to 24 hr per day, 7 days per week in an attempt to strengthen the manipulation.
In contrast, the results related to the type of training are more aligned with previous research. On average, subjects who were in the all forcedexposure conditions demonstrated more suboptimal choices than birds who only experienced choice trials. The observed trend towards more suboptimal choices when forcedexposure trials are present is consistent with the results of McDevitt et al. (2022). However, the difference between forcedexposure and choice training did not reach significance, and thus more work is needed to establish the strength and generality of trial types on suboptimal choice.
One possible explanation for the difference in the present results compared to earlier work may be the specific procedure used. The present study used the original suboptimal choice procedure developed by Kendall (1974). The prior related works (Laude et al., 2014; McDevitt et al., 2022; Pattison et al., 2013) each utilized accepted variants of the original procedure which altered food amount or probability of food across the two alternatives in ways that generate much more extreme preferences than Kendall’s original procedure (Dunn et al. 2024). It is therefore likely that these procedural
differences account for the differing results, but regardless of procedure, if a general effect exists, it should not be limited to a specific version of the suboptimal choice task.
The terminal degree of suboptimal preference (session 22) obtained in the present study with forcedexposure training (.59) is consistent with prior work. In fact, the aggregated weighted mean choice proportion for 40 subjects across four studies (Belke & Spetch, 1994; McDevitt et al., 1997; Spetch et al., 1990; Spetch et al., 1994) that employed the same procedure (including initial and terminallink schedules) was .59 for the suboptimal alternative (for a large data set for the suboptimal choice procedure, see Dunn et al., 2023).
The lack of significant findings points to the statistical power of the current study being too limited. As noted in the introduction, this reflects practical limitations inherent to the design and available resources at the time of data collection. Although efforts were made to enhance statistical power by increasing the sample size per main effect compared to the prior studies (Laude et al., 2014; McDevitt et al., 2022; Pattison et al., 2013), those earlier studies faced methodological challenges such as ceiling and floor effects, as well as heteroscedasticity. In response, the present study adopted a suboptimal choice procedure originally developed by Kendall (1974), which has been widely utilized in the suboptimal choice literature (e.g., Belke & Spetch, 1994; McDevitt et al. 1997; Spetch et al. 1990; Zentall et al. 2019; for a review see Dunn et al. 2024). However, these issues and modifications severely complicate any power calculations and generalizations that might be attempted. In retrospect, the adoption of the Kendall procedure increased betweensubject variability, which likely obscured the statistical detection of main effects. Although increasing the sample size would likely address this issue, such an approach may not be feasible for many laboratories. A potential solution may lie in employing procedures, such as those used by Stagner and Zentall (2010), that are associated with lower betweensubject variability, along with modifications aimed at mitigating these studies’ strong preference for the suboptimal alternative and resultant ceiling effects, such as by extending the choice phase or reducing the delay phase (McDevitt et al. 2018; Pisklak et al. 2019; Spetch et al. 1990). Despite the present study’s aforementioned constraints, it offers meaningful insights that contribute to the ongoing discourse and provides a foundation for more robust investigations. Thus, although the findings may be limited, they nonetheless serve as a critical step toward more comprehensive research.
The replication crisis is a widereaching problem impacting almost every scientific discipline. With a lack of replication studies, and importantly, the exclusion of failed replications from the literature, science cannot selfcorrect. The present work adds to the scant literature
Environmental Enrichment and Forced-Exposure | Berrebi, Leizear, Pisklak, and McDevitt
on the influence of two variables on suboptimal choice. Regarding the possible effect of environmental enrichment on suboptimal choice with pigeons, our data yielded results contrary to the original work. With regard to forcedexposure training, the findings, though weak, were consistent with the previous research. We believe both manipulations add valuable information to the evolving understanding of both phenomena. Replication attempts are a necessary part of the solution to the crisis of credibility facing psychology. We hope that our work encourages others to answer LeBel’s (2015) call to more systematically and intentionally direct some of their efforts towards replicating prior work.
References
Belke, T. W., & Spetch, M. L. (1994). Choice between reliable and unreliable reinforcement alternatives revisited: Preference for unreliable reinforcement. Journal of the Experimental Analysis of Behavior, 62(3), 353–366. https://doi.org/10.1901/jeab.1994.62-353
Berrebi, I., Leizear, S., Pisklak, J. M., & McDevitt, M. A. (2025). Forced exposure and enrichment in suboptimal choice procedure https://osf.io/3e24b/ Bramati, G., Stauffer, P., Nigri, M., Wolfer, D. P., & Amrein, I. (2023). Environmental enrichment improves hippocampus-dependent spatial learning in female C57BL/6 mice in novel IntelliCage Sweet Reward-based behavioral tests. Frontiers in Behavioral Neuroscience, 17 https://doi.org/10.3389/fnbeh.2023.1256744
Cortese, G. P., Olin, A., O’Riordan, K., Hullinger, R., & Burger, C. (2018). Environmental enrichment improves hippocampal function in aged rats by enhancing learning and memory, LTP, and mGluR5-Homer1c activity. Neurobiology of Aging, 63, 1–11. https://doi.org/10.1016/j.neurobiolaging.2017.11.004
Chambers, C. (2019). The seven deadly sins of psychology: A manifesto for reforming the culture of scientific practice. Princeton University Press. https://doi.org/10.1515/9780691192031
Dunn, R. M., Pisklak, J. M., McDevitt, M. A., & Spetch, M. L. (2023). The signals for good news (SiGN) model data and code repository https://doi.org/10.17605/OSF.IO/39QTJ
Dunn, R. M., Pisklak, J. M., McDevitt, M. A., & Spetch, M. L. (2024). Suboptimal choice: A review and quantification of the signal for Good News (sign) model. Psychological Review, 131(1), 58–78. https://doi.org/10.1037/rev0000416
Fabrigar, L. R., Wegener, D. T., & Petty, R. E. (2020). A validity-based framework for understanding replication in psychology. Personality and Social Psychology Review, 24(4), 316–344. https://doi.org/10.1177/1088868320931366
Fortes, I., Pinto, C., Machado, A., & Vasconcelos, M. (2018). The paradoxical effect of low reward probabilities in suboptimal choice. Journal of Experimental Psychology: Animal Learning and Cognition, 44(2), 180–193. https://180.doi:10.1037/xan0000165
Hannan, A. J. (2014). Environmental enrichment and brain repair. Neuropathology and Applied Neurobiology, 40(1), 13–25.
https://doi.org/10.1111/nan.12102
Heimer-McGinn, V. R., Wise, T. B., Hemmer, B. M., Dayaw, J. N., & Templer, V. L. (2020). Social housing enhances acquisition of task set independently of Environmental Enrichment: A longitudinal study in the Barnes Maze. Learning & Behavior, 48(3), 322–334. https://doi.org/10.3758/s13420-020-00418-5
Kendall, S. B. (1974). Preference for intermittent reinforcement. Journal of the Experimental Analysis of Behavior, 21(3), 473.
https://doi.org/10.1901/jeab.1974.21-463
Kendall, S. B. (1985). A further study of choice and percentage reinforcement. Behavioural Processes, 10(4), 399–413. https://doi.org/10.1016/0376-6357(85)90040-3
Kirk, R. E. (2013). Experimental design: Procedures for the behavioral sciences (4th ed.). SAGE Publications. https://doi.org/10.4135/9781483384733
Laude, J. R., Beckmann, J. S., Daniels, C. W., & Zentall, T. R. (2014). Impulsivity affects suboptimal gambling-like choice by pigeons. Journal of Experimental Psychology: Animal Learning and Cognition, 40(1), 2–11. https://doi.org/10.1037/xan0000001
LeBel, E. P. (2015). A New Replication Norm for Psychology. Collabra, 1(1). https://doi.org/10.1525/collabra.23
Locascio, J. J. (2017). Results blind science publishing. Basic and Applied Social Psychology, 39(5), 239–246. https://doi.org/10.1080/01973533.2017.1336093
López-Tolsa, G., & Orduna, V. (2021). The role of contingency discriminability in suboptimal choice. Behavioural Processes, 193, 104511. https://doi.org/10.1016/j.beproc.2021.104511
Macartney, E. L., Lagisz, M., & Nakagawa, S. (2022). The relative benefits of environmental enrichment on learning and memory are greater when stressed: A meta-analysis of interactions in rodents. Neuroscience & Biobehavioral Reviews, 135, 104554. https://doi.org/10.1016/j.neubiorev.2022.104554
Macías, A., González, V. V., Machado, A., & Vasconcelos, M. (2021). The functional equivalence of two variants of the suboptimal choice task: Choice proportion and response latency as measures of value. Animal Cognition, 24, 85–98. https://doi.org/10.1007/s10071-020-01418-8
Makel, M. C., Plucker, J. A., & Hegarty, B. (2012). Replications in psychology research. Perspectives on Psychological Science, 7(6), 537–542. https://doi.org/10.1177/1745691612460688
McDevitt, M. A, Dunn, R. M., Spetch, M. L., & Ludvig, E. A. (2016). When good news leads to bad choices. Journal of the Experimental Analysis of Behavior, 23–40. https://doi.org/10.1002/jeab.192
McDevitt, M. A., Pisklak, J. M., Dunn, R. M., & Spetch, M. L. (2022). Forced-exposure trials increase suboptimal choice. Psychonomic Bulletin & Review, 29(4), 1514–1523. https://doi.org/10.3758/s13423-022-02092-2
McDevitt, M. A., Spetch, M. L., & Dunn, R. M. (1997). Contiguity and conditioned reinforcement in probabilistic choice. Journal of the Experimental Analysis of Behavior, 68(3), 317–327. https://doi.org/10.1901/jeab.1997.68-317
McDevitt, M. A., Pisklak, J. M., Spetch, M. L., & Dunn, R. M. (2018). The influence of outcome delay on suboptimal choice. Behavioural Processes, 157, 279–285. https://doi.org/10.1016/j.beproc.2018.10.008
Morey, R. D., & Rouder, J. N. (2024). BayesFactor: Computation of Bayes Factors for Common Designs (Version 0.9.12.4.7).
https://CRAN.R-project.org/package=BayesFactor
National Research Council. (2011). Guide for the Care and Use of Laboratory Animals: Eighth Edition. The National Academies Press. https://doi.org/10.17226/12910
Pattison, K. F., Laude, J. R., & Zentall, T. R. (2013). Environmental enrichment affects suboptimal, risky, gambling-like choice by pigeons. Animal Cognition, 16(3), 429–434. https://doi.org/10.1007/s10071-012-0583-x
Pisklak, J. M., McDevitt, M. A., Dunn, R. M., & Spetch, M. L. (2019). Suboptimal choice and initial-link requirement. Journal of the Experimental Analysis of Behavior, 112(3), 242–253. https://doi.org/10.1002/jeab.553
R Core Team. (2024). R: A language and environment for statistical computing. R Foundation for Statistical Computing. Vienna, Austria. https://www.r-project.org/
Sahini, S. N. M., Hazalin, N. A. M. N., Srikumar, B. N., Chellammal, H. S. J., & Singh, G. K. S. (2024). Environmental enrichment improves cognitive function, learning, memory and anxiety-related behaviours in rodent models of dementia: Implications for future study. Neurobiology of Learning and Memory, 208, 107880. https://doi.org/10.1016/j.nlm.2023.107880
Sears, B., Dunn, R. M., Pisklak, J. M., Spetch, M. L., & McDevitt, M. A. (2022). Good news is better than bad news, but bad news is not worse than no news. Learning & Behavior, 50, 482–493. https://doi.org/10.3758/s13420-021-00489-y
Simmons, J., Nelson, L., & Simonsohn, U. (2011). False-positive psychology: Undisclosed flexibility in data collection and analysis allows presenting anything as significant. Psychological Science, 22(11), 1359–1366. https://doi.org/10.1177/0956797611417632
Spetch, M. L., Belke, T. W., Barnet, R. C., Dunn, R. M., & Pierce, W. D. (1990). Suboptimal choice in a percentage-reinforcement procedure: Effects of signal condition and terminal-link length. Journal of the Experimental Analysis of Behavior, 53(2), 219–234. https://doi.org/10 .1901/jeab.1990.53-219
Spetch, M. L., Mondloch, M. V., Belke, T. W., & Dunn, R. M. (1994). Determinants of pigeons’ choice between certain and probabilistic outcomes. Animal Learning & Behavior, 22(3), 239–251. https://doi.org/10 .3758/bf03209832
Stagner, J. P., & Zentall, T. R. (2010). Suboptimal choice behavior by pigeons. Psychonomic Bulletin & Review, 17(3), 412–416. https://doi.org/10.3758/pbr.17.3.412
Vasconcelos, M., Monteiro, T., & Kacelnik, A. (2015). Irrational choice and the
Berrebi, Leizear, Pisklak, and McDevitt | Environmental Enrichment and Forced-Exposure
value of information. Scientific Reports, 5, 13874. https://doi.org/10.1038/srep13874
Vasconcelos, M., Machado, A., & Pandeirada, J. N. (2018). Ultimate explanations and suboptimal choice. Behavioural Processes, 152, 63–72. https://doi.org/10.1016/j.beproc.2018.03.023
Vazire, S., & Holcombe, A. O. (2022). Where are the self-correcting mechanisms in science? Review of General Psychology, 26(2), 212–223. https://doi.org/10.1177/10892680211033912
von Hippel, P. T. (2022). Is psychological science self-correcting? Citations before and after successful and failed replications. Perspectives on Psychological Science, 17(6), 1556–1565. https://doi.org/10.1177/17456916211072525
Wickham, H., Averick, M., Bryan, J., Chang, W., McGowan, L. D., François, R., Grolemund, G., Hayes, A., Henry, L., Hester, J., Kuhn, M., Pedersen, T. L., Miller, E., Bache, S. M., Müller, K., Ooms, J., Robinson, D., Seidel, D. P., Spinu, V., . . Yutani, H. (2019). Welcome to the tidyverse. Journal of Open Source Software, 4(43), 1686. https://doi.org/10.21105/joss.01686
Woodcock, E. A., & Richardson, R. (2000). Effects of environmental enrichment on rate of contextual processing and discriminative ability in adult rats. Neurobiology of Learning and Memory, 73(1), 1–10. https://doi.org/10.1006/nlme.1999.3911
enrichment mitigates PTSD-like behaviors in adult male rats exposed to early life stress by regulating histone acetylation in the hippocampus and amygdala. Journal of Psychiatric Research, 155, 120–136. https://doi.org/10.1016/j.jpsychires.2022.07.067
Zentall, T. R. (2016). Resolving the paradox of suboptimal choice. Journal of Experimental Psychology: Animal Learning and Cognition, 42(1), 1–14. https://doi.org/10.1037/xan0000085
Zentall, T. R., Andrews, D. M., & Case, J. P. (2019). Contrast between what is expected and what occurs increases pigeon’s suboptimal choice. Animal Cognition, 22(1), 81–87. https://doi.org/10.1007/s10071-018-1223-x
Author Note
The present study was preregistered. Preregistered a priori hypotheses can be found at https://osf.io/rvuk5. Data and analysis code can be accessed at https://osf.io/3e24b/ We have no known conflict of interest to disclose.
Data collection was completed by undergraduate students, Isabella Berrebi and Sarah Leizear, in spring 2023. The present study was used for Sarah Leizear’s senior capstone project.
Correspondence concerning this article should be addressed to Isabella Berrebi via email (ilkberrebi@comcast.net).
Effect of Feeding Frequency on Anxiety-Like Behavior and Cortisol Levels in Group-Housed Zebrafish (Danio rerio)
Emma Meekma, Adeel Shafiq, and Maureen L. Petrunich-Rutherford* Department of Psychology, Indiana University
ABSTRACT. As the popularity of the zebrafish (Danio rerio) model increases, it is critically important to establish standardized care (husbandry) procedures. Standardization ensures that subjects are treated similarly, eliminating some variability between laboratories, as has been observed in pharmacological and environmental stress studies. Previous research demonstrated that the feeding regimen of zebrafish modulates stress responses. The current experimental study was designed to clarify the impact of feeding regimen in grouphoused, adult zebrafish by assessing anxietylike behavior and basal (baseline) cortisol levels after fish (N = 36, housed at a density of five fish/liter) were fed either once or twice per day for two weeks. Based on previous research, we hypothesized that zebrafish fed twice daily would demonstrate lower levels of anxietylike behavior (i.e., increased exploration in the novel tank test) and have decreased basal levels of cortisol compared to zebrafish fed once daily. However, there were no significant differences (p > .05) in anxietylike behavior or basal levels of cortisol between the two groups. This suggests that feeding once vs. twice per day in grouphoused fish, at least in the shortterm, had no effect on basal stress responses. It is possible that feeding frequency could impact stress responses with longer habitation in a research facility, although further studies are necessary to clarify. The current findings emphasize the need for a full understanding of how care, including feeding, influences neuroendocrine and behavioral endpoints in zebrafish subjects used in biobehavioral research, an important research area critical for understanding human conditions, such as anxietyrelated disorders.
As of this writing, there are over 57,000 publications indexed in PubMed with the keyword “zebrafish’’ published since 1948. Nearly 65% of these reports were published in the last decade alone. These figures reflect the fact that the number of zebrafish labs have grown exponentially in recent years, including large facilities maintained by the U.S. National Institutes of Health (Kalueff et al., 2014) and the Mayo Clinic (Leveque et al., 2016), among others. The zebrafish (Danio rerio) model is popular for a variety of applicational and practical reasons. There is some similarity between zebrafish and humans in terms of morphological, physiological, and genetic factors (Kachanov et al., 2023; Kalueff et al., 2014). For example, zebrafish have 70 percent of the nucleotide sequence found in humans, sharing 82 percent of diseaserelated genes (Howe et al., 2013). The zebrafish can serve as a model for a variety of human healthrelated conditions
(Adhish & Manjubala, 2023; Cheresiz et al., 2020) as well as in drug and toxicity studies (Bauer et al., 2021; Lachowicz et al., 2021; Rosa et al., 2022). With regards to studying stress responses, zebrafish can be exposed to a variety of stressors to elicit specific behavioral and physiological responses (Eachus et al., 2021; Egan et al., 2009; Steenbergen et al., 2011). Zebrafish exhibit similar anxietylike behavior patterns as rodents when exposed to a new environment (Champagne et al., 2010), which serves as a basis for some popular zebrafish behavior tests, such as the novel tank test or the lightdark test (Blaser & Rosemberg, 2012; Blaser & Gerlai, 2006; Kysil et al., 2017; Wong et al., 2010). Introduction of zebrafish into a novel environment, such as with the novel tank test, initially elicits an instinctual anxietylike behavioral response, which includes freezing or immobility and diving to the bottom compartment of the tank. After habituation, the
subject exhibits less freezing and increased exploration of the rest of the tank (Cachat et al., 2010). Zebrafish also release cortisol in response to stress via a conserved physiological stress response system, the hypothalamicpituitaryinterrenal (HPI) axis, which is homologous to the mammalian hypothalamicpituitaryadrenal (HPA) axis (Alsop & Vijayan, 2009; Wendelaar Bonga, 1997).
The ease with which stress can be induced in this model, however, implies that special care must be taken to avoid introducing stressors with the care and husbandry practices used to maintain zebrafish colonies. The validity and reproducibility of zebrafish studies have been somewhat troubled by the fact that guidelines for the care and use of zebrafish vary between laboratories, institutions, and countries (Varga et al., 2018). Although typical lab practices have been shared in publications (Aleström et al., 2019; Lawrence, 2011; Matthews et al., 2002; Varga, 2016), video protocols (Avdesh et al., 2012; Paige et al., 2014), and in openaccess databases like the Zebrafish Information Network, a standardized diet for laboratory zebrafish has not been established (Fowler et al., 2019), nor has a standardized feeding regimen (i.e., the frequency and timing of feeding) been accepted (Licitra et al., 2024).
Dietary contaminants influence the health and survival of adult and developing zebrafish (Tye & Masino, 2019; Tye et al., 2018); similarly, improper diet may cause significant alterations in zebrafish physical health and behavior. The specific protein and lipid content of the diet may also need to be specifically tailored according to developmental stage (Collins et al., 2021; Fernandes et al., 2016; O’Brine et al., 2015). For example, in one study, two different brands of processed food elicited differential effects on survival rate, embryo viability, and growth in both developing and adult zebrafish (Monteiro et al., 2018). In another example, the effects of two different diets (varying in biotin and avidin content) were compared over 12 weeks. Zebrafish given the control diet (containing no biotin or avidin) had the highest mortality and lowest weight gain, but zebrafish fed a diet containing supplemental biotin but no avidin showed the highest weight gain and lowest mortality (Yossa et al., 2011). Fewer studies have examined whether the frequency of feeding can directly influence specific behavioral measures. Standardization of zebrafish husbandry conditions, such as feeding practices, will help researchers gain a better understanding of behavior regulation and minimize any experimental design issues that increase variability and threaten the reproducibility of behavioral studies (Gerlai, 2019; de Abreu et al., 2024).
One recent study examined both the acute effects of the time lapse between feeding on behavior and the chronic effects of daily feeding frequency on anxietylike
behavior in zebrafish (Dametto et al., 2018). In the acute feeding experiment, zebrafish fed three hours prior to behavioral assessment in the novel tank test demonstrated decreased locomotor activity and a trend toward anxiolysis compared to fish fed 0.5, 6, 12, 24, or 48 hours prior to behavioral testing. In the chronic feeding experiment (fifteen days), fish fed once per day had increased anxietylike behavior compared to fish fed twice per day. Fish fed four or six times per day or only once every other day did not differ in anxietylike behavioral measurements compared to fish fed twice per day. Zebrafish fed once a day also had decreased levels of glucose and glycogen and increased lactate when compared to fish fed twice a day, which indicated that carbohydrate metabolism may be related to behavioral changes observed in the novel tank test (Dametto et al., 2018). Because activity levels and exploratory behavior are linked to energy usage, metabolic changes caused by feeding regimen may impact fish performance in behavioral testing procedures. It is important to note that the zebrafish in chronic feeding study were physically isolated by a mesh barrier in the home tank in order to track the food consumption and body weight of each subject. Thus, although fish were exposed to visual and chemical cues from conspecifics, individual fish were still physically isolated from tank mates. Potentially, isolation could have exacerbated the effect of the feeding regimen on anxietylike behavior. Social isolation has been shown to influence behavior, brain levels of neurotransmitters and metabolites, and cortisol levels, depending on developmental stage and the duration of isolation (Shams et al., 2015, 2017, 2018). As zebrafish are typically housed socially, it is important to discern the impact of feeding frequency on grouphoused fish to better understand the impact of feeding regimen on stress responses.
The purpose of the current study was to investigate the impact of feeding frequency on anxietylike behavior and basal cortisol levels in adult zebrafish housed in standard laboratory housing conditions. There are many methods used to assess anxiety like behavior in the zebrafish model; the novel tank test chosen for the current study is a wellvalidated option (Blaser & Rosemberg, 2012; Kysil et al., 2017; Raymond et al., 2012; Wong et al., 2010). Based on the literature (Dametto et al., 2018), we hypothesized that adult zebrafish fed twice daily would demonstrate lower levels of anxietylike behavior (i.e. increased exploratory behavior in the novel tank test) and have decreased basal levels of cortisol compared to adult zebrafish fed once daily. The results of this study will add to the current body of knowledge regarding the optimum feeding frequency in socially housed fish and may further support the need of a standardized feeding regimen across laboratories.
Anxiety and Cortisol Levels in Zebrafish | Meekma, Shafiq, and Petrunich-Rutherford
Method
Animals
Wild type, adult, mixed sex (approximately 50:50 males:females) zebrafish (total N = 36) were purchased from a commercial supplier (Carolina Biological Supply, Burlington, NC) and were randomly assigned to one of four 1.8L housing tanks upon arrival to the facility (stocking density of 5 fish/L). Subjects were allowed to acclimate to the facility standards for care and feeding for approximately four days before any experimental procedures were initiated (Dhanasiri et al., 2013). All zebrafish were maintained in a twoshelf, standalone zebrafish housing rack purchased from Aquaneering (San Diego, CA) on a 14 h:10 h light:dark cycle (lights on at 6 a.m.), with water kept at 27 ± 1°C and pH of approximately 7.2. Other water quality parameters were measured biweekly, such as ammonia, nitrates, nitrites, alkalinity, and hardness, and were kept constant throughout the experiments. All procedures were conducted according to ethical guidelines (Harper & Lawrence, 2011; National Research Council, 2011; U.S. Department of Agriculture, 2015; Westerfield, 2000) and were in accordance with the Indiana University School of MedicineNW Institutional Animal Care and Use Committee (protocol NW49).
Experimental Procedure
After fish had acclimated to the facility, two of the four tanks (n = 18 total subjects) were chosen at random to be fed twice per day for 14 days. The other two tanks of fish (n = 18 total subjects) served as the facility standard controls of feeding once per day for 14 days. Fish were fed with flake food and dried shrimp ground to a powder with a mortar and pestle. For each feeding, the total food weight administered per fish approximated 4% of the average fish body weight. Fish that were fed once
per day were fed at approximately 9 a.m. each day; fish that were fed twice per day were fed around 9 a.m. and 4 p.m. each day. The fish were not fed on the morning of the behavioral testing. Behavioral testing was conducted on the fifteenth day after the regimen of feeding once or twice per day commenced. On the morning of the behavioral test, home tanks were relabeled and coded by the Principal Investigator to mask the Research Assistants collecting the data to the feeding conditions of each tank. Each coded tank was moved from the system to the experimental room, which had the same illumination and temperature as the housing room. Subjects were allowed to acclimate from the move for about 30 minutes prior to behavioral sampling. Fish from each condition were randomly chosen from the housing tanks, assigned a sample number, and were placed in the novel tank test one at a time to assess anxietylike behavior. Fish were individually euthanized within a minute of completing the sixminute behavioral assay; each was netted from the novel tank and placed in the euthanasia solution without returning to the home tank or any other container. The euthanasia solution consisted of 0.1% clove oil/1% ethanol in system water (American Veterinary Medical Association, 2020; Davis et al., 2015; Wong et al., 2014). Subjects were used for both behavioral and cortisol analyses. Body samples were lightly dried with Kimwipes and stored at 20°C in individual 1.5 ml tubes for wholebody analysis of basal cortisol levels. Behavioral data collection and euthanasia of the subjects occurred between 9:30 a.m. and 12:00 p.m.
Behavioral Assay
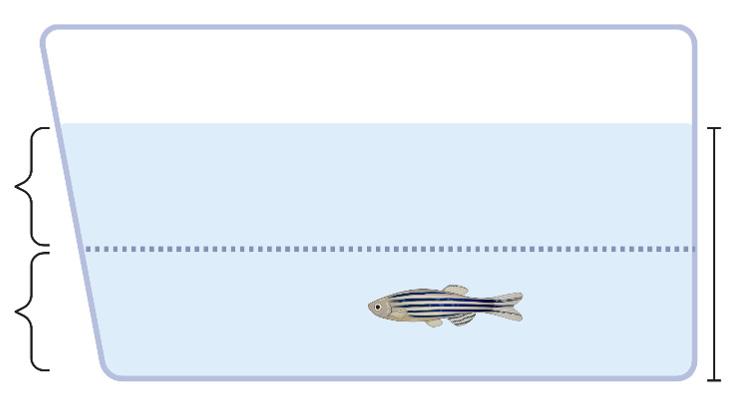
The novel tank test was chosen to assess anxietylike behavior (Blaser & Rosemberg, 2012; Kysil et al., 2017; Raymond et al., 2012; Wong et al., 2010). Fish were individually netted from the home tank and placed into a novel tank with the same size and dimensions as the home tanks (15.2 cm height × 27.9 cm top × 22.5 cm bottom × 7.1 cm width). The top of the tank was defined as the top 50% (approximately 7 cm) of the water column (total approximately 14 cm). See Figure 1 for diagram of novel tank. The first six minutes of behavior of each fish was recorded. Subsequently, BehaviorCloud motiontracking software (Columbus, OH) was used to analyze the following dependent measures: distance in top zone (cm), time in top zone (sec), numbers of entries to top zone, total distance traveled (cm), mean ambulatory speed (cm/s), and immobility (sec).
Cortisol Assay
The cortisol extraction and assay were conducted by modifying previously published procedures (Cachat et al., 2010; Canavello et al., 2011; Egan et al., 2009). In brief, frozen wholebody samples were thawed and then
FIGURE 1
Diagram of Novel Tank Test
Note. This diagram indicates the top and bottom zones of the novel tank used in the current study. Figure was created with BioRender.com.
weighed. Icecold 25 mM phosphatebuffered saline (PBS) buffer was added to each tube; subsequently, each sample was blended using a handheld homogenizer. Diethyl ether was added to the homogenates and were vortexed and centrifuged. After centrifugation, the organic layer containing the cortisol was transferred by a glass pipet to a new test tube. After removal, the ether extraction was done twice more. All ether layers from each sample were collected in a single tube. After, all tubes containing the extracted material were dried with a light stream of air under the fume hood until a yellow oil containing cortisol remained. After the evaporation, PBS was added to the lipidcontaining extract in each tube. Cortisol was quantified via an enzyme linked immunosorbent assay (ELISA) as per the manufacturer’s instructions (Salimetrics, State College, PA) and normalized to the wholebody weight of each subject. Thus, cortisol values are shown in ng cortisol/g tissue.
Statistical Analysis
A priori sample size calculations were conducted using G*Power software (Faul et al., 2007) using the following parameters: d = 1.0, α = .05, power = .90. Effect size was determined by analyzing the provided openaccess raw data on the anxietylike measures in the novel tank test in fish fed either once per day vs. twice per day in a previously published study (Dametto et al., 2018). For all three zonerelated measures in the novel tank test, the provided data indicated an absolute effect size of at least 1.00 (Cohen’s d). Thus, the results comparing these two specific feeding schedules indicate that feeding regimen had a strong effect on zone exploration anxietyrelated measures.
As mentioned previously, the treatments were masked to the research assistants during the data collection and analysis stages. Treatments were unmasked after
statistical analyses were conducted. All dependent measures (behavioral variables and cortisol levels) were first analyzed using Student’s independent sample t tests with feeding regimen as the independent variable. According to Levene’s test, one of the behavioral variables (entries to top) violated the equal variance assumption (p = .028. Thus, all the variables were reanalyzed using Welch’s unequal variance ttests. All data was processed with JASP software (University of Amsterdam, Amsterdam, The Netherlands). Data are presented as group means ± standard errors of the mean. The criterion for statistical significance was set at p < .05.
Cortisol Levels for Zebrafish Fed Once or Twice Per Day
Note. Feeding regimen (once or twice per day for two weeks) did not significantly alter basal whole-body cortisol levels in group-housed, adult zebrafish. Individual observations are indicated on the graph. The height of each bar is the mean and the error bars indicate ± SEM.
Note. Feeding regimen (once or twice per day for two weeks) did not significantly alter (A) distance traveled in the top zone, (B) time spent in the top zone, and (C) number of entries to the top zone in the novel tank test in group-housed, adult zebrafish. Individual observations are indicated on the graph. The height of each bar is the mean and the error bars indicate ± SEM
FIGURE 3
Novel Tank Exploration for Zebrafish Fed Once or Twice Per Day
FIGURE 2
Results
Whole-Body Cortisol Responses
According to Welch’s unequal variance t test, feeding frequency did not significantly affect whole body cortisol levels, t(28.84) = 1.32, p = .20, see Figure 2. It appears that, at least in the short term (14 days), feeding twice per day does not alter basal levels of cortisol in grouphoused zebrafish compared to grouphoused zebrafish fed once per day.
Exploratory Activity in the Novel Tank Test
According to Welch’s unequal variance t test, feeding frequency did not significantly affect distance traveled in the top zone of the novel tank test, t(29.53) = 1.44, p = .16, see Figure 3a. Feeding frequency did not significantly alter time spent in the top zone of the novel tank test, t(26.66) = 0.32, p = .75, see Figure 3b. Feeding frequency also did not alter the number of entries to the top zone of the novel tank test, t(27.99) = 1.39, p = .18, see Figure 3c. Feeding twice per day for two weeks did not significantly alter exploratory measures in the novel tank test in grouphoused zebrafish compared to grouphoused zebrafish fed once per day for two weeks.
Locomotor Activity in the Novel Tank Test
According to Welch’s unequal variance t test, feeding frequency did not significantly affect the total distance traveled, t(33.85) = 0.70, p = .49, and the mean ambulatory speed, t(33.88) = 0.56, p = .58, in the novel tank test, see Figures 4a and 4b, respectively. Fish fed twice per day did not demonstrate any significant differences in the time spent immobile or frozen in the novel tank test, t(33.91) = 1.48, p = .15, see Figure 4c. There does not appear to be any differences between feeding fish once or twice per day on locomotor measures in the novel tank test in grouphoused zebrafish.
Discussion
A need for standardization of husbandry practices has become apparent in zebrafish research (Varga et al., 2018), such as with breeding, feeding, and housing procedures (Tsang et al., 2017; Watts et al., 2016). Stress responses in particular are affected by husbandry practices (Pavlidis et al., 2013), such as prior social history of zebrafish test subjects (Shams et al., 2017) or color of the housing tanks (de Abreu et al., 2020). Different feeding frequencies and housing conditions may create irregular basal stress levels amongst subjects between laboratories, which may markedly affect the impact of acute and chronic stress on a variety of measures. Dysregulated stress responses can ultimately have a number of undesirable downstream effects on health and disease states. Thus, feeding regimen may be a particularly important factor to consider in both the regular care of experimental subjects and in the interpretation of results of stress studies. Developing a uniform or standardized protocol regarding the feeding regimen of zebrafish may help to decrease variability between laboratories, thus producing more reliable and reproducible results in stress research. Contrary to previous research suggesting that feeding once per day was anxiogenic compared to other feeding frequencies (Dametto et al., 2018), the results of the current study suggest that subjects housed and cared for under our typical laboratory onceaday feeding practice did not differ significantly with regards to anxietylike behavior or wholebody cortisol levels compared to fish housed under identical conditions but fed twice per day. Although our results did not support our original hypothesis, the current study helps further elucidate the effects of feeding practices for zebrafish on behavioral and physiological markers of stress. The results here suggest that feeding subjects once per day, at least in the short term, does not produce effects on grouphoused zebrafish that would indicate stress.
FIGURE 4
Motor Activity for Zebrafish Fed Once or Twice Per Day
Methodological differences may contribute to differences between Dametto and colleagues’ work and the current study, namely housing conditions. In the current study, zebrafish were group housed at a density of 5 fish/L in 1.8L tanks. In the previously published study, fish were housed in large (147L) tanks divided into 6L units (1 fish/6L) by a mesh barrier (Dametto et al., 2018). Although the fish had access to visual and chemosecretory cues from conspecifics, it is possible that this housing design elicited isolationlike effects in the subjects. Social isolation has been shown to modulate glucocorticoid levels and the expression of anxietylike behavior in nonhuman primates (Cinini et al., 2014), rodents (Harvey et al., 2019), and zebrafish (Shams et al., 2017). Overcrowding, another stressor associated with housing, can be modulated by feeding schedule (Ramsay et al., 2006). Thus, it is possible that feeding frequency may exacerbate effects of housing conditions on cortisol levels and anxietylike behavior.
In the current study, the sample size used was necessary to detect strong effects elicited by the feeding manipulation, as indicated by a power analysis based on the effect size on the aforementioned published research (Dametto et al., 2018). Anecdotally, the sample size used in the current study (n = 18 per group) meets or exceeds typical sample sizes used in zebrafish stress research. Basal cortisol levels of both groups were within the range of cortisol levels of control groups of studies previously published by our lab. However, the size of the sample might not have been sufficient to identify small effect sizes. Another possible limitation of this study is that subjects may not have been exposed to the different feeding frequencies for a sufficient time period to produce significant differences in physiological and behavioral measures. Zebrafish were subjected to a relatively shortterm alteration in feeding frequency of two weeks. Although fifteen days was adequate time to produce behavioral alterations in physically isolated fish (Dametto et al., 2018), alterations in cortisol levels and anxietylike behavior may be more obvious when feeding schedules are prolonged in socially housed fish. In the current study, subjects fed twice daily demonstrated a nonsignificant but possible trend towards an increase in the top exploration of the novel tank (increased distance traveled and more entries to the top zone compared to fish fed once per day) and less immobility or freezing, indicating a possible trend toward anxiolysis that may be more evident after a longer time held under similar feeding conditions. If the effects of feeding frequency or duration are subtler in socially housed zebrafish than what was observed in this study, a larger sample size would be necessary to detect statistically significant results with a smaller effect size.
This study investigated basal levels of cortisol and anxietylike behavior changes in sociallyhoused zebrafish following feeding frequency of once or twice a day.
Further studies are necessary to determine if feeding frequency modulates responses to acute stress exposure in zebrafish, such as stress induced by acute confinement (Ghisleni et al., 2012), or to chronic stress exposure, such as chronic unpredictable stress exposure (Fulcher et al., 2017; Piato et al., 2011). As it appears that there may be important differences in basal stress responses to feeding frequency between physically isolated vs. socially housed zebrafish, it will be critical moving forward to consider whether feeding frequency can modulate zebrafish responses, especially in combination with other stressors.
This study only investigated two types of feeding schedules (once or twice per day); future studies should investigate alternate feeding schedules (e.g., once every other day or more than two times per day) in sociallyhoused zebrafish, different types of zebrafish diets, sexdependent differences (Fontana et al., 2020; Genario et al., 2020), and different zebrafish strains (Egan et al., 2009) to determine whether these factors contribute to variability in anxietylike behavior and stress hormone responses. The timing of regular zebrafish feeding on stress responses should also be addressed in future studies, as the timing of feeding in zebrafish indicated a possible trend toward anxietylike behavior when subjects were assessed in the novel tank test three hours postfeeding (Dametto et al., 2018). In other fish species, timing of feeding influenced cortisol responses by modulating the synchronization of circadian rhythms (GómezBoronat et al., 2018; Montoya et al., 2010). The possibility of selfregulation of feeding also appears to be another area worthy of further investigation in the zebrafish model, as voluntary feeding decreases basal cortisol levels in the common carp (Klaren et al., 2013).
Further research is needed to standardize zebrafish colony practices across laboratories to better understand the lack of replicability that is sometimes indicated in the literature. A standardized protocol regarding the care, maintenance, and feeding of subjects is important to ensure validity and replicability, particularly in studies investigating stress. Alternatively, if adherence to a standardized protocol is not possible, all details about the care, housing, and feeding of zebrafish should be described in detail in published reports. Given that the zebrafish model is rapidly gaining in popularity for examining variety of human healthrelated conditions (Adhish & Manjubala, 2023; Cheresiz et al., 2020), it is critical that the impact of husbandry factors on behavioral and physiological stress responses are elucidated.
Acknowledgements
This study was supported by the Grant in Aid of Research, Summer Faculty Fellowship, SUBMIT program, and Regional Support Grant from Indiana University and Meekma, Shafiq, and Petrunich-Rutherford
Anxiety and Cortisol Levels in Zebrafish | Meekma, Shafiq, and Petrunich-Rutherford
Indiana University Northwest as well as the Louis Stokes Alliances for Minority Participation program. This material is based upon work supported by the National Science Foundation under Grant No. 1618408. Any opinions, findings, and conclusions or recommendations expressed in this material are those of the author(s) and do not necessarily reflect the views of the National Science Foundation.
References
Adhish, M., & Manjubala, I. (2023). Effectiveness of zebrafish models in understanding human diseases-A review of models. Heliyon, 9(3), e14557. https://doi.org/10.1016/j.heliyon.2023.e14557
Aleström, P., D’Angelo, L., Midtlyng, P. J., Schorderet, D. F., Schulte-Merker, S., Sohm, F., & Warner, S. (2019). Zebrafish: Housing and husbandry recommendations. Laboratory Animals, 23677219869037. https://doi.org/10.1177/0023677219869037
Alsop, D., & Vijayan, M. (2009). The zebrafish stress axis: Molecular fallout from the teleost-specific genome duplication event. General and Comparative Endocrinology, 161(1), 62–66. https://doi.org/10.1016/j.ygcen.2008.09.011
American Veterinary Medical Association. (2020). AVMA Guidelines for the Euthanasia of Animals: 2020 Edition https://www.avma.org/sites/default/ files/2020-01/2020-Euthanasia-Final-1-17-20.pdf
Avdesh, A., Chen, M., Martin-Iverson, M. T., Mondal, A., Ong, D., Rainey-Smith, S., Taddei, K., Lardelli, M., Groth, D. M., Verdile, G., & Martins, R. N. (2012). Regular care and maintenance of a zebrafish (Danio rerio) laboratory: An Introduction. Journal of Visualized Experiments, 69, 4196.
https://doi.org/10.3791/4196
Bauer, B., Mally, A., & Liedtke, D. (2021). Zebrafish embryos and larvae as alternative animal models for toxicity testing. International Journal of Molecular Sciences, 22(24), 13417. https://doi.org/10.3390/ijms222413417
Blaser, R. E., & Rosemberg, D. B. (2012). Measures of anxiety in zebrafish (Danio rerio): Dissociation of black/white preference and novel tank test. PloS One, 7(5), e36931. https://doi.org/10.1371/journal.pone.0036931
Blaser, R., & Gerlai, R. (2006). Behavioral phenotyping in zebrafish: Comparison of three behavioral quantification methods. Behavior Research Methods, 38(3), 456–469. https://link.springer.com/article/10.3758/BF03192800
Cachat, J., Stewart, A., Grossman, L., Gaikwad, S., Kadri, F., Chung, K. M., Wu, N., Wong, K., Roy, S., Suciu, C., Goodspeed, J., Elegante, M., Bartels, B., Elkhayat, S., Tien, D., Tan, J., Denmark, A., Gilder, T., Kyzar, E., … Kalueff, A. V. (2010). Measuring behavioral and endocrine responses to novelty stress in adult zebrafish. Nature Protocols, 5(11), 1786–1799. https://doi.org/10.1038/nprot.2010.140
Canavello, P. R., Cachat, J. M., Beeson, E. C., Laffoon, A. L., Grimes, C., Haymore, W. A. M., Elegante, M. F., Bartels, B. K., Hart, P. C., Elkhayat, S. I., Tien, D. H., Mohnot, S., Amri, H., & Kalueff, A. V. (2011). Measuring endocrine (cortisol) responses of zebrafish to stress. In Zebrafish neurobehavioral protocols (Vol. 51, pp. 135–142). Humana Press. https://link.springer.com/protocol/10.1007/978-1-60761-953-6_11
Champagne, D. L., Hoefnagels, C. C. M., de Kloet, R. E., & Richardson, M. K. (2010). Translating rodent behavioral repertoire to zebrafish (Danio rerio): Relevance for stress research. Behavioural Brain Research, 214(2), 332–342. https://doi.org/10.1016/j.bbr.2010.06.001
Cheresiz, S. V., Volgin, A. D., Kokorina Evsyukova, A., Bashirzade, A. A. O., Demin, K. A., de Abreu, M. S., Amstislavskaya, T. G., & Kalueff, A. V. (2020). Understanding neurobehavioral genetics of zebrafish. Journal of Neurogenetics, 34(2), 203–215. https://doi.org/10.1080/01677063.2019.1698565
Cinini, S. M., Barnabe, G. F., Galvão-Coelho, N., de Medeiros, M. A., Perez-Mendes, P., Sousa, M. B. C., Covolan, L., & Mello, L. E. (2014). Social isolation disrupts hippocampal neurogenesis in young non-human primates. Frontiers in Neuroscience, 8, 45. https://doi.org/10.3389/fnins.2014.00045
Collins, T. A., Cabrera, S., Teets, E., Shaffer, J., & Blaser, B. W. (2021). An optimized zebrafish nursery feeding regimen improves growth rates and labor costs. Zebrafish, 18(6), 346–353. https://doi.org/10.1089/zeb.2021.0030
Dametto, F. S., Fior, D., Idalencio, R., Rosa, J. G. S., Fagundes, M., Marqueze, A., Barreto, R. E., Piato, A., & Barcellos, L. J. G. (2018). Feeding regimen modulates zebrafish behavior. PeerJ, 6, e5343. https://doi.org/10.7717/peerj.5343
Davis, D. J., Klug, J., Hankins, M., Doerr, H. M., Monticelli, S. R., Song, A., Gillespie, C. H., & Bryda, E. C. (2015). Effects of clove oil as a euthanasia agent on blood collection efficiency and serum cortisol levels in Danio rerio.
Journal of the American Association for Laboratory Animal Science: JAALAS, 54(5), 564–567. https://www.ingentaconnect.com/content/aalas/ jaalas/2015/00000054/00000005/art00015
de Abreu, M. S., Giacomini, A. C. V. V., Genario, R., Dos Santos, B. E., Marcon, L., Demin, K. A., & Kalueff, A. V. (2020). The impact of housing environment color on zebrafish anxiety-like behavioral and physiological (cortisol) responses. General and Comparative Endocrinology, 294, 113499. https://doi.org/10.1016/j.ygcen.2020.113499
de Abreu, M., Parker, M. O., & Kalueff, A. V. (2024). Standardizing zebrafish laboratory husbandry to ensure replicability and reproducibility of data in neurobehavioral research. Lab Animal, 53(8), 189–190. https://doi.org/10.1038/s41684-024-01411-5
Dhanasiri, A. K. S., Fernandes, J. M. O., & Kiron, V. (2013). Acclimation of zebrafish to transport stress. Zebrafish, 10(1), 87–98. https://doi.org/10.1089/zeb.2012.0843
Eachus, H., Choi, M.-K., & Ryu, S. (2021). The effects of early life stress on the brain and behaviour: Insights from zebrafish models. Frontiers in Cell and Developmental Biology, 9, 657591. https://doi.org/10.3389/fcell.2021.657591
Egan, R. J., Bergner, C. L., Hart, P. C., Cachat, J. M., Canavello, P. R., Elegante, M. F., Elkhayat, S. I., Bartels, B. K., Tien, A. K., Tien, D. H., Mohnot, S., Beeson, E., Glasgow, E., Amri, H., Zukowska, Z., & Kalueff, A. V. (2009). Understanding behavioral and physiological phenotypes of stress and anxiety in zebrafish. Behavioural Brain Research, 205(1), 38–44. https://doi.org/10.1016/j.bbr.2009.06.022
Faul, F., Erdfelder, E., Lang, A.-G., & Buchner, A. (2007). G*Power 3: A flexible statistical power analysis program for the social, behavioral, and biomedical sciences. Behavior Research Methods, 39(2), 175–191. https://doi.org/10.3758/bf03193146
Fernandes, H., Peres, H., & Carvalho, A. P. (2016). Dietary protein requirement during juvenile growth of zebrafish (Danio rerio). Zebrafish, 13(6), 548–555. https://doi.org/10.1089/zeb.2016.1303
Fontana, B. D., Cleal, M., & Parker, M. O. (2020). Female adult zebrafish (Danio rerio) show higher levels of anxiety‐like behavior than males, but do not differ in learning and memory capacity. European Journal of Neuroscience, 52(1), 2604–2613. https://doi.org/10.1111/ejn.14588
Fowler, L. A., Williams, M. B., Dennis-Cornelius, L. N., Farmer, S., Barry, R. J., Powell, M. L., & Watts, S. A. (2019). Influence of commercial and laboratory diets on growth, body composition, and reproduction in the zebrafish Danio rerio. Zebrafish, 16(6), 508–521. https://doi.org/10.1089/zeb.2019.1742
Fulcher, N., Tran, S., Shams, S., Chatterjee, D., & Gerlai, R. (2017). Neurochemical and behavioral responses to unpredictable chronic mild stress following developmental isolation: The zebrafish as a model for major depression. Zebrafish, 14(1), 23–34. https://doi.org/10.1089/zeb.2016.1295
Genario, R., Giacomini, A. C. V. V., de Abreu, M. S., Marcon, L., Demin, K. A., & Kalueff, A. V. (2020). Sex differences in adult zebrafish anxiolytic-like responses to diazepam and melatonin. Neuroscience Letters, 714, 134548. https://doi.org/10.1016/j.neulet.2019.134548
Gerlai, R. (2019). Reproducibility and replicability in zebrafish behavioral neuroscience research. Pharmacology, Biochemistry, and Behavior, 178, 30–38. https://doi.org/10.1016/j.pbb.2018.02.005
Ghisleni, G., Capiotti, K. M., Da Silva, R. S., Oses, J. P., Piato, Â. L., Soares, V., Bogo, M. R., & Bonan, C. D. (2012). The role of CRH in behavioral responses to acute restraint stress in zebrafish. Progress in Neuro-Psychopharmacology and Biological Psychiatry, 36(1), 176–182. https://doi.org/10.1016/j.pnpbp.2011.08.016
Gómez-Boronat, M., Sáiz, N., Delgado, M. J., de Pedro, N., & Isorna, E. (2018). Time-lag in feeding schedule acts as a stressor that alters circadian oscillators in goldfish. Frontiers in Physiology, 9, 1749. https://doi.org/10.3389/fphys.2018.01749
Harper, C., & Lawrence, C. (2011). The laboratory zebrafish. CRC Press. https://doi.org/10.1201/b13588
Harvey, B. H., Regenass, W., Dreyer, W., & Möller, M. (2019). Social isolation rearing-induced anxiety and response to agomelatine in male and female rats: Role of corticosterone, oxytocin, and vasopressin. Journal of Psychopharmacology (Oxford, England), 33(5), 640–646. https://doi.org/10.1177/0269881119826783
Howe, K., Clark, M. D., Torroja, C. F., Torrance, J., Berthelot, C., Muffato, M., Collins, J. E., Humphray, S., McLaren, K., Matthews, L., McLaren, S., Sealy, I., Caccamo, M., Churcher, C., Scott, C., Barrett, J. C., Koch, R., Rauch, G.-J., White, S., … Stemple, D. L. (2013). The zebrafish reference genome sequence and its relationship to the human genome. Nature, 496(7446), 498–503. https://doi.org/10.1038/nature12111
Kachanov, D., Elistratov, L., Guseinov, H., Balaeva, K., & Popova, N. (2023). A comparative review of the use of Danio rerio (zebrafish) as a model object in preclinical studies. Georgian Medical News, 337, 21–24.
https://europepmc.org/article/med/37354667
Kalueff, A. V., Stewart, A. M., & Gerlai, R. (2014). Zebrafish as an emerging model for studying complex brain disorders. Trends in Pharmacological Sciences, 35(2), 63–75. https://doi.org/10.1016/j.tips.2013.12.002
Klaren, P. H. M., van Dalen, S. C. M., Atsma, W., Spanings, F. A. T., Hendriks, J., & Flik, G. (2013). Voluntary timing of food intake increases weight gain and reduces basal plasma cortisol levels in common carp (Cyprinus carpio L.). Physiology & Behavior, 122, 120–128. https://doi.org/10.1016/j.physbeh.2013.08.020
Kysil, E. V., Meshalkina, D. A., Frick, E. E., Echevarria, D. J., Rosemberg, D. B., Maximino, C., Lima, M. G., Abreu, M. S., Giacomini, A. C., Barcellos, L. J. G., Song, C., & Kalueff, A. V. (2017). Comparative analyses of zebrafish anxietylike behavior using conflict-based novelty tests. Zebrafish, 14(3), 197–208. https://doi.org/10.1089/zeb.2016.1415
Lachowicz, J., Niedziałek, K., Rostkowska, E., Szopa, A., Świąder, K., Szponar, J., & Serefko, A. (2021). Zebrafish as an animal model for testing agents with antidepressant potential. Life (Basel, Switzerland), 11(8), 792. https://doi.org/10.3390/life11080792
Lawrence, C. (2011). Advances in zebrafish husbandry and management. Methods in Cell Biology, 104, 429–451. https://doi.org/10.1016/B978-0-12-374814-0.00023-9
Leveque, R. E., Clark, K. J., & Ekker, S. C. (2016). Mayo Clinic zebrafish facility overview. Zebrafish, 13 Suppl 1, S44–46. https://doi.org/10.1089/zeb.2015.1227
Licitra, R., Fronte, B., Verri, T., Marchese, M., Sangiacomo, C., & Santorelli, F. M. (2024). Zebrafish feed intake: A systematic review for standardizing feeding management in laboratory conditions. Biology, 13(4), 209. https://doi.org/10.3390/biology13040209
Matthews, M., Trevarrow, B., & Matthews, J. (2002). A virtual tour of the guide for zebrafish users. Lab Animal, 31(3), 34–40. https://doi.org/10.1038/5000140
Monteiro, J. F., Martins, S., Farias, M., Costa, T., & Certal, A. C. (2018). The impact of two different cold-extruded feeds and feeding regimens on zebrafish survival, growth and reproductive performance. Journal of Developmental Biology, 6(3). https://doi.org/10.3390/jdb6030015
Montoya, A., López-Olmeda, J. F., Garayzar, A. B. S., & Sánchez-Vázquez, F. J. (2010). Synchronization of daily rhythms of locomotor activity and plasma glucose, cortisol and thyroid hormones to feeding in Gilthead seabream (Sparus aurata) under a light-dark cycle. Physiology & Behavior, 101(1), 101–107. https://doi.org/10.1016/j.physbeh.2010.04.019
National Research Council. (2011). Guide for the care and use of laboratory animals (8th ed.). The National Academies Press. https://grants.nih.gov/ grants/olaw/guide-for-the-care-and-use-of-laboratory-animals.pdf
O’Brine, T. M., Vrtělová, J., Snellgrove, D. L., Davies, S. J., & Sloman, K. A. (2015). Growth, oxygen consumption, and behavioral responses of Danio rerio to variation in dietary protein and lipid levels. Zebrafish, 12(4), 296–304. https://doi.org/10.1089/zeb.2014.1008
Paige, C., Hill, B., Canterbury, J., Sweitzer, S., & Romero-Sandoval, E. A. (2014). Construction of an affordable and easy-to-build zebrafish facility. Journal of Visualized Experiments: JoVE, 93, e51989. https://doi.org/10.3791/51989
Pavlidis, M., Digka, N., Theodoridi, A., Campo, A., Barsakis, K., Skouradakis, G., Samaras, A., & Tsalafouta, A. (2013). Husbandry of zebrafish, Danio rerio, and the cortisol stress response. Zebrafish, 10(4), 524–531. https://doi.org/10.1089/zeb.2012.0819
Piato, Â. L., Capiotti, K. M., Tamborski, A. R., Oses, J. P., Barcellos, L. J. G., Bogo, M. R., Lara, D. R., Vianna, M. R., & Bonan, C. D. (2011). Unpredictable chronic stress model in zebrafish (Danio rerio): Behavioral and physiological responses. Progress in Neuro-Psychopharmacology & Biological Psychiatry, 35(2), 561–567. https://doi.org/10.1016/j.pnpbp.2010.12.018
Ramsay, J. M., Feist, G. W., Varga, Z. M., Westerfield, M., Kent, M. L., & Schreck, C. B. (2006). Whole-body cortisol is an indicator of crowding stress in adult zebrafish, Danio rerio. Aquaculture, 258(1–4), 565–574. https://doi.org/10.1016/j.aquaculture.2006.04.020
Raymond, J., Chanin, S., Stewart, A. M., Kyzar, E., Gaikwad, S., Roth, A., Bruce, I., Fryar, C., Varga, D., Enriquez, J., Bagawandoss, S., Pham, M., Zapolsky, I., Green, J., Desmond, D., Hester, J., & Kalueff, A. V. (2012). Assessing habituation phenotypes in adult zebrafish: Intra-and inter-trial habituation in the novel tank test. Zebrafish Protocols for Neurobehavioral Research, 66, 273–285. Humana Press. https://kaluefflab.com/pdfs/chapters/RaymondHabituation2012.pdf Rosa, J. G. S., Lima, C., & Lopes-Ferreira, M. (2022). Zebrafish larvae behavior models as a tool for drug screenings and pre-clinical trials: A review.
International Journal of Molecular Sciences, 23(12), 6647. https://doi.org/10.3390/ijms23126647
Shams, S., Amlani, S., Buske, C., Chatterjee, D., & Gerlai, R. (2018). Developmental social isolation affects adult behavior, social interaction, and dopamine metabolite levels in zebrafish. Developmental Psychobiology, 60(1), 43–56. https://doi.org/10.1002/dev.21581
Shams, S., Chatterjee, D., & Gerlai, R. (2015). Chronic social isolation affects thigmotaxis and whole-brain serotonin levels in adult zebrafish. Behavioural Brain Research, 292, 283–287. https://doi.org/10.1016/j.bbr.2015.05.061
Shams, S., Seguin, D., Facciol, A., Chatterjee, D., & Gerlai, R. (2017). Effect of social isolation on anxiety-related behaviors, cortisol, and monoamines in adult zebrafish. Behavioral Neuroscience, 131(6), 492–504. https://doi.org/10.1037/bne0000220
Steenbergen, P. J., Richardson, M. K., & Champagne, D. L. (2011). The use of the zebrafish model in stress research. Progress in NeuroPsychopharmacology & Biological Psychiatry, 35(6), 1432–1451. https://doi.org/10.1016/j.pnpbp.2010.10.010
Tsang, B., Zahid, H., Ansari, R., Lee, R. C.-Y., Partap, A., & Gerlai, R. (2017). Breeding zebrafish: A review of different methods and a discussion on standardization. Zebrafish, 14(6), 561–573. https://doi.org/10.1089/zeb.2017.1477
Tye, M., & Masino, M. A. (2019). Dietary contaminants and their effects on zebrafish embryos. Toxics, 7(3). https://doi.org/10.3390/toxics7030046
Tye, M. T., Montgomery, J. E., Hobbs, M. R., Vanpelt, K. T., & Masino, M. A. (2018). An adult zebrafish diet contaminated with chromium reduces the viability of progeny. Zebrafish, 15(2), 179–187. https://doi.org/10.1089/zeb.2017.1514
U.S. Department of Agriculture. (2015). Animal welfare act https://www.govinfo. gov/content/pkg/USCODE-2015-title7/html/USCODE-2015-title7-chap54.htm
Varga, Z. M. (2016). Aquaculture, husbandry, and shipping at the Zebrafish International Resource Center. Methods in Cell Biology, 135, 509–534. https://doi.org/10.1016/bs.mcb.2016.01.007
Varga, Z. M., Ekker, S. C., & Lawrence, C. (2018). Workshop report: Zebrafish and other fish models-description of extrinsic environmental factors for rigorous experiments and reproducible results. Zebrafish, 15(6), 533–535. https://doi.org/10.1089/zeb.2018.29006.zol
Watts, S. A., Lawrence, C., Powell, M., & D’Abramo, L. R. (2016). The vital relationship between nutrition and health in zebrafish. Zebrafish, 13(S1), S72–76. https://doi.org/10.1089/zeb.2016.1299
Wendelaar Bonga, S. E. (1997). The stress response in fish. Physiological Reviews, 77(3), 591–625. https://doi.org/10.1152/physrev.1997.77.3.591
Westerfield, M. (2000). The zebrafish book: A guide for the laboratory use of zebrafish (Danio rerio) (4th ed.). University of Oregon Press. https://zfin.org/zf_info/zfbook/zfbk.html
Wong, D., von Keyserlingk, M. A. G., Richards, J. G., & Weary, D. M. (2014). Conditioned place avoidance of zebrafish (Danio rerio) to three chemicals used for euthanasia and anaesthesia. PloS One, 9(2), e88030. https://doi.org/10.1371/journal.pone.0088030
Wong, K., Elegante, M., Bartels, B., Elkhayat, S., Tien, D., Roy, S., Goodspeed, J., Suciu, C., Tan, J., Grimes, C., Chung, A., Rosenberg, M., Gaikwad, S., Denmark, A., Jackson, A., Kadri, F., Chung, K. M., Stewart, A., Gilder, T., … Kalueff, A. V. (2010). Analyzing habituation responses to novelty in zebrafish (Danio rerio). Behavioural Brain Research, 208(2), 450–457. https://doi.org/10.1016/j.bbr.2009.12.023
Yossa, R., Sarker, P. K., Karanth, S., Ekker, M., & Vandenberg, G. W. (2011). Effects of dietary biotin and avidin on growth, survival, feed conversion, biotin status and gene expression of zebrafish Danio rerio. Comparative Biochemistry and Physiology Part B: Biochemistry and Molecular Biology, 160(4), 150–158. https://doi.org/10.1016/j.cbpb.2011.07.005
Author Note
Maureen L. PetrunichRutherford https://orcid.org/0000000251420457
The first two authors contributed equally to this manuscript. The authors have no known conflicts of interest to declare. Correspondence concerning this article should be addressed to Maureen L. PetrunichRutherford, Indiana University Northwest, Department of Psychology, 3400 Broadway, Gary, Indiana 46408.
Email: mlpetrun@iu.edu
PSubjective Social Status and Ambulatory Blood Pressure Among African American Emerging Adults
Madeleine R. Zilligen1, Nataria T. Joseph*1, Laurel M. Peterson*2
1Department of Psychology, Pepperdine University
2Department of Psychology & Health Studies, Bryn Mawr College
ABSTRACT. Subjective perceptions of social status (SSS) are associated with health. However, the literature on the associations between various indicators of SSS and blood pressure specifically is mixed. We sought to shed light on this mixed literature by examining differential associations between SSS ratings with different social group reference points and ambulatory blood pressure (ABP). We hypothesized that lower SSS ratings would be associated with higher ABP and that these associations would be stronger for those having lower income. A sample of 155 African American emerging adults (72% women) participated in lab visits and ABP monitoring for 2 to 4 days. The MacArthur Scale was used to measure SSS with respect to community (SSSCommunity) and the United States population (SSSUS). Average daytime ABP was calculated. Regressions controlling for covariates found that lower SSSUS was associated with higher systolic and diastolic ABP, b* = .17, p = .043 and b* = .20, p = .048, but SSSCommunity was not. Income moderated the associations between SSSUS (p = .025) and SSSCommunity (p = .003) and diastolic ABP, with SSS being significantly associated with diastolic ABP in those with moderate (SSS US: b * = .23) or high income (SSS US: b * = .39; SSSCommunity: b* = .33). These findings extend the literature on associations between SSS and ABP by demonstrating that, among African American emerging adults, SSS is more strongly associated with ABP among those with higher incomes. Future research should explore biopsychosocial implications of having relatively high income paired with lower SSS.
Keywords: ambulatory blood pressure; community; subjective social status
revious literature has examined the mental and physical health implications of subjective social status (SSS), which is an individual’s perception of their social ranking within a particular social group (Davis, 1956). The preponderance of the empirical work in this area suggests that SSS can influence health and wellbeing to a similar extent as, and independent of, objective socioeconomic status (SES) indicators like income and education (SinghManoux et al., 2005; Zell et al., 2018). SSS selfperceptions are socialcognitive factors that impact mental and physical health through several pathways. Studies have found that harsher SSS self perceptions (i.e., rating oneself as having a lower status within a group) are associated with higher psychological stress and distress and fewer healthpromoting lifestyle behaviors (Robinson et al., 2020; Steen et al., 2020). SSS selfperceptions may induce stress, distress, and unhealthy behaviors because they
Diversity badge earned for conducting research focusing on aspects of diversity.
create a sense of social evaluative threat (i.e., if one believes that the overwhelming majority of a large social group is more socially valued than one’s self, they may feel vulnerable or threatened by that population or that their identity or selfesteem is threatened; Cardel et al., 2020; Dickerson et al., 2004). Social evaluative threat inevitably leads to stress and negative emotions (Dickerson et al., 2004; Dickerson et al., 2009), both of which are associated with negative health outcomes like elevated blood pressure as well as unhealthy behaviors that might influence health parameters like blood pressure (Cundiff et al., 2016; Joseph et al., 2021).
SSS has been assessed with respect to several different referent groups. Specifically, an individual may have perceptions regarding their social standing within their school (SSSSchool), community (SSSCommunity), or country (e.g., SSSUS). It is possible that the group to which one is comparing themself determines the nature and influence of that comparison (Zell et al., 2018). For example, comparing oneself to others in one’s community, however community may be defined, would be considered comparing oneself to a proximal referent (i.e., a member of a community encountered in daily life, either through direct contact or through cultural identification). It is possible that, due to more frequent direct contact or very strong social or cultural identification, proximal referents, such as neighbors or others in ones’ ethnic group, are more salient to the individual than distant referents such as everyone in the country. The greater salience of these proximal comparisons may make them more impactful on an individual’s emotion and behaviors, and, therefore, their health (Wolff et al., 2009).
Interestingly, a meta analysis by Zell and colleagues (Zell et al., 2018), which considered samples of diverse SES compositions, found that SSSUS and SSSCommunity had remarkably similar impacts on physical health outcomes. One of the studies included in the metaanalysis examined the associations between SSS and clinic blood pressure, which is blood pressure assessed within a healthcare office or laboratory. Specifically, that study found that lower SSSUS was associated with lower clinic BP and SSSCommunity was unrelated to clinic BP in a sample of women across diverse SES backgrounds (Ghaed & Gallo, 2007). Another similar study was conducted prior to the metaanalysis but not included in the metaanalysis. That study found that lower SSSUS was associated with higher likelihood of clinic blood pressure elevation, especially among middleaged adults from a wide range of SES backgrounds (Manuck et al., 2010).
Since the metaanalysis, several empirical studies have examined SSS US and SSS Community with respect to their associations with blood pressure. Two
of these studies found that SSSUS was not associated with clinic blood pressure when examining African Americans of diverse SES (Cardel et al., 2020) and when examining community college students from multiple racial backgrounds (Harbison et al., 2019). One study examining late emerging adults of diverse SES (McClain et al., 2022) found that lower SSSUS was only associated with higher clinic systolic blood pressure in Asian American women and higher diastolic blood pressure in African American males. The one study that also examined SSSCommunity found that it was not associated with clinic blood pressure (Cardel et al., 2020). The literature examining associations between SSSUS and SSSCommunity and clinic blood pressure is therefore somewhat mixed, with one study finding that lower SSSUS was associated with higher clinic blood pressure (Manuck et al., 2010), one study finding similarly finding associations in the intuitive directions but only in specific subgroups (McClain et al., 2022), some studies finding no associations (Cardel et al., 2020; Harbison et al., 2019), and one study finding counterintuitive associations, lower SSSUS associated with lower clinic blood pressure (Ghaed & Gallo, 2007). Although several studies have examined SSS and clinic blood pressure, it is important to determine whether SSS is associated with ambulatory blood pressure (ABP; blood pressure assessed using portable equipment worn as a participant engages with their everyday activities), for a number of reasons. First, ABP better reflects the physiological influences of daily life experiences than clinic BP (Kamarck et al., 2002) and some aspects of daily life are heavily influenced by SSS (Russell & Odgers, 2020). Clinic blood pressure may be less sensitive to these SSS differences. Further, ABP better predicts clinical cardiovascular outcomes than clinic blood pressure (Hansen et al., 2006; Kamarck et al., 2002). Only one recent study examined the association between SSS and ABP (Neubert et al., 2022). Using one day of ABP monitoring, Neubert and colleagues (2022) found that neither SSSCommunity nor SSSUS was associated with mean daytime ABP in a German sample of 53 healthy adults in young and middle adulthood, including students and nonstudents with jobs of different levels of occupational prestige. Over a decade prior to this study, using two days of ABP monitoring, Ghaed and Gallo (2007) found that higher SSSCommunity was associated with lower daytime ABP, but that higher SSSUS was associated with higher daytime ABP in a sample of 92 middleaged, married, employed white women of various income levels, in addition to the clinic blood pressure findings from the same study. Therefore, the results of studies comparing SSSCommunity and SSSUS in associating with ABP are also mixed.
It is possible that the mixed nature of this literature is due to associations between SSS ratings and ABP being moderated by other factors, such as objective SES factors. Although some of the previous studies examined whether the association was moderated by gender, ethnicity, or age, none of the previous studies have examined whether the associations are moderated by objective SES itself. Objective SES and SSS are not the same constructs and capture multidimensional, qualitatively different experiences, as demonstrated by studies showing weak correlations between objective SES and SSS (MartinStorey et al., 2018; Zell et al., 2018). Weak correlations support the possibility that someone with above average objective SES may rate themselves as below average on SSS. Nevertheless, the resources associated with above average objective SES (e.g., social capital, access to services, positive and privileged treatment from others, positive emotion boosts from receipt of financial or occupational rewards, perceived control over stress, healthy behavioral patterns; Gallo et al., 2009) might mitigate the social evaluative threat, distress, perceived vulnerability, and selfesteem threats that accompany lower than average SSS, thereby mitigating the association between SSS and blood pressure. Thus, simply controlling for objective SES does not capture how objective resources of money and education influence the extent to which SSS influences ABP. In other words, previous studies have examined whether SSS is associated with ABP independent of objective SES whereas we seek to explore whether the association between SSS and ABP depends on one’s objective SES. The metaanalytic finding that associations between both forms of SSS and various health outcomes are stronger in lower objective SES samples suggests that this may be true for ABP as well (Zell et al., 2018).
Further, none of the aforementioned studies examining associations between SSSUS, SSSCommunity, and ABP had adequate representation of emerging adults or ethnic minority populations like African Americans. It is important to test these associations in African Americans given the complex dynamics between ethnic minority status and SSS, racial/ethnic differences in SSS that suggest that African American young adults have lower SSS than most other racial/ethnic groups, and racial/ethnic blood pressure disparities that suggest that African Americans are at higher risk for higher blood pressure (McClain et al., 2022). Further, a metaanalysis found that SSS was more highly and positively correlated with actual education and income in European Americans than in African Americans (Cundiff et al., 2017). This metaanalysis also found that SSS was more highly and negatively associated with physical health in African Americans compared to European Americans
although different metaanalyses found that lower SSS was less highly associated with hypertension and other cardiovascular disease risk factors and health outcomes in ethnic minority samples (Tang et al., 2016; Zell et al., 2018). Additionally, a recent study found a weaker negative association between SSS and clinic blood pressure in African American males compared to European American males (McClain et al., 2022). Again, a study examining SSS and ABP within a heterogenous African American sample is warranted given this mixed set of background findings.
It is important to test these associations in emerging adults given the complex dynamics of SES and social perception that occur during this developmental phase, with many individuals’ SSS changing from high to low (or vice versa) as they move from adolescence to emerging adulthood depending on whether or not they are still in school and whether circumstances are prompting them to make more realistic SSS appraisals (Goodman et al., 2015). Further,emerging adults’ SSS perceptions seem to have different from the SSS perceptions of adolescents and older adults. Overall, it appears that younger samples like children and adolescents sometimes show smaller associations between SSS and health than older adults (Zell et al., 2018), however, emerging adulthood may be a particularly important time in SSS development. Partly due to social media and partly due to long established developmental patterns, there is a heightened prevalence and influence of social comparison, social class awareness, and identity evaluation in emerging adulthood (Noon et al., 2023; Thomas & Azmitia, 2014). However, little research explores SSS and ABP among emerging adults.
The current study is the first to compare associations between SSSUS, SSSCommunity, and ABP in a sample of African American emerging adults across the objective SES spectrum as moderated by objective SES. Further, the mixed nature of the previous literature regarding SSS rankings and ABP suggests that the association between these two variables is moderated by other factors, with general metaanalytic findings suggesting that objective SES may be one such moderator (Zell et al., 2018). Thus, we hypothesized that more negative SSS perceptions (rating oneself lower either with respect to one’s community or country), would be associated with higher ABP in African American emerging adults, and that these associations would be stronger for those that experience the additional adversity of lower objective SES. We anticipated that these effects would emerge independent of standard demographic (e.g., gender, objective income), health (e.g., BMI), and putative psychosocial (e.g., perceived stress) controls.
Method
Participants
The sample consisted of 155 African American emerging adults (Mage = 24.7, SD = 3.3, 72% women). Participants had no previous history of cardiovascular disease and no major mental or physical health diagnoses.
Procedure
Study procedures were approved by our institutional review board (IRB) prior to data collection. Participants were recruited through various online and print methods, including flyers placed in public spaces, social media posts, and Craigslist. Flyers were posted at community locations, such as churches, recreation centers, and coffee shops in Southern California. Social media posts were created as videos, flyers, and reels on Facebook, Instagram, and TikTok. Participants were also recruited through word of mouth.
Participants were screened over the phone and during their first lab visit. They were screened for previous history of cardiovascular disease, mental health diagnoses, and various living situations, such as working overnight, that could potentially present as confounding variables. Further, anyone younger than 18 or older than 30 was excluded from participating. Informed consent was obtained: researchers explained the study and the minimal risks associated with it and participants were allowed to read the consent form and ask questions.
When arriving in the lab, participants were greeted by two researchers. As part of this comprehensive ecological momentary assessment (EMA) and ABP study, the participants completed an extensive set of questionnaires and had their blood pressure measured according to best practices outlined by the American Heart Association Council on High Blood Pressure Research (Pickering et al., 2005). They then completed the monitoring period over a fiveday period consisting of two 2day ambulatory blood pressure monitoring days and one rest day in the middle. The participants then returned to the lab to complete another set of questionnaires and debriefing. Participants were all compensated for their participation. Those that completed the full protocol, including at least 80% compliance with the EMA and ABP monitoring, were compensated $165. Participants that did not complete the full study received compensation according to the portions that they did complete.
Measures
Demographics
Participants selfreported their age, gender, years of education, and household income, including any financial support from parents and other family members.
Biological and Psychosocial Covariates
Body mass index (BMI) was assessed using height and weight measured at the first laboratory appointment (lbs/inches2 × 703). Clinic blood pressure was assessed using the average of two readings taken at the first laboratory appointment using the standard recommended protocol (Pickering et al., 2005). Participants with clinically elevated blood pressure at the first laboratory visit were informed of this elevation, provided with recommendations for following up with a provider, and excluded from further participation. Perceived stress was assessed using total score on the perceived stress scale (PSS; Cohen et al., 1983), which is a 14item questionnaire querying the extent to which, in the past year, a participant perceived that life’s circumstances were stressful, i.e., overwhelming, difficult to control, or difficult to cope with. Response options on this scale ranged from 1 (never) to 5 (very often). This scale has internal consistency and testretest reliability as well as good construct validity (Cohen et al., 1983; Örücü et al., 2009). In the current sample, Cronbach’s alpha was .76. Negative emotion was assessed using total score on the negative emotion subscale of the Positive and Negative Affect Scale (PANAS; Watson & Clark, 1999), which is a 10item subscale querying the extent to which, in the past week, a participant felt a number of negative emotions (e.g., “afraid”, “ashamed”, “irritable”, “upset”). Response options on this scale ranged from 1 (very slightly or not at all) to 5 (extremely). This scale has shown good reliability and validity (Felt et al., 1999). In the current sample, Cronbach’s alpha was .82.
Subjective Social Status
The MacArthur Scale of Subjective Social Status was used to assess SSS (Alder et al., 2000; Alder & Stewart, 2007). This scale consists of a 10 rung ladder and instructions to place an X on the ladder rung that corresponds to where the person perceives themself to stand within a particular social group. They are further told that standing on this ladder is based on education, income, and occupational prestige. Higher placement of the X indicates higher perceived social ranking relative to those in the social group being referenced. SSSUS was assessed by instructing participants to compare themself to all individuals in the United States. SSSCommunity was assessed by instructing participants to compare themselves to others in their “community.” Participants were allowed to define for themselves what that community or social group was for them. The MacArthur Scale of SSS has shown construct validity, including appropriate convergent and discriminant validity relative to measures of objective social status, and acceptable testretest reliability (Cundiff et al., 2013; Giatti et al., 2012).
Ambulatory Blood Pressure
ABP was assessed using the Oscar 2 monitor (Suntech Medical). Each participant was trained to use the Oscar and practiced wearing it prior to the start of the monitoring period. Participants wore the Oscar monitor for either two days or four days, i.e., two sets of twoday periods with a oneday break in between1. The Oscar monitors were programmed to take readings
1Average ABP did not differ between participants following the twoday protocol and those following the fourday protocol. Average ABP also did not differ between the two separate twoday periods of those following the fourday protocol.
Sample Descriptives (N = 155)
hourly. Average ABP was calculated for each participant by calculating a mean of their blood pressure readings taken during their waking hours.
Statistical Analyses
We first conducted bivariate correlations between primary study variables and potential covariates. In addition to standard assessment of bivariate associations, these correlations were also used to determine which potential psychosocial covariates (perceived stress or negative emotion) to enter as a covariate given the likely high correlation and overlap between perceived stress and negative emotion. Although either could potentially play a role in the association between SSS and ABP, we decided a priori to only enter the one that was most strongly correlated with SSS and ABP to avoid multicollinearity. We next conducted three multiple linear regression steps for each SSS indicator and each ABP outcome. At each step, all a priori determined hypothesized variables and covariates were entered simultaneously. The first step included the main effect of the respective SSS indicator and ABP indicator controlling for age, gender, and household income. The next step included the main effect of the respective SSS indicator and ABP indicator controlling for age, gender, household income, BMI, and the psychosocial indicator selected based on bivariate correlations. The final step included the main effect of the respective SSS indicator and ABP indicator controlling for age, gender, household income, BMI, and the psychosocial indicator selected based on bivariate correlations and an interaction term between the respective SSS indicator and income with both variables centered prior to creation of the interaction term. Significant interactions were probed with follow up simple slopes and Johnson–Neyman regions of significance moderation analyses conducted in PROCESS v4.2 (Model 1, 95% confidence intervals, 5000 bootstrap samples).
Results
Participants ranked themselves on average around the fifth rung of the SSSUS (M = 5.0) (i.e., participants saw themselves as close to average in social ranking relative to others in the US) and rankings fell within two rungs of the fifth rung (SD = 1.7). Additionally, on the SSSCommunity, participants had a similar response, ranking on average around the sixth rung (M = 5.7) and falling within two rungs of this average (SD = 1.9). Systolic ABP averaged approximately 130 millimeters of mercury (mmHg; SD = 13.2). Diastolic ABP averaged approximately 74 mmHg (SD = 7.1). Please see Table 1 for a full description of the study sample.
and SSSCommunity were highly correlated
TABLE 1
TABLE 2
Zilligen, Joseph, and Peterson | Subjective Social Status and Blood Pressure
(Spearman’s rho = .55, p < .001). SSSUS was positively correlated with household income (Spearman’s rho = .31, p < .001) whereas SSSCM was not (Spearman’s rho = .15, p = .05). Household income (i.e., objective SES) was not associated with ABP, ps > .51. SSSUS was associated with both systolic ABP (Spearman’s rho = .22, p = .007) and diastolic ABP (Spearman’s rho = .18, p = .029) whereas SSSCommunity was not associated with either ABP measure, ps > .24. For potential psychosocial covariates, perceived stress was negatively correlated with SSSUS (Spearman’s rho = .26, p < .001) and SSSCommunity (Spearman’s rho = .16, p = .04) as well as systolic ABP (Spearman’s rho = .17, p = .04) whereas negative emotion was associated with neither indicators of SSS nor BP, ps > .06; therefore, primary analyses only controlled for perceived stress. Further, clinic blood pressure was not associated with either SSS indicator, ps > .49. Please see Table 2 for bivariate correlations between all primary variables and covariates.
Primary Results
Systolic ABP
Regressions controlling for age, gender, household income, BMI, and perceived stress found that lower SSSUS was associated with higher systolic ABP, b* = .17, p = .043, partial h2 = .025, but SSSCommunity was not, p = .83. Income did not moderate the association between either SSS indicator and systolic ABP (ps > .16). BMI and perceived stress did not emerge as significant predictors in any of the multiple regression models, ps > .13.
Diastolic ABP
Regressions controlling for age, gender, household income, BMI, and perceived stress found that lower SSSUS was associated with higher diastolic ABP, b* = .20, p = .048, partial h2 = .023, but SSSCommunity was not, p = .69. Income moderated the associations between SSSUS and diastolic ABP and SSSCommunity and diastolic ABP, F (1, 149) = 5.14, p = .025, adjusted R2change = .03 and F(1, 149) = 9.42, p = .003, adjusted R 2 change = .06, respectively. Simple slopes analyses found that SSSUS was only significantly associated with diastolic ABP in those with moderate and high household income, b * = .23, p = .01 and b * = .39, p = .001, respectively and SSSCommunity was only significantly associated with diastolic ABP in those with high household income, b* = .33, p = .002. These associations were in the intuitive direction, i.e., higher SSS was associated with lower ABP. Johnson–Neyman regions of significance results showed that the top 68.42% of household income scores significantly moderated the effect of SSSUS on diastolic ABP and the top 41.51% of household income scores significantly moderated
the effect of SSSCommunity on diastolic ABP. Please see Figure 1 for an illustration of the significant SSSCommunity X Household Income interaction. BMI and perceived stress did not emerge as significant predictors in any of the multiple regression models, ps > .27. Please see Table 3 for regression results at each analytic step2.
Discussion
In the first ABP study to test an objective SES moderating factor on the association between SSS and ABP, the findings of this study demonstrate that SSSUS and SSSCommunity are more highly associated with diastolic ABP in those with higher objective SES in a sample of African American emerging adults. Among those with high household income, higher SSS US and higher SSSCommunity are associated with lower diastolic ABP. Specifically, in these groups, for every rung an individual rated themself lower on the SSSUS scale, diastolic ABP was 12 millimeters of mercury higher. Small to moderate effect sizes found are comparable to those found between other biopsychosocial factors and blood pressure (Euteneuer et al., 2019; Joseph et al., 2016). These results shed light on the mixed findings in the literature. Previous ABP studies of this association were relatively underpowered to test interactions and did not conceptualize any moderated associations.
2 Results are functionally the same when controlling for years of education instead of household income. Years of education and income were not controlled in simultaneous regressions in order to avoid multicollinearity.
Subjective and Objective Social Status Associations With Diastolic Blood Pressure
Patterns of interactions in the current study suggest that moderate to high income, low SSS individuals have worse diastolic ABP levels compared to moderate to highincome, high SSS individuals. Inherent in this pattern is that high income individuals were not as protected from the negative sequela of low SSS as theory would have suggested and as we hypothesized. It is possible that some emerging adults with high objective SES rated themselves as having lower than average SSS due to pessimism or cognitive vulnerabilities that make them more prone to negative perceptions, both of which are underlying traits associated with higher blood pressure (Felt et al., 2023). Emerging adults from high income families may also have more pressure to achieve success and higher standards by which to subjectively compare themselves (Mahatmya & Smith, 2017), all of which could increase blood pressure. It is also possible that, although objective SES in emerging adults is still heavily influenced by family SES, emerging adults are conceptualizing their personal SSS without respect to their family’s standing. The fact that household income and SSS were not strongly correlated in this sample supports this notion. Additionally, a longitudinal study of participants as they aged from adolescence through emerging adulthood demonstrated that African Americans and those who are no longer enrolled in school were more likely to move from high SSS reporting to low SSS reporting through this time period and that those whose SSS decreased in this way were more likely to exhibit higher BMI, even compared to those with consistently low SSS and especially among African Americans (Goodman et al., 2015). This very compelling pattern of developmental findings points to one additional possible explanation for why African American emerging adults with moderate
to high household income were still impacted when they reported lower SSS and those with low household income were not as impacted by SSS.
The unmoderated association between SSSUS and systolic ABP contrasts with the previous ABP literature, suggesting either no association between SSSUS and ABP (Neubert et al., 2022) or a counterintuitive association of lower SSSUS being associated with lower ABP (Ghaed & Gallo, 2007). Differential results could be due to the different age, gender, and race/ethnicity compositions of these previous samples. The current study is the first to examine associations between SSSUS and ABP in a sample of African American emerging adults across the SES spectrum. Saban et al. (2019) found that SSSUS was associated with resilience and perceptions of social support in older African American adults, which could possibly explain the findings in this African American sample. It is also possible that emerging adults in this group, as they strive to find their place in the social sphere, are striving towards success as defined in social media or other national arenas, and therefore, relative to older samples, become more distressed by adverse social comparisons to those across the country (or even the globe), which could possibly explain the findings in this emerging adult sample.
It is interesting that lower SSS US was directly associated with higher systolic ABP despite household income (objective indicator of SES) not being directly associated with systolic ABP. It is possible that stigmatized racial/ethnic groups and emerging adults weigh things other than income and education more heavily in assessing their SSS, including psychological resilience, support from those around them, interpersonal interactions, counterfactual thinking (“if only I had…”), and
TABLE 3
Multiple Linear Regression Results
Zilligen, Joseph, and Peterson | Subjective Social Status and Blood Pressure
anticipated opportunities in the future (Euteneuer et al., 2019; MartinStorey et al., 2018; Saban et al., 2019). So, systolic ABP findings suggest that the rich, additional life experiences captured by SSS may more directly influence ABP than objective amounts of money.
Some strengths of this study include the joint exploration of SSSUS and SSSCommunity together with ABP as well as examining a previously understudied population and objective SES as a moderator. The focus on a specific population in regards to both scales allows for further specification within the literature of SSS, which has been not only mixed but had limited generalizability to the current population under study. This study was robust in many ways, filled gaps in the literature, and considers ABP, a robust measurement with strong correlations to health risks including stroke and mortality. Further, we utilized 2 and 4 days of ABP monitoring whereas the two other studies on this topic used 1 or 2 days of monitoring (Ghaed & Gallo, 2007; Neubert et al., 2022).
Implications
Better understanding the complex health related influences of different versions of SSS in African American emerging adults has important implications for clinical intervention. For example, if SSSUS and SSS Community truly are more impactful for the health of African American emerging adults with moderate or higher household income, it would be important that behavioral health interventions target these very specific perceptions and the appraisals that influence these impressions in those with moderate to high household income. Our study, when interpreted alongside experimental studies demonstrating that those led to perceive themselves as being of higher social ranking exhibit lower clinic blood pressure than those led to perceive themselves as being of lower social ranking (Cundiff et al., 2016), suggests that social status perceptions are modifiable and a potential concept for health intervention. Social status perceptions may be modified by changing or expanding the social reference points to which individuals compare themselves, helping individuals reappraise whether comparison is even helpful, and helping individuals to use comparison in an aspirational way that is more healthy and less threatening. Further, given that our findings were uncovered within emerging adults, college curriculum developers and college counseling and health centers might consider addressing these modifiable social comparisons and perceptions within the college setting.
Further, this study will hopefully lead to diversification in research regarding SSS, including comparing differential implications in different subgroups such
as those in different countries and people of different occupations for example. It would be fascinating to observe how SSS, both US and Community, continue to compare and contrast against each other in studies including other health correlates. Thematic studies of associations between values, community identification, feelings of belongingness, and associations with health and SSS could also shed light on themes of social comparison and sociocultural impacts on selfperception and health. The current study found that SSSUS was more strongly associated with household income than SSSCommunity, which aligns with metaanalytic findings (Zell et al., 2018).
Limitations
The study is not without limitations. A limitation for this study is that we recruited participants as a convenience sample, and therefore the study is less generalizable to the general emerging adult population, which would impact our external validity. For example, the sample was composed of substantially more women than men. It is possible that the associations found in this sample would be more or less strong in women alone or men alone, but this possibility is something that needs to be empirically tested. Additionally, we were not able to control for all possible confounding variables, such as depression and anxiety, but we did exclude those who were experiencing clinically significant or diagnosed mental illnesses from participating. Lastly, the data collected was cross sectional in nature, and no direct manipulation or experimentation was performed. Although it is logical to assume that it is more likely for SES and SSS to influence ABP than ABP influence them, we cannot infer causal relationships between SSS, income, and BP.
Future Directions
To our knowledge, there is no other literature investigating these exact relationships among SSS, income, and ABP among other racial/ethnic groups. Considering the nuanced implications for comparisons among many distinct cultures and racial groupings, further research should investigate how health outcomes are affected by different definitions of community and dynamic cultures, contexts and pressures placed on various groups. The mixed findings in the literature regarding SSS thus far seem to suggest that the dynamics of SSS and identity are incredibly nuanced, as different demographic groups in different nations with different definitions of community may produce mixed results. Therefore, it is of great importance to consider each population within its present context to maximize understanding of the health and functioning of the diverse individuals
Subjective Social Status and Blood Pressure | Zilligen, Joseph, and Peterson
and rich communities across multiple cultural settings. No cultural setting or distinctive community should go unconsidered or underresearched, as it is especially shown in the mixed SSS literature that community definitions and impacts on health cannot be generalized. Further, there is room to establish an even more comprehensive picture of cardiovascular activity in relation to SSS by examining other outcomes such as heart rate variability.
Concluding Remarks
Despite limitations, this article is a strong contribution to the literature. The current study clarifies and extends the literature on associations between SSS and ABP by demonstrating for the first time that, among African American emerging adults, both SSS US and SSSCommunity are more strongly associated with diastolic ABP in those with higher household incomes and that SSSUS is associated with systolic ABP. Future research should explore additional nuances in these relationships, including indepth examinations of the biopsychosocial implications of having relatively high income but rating one’s self as somewhat lower on social status. The way human beings see themselves in the world clearly has implications for the functioning of their bodies. There is much left to examine, and this is a very important area of research as selfperceptions color every second of life.
References
Adler, N. E., Epel, E. S., & Castellazzo, G., & Ickovics, J. R. (2000). Relationship of subjective and objective social status with psychological and physiological functioning: Preliminary data in healthy white women. Health Psychology, 19, 586–592. https://doi.org/10.1037/0278-6133.19.6.586
Adler, N. E., & Stewart, J. (2007). The MacArthur Scale of Subjective Social Status. https://sparqtools.org/mobility-measure/macarthur-scale-of-subjectivesocial-status-adult-version/
Cardel, M. I., Guo, Y., Sims, M., Dulin, A., Miller, D., Chi, X., C., Pavela, G., DeBoer, M. D., & Gurka, M. J. (2020). Objective and subjective socioeconomic status associated with metabolic syndrome severity among African American adults in the Jackson Heart Study. Psychoneuroendocrinology, 117. https://doi.org/10.1016/j.psyneuen.2020.104686
Cohen, S., Kamarck, T., & Mermelstein, R. (1983). A global measure of perceived stress. Journal of Health and Social Behavior, 385–396. https://doi,org/10.2307/2136404
Cundiff, J. M., Smith, T. W., Baron, C. E., & Uchino, B. N. (2016). Hierarchy and health: Physiological effects of interpersonal experiences associated with socioeconomic position. Health Psychology, 35(4), 356–365. https://dx.doi.org/10.1037/hea0000227
Cundiff, J. M., Smith, T. W., Uchino, B. N., & Berg, C. A. (2013). Subjective social status: construct validity and associations with psychosocial vulnerability and selfrated health. International Journal of Behavioral Medicine, 20, 148–158. https://doi.org/10/1007/s12529-011-9206-1
Cundiff, J. M., & Matthews, K. A. (2017). Is subjective social status a unique correlate of physical health? A meta-analysis. Health Psychology, 12, 1109. https://doi.org/10.1037/hea0000534
Davis, J. A. (1956). Status symbols and the measurement of status perception. Sociology, 19(3), 154–165. https://doi.org/10.2307/2785629
Dickerson, S. S., Gable, S. L., Irwin, M. R., Aziz, N., & Kemeny, M. E. (2009). Socialevaluative threat and proinflammatory cytokine regulation: an experimental laboratory investigation. Psychological Science, 20(10), 1237–1244.
Dickerson, S. S., Gruenewald, T. L., & Kemeny, M. E. (2004). When the social self is
threatened: Shame, physiology, and health. Journal of Personality, 72(6), 1191–1216. https://doi.org/10.1111/j.1467-6494.2004.00295.x
Euteneuer, F., Schaefer, S. J., Neubert, M., Rief, W., & Suessenbach, P. (2019). What if I had not fallen from grace? Psychological distress and the gap between factual and counterfactual subjective social status. Stress & Health, 35 675–680. https://doi.org/10.1002/smi.2892
Felt, J. M., Russell, M. A., Johnson, J. A., Ruiz, J. M., Uchino, B. N., Allison, M., Smith, T. W., Taylor, D. J., Ahn, C., & Smyth, J. (2023). Within-person associations of optimistic and pessimistic expectations with momentary stress, affect, and ambulatory blood pressure. Anxiety, Stress, and Coping, 36(5), 636–648. https://doi.org/10.1080/10615806.2022.2142574
Gallo, L. C., Espinosa de los Monteros, K. E., & Shivpuri, S. (2009). Socioeconomic status and health: What is the role of reserve capacity? Current Directions in Psychological Science, 18, 269–274. https://doi.org/10.1111/j.1467-8721.2009.01650.x
Ghaed, S. G., & Gallo, L. C. (2007). Subjective social status, objective socioeconomic status, and cardiovascular risk in women. Health Psychology, 26(6), 668–674. https://doi.org/10.1037/0278-6133.26.6.668
Giatti, L., Camelo, L., Rodrigues, J., & Barreto, S. (2012). Reliability of the MacArthur scale of subjective social status - Brazilian Longitudinal Study of Adult Health (ELSA-Brasil). BMC Public Health, 12, 1096. https://doi.org/10.1186/1471-2458-12-1096
Goodman, E., Maxwell, S., Malspeis, S., & Adler, N. (2015). Developmental trajectories of subjective social status. Pediatrics, 136, 3. https://doi.org/10.1542/peds.2015-1300
Hansen, T. W., Jeppesen, J., Rasmussen, S., Ibsen, H., & Torp-Pedersen, C. (2006). Ambulatory blood pressure monitoring and risk of cardiovascular disease: a population based study. American Journal of Hypertension, 19, 243–250. https://doi.org/10.1016/j.amjhyper.2005.09.018
Harbison, B. R., Pössel, P., & Roane, S. J. (2019). Relations of subjective social status and brooding with blood pressure. International Journal of Behavioral Medicine, 26, 278–285. https://doi.org/10.1007/s12529-019-09784-5
Joseph, N. T., Chow, E., Peterson, L., Kamarck, T., Clinton, M., & DeBruin, M. (2021). What can we learn from over 140,000 moments of EMA-assessed negative emotion and ambulatory blood pressure?: A systematic review and metaanalysis. Psychosomatic Medicine, 83(7), 746–755. https://doi.org/10.1016/j.socscimed.2024.116699
Joseph, N. T., Muldoon, M. F., Manuck, S. B., Matthews, K. A., & Kamarck, T. W. (2016). The role of occupational status in the association between job strain and ambulatory blood pressure during working and nonworking days. Psychosomatic Medicine, 78(8), 940–949. https://doi.org/10.1097/PSY.0000000000000349
Kamarck, T. W., Janicki, D. L., Shiffman, S., Polk, D.E., Muldoon, M.F., Liebernauer, L.L., & Schwartz, J. E. (2002). Psychosocial demands and ambulatory blood pressure: A field assessment approach. Physiology & Behaviour, 77, 699–704. https://doi.org/10.1016/S0031-9384(02)00921-6
Mahatmya, D., & Smith, A. (2017). Family and neighborhood influences on meeting college expectations in emerging adulthood. Emerging Adulthood, 5(3), 164–176. https://doi.org/10.1177/2167696816663833
Manuck, S. B., Phillips, J. E., Gianaros, P. J., Flory, J. D., & Muldoon, M. F. (2010). Subjective socioeconomic status and presence of the metabolic syndrome in midlife community volunteers. Psychosomatic Medicine, 72, 35–45. https://doi.org/10.1097/PSY.0b013e3181c484dc
Martin-Storey, A., Marcellin, S., Purtell, K. M., Tougas, A. M., & Lessard, A. (2018). It’s about having money, but also happiness: A qualitative investigation of how adolescents understand subjective status in themselves and others. Journal of Adolescence, 68, 198–206. https://doi.org/10.1016/j.adolescence.2018.08.004
McClain, A. C., Gallo, L. C., & Mattei, J. (2022). Subjective social status and cardiometabolic risk markers by intersectionality of race/ethnicity and sex among U.S. young adults. Annals of Behavioral Medicine, 56(5), 442–460. https://doi.org/10.1093/abm/kaab025
Neubert, M., Süssenbach, P., & Euteneuer, F. (2022). Subjective social status and nocturnal blood pressure dipping. Journal of Psychosomatic Research, 163, 111065. https://doi.org/10.1016/j.jpsychores.2022.111065
Noon, E. J., Vranken, I., & Schreurs, L. (2023). Age matters? The moderating effect of age on the longitudinal relationship between upward and downward comparisons on Instagram and identity processes during emerging adulthood. Emerging Adulthood, 11(2), 288–302. https://doi.org/10.1177.21676968221098293
Örücü M. Ç., & Demir, A. (2009). Psychometric evaluation of perceived stress scale for Turkish university students. Stress and Health, 25(1), 103–109.
Zilligen, Joseph, and Peterson | Subjective Social Status and Blood Pressure
https://doi.org/10.1002/smi.1218
Pickering, T. G., Hall, J. E., Appel, L. J., Falkner, B. E., Graves, J., Hill, M. N., Jones, D. W., Kurtz, T., Sheps, S. G., & Roccella, E. J. (2005). Recommendations for blood pressure measurement in humans and experimental animals: Part 1: Blood pressure measurement in humans: A statement for professionals from the Subcommittee of Professional and Public Education of the American Heart Association Council on High Blood Pressure Research. Circulation, 111(5), 697–716. https://doi.org/10.1161/01.CIR.0000154900.76284.F6
Robinson, E., Haynes, A., Sutin, A., & Daly, M. (2020). Self perception of overweight and obesity: A review of mental and physical health outcomes. Obesity Science & Practice, 6, 552–561. https://doi.org/10.1002/osp4.424
Russell, M. A., & Odgers, C. L. (2020). Adolescents’ subjective social status predicts day-to-day mental health and future substance use. Journal of Research on Adolescence, 30, 532–544. https://doi.org/10.1111/jora.12496
Saban, K. L., Tell, D., & Janusek, L. (2019). Resilience in African American women at risk for cardiovascular disease: An exploratory study. Journal of Urban Health, 96, 44–49. https://doi.org/10.1007/s11524-018-00334-0
Singh-Manoux, A., Marmot, M. G., & Adler, N. E. (2005). Does subjective social status predict health and change in health status better than objective status? Psychosomatic Medicine, 67(6), 855–861. https://doi.org/10.1097/01.psy.0000188434.52941.a0
Steen, P. B., Poulsen, P. H., Andersen, J. H., & Biering, K. (2020). Subjective social status is an important determinant of perceived stress among adolescents: A cross-sectional study. BMC Public Health, 20(1). https://doi.org/10.1186/s12889-020-08509-8
Tang, K. L., Rashid, R., Godley, J., & Ghali, W. A. (2016). Association between subjective social status and cardiovascular disease and cardiovascular
risk factors: A systematic review and meta-analysis. BMJ Open, 6. https://doi.org/10.1136/bmjopen-2015-010137
Thomas, V., & Azmitia, M. (2014). Does class matter? The centrality and meaning of social class identity in emerging adulthood. Identity, 14(3), 195–213. https://doi.org/10.1080/15283488.2014.921171
Watson, D., & Clark, L. A. (1999). The PANAS-X: Manual for the Positive and Negative Affect Schedule–Expanded Form. https://doi.org/10.17077/48vt-m4t2
Wolff, L. S., Acevedo-Garcia, D., Subrmanian, S. V., Weber, D., & Kawachi, I. (2009). Subjective social status, a new measure in health disparities research: Do race/ethnicity and choice of referent group matter? Journal of Health Psychology, 15(4), 560–574. https://doi.org/10.1177/1359105309354345
Zell, E., Strickhouser, J. E., & Krizan, Z. (2018). Subjective social status and health: A meta-analysis of community and society ladders. Health Psychology, 37(10), 979–987. https://doi.org/10.1037/hea0000667
Author Note
Madeleine R. Zilligen is now at Positive Momentum ABA, Denver, Colorado.
The authors have no competing interests or conflicts of interest to disclose. This research was supported by a National Institutes of Health Grant R15 MD01273001 awarded to Nataria Joseph. Correspondence concerning this article should be addressed to Madeleine Zilligen, Department of Psychology, Pepperdine University, 24255 Pacific Coast Avenue, Malibu, CA, 90263, United States.
Email: maddy.zilligen@gmail.com
PAttitudes Towards Psilocybin: A General Population’s Opinions on Psilocybin and Psilocybin-Assisted Therapies
Madison M. H. Simounet and Joy R. Drinnon* Department of Psychology, Milligan University
ABSTRACT. Psilocybin-assisted therapies (PAT) have been used to treat several issues including obsessive-compulsive disorder (OCD), major depressive disorder (MDD), posttraumatic stress disorder (PTSD), smoking addiction, and anxiety (Grob et al., 2011; Johnson et al., 2014; Kisely et a., 2022; Moreno et al., 2006). If more positive benefits of psilocybin are discovered, psilocybin could become a more mainstream treatment option. Due to this possibility, it is important to understand people’s beliefs about psilocybin and PAT. This descriptive study was conducted to understand the relationship between demographic characteristics and attitudes toward psilocybin and PAT. An anonymous Qualtrics survey was utilized to collect responses from 235 participants. Participants responded to questions regarding demographics, knowledge of psilocybin, previous experience with psychedelics, and attitudes toward PAT. Overall, attitudes towards PAT were relatively positive, but there were some notable differences among groups. Those with more positive attitudes were more likely to be men, democrats, and atheists. However, these differences may be related to sampling sources (e.g., Amazon’s Mechanical Turk). Furthermore, participants with prior knowledge of psilocybin and previous experience with psychedelics had more positive attitudes toward PAT. These findings provide relevant information on what groups may be more open to PAT.
silocybin has been performing well in treatment trials for a variety of mental health conditions, such as obsessivecompulsive disorder (Ehrmann et al., 2021; Moreno et al., 2006), anxiety in advancedstage cancer patients (Grob et al., 2011), and major depressive disorder (Zeiss et al, 2021). While psilocybin is still classified as a “s chedule one substance” under the Controlled Substances Act, mounting evidence of its efficacy has inspired new research and challenged people to view it in a new light. For example, in 2019, the U.S. Food and Drug Association labeled psilocybin as a “breakthrough therapy” for the treatment of depression
(Rahhal, 2019) and in 2020, Oregon was the first U.S. state to legalize its use for mental health treatment at licensed centers (Jacobs, 2023). Since then, several other states, districts, and other countries, such as Australia, have moved to decriminalize or make the use of psilocybin legal for psychiatric treatment (Therapeutic Goods Administration, 2023).
What Is Psilocybin?
Psilocybin is a psychoactive compound found in dozens of species of mushrooms, known as psilocybin mushrooms (Nichols, 2020). Scientists such as Weitlaner, Wasson, and Wasson brought international attention to this previously mythical plant in the late 1950s (for a brief history see Nichols, 2020, and Tylš et al., 2013). Psilocybin’s scientific popularity led to its popularity as a recreational drug, causing it to be classified as a schedule one drug in 1970 (Nichols, 2020; Tylš et al., 2013), which is a drug having no accepted medical use and a high potential for abuse (DEA, 2018). Due to the “war on drugs” and other cultural factors at the time, psychedelic research as a whole was abandoned until the early 1990s (CarhartHarris & Goodwin, 2017). Despite still being illegal in the United States, an estimated 9.68% of Americans have used psilocybin recreationally (Yockey & King, 2021).
Therapeutic Benefits of Psilocybin
Psilocybin affects the brain’s serotonin system, particularly the 5HT2A receptor, which is believed to play a role in mood regulation and cognition (Donovan et al., 2021; Vollenweider et al., 1998). Its use can cause several types of hallucinations (auditory, visual, and physical), increased selfawareness, psychological flexibility, “spiritual” experiences, neuroplasticity, and time distortions (Carter et al., 2023; Corrigan et al., 2022; Davis et al., 2022). Several theories have been proposed to explain why these effects may be beneficial, such as altered brain connectivity in the default mode network, promotion of neuroplasticity, ability to confront and process difficult emotions or trauma, mystical experiences, altered perspectives, and reduced fear response (Carter et al., 2023; Corrigan et al., 2022; Davis et al., 2022; DinisOliveria, 2017). Psilocybin may also cause unwanted side effects such as nausea, anxiety, headaches, vomiting, and dizziness (Peden et al., 1982; Yerubandi et al., 2024). In some cases, psilocybin can cause episodes of psychosis in individuals with a personal or family history of predisposing risk factors to psychosis (Honk et al., 2024; Morris, 2024; Suleiman et al., 2022; Vollenweider et al., 1998). However, in clinical trials the risk of serious adverse reactions has been minimal, and treatment with psychedelics has been welltolerated according to one systematic review (Hinkle et al., 2024).
An example of psilocybinassisted therapy (PAT) at work can be found in a study conducted by Moreno et al. (2006) when they sought to understand the effectiveness of PAT in patients with treatmentresistant OCD. The study was restricted to participants with moderate to severe symptoms of OCD on the first day of testing. The nine participants received varying doses of psilocybin ranging from “very low” (25 micrograms per kilogram of bodyweight) to “very high” (300 micrograms per kilogram of bodyweight). This protocol was enacted for four sessions, each date separated by a minimum of one week. The study environment was highly controlled; participants were supervised by “trained sitters” at all times, including at least one investigator. The researchers found psilocybin to be a safe and welltolerated substance in a regulated and encouraging clinical environment (Moreno et al., 2006). One participant selfreported a lasting reduction of symptoms at a sixmonth followup.
Psilocybin also yielded promising results for patients with depression (CarhartHarris et al., 2017; Daws et al., 2022; Zeiss et al., 2021), suicidal ideation (Hendricks et al., 2015), posttraumatic stress disorder (Kisely et al., 2022), and cancerrelated anxiety (Grob et al., 2011). In addition, there is a high potential for PAT as a safe and effective treatment for both alcohol and tobacco addiction (Bogenschutz et al., 2015; Johnson et al., 2014).
Past Research on Attitudes
Understanding opinions and attitudes towards psychedelics and psilocybin (both within and outside the context of therapy) across different groups is important. Previous studies have looked at attitudes amongst specific groups, such as mental health professionals (Barnett et al., 2018; Davis et al., 2022; Meyer et al., 2022), mental health service users (Corrigan et al., 2022; Wang et al., 2024) African Americans (Carter et al., 2023), and healthcare students (Bhuiya et al., 2023; Wang et al., 2023). Each study provides further insights into what constituent groups may think about this type of treatment.
Mental Health Providers
Barnett et al. (2018) developed a scale to survey 324 American psychiatrists on their attitudes toward psychedelic treatment. This scale has since been used in other studies (Corrigan et al., 2022; Davis et al., 2022) and even inspired the creation of additional scales (Žuljević et al., 2022). Results indicated that participants generally viewed psychedelics as dangerous, although younger male trainees tended to be more open to these therapies. Similarly, Davis et al. (2022) examined the attitudes of 336 U.S. clinical psychologists using the Treatment Acceptability Rating FormRevised (TARFR). The safety
and therapeutic potential of psychedelics, as well as general perceptions of psychedelics were also assessed. Although 47.9% of participants believed psychedelics posed a risk of psychiatric impairment and 34.6% of participants believed psychedelics negatively affected neurocognitive functioning, many still saw value in further research. Davis et al. reported a startling lack of information among participants, even though 68.5% of them indicated previously working with a client who had experience with psychedelics. Focusing specifically on psilocybin, Meyer et al. (2022) surveyed 155 mental health professionals through an online survey. They found that opinions were generally neutral; however, those with more knowledge of or prior personal experience with psilocybin were also more likely to hold positive views. This study utilized a selfreported measure of knowledge. Similar to Davis et al. (2022), these participants also selfreported a lack of knowledge on the subject of PAT.
Mental Health Service Users
A 2022 study by Corrigan et al. examined the attitudes of 99 mentalhealth service users toward PAT (Corrigan et al., 2022). Participants completed a questionnaire based on prior research, with mental health diagnoses also recorded. Attitudes towards psilocybin as a treatment method were fairly favorable; most participants (59%) believed that psilocybin should be granted medical treatment status (Corrigan et al., 2022). Those who were younger, had previous psychedelic experiences, and those who were not religious displayed more positive attitudes towards PAT. Wang et al. (2024), explored the attitudes of 32 palliative care patients in a Florida outpatient setting. Over half of the participants expressed interest in PAT, although there was caution surrounding a fear of exploitation. Only 9.7% of participants reported knowledge of the therapeutic uses of psilocybin, indicating a need for further education on the subject.
Black Americans
Carter et al. (2023) looked at the effect psychoeducation may have on African Americans’ (N = 294) perceptions of psychedelic assisted therapy. To gather baseline attitudes, the psychedelic perceptions survey (PPS) was used. Following a brief psychoeducation, the psychedelic perceptions survey was readministered to see if opinions changed. The study found that psychoeducation significantly impacted optimism towards that type of treatment. Black Americans specifically held much more positive viewpoints about this type of treatment after such education, in comparison to White Americans (mean difference = 0.29, F = 4.57).
Healthcare Students
Wang et al. (2023) surveyed 213 U.S. healthcare
students to assess their attitudes towards PAT. The study found that perceived knowledge (4items; e.g., “I have substantial knowledge about psilocybin.”) significantly influenced positive attitudes towards PAT (β = .49), while lower concern for potential adverse effects (β = .25) and support of psilocybin decriminalization (β = .19) were also associated with more favorable views. Consistent with previous research (Barnett et al., 2018), Wang et al. found younger professionals tended to be more positive about PAT than those who had been in the field longer. Similarly, Bhuiya et al. (2023) explored the attitudes of 161 pharmacy students’ attitudes toward PAT using the Pharmacy Students’ Perceptions of Psilocybin Scale (PSPP). Results indicated that higher self reported knowledge (β = .37), lower concern for negative effects (β = .18), and strong beliefs in decriminalization for both recreational (β = .16) and therapeutic use (β = .35) were linked to more positive opinions on psilocybin.
International Opinions
The interest in attitudes towards psychedelics is not limited to the United States. Researchers in Croatia (Žuljević et al., 2022) recognized the need for a validated instrument and built a 20item scale, named the Attitudes on Psychedelics Questionnaire (APQ), to assess attitudes toward psychedelics among general populations. The APQ displayed high reliability overall (α = .95), and among its four subscales: legal use of psychedelics (α = .84), effects of psychedelics (α = .89), risk assessment of psychedelics (α = .84), and openness to psychedelics (α = .84). As part of the validation process, the team collected attitudes from a general sample of 1,153 Croatians. Out of their population, men (β = .17), younger participants (β = .22), and those with higher knowledge (r = .49) displayed more positive attitudes towards psychedelics. Contrary to prior literature, those who were less educated also had more positive attitudes (β = .12).
Present Study
Despite all the work done to understand attitudes toward psychedelicassisted therapies and PAT, the current literature lacks information about attitudes among a general U.S. population. To address this gap, we conducted a descriptive study of attitudes toward psilocybin and PAT among a convenience sample of general adults in the United States. The purpose of our study was to understand whether there is any relationship between demographic variables and attitudes toward psilocybin and PAT.
Methods
Research Practices
We sought to determine if there was a relationship between demographics and attitudes toward psilocybin
among a general sample of adults in the United States. An anonymous online Qualtrics survey was utilized to collect candid data.
Participants
Using prior research on the subject as a guide, 562 participants were recruited across multiple websites and social media platforms. To ensure only quality responses remained for data analysis, we reviewed survey responses and removed any incomplete responses (defined as responses without an APQ score) or responses flagged as “duplicate” or “botgenerated.” After data cleanup was complete, the data from 235 participants remained for data analysis (see Table 1 for detailed participant demographics and https://osf.io/ asxwk/ for a participant exclusion flowchart). Participation was limited to adults 18 and older with fluency in the English language residing in the United States. Recruiting occurred via snowball sampling across social media sites (Instagram, Facebook, and Snapchat), Mechanical Turk (MTurk), Reddit, and the Social Psychology Network (SPN). We used MTurk for its demographic diversity, although users are known to be more educated and less religious (Lopez et al., 2023). Unfortunately, MTurk produced the least reliable respondent pool due to the prevalence of bots. We used Reddit subforums dedicated to survey exchanges to reach additional participants. In addition, we both used our social media accounts to reach out to invite adults within our social networks to participate and to disseminate the survey to their friend groups as well.
Participants were relatively young with a mean age of 35.8 (SD = 15.9), majority women (60%), white (88%), middleclass (53.6%), and educated (46.8%). Politically, 46.8% of respondents identified as Democrats, 22.6% were Republican, and 21.7% identified as independents. Most respondents claimed some type of religious belief (67%). Most participants indicated that they were not disabled (71.5%) and had no mental health diagnosis (82.6%). Most were not working in a healthcare profession (90.2%) or ever served in the military (60.9%).
Measures
Demographics
We selected demographic characteristics used in prior research on the subject as well as a few additional ones that we thought might be predictive of attitudes toward psilocybin and PAT. Thus, participants were asked to report their age, gender, race, education, subjective social status, political alignment, religious affiliation, military service, disability status, and healthcare worker status (if they currently, or have ever, worked in a healthcare profession). The wording for these demographic questions was heavily influenced by the work of Hughes et al. (2016) to ensure the desired information was collected.
Previous Experience
Prior studies found connections between previous experience and attitudes (Corrigan et al., 2022; Meir et al., 2023; Meyer et al., 2022). So, participants were asked about previous experience with a list of nine different psychedelic drugs (psilocybin, LSD, MDMA, peyote, mescaline, DMT, PCP, ketamine, and salvia). The participant’s experience was sorted into two groups: those who had used psychedelics, and those who had not. The variable was also split to sort what participants had used psilocybin and those who had not.
Prior Knowledge
Prior knowledge was collected using a selfreport based measure, modeled after prior research (Meyer et al., 2022). Participants were asked about their prior knowledge of psilocybin using three items. The first, “Prior to taking the current survey, how much knowledge would you say you have about psilocybin?” was assessed using a 5point scale (5 = extremely knowledgeable, 1 = no previous knowledge on the subject). If participants indicated any prior knowledge of the subject, they were asked where they received their information (e.g., books, T.V., pop culture, social media).
Framing
Qualtrics skip logic was utilized so that if a participant indicated having any prior knowledge about psilocybin, a question on framing appeared. How the knowledge was presented, or its “framing,” was asked with a single question, “From what you’ve seen or heard, how has psilocybin been portrayed?” Responses were collected using a 5point scale (1 = all negative, 5 = all positive).
Attitudes
Attitudes towards psilocybin were assessed using a modified version of the Attitudes on Psychedelics Questionnaire (APQ) developed and validated by Žuljević et al. (2022). The scale was modified to use “psilocybin” in place of “psychedelic,” per the study’s goals. The modified scale was internally valid in the present study (Cronbach’s α = .95). The APQ uses a 5point scale (1 = completely disagree, 5 = completely agree). A higher score indicates more positive attitudes towards psilocybin (minimum score = 20, maximum score = 100). The 20item scale was divided into four subsections: the legal use of psychedelics (α = .80), the effects of psychedelics (α = .85), risk assessment of psychedelics (α = .80), and one’s openness to psychedelics (α = .87). Each subscale consisted of 5 questions with higher scores reflecting more positive attitudes (minimum subscale score = 5, maximum subscale score = 25). Example items were, “If [psilocybin]assisted
psychotherapy enters into regular practice, I would be interested in learning more about it,” and “the use of [psilocybin] can damage the nervous system” (scored reversely). An open ended question at the end of the survey allowed participants to share any further thoughts or statements about the survey and its subject matter.
Procedure
Before survey distribution, Milligan University’s institutional review board approval was sought and acquired (IRB approval number: Exe2308161850). Recruitment took place on several online platforms: Amazon’s Mechanical Turk ( n = 30), SPN ( n = 12; www.socialpsychology.org ), survey exchanges sites on Reddit (n = 69), and posts on the authors’ personal social media pages (n = 124; Facebook, Snapchat, and Instagram). The survey took an estimated 7–10 minutes to fill out and was completed at the participant’s convenience. Participants recruited from Amazon Mechanical Turk received financial compensation of 75 cents for their involvement.
Data Analysis
Data analysis was conducted using SPSS. Demographic characteristics were analyzed using descriptive statistics. Pearson correlations were calculated to understand the relationship between some demographics and attitudes (age, number of psychedelics used). Oneway ANOVA analyses, chisquare, and t tests were utilized to determine if there were statistically significant differences in the attitudes toward psilocybin and PAT among the levels within nominal variables. Posthoc tests were also run to further explore significant findings.
Results and Discussion
We sought to understand the opinions and attitudes a general U.S. population has about psilocybin and PAT. Overall, attitudes were relatively positive (APQ M = 72.1, SD = 16.4, min. score = 25, max. score = 100). Subscale means were also high (min score = 5, max score = 25); the highest was openness (M = 19.7, SD = 4.9), followed by legal use (M = 18.7, SD = 4.2), then risk assessment ( M = 17, SD = 4.2), and finally, effects ( M = 16.7, SD = 4.7). The overall score and all subscale means were higher compared to prior research by Žuljević (2022), which focused on psychedelics as a whole (Total APQ; M = 66.2, SD = 15.2). As in other studies, attitudes varied considerably, based on demographics. Table 1 displays the mean APQ scores for all categorical demographic variables as well as effect sizes for any significant differences between them. An Open Science Resource appendix (https://osf.io/asxwk/) displays means and standard
deviations concerning the four subscales that comprise the APQ (legal use, effects, risk assessment, and openness).
Age
Our sample was relatively young (Mage = 35.8, SD = 15.9; range: 18–82); we found no significant relationship between age and APQ (r = .08, p = .119). Some studies have found age to be a significant predictor of attitudes, specifically that those younger in age tend to have more positive attitudes on the subject. (Corrigan et al., 2022; Wang et al., 2023; Žuljević et al., 2022), Other studies, however, have found age to be unrelated (Meyer et al., 2022). Due to the contradiction with this variable, further studies may need to be conducted to determine if age is a reliable predictor of attitudes towards PAT or whether other factors moderate that relationship, such as knowledge or experience.
Gender
Men had higher mean APQ scores (M = 76.3, d = .4, p = .003) compared to women (M = 69.9). This difference was found in all four APQ subscales (see https:// osf.io/asxwk/), consistent with prior studies in which men tended to view psychedelics, and specifically psilocybin, more positively than women (Barnett et al., 2018; Žuljević et al., 2022). Men had more selfreported knowledge of psilocybin (χ 2 = 33.25, df = 3, p < .001), consistent with other studies (Corrigan et al., 2022). Men also reported more experience with psilocybin ( M = 2.6, SD = 2.4, p < .001) when compared to women (Mexperience = 1.0, SDexperience = 1.9), similar to previous studies (Matzopoulos, 2022; Yockey & King, 2021).
Race
As displayed in Table 1, the differences in mean APQ scores amongst racial groups were not significant (η2 = .03, p = .145). It must be noted, however, that there was not much racial diversity in the sample, which is a weakness. Prior literature does not have much to say about race and attitudes towards psilocybin, outside of work done on psychoeducation (Carter et al. 2023), which found no significant difference between race and attitudes before education.
Education
Attitudes towards psilocybin did not seem to vary based on educational background (η2 = .00, p = .494). Previous work has not displayed a definitive answer in regard to education; Žuljević et al. (2022) found those who were less educated held more positive opinions on psychedelicassisted therapies, whereas Yokey and King (2021) found
educated individuals were more likely to have tried psilocybin. The lack of significance in this variable could be indicative of a shift in public perception where attitudes towards PAT is less dependent on a formal education. The world is changing, such that endless knowledge is quite literally at our fingertips (Purcell & Raine, 2014). Rather than depending on formal education, one could look at a slew of online platforms or learn from another’s personal experiences via social media and online forums. Future research might take a deeper
look into where people are getting their information to better understand what is driving these shifts in attitudes.
Religious Affiliation
Nonreligious participants displayed much higher mean APQ scores, compared to those who were religious (η2 = .17, p < .001; see Table 1). These scores were also reflected in subscale analyses (see https://osf.io/asxwk/). The effect sizes for each of its subscales were relatively large (legal use η2 = .16, p < .001; effects η2 = .19, p < .001; risk
TABLE 1
Mean APQ Scores and Size of Differences Between Levels of Various Demographic Variables
Simounet and Drinnon | Attitudes Towards Psilocybin
WINTER 2025
PSI CHI JOURNAL OF PSYCHOLOGICAL RESEARCH
assessment η2 =.13, p < .001; openness η2 =.08, p < .001). This significance is reflective of prior research (Corrigan et al., 2022) showing nonreligious individuals to have more positive views of psilocybin. These numbers likely reflect hesitancy amongst religious individuals to trust a schedule one substance as a potential therapeutic mechanism. Unfortunately, the “religious vs. nonreligious” analysis was necessary due to the homogeneity of the sample (75.3% identified as Christian). This limits the ability to investigate differences among specific religious groups (Jewish, Muslim, etc.).
Political Affiliation
Democratic participants held more positive attitudes towards psilocybin ( M = 77.5, SD = 13.2, η 2 = .17, p < .001; see Table 1 for reference) while respondents who leaned more Republican displayed the most negative attitudes towards psilocybin (M = 61.5, SD = 17.1). In looking at subscales and posthoc tests, individuals without a political preference displayed more negative attitudes when it came to the legal use of psilocybin (M = 16, SD = 5.7, p < .001) as compared to Republicans (M = 16.3, SD = 4.2) who displayed the lowest mean scores in every other subscale. While left leaning individuals in this study displayed higher attitudes toward PAT, being left leaning does not necessarily cause higher attitudes. However, democrats tend to have personality traits such as high openness and agreeableness (Furnham & FentonO’Creevy, 2018), which may moderate the relationship. Additional research into how political identity may affect attitudes toward this type of treatment could be worthwhile.
Disability Status
There was no significant difference in opinions between those who reported having a disability and those who identified as “not disabled” (d = .25, p = .09). Although previous literature has looked at the attitudes of patients (palliative care and mental health service users), there has yet to be a specification between the attitudes of those who identify as disabled or not.
Mental Health Disorder
Those who reported having a mental health disorder displayed slightly higher APQ scores overall (M = 77.1, SD = 13.9), compared to those who reported not having a mental health disorder (M = 71.1, SD = 16.7, d = .37, p = .031). When looking at subscales (see https://osf. io/asxwk/), legal use (η2 = .03, p = .005) and openness (η2 = .02, p = .022) were significant, whereas effects (η2 = .01, p = .207) and risk assessment (η2 = .01, p = .134) were not. This is consistent with research by Corrigan et al. (2022), who found relatively positive attitudes toward
PAT among mental health service users. A limitation of this variable is the reliance on selfreport, which may be based only on selfdiagnosis in some cases.
Military Service
There was not a significant difference in APQ scores between those who served in the military compared to those who had not (η2 = .009, p = .222), nor were there any notable differences in any of the subscale scores (see https://osf.io/asxwk/). Out of the sample of 235 participants, only 19 (8%) indicated prior service. Although this is a larger percentage than the national average (6%; Schaeffer, 2023), further studies are needed to understand if military service is predictive of attitudes towards PAT.
Subjective Social Status
Selfreported social class (affluent, middle, working, low) was not related to overall attitudes ( η 2 = .02, p = .144), nor any of the subscale scores (see https://osf. io/asxwk/). Unfortunately, we found no prior research on this specific variable or related measures. A weakness found in this particular variable is that social status was selfreported and dependent on subjective interpretation. Future studies may look at other methods of operationalizing this variable (e.g., annual income) before ruling it out as a predictor of attitudes.
Healthcare Profession
Those who were employed in the healthcare sector did not display significant differences in overall attitudes towards psilocybin when compared to those who did not work in that profession (d = .16, p = .72), nor any of the subscales (see https://osf.io/asxwk/). Previous studies targeting mental health professionals tend to display cautious, yet curious, attitudes toward psychedelicassisted therapies and PAT (Davis et al., 2022; Meyer et al., 2022). Despite this trend in studies targeting professionals specifically, this lack of significance between professionals and laypeople is also reflected in previous studies (Žuljević et al., 2022). We did not make a specific effort to target this population, although 9.7% of our sample indicated they were healthcare workers, which is slightly less than the national average for this population (10.8% as of 2023; Telsford et al., 2024). Nevertheless, the sample size of healthcare workers (n = 23) still limits statistical power for this specific variable.
Data Source
Participant source (social media, MTurk, SPN, and Reddit) was highly predictive of attitudes toward PAT (η2 = .13, p < .001). The group with the most positive opinions of psilocybin were volunteers from SPN
( M = 80.3, SD = 11.4), followed closely by survey exchange subreddits (M = 79.5, SD = 79.5). The lowest score was produced by participants from MTurk ( M = 62.5, SD = 14.4). These notable differences were reflected in the four subscales as well (legal use η2 = .11, p < .001; effects η2 = .13, p < .001; risk assessment η 2 = .09, p < .001; openness η 2 = .11, p < .001; see https://osf.io/asxwk/). SPN and subreddit users were all volunteers presumably motivated to either exchange their survey participation for interest in their surveys or to take academic surveys of interest to them. SPN is a site dedicated to sharing surveys and online experiments among academics, students, and those interested in social psychological research. Thus, people more open to psilocybin may have been more willing to take the survey. Similarly, those on the subreddit sites may have been more or less inclined to take a survey titled “Attitudes towards psychedelicassisted therapies,” based on their interests. Therefore, it is possible the motivation for participants from Reddit and SPN was based on prior interest in the subject of psilocybin and a desire to share their views with someone, rather than a motivation to either get paid (MTurk) or help out someone already known to them on social media.
Knowledge of Psilocybin
Participants selfreported how much knowledge they had about psilocybin with a single item (“Prior to taking the current survey, how much knowledge would you say you have about psilocybin?”). These responses were compared against mean APQ scores. There were significant differences between the five knowledge groups (none, a little, moderate, a lot, a great deal; η2 = .25, p < .001). Those who reported “a great deal” of knowledge had the most favorable opinions (M = 83.4, SD = 12.3) while those who reported no prior knowledge had the lowest (M = 59, SD =13.5). These notable differences were also found in the scale’s four subscales (see https://osf.io/asxwk/). Prior knowledge was found to be significant in five other studies (Bhuiya et al., 2023; Meir et al., 2023; Meyer et al., 2022; Wang et al., 2023; Žuljević et al., 2022), suggesting that prior knowledge may be a reliable predictor of PAT attitudes. Knowledge towards psilocybin has been measured in both a verifiable way through administering a test to participants (see Žuljević et al., 2022), and via selfreport methods (Meyer et al., 2022). Although providing a “knowledge test” to participants may have been a more reliable measure of prior knowledge of psilocybin, Žuljević et al. (2022) found that this test ended up increasing the number of participants who dropped out of the study, due to feeling like they did not have enough knowledge on the subject to continue. Thus, we utilized a selfreport
Simounet and Drinnon | Attitudes Towards Psilocybin
measure despite the risks that come with selfreporting. The more knowledge an individual claims to have on the subject, the more comfortable they seem to be with PAT. This is backed by Carter et al.’s 2023 study, in which participants displayed more positive views of psychedelic therapy following education on it.
Framing of Prior Knowledge
We asked respondents to rate the valence of their prior knowledge with a single question (“From what you’ve seen or heard, how has psilocybin been portrayed?”) using a 5point scale (anchored by “all negative” to “all positive”). Presumably, more positive information would be associated with more positive attitudes. We grouped respondents into three possible groups based on their ratings (mostly or all positive, neutral, or mostly or all negative) and found a large statistical difference between those three groups (η2 = .27, p < .001) on APQ scores. Participants with positively framed prior knowledge displayed more positive attitudes towards psilocybin, while those with negative framing displayed lower attitudes (see Table 1). Large effect sizes were also found in each of the subscales, with negative framing being associated with lower subscale means across every category (https://osf. io/asxwk/). Arguably, this measure of prior knowledge is highly subjective and likely influenced by biases such as selective memory, confirmation bias or availability heuristics. Furthermore, its relationship with attitudes probably goes in both directions. For example, someone who reports negative perceptions may be more likely to report that what they have seen or heard about psilocybin is also negative. Nevertheless, prior research has shown that education about psilocybin can increase positive attitudes toward it (Carter et al., 2023). Thus, education about PAT might be one means of reducing stigma around this treatment and increasing openness to it.
Prior Experience with Psychedelics
Participants selfreported prior experience with psychedelics by describing their use of nine different psychedelics (min. = 0, max. = 9, Mexperience = 1.6, SD = 2.2). Experience with psychedelics was found to be positively correlated with APQ score (r = .13, p = .042). Out of every subscale analysis, experience with psychedelics was only significantly correlated with the effects of psilocybin (r = .22, p = < .001). This correlation makes sense, as those who have more personal experience with psychedelics as a whole would also have a greater understanding and be less wary about the effects of psilocybin. In previous research, prior experience with psychedelics was also associated with more positive attitudes towards psilocybin specifically (Corrigan et al., 2022; Meir et al., 2023; Meyer et al., 2022). Not surprisingly, those who
Attitudes Towards Psilocybin | Simounet and Drinnon
have felt confident in trying other psychedelics, even if they have not tried psilocybin, would likely have more positive attitudes about this drug too.
Prior Experience with Psilocybin
The participant’s prior experience with psilocybin was analyzed separately, as psilocybin was the subject of the study. Among our sample, 105 participants (44.7%) reported having used psilocybin. This percentage is higher than the previous work conducted by Yockey and King (2021), which is consistent with their finding of a steady increase in usage over time. As one might expect, those who had used psilocybin in the past reported extremely positive attitudes toward psilocybin (M = 79.5, SD = 13.4, η2 = .16, p < .001) when compared to those who have not used psilocybin ( M = 66.4, SD = 16.7). This stark difference between these two groups was reflected in differences in the subscales as well (see https://osf.io/asxwk/). Meyers et al. (2022), Corrigan et al., (2022), and Žuljević et al. (2022), also reported more positive attitudes from those who have experience with the drug at hand.
Conclusion
The goal of our study was to understand what relationship exists between demographics and attitudes toward psilocybin and PAT. This research provided insight into what attitudes a general U.S. population may hold towards this emerging therapy. Overall, attitudes were fairly positive (M = 72.1) compared to prior studies (Žuljević et al., 2022) and several predictors were consistent with prior research. Namely, men, those without religious affiliations, and those who had experience using psilocybin had more positive attitudes (Corrigan et al., 2022; Žuljević et al., 2022). Prior knowledge was also a predictor of positive attitudes, which was consistent with previous studies (Wang et al., 2023; Žuljević et al., 2022).
It is important to take these differences in opinions into account when considering the future of PAT. Unlike other hallucinogens (e.g., LSD, PCP, Ketamine), psilocybin can be grown at home and there is no shortage of resources available to anyone willing to try. In some ways, this sets psilocybin apart from other psychoactive drugs and makes research into their use all the more pressing. According to Yockey and King (2021), the number of adults using psilocybin doubled in just three years, underscoring how rapid acceptance of this drug is becoming. Understanding the role that attitudes play in this process is crucial.
One likely reason for changing attitudes is the increasing awareness of positive results coming from clinical trials. Several news outlets have called this period of time a type of “psychedelic revolution” due to the success of psychedelics in medicine (Jacobs, 2021). Furthermore,
there has been an upsurge in popular media (e.g., “How to Change Your Mind,” “Have a Good Trip,” and “Luminous”) about the therapeutic potential of psilocybin and other hallucinogenic drugs. This is in stark contrast to the way hallucinogenic drugs and their proponents were once described (Nichols, 2020). Our survey results indicate that when people have more positive knowledge about psilocybin, they also have more positive attitudes. Thus, it stands to reason that as news stories and personal accounts of successful use of psilocybin become widespread, so might openness and curiosity. With this in mind, education on psilocybin should be presented factually and without bias. In the event that psilocybin continues to perform well in clinical trials, prospective patients deserve to receive honest education on PAT so they may make the best decision for their health and beliefs.
Limitations
The limitations of this study must be considered alongside its strengths. The descriptive nature of the current study requires a focus on demographic characteristics, which can be quite reductionistic. For example, our method of analysis was limited to looking at each demographic variable independent of others, which discounts the intersectionality of identities among respondents. In addition, our findings are likely limited by biases inherent in any nonrepresentative sample. For example, we found large differences between the platforms we used to find participants. Additionally, we could not use most of our MTurk responses due to the prevalence of bots and duplicate responses. Furthermore, this study is simply a snapshot of attitudes in the U.S. as of the fall of 2023. Based on prior trends, it is possible that attitudes may have already shifted, so this study may best serve as a baseline to compare future attitudes (Yockey & King, 2021). Finally, any data based on selfreport is subject to recall bias; especially in regards to the “framing” variable.
Future Research
We did not ask respondents about their intent to use psilocybin in the future, but it would be worthwhile to see if attitudes are predictive of future usage, and if so, which aspects. Future research may inquire about the purpose of usage and whether participants would be willing to experiment with other innovative treatments. A deeper dive into some of the variables explored here may be effective as well (e.g., looking at specific religious identities rather than the presence of a religious affiliation). By examining these areas, we can continue to gain insight into the impact of emerging perspectives on psilocybin’s role in healthcare.
References
Barnett B. S., Siu, W. O., & Pope H. G. (2018). A survey of American psychiatrists’ attitudes toward classic hallucinogens. Nervous and Mental Disease, 206, 476–482. https://doi.org/10.1097/NMD.0000000000000828
Bhuiya, N. M., Jacobs, R. J., Wang, K., Sun, Y., Nava, B., Sampiere, L., Yerubandi, A., & Caballero, J. (2023). Predictors of pharmacy students’ attitudes about the therapeutic use of psilocybin. Cuerus, 15(9). https://doi.org/10.7759/cureus.45169
Bogenschutz, M. P., Forcehimes, A. A., Pommy, J. A., Wilcox, C. E., Barbosa, P. C. R., & Strassman, R. J. (2015). Psilocybin-assisted treatment for alcohol dependence: A proof-of-concept study. Psychopharmacology, 29(3), 289–299. https://doi.org/10.1177/0269881114565144
Carhart-Harris, R. L., & Goodwin, G. M. (2017). The therapeutic potential of psychedelic drugs: Past, present, and future. Neuropsychopharmacology, 42(11), 2105–2113. https://doi.org/10.1038/npp.2017.84
Carhart-Harris, R. L., Roseman, L., Bolstridge, M., Demetrious, L., Pannekoek, J. N., Wall, M. B., Tanner, M., Kaelen, M., McGonigle, J., Murphy, K., Leech, R., Curran, H. V., & Nutt, D. (2017). Psilocybin for treatment-resistant depression: fMRI-measured brain mechanisms. Scientific Reports, 7(13187). https://doi.org/10.1038/s41598-017-13282-7
Carter, S., Packard, G., Coghlan, C., George, J. R., Brown, A. J., Ching, T. H. W., Julian, J., & Maples-Keller, J. L. (2023). Perceptions of psychedelic-assisted therapy among Black Americans. Mood and Anxiety Disorders, 4 https://doi.org/10.1016/j.xjmad.2023.100023
Corrigan, K., Hara, M., McCandliss, C., McManus, R., Cleary, S., Trant, R., Kelly, Y., Ledden, K., Rush, G., O’Keane, V., & Kelly, J. R. (202 2). Psychedelic perceptions: Mental health service user attitudes to psilocybin therapy. International Journal of Medical Science, 191(3), 1385–1397. https://doi.org/10.1007/s11845-021-02668-2
Davis, A. K., Agin-Liebes, G., España, M., Pilecki, B., & Luoma, J. (2022). Attitudes and beliefs about the therapeutic use of psychedelic drugs among psychologists in the United States. Psychoactive Drugs, 54(4), 309–318. https://doi.org/10.1080/02791072.2021.1971343
Daws, R. E., Timmermann, C., Giribaldi, B., Sexton, J. D., Wall, M. B., Erritzoe, D., Roseman, L., Nutt, D., & Carhart-Harris, R. (2022). Increased global integration in the brain after psilocybin therapy for depression. Nature Medicine, 28, 844–851. https://doi.org/10.1038/s41591-022-01744-z
DEA (2018). Drug scheduling. https://www.dea.gov/drug-information/drug-scheduling
Donovan, L. L., Johansen, J. V., Ros, N. F., Jaberi, E., Linnet, K., Johansen, S. S., Ozenne, B., Issazadeh-Navikas, S., Hansen, H. D., & Knudsen, G. M. (2021). Effects of a single dose of psilocybin on behavior, brain 5-HT2A receptor occupancy and gene expression in the pig. European Neuropsychopharmacology, 42, 1–11. https://doi.org/10.1016/j.euroneuro.2020.11.013
Ehrmann, K., Allen, J. J. B., & Moreno, F. A. (2021). Psilocybin for the treatment of obsessive-compulsive disorders. Behavioral Neurosciences, 56, 247–260. https://doi.org/10.1007/7854_2021_279
Furnham, A., & Fenton-O’Creevy, M. (2018). Personality and political orientation. Personality and Individual Differences, 129, 88–91. https://doi.org/10.1016/j.paid.2018.03.020
Grob, C. S., Danforth, A. L., Chopra, G. S., Hagerty, M., McKay, C. R., Halberstadt, A. L., & Greer, G. R. (2011). Pilot study of psilocybin treatment for anxiety in patients with advanced-stage cancer. Arch Gen Psychiatry, 68(1), 71–78. https://doi.org/10.1001/archgenpsychiatry.2010.116
Hendricks, P. S., Thorne, C. B., Clark, C. B., Coombs, D. W. & Johnson, M. W. (2015). Classic psychedelic use is associated with reduced psychological distress and suicidality in the United States adult population. Psychopharmacology, 29(3), 280–288. https://doi.org/10.1177/0269881114565653
Hinkle, J. T., Graziosi, M., Nayak, S. M., & Yaden, D. B. (2024). Adverse events in studies of classic psychedelics: A systematic review and meta-analysis. JAMA Psychiatry. https://doi.org/10.1001/jamapsychiatry.2024.2546
Honk, L., Stenfors, C. U. D., Goldberg, S. B., Hendricks, P. S., Osika, W., Dourron, H. M., Lebedev, A., Petrovic, P., & Simonsson, O. (2024). Longitudinal associations between psychedelic use and psychotic symptoms in the United States and the United Kingdom. Affective Disorders, 351, 194–201. https://doi.org/10.1016/j.jad.2024.01.197
Huges, J. L., Camden, A. A., & Yangchen, T. (2016). Rethinking and updating demographic questions: Guidance to improve descriptions of research samples. Psi Chi Journal of Psychological Research, 21(3), 138–151. https://doi.org/10.24839/2164-8204.JN21.3.138
Jacobs, A. (2023). Legal use of hallucinogenic mushrooms begins in Oregon
Simounet and Drinnon | Attitudes Towards Psilocybin
The New York Times https://www.nytimes.com/2023/01/03/health/ psychedelic-drugs-mushrooms-oregon.html?smid=url-share
Jacobs, A. (2021). The psychedelic revolution is coming. Psychiatry may never be the same. The New York Times. https://www.nytimes.com/2021/05/09/ health/psychedelics-mdma-psilocybin-molly-mental-health.html
Johnson, M. W., Garcia-Romeu, A., Cosimano, M. P., & Griffiths, R. R. (2014). Pilot study of the 5-HT2AR agonist psilocybin in the treatment of tobacco addiction. Psychopharmacology, 28(11), 983–992. https://doi.org/10.1177/0269881114548296
Kisely, S., Connor, M., Somogyi, A. A., & Siskind, D. (2022). A systematic literature review and meta-analysis of the effect of psilocybin and methylenedioxymethamphetamine on mental, behavioural or developmental disorders. Australian & New Zealand Journal of Psychiatry, 57(3). https://doi.org/10.1177/00048674221083868
Lopez, S. G., Rouse, S. V., & Treadwell, K. (2023). Editorial: The use of Mechanical Turk data in psychological research. Psi Chi Journal of Psychological Research, 28(2), 91–95. https://doi.org/10.24839/2325-7342.JN28.2.91
Matzopoulos, R., Morlock, R., Morlock, A., Lerer, B., & Lerer, L. (2022). Psychedelic mushrooms in the USA: Knowledge, patterns of use, and association with health outcomes. Frontiers in Psychiatry, 12. https://doi.org/10.3389/fpsyt.2021.780696
Meir, P., Taylor, L. Soares, J. C., & Meyer, T. D. (2023). Psychotherapists’ openness to engage their patients in psilocybin-assisted therapy for mental health treatment. Affective Disorders, 323, 748–754. https://doi.org/10.1016/j.jad.2022.12.050
Meyer, T. D., Meir, P., Lex, C., & Soares, J. C. (2022). Magic mushrooms—An exploratory look at how mental health professionals feel and think about psilocybin. Psychiatry Research, 316(114727). https://doi.org/10.1016/j.psychres.2022.114727
Moreno, F. A., Wiegand, C. B., Taitano, E. K., & Delgado, P. L. (2006). Safety, tolerability, and efficacy of psilocybin in 9 patients with obsessivecompulsive disorder. Clinical Psychiatry, 67(11), 1735–1740. https://doi.org/10.4088/jcp.v67n1110
Morris, S. L. (2024). A case report of psilocybin-induced psychosis in a predisposed patient. Clinical Psychopharmacology and Neuroscience, 22(4), 684–687. https://doi.org/10.9758/cpn.24.1180
Nichols, D. E. (2020). Psilocybin: From ancient magic to modern medicine. Journal of Antibiotics https://doi.org/10.1038/s41429-020-0311-8
Peden, N. R., Pringle, S. D., & Crooks, J. (1982). The problem of psilocybin mushroom abuse. Human & Experimental Toxicology, 1(4). https://doi.org/10.1177/096032718200100408
Purcell, K., & Raine, L. (2014). More information yields more learning and sharing. Pew Research Center. https://www.pewresearch.org/internet/2014/12/08/more-informationyields-more-learning-and-sharing/?utm_source=chatgpt.com
Rahhal, N. (2019). A step closer to legalizing magic mushrooms as FDA lets second research group use the ‘breakthrough’ drug in clinical trial to treat patients with depression. Daily Mail. https://www.dailymail.co.uk/health/article-7733255
Schaeffer, K. (2023). The changing face of America’s veteran population. Pew Research Center. https://www.pewresearch.org/short-reads/2023/11/08/ the-changing-face-of-americas-veteran-population/
Suleiman, M., Basu, A., Belal, S., & Jacob, T. (2022). From mushrooms to myolysis: A case of rhabdo in psilocybin-induced mood and psychotic disorder. The Journal of Nervous and Mental Disease, 210(8), 638–639. https://doi.org/10.1097/NMD.0000000000001489 Therapeutic Goods Administration. (2023). Change in classification of psilocybin and MDMA to enable prescribing by authorized psychiatrists [Press release]. TGA: Australian Government Department of Health https://www.tga.gov.au/news/media-releases/change-classificationpsilocybin-and-mdma-enable-prescribing-authorised-psychiatrists
Telsford, I., Wager, E., Hughes-Cromwick, P., Amin, K., & Cox, C. (2024). What are the recent trends in health sector employment? Health System Tracker https://www.healthsystemtracker.org/chart-collection/what-are-therecent-trends-health-sector-employment/ Tylš, F., Páleníček, T., & Horáček, J. (2014). Psilocybin—Summary of knowledge and new perspectives. European Neuropsychopharmacology, 24, 342–356. https://doi.org/10.1016/j.euroneuro.2013.12.006
Vollenweider, F. X., Vollenweider-Scherpenhuyzen, M. F., Bäbler, A., Vogel, H., & Hell, D. (1998). Psilocybin induces schizophrenia-like psychosis in humans via a serotonin-2 agonist action. Neuroreport, 9(17), 3897–3902. https://doi.org/10.1097/00001756-199812010-00024
WINTER 2025
PSI CHI JOURNAL OF PSYCHOLOGICAL RESEARCH
Wang, J. R., Mendez Araque, S. J., Micciche, G., McMillan, A., Coughlin, E., Mattiola, R., English, D., & Kaliebe, K. (2024). Palliative care patients’ attitudes and openness towards psilocybin-assisted psychotherapy for existential distress. Frontiers in Psychiatry, 15 https://doi.org/10.3389/fpsyt.2024.1301960
Wang, K., Sun, T., Nava, B., Sampiere, L., & Jacobs, R. J. (2023). Predictors of medical student’s perceptions of psilocybin-assisted therapy for use in medical practice. Cureus, 15(4). https://doi.org/10.7759/cureus.37450
Yerubandi, A., Thomas, J. E., Bhuiya, M. A., Harrington, C., Zapata, L. V., & Caballero, J. (2024). Acute adverse effects of therapeutic doses of psilocybin. JAMA Network Open, 7(4). https://doi.org/10.1001/jamanetworkopen.2024.5960
Yockey, A., & King, K. (2021). Use of psilocybin (“mushrooms”) among US adults: 2015–2018. Journal of Psychedelic Studies, 5(1), 17–21. https://doi.org/10.1556/2054.2020.00159
Zeiss, R., Gahr, M., & Graf, H. (2021). Rediscovering psilocybin as an antidepressant treatment strategy. Pharmaceuticals, 14(985).
https://doi.org/10.3390/ph14100985
Žuljević, M. F., Bulgan, I., Leskur, M., Kaliterna, M., Hren, D., & Dulplančić,
D. (2022). Validation of a new instrument for assessing attitudes on psychedelics in the general population. Scientific Reports, 12(18225). https://doi.org/10.1038/s41598-022-23056-5
Author Note
Madison M. H. Simounet https://orcid.org/0009000088737813 Joy R. Drinnon https://orcid.org/000000030272147X
Madison M. H. Simounet graduated from Milligan University in April 2024 and is now working in the Developmental Psychopathology Lab at East Tennessee State University, Johnson City, TN.
We have no known conflict of interest to disclose. This study was supported by the Office of Undergraduate Research at Milligan University.
Correspondence concerning this article should be addressed to Madison Simounet, email: madisonsimounet@gmail.com
Higher System Justification Beliefs Predict Greater Acceptance of Economic Inequality Among University Students
Kayla
Neubert1 and Amanda R. Burkholder*2
1Department of Psychology, University of Oregon
2Department of Psychology, Furman University
ABSTRACT. How to effectively address inequality is a prominent debate in U.S. society due to increasing wealth disparities. This divide may stem from differing economic system justification beliefs. For example, people who view society as fairly structured may be more accepting of inequality, even when the inequality is created through structural advantages rather than individual differences in traits like effort. The present study investigated the relationship between perceptions of societal fairness and evaluations of different economic inequality sources, how these perceptions relate to beliefs about how wealth is distributed in society, and whether responses differed by age, gender, and race. U.S. college students (N = 191, 18–23 years old) completed an 8item scale to assess economic system justification beliefs. Participants also evaluated the acceptability of inequalities created through individual, structural, random, and hidden sources, predicted the cause of wealth and poverty, and determined the actual and most ideal wealth distribution in the United States. Participants with higher system justification beliefs rated all sources of inequality as more acceptable (ps < .001), with men in particular rating many sources of inequality as more acceptable (ps ≤ .05). Those with higher system justification beliefs were also more likely to select an individual source of inequality (e.g., merit) as the cause of both wealth and poverty (ps ≤ .001) and to believe the United States had a more egalitarian distribution (p = .002). These findings offer insight into how system justification beliefs influence college students’ conceptualizations of economic inequality and whether they consider it a problem. This understanding is key to tackling growing societal disparities.
Keywords: economic inequality, system justification, morality, fairness, university students
The “American Dream” is often portrayed as achievable through individual attributes, such as hard work and intelligence (Davidai, 2018). However, national polls reveal that only 53% of American adults still believe the American Dream is possible, and less than 15% of Black adults believe that they have
achieved it (Borelli, 2024). Indeed, economic inequality— the unequal distribution of monetary and material assets—is at an alltime high in the United States (Suss et al., 2024). Economic inequalities have expansive impacts on all sectors of society, including health, educational, social, and psychological indices of wellbeing (Duncan
Diversity badge earned for conducting research focusing on aspects of diversity.
et al., 2010; García Sánchez et al., 2024). Yet, most U.S. adults do not consider economic inequality a top societal issue warranting immediate action (Day & Fiske, 2017). This may be because some individuals view these inequalities as justified (Napier & Jost, 2008).
Economic System Justification
Indeed, many U.S. adolescents and adults appear to prefer some level of inequality within their social system, viewing it as necessary (Arsenio & Willems, 2017; Norton & Ariely, 2011). Economic system justification is the belief that society inherently provides equal opportunities for success and any resulting disparities are therefore legitimate (Goudarzi et al., 2020; Kay & Jost, 2003). This belief enables individuals to rationalize wealth and poverty and dulls their awareness of harmful disparities (Jost et al., 2004; Willis et al., 2022).
Adolescents and adults vastly underestimate the extent of U.S. economic inequality but prefer a more egalitarian system (Arsenio, 2018; Norton & Ariely, 2011). The discrepancy between actual and ideal U.S. wealth distributions may be related to economic system justification beliefs, as those who rationalize the status quo may underestimate or overlook existing disparities. For example, Chinese adults who regarded inequality as legitimate perceived less inequality in their community six years later (Du & King, 2022). Chinese adolescents with stronger system justification beliefs also perceived lower levels of economic inequality (Li et al., 2023). However, Arsenio and Willems (2017) found that U.S. adolescents’ perceptions of societal fairness did not directly correlate with their views on wealth distribution, suggesting that the relationship between system justification and perceptions of wealth distribution may develop more prominently in young adulthood.
Social group membership and life experiences may also shape system justification beliefs. Individuals from advantaged backgrounds rationalize the system and view inequality as necessary for maintaining their access to resources (Brown et al., 2022). In contrast, experiences of inequality weaken beliefs in social mobility and upward advancement among marginalized groups (Browman et al., 2019), potentially leading them to view the system as unfair and society as more unequal. Paradoxically, there has also been evidence that those most disadvantaged by the status quo may feel a stronger psychological need to reduce ideological dissonance, making them more likely to justify the social system (Arsenio & Willems, 2017; Jost et al., 2003). Across five U.S. national surveys, Jost et al. (2003) found that lowincome respondents and African Americans were more likely to view economic inequality as legitimate and necessary. However, recent research has shown that disadvantaged groups may not
always justify the system; although some may support existing inequality, others express few system justifying attitudes (Kesberg et al., 2024). Overall, it remains unclear which groups are most likely to hold system justification beliefs and how this contributes to the persistence of economic inequality.
How Economic System Justification May Relate to Perceptions of the Causes of Inequality
How individuals perceive economic inequality, whether as stemming from personal effort or systemic barriers, may be related to their moral judgments about these disparities. Individuals who believe that the world is inherently fair often view inequality as more justified (García Sánchez et al., 2022). However, it remains unclear whether they tend to attribute inequality to individuallevel factors, such as merit, or structural forces, such as discriminatory policies—and which of these sources they evaluate more positively. Individual sources of inequality include internal variables individuals can control, such as work ethic, intelligence, and motivation, and structural sources of inequality refer to the barriers of a social structure that systematically limit individuals’ access to resources and opportunities (Amemiya et al., 2023; Rizzo & Killen, 2020).
Perceptions of the causes of economic inequality can be shaped by factors such as age, race, ethnicity, and socioeconomic status. Although scholars frequently cite structural sources as prominent contributors to social inequalities (Kamande et al., 2024), both U.S. children and adults often use individual explanations (Christiani et al., 2024; Hussak & Cimpian, 2018). Marginalized groups, such as Black and Latine adolescents, tend to increasingly adopt structural explanations for poverty and inequality as they progress through high school (Diaz et al., 2023). Conversely, there is evidence that adolescents with disadvantaged social statuses (e.g., lower parental education, lower community socioeconomic status) are more likely to cite individual factors, such as work ethic, whereas those with advantaged social statuses emphasize structural factors to explain the wage gap (Flanagan et al., 2014). These mixed findings suggest that although people tend to develop more nuanced views of wealth and poverty with age, minoritized individuals may either recognize systemic inequalities or lean on individual explanations as a form of psychological resilience.
Moral reasoning helps individuals determine whether an inequality is justified by considering the reason why the inequality was formed (Killen & Dahl, 2021). Those assuming inequalities are due to individual differences tend to justify disparities as fair rewards for hard work, whereas structural inequalities, seen as
externally imposed and discriminatory, are more likely to be viewed as unfair (Burkholder et al., 2024). In fact, a stronger endorsement of individual causes of inequality is linked to greater satisfaction with one’s own economic situation (Jost et al., 2003). Children also display greater support for disparities when they are framed in terms of individual rather than structural factors (Hussak & Cimpian, 2015). This propensity to evaluate some sources of inequality favorably and view society as fair may generate greater support for an unequal distribution of wealth. Indeed, adults with higher system justification beliefs are less likely to express negative emotions when confronted with homelessness and may be less willing to help those in need (Goudarzi et al., 2020; Park et al., 2024).
Present Study
The present study investigated the relationship between university students’ economic system justification beliefs and their moral evaluations of economic inequality, perceptions of how wealth and poverty are formed, and expectations of how wealth is distributed within the United States. Consistent with previous research (Burkholder et al., 2024), participants evaluated economic inequalities created through multiple sources. As most societal level inequalities are hidden (in that they are not explicitly defined), participants evaluated a hidden inequality with no associated cause to establish their baseline assessment of inequality (Burkholder et al., 2024). Then, in a random order, participants evaluated additional inequalities with explicit causes: (a) structural inequalities constructed through external forces like unequal opportunities or inheritance (Amemiya et al., 2023), (b) individual inequalities created through personality trait differences like work ethic or intelligence (Rizzo & Killen, 2020), and (c) a random inequality attributed to luck (Burkholder et al., 2024).
This study included university students; higher education environments deepen students’ understanding of societal structures (Schofer et al., 2021). As young adults prepare to enter a society marked by increasing social stratification, their attitudes about social inequalities are crucial to investigate, as they may influence policy change and implementation. This developmental stage is particularly significant for shaping views on economic inequality, as many university students have gained some economic independence from their family but have not yet fully entered the workforce (Flanagan & Levine, 2010). As a result, they may begin to attend to societal economic issues. In fact, one study found that young adults in Germany were more optimistic about upward social mobility than older adults (Weiss et al., 2022). Thus, the university years represent an ideal period to examine system justification beliefs.
Hypotheses
We expected that participants would evaluate individual and random inequalities positively, structural inequalities negatively, and hidden inequalities neutrally (H1). We also hypothesized that participants’ evaluations would be related to their system justification beliefs; those with higher system justifying beliefs would view all inequalities as more acceptable, regardless of cause (H1.1). Finally, we predicted that participants’ social group memberships would influence their evaluations; participants with historically higher status social group memberships (men, White) would evaluate inequalities more positively than those with historically lower status social group memberships (women, participants of color; H1.2).
Consistent with previous research on expectations about the causes of wealth and poverty (Burkholder et al., 2024), we expected that participants would primarily attribute poverty to structural sources while being divided on whether wealth is due to individual or structural sources (H2). Additionally, participants with higher system justification beliefs would be increasingly likely to endorse an individual source of inequality rather than a structural source as the most important cause of wealth and poverty (H2.1). We also expected these endorsements to change by group membership, such that participants with historically higher status social group memberships (men, White) would be more likely to select an individual cause compared to those with historically lower status social group memberships (women, participants of color; H2.2).
For participants’ expectations for how wealth is and should be distributed, in line with previous research, we expected participants would believe that the actual wealth distribution in the U.S. is more unequal than their ideal wealth distribution (H3). Additionally, those with higher system justification beliefs would choose a more egalitarian distribution to represent the current wealth distribution in U.S. society—and endorse a less egalitarian distribution as their ideal—than would those with lower system justification beliefs (H3.1). We also expected that participants with historically higher status social group memberships (men, White) would view society as more egalitarian and prefer the distribution to be less egalitarian than their peers who hold historically lower status social group memberships (women, participants of color; H3.2).
Method
Participants
The present study included 191 university students (18–23 years old, Mage = 19.01 years, SDage = 1.02) attending a small liberal arts university in the Southeastern United
WINTER 2025
PSI CHI JOURNAL OF PSYCHOLOGICAL RESEARCH
States. There were 115 (60.2%) women, 74 (38.7%) men, 1 (0.5%) questioning gender, and 1 (0.5%) who preferred not to list their gender. Racial composition of the sample was reported by participants as follows: 20 (10.5%) were Black or African American, 140 (73.3%) were White or European American, 8 (4.2%) were Asian American or Pacific Islander, 1 (0.5%) was Native American or Alaska Native, 13 (6.8%) were multiracial, 5 (2.6%) identified as another race not listed, and 4 (2.1%) preferred not to respond. For ethnic composition of the sample, 20 (10.5%) of participants selfidentified as Latine.
Design and Procedure
The data were collected between October 2023 and April 2024, and the project was approved by Furman University’s institutional review board, “Introduction to Psychology Online Survey.” Participants were recruited through a convenience sample from all the university’s Introduction to Psychology courses offered in the 2023–2024 academic year. This study was one of several research study options for students to fulfill the Introduction to Psychology research participation requirement. Students who did not want to participate in a research study could complete an alternative assignment (a written summary of an empirical research article). 77.64% of eligible students completed the survey. Surveys were administered on an online survey platform (Qualtrics) as part of a larger project, and participants were expected to complete this portion of the survey in about five minutes. As beliefs about economic inequality may change over time due to external events, this study employed a crosssectional design to capture university students’ beliefs during one academic year. The assessments of participants’ judgments were the following: (a) economic system justification beliefs; (b) evaluations of different sources of inequality (hidden, individual, structural, random); (c) the most important reason for wealth and poverty, respectively (individual, structural, random); and (d) perceptions of actual and ideal U.S. wealth distributions. Additionally, participants reported their race, gender, and age.
Measures
Economic System Justification
Participants completed an established eight item measure to examine their economic system justification beliefs (Kay & Jost, 2003). For each item (e.g., “In general, I find society to be fair”), they indicated the extent to which they agreed with the statement on a 7point scale from 1 (strongly disagree) to 7 (strongly agree). In line with previous research, items 3 and 7 were reversecoded and a composite was made by averaging scores across the eight items; higher scores represented
higher system justification beliefs. The scale was highly reliable in this sample (α = .85) and was consistent with Kay & Jost’s (2003) use of the measure (α = .87).
Moral Evaluations of Different Sources of Inequality
Adapted from Burkholder et al. (2024), participants evaluated six distinct sources of economic inequality (“How okay is it that some people are rich and some people are poor?”) on 6point scales from 1 (really not okay) to 6 (really okay). The six sources were as follows: hidden (no additional reason provided); individual (work ethic): “Let’s say that some people worked hard and became rich and some people were lazy and became poor.”; individual (intelligence): “Let’s say that some people were smart so they became rich and some people were not smart so they became poor.”; structural (unequal opportunities): “Let’s say that some people were given good opportunities and became rich and some people were not given good opportunities and became poor.”; structural (inheritance): “Let’s say that some people were born into families with a lot of money and stayed rich, and some people were born into families with a little bit of money and stayed poor.”; random (luck): “Let’s say that some people were lucky so they became rich and some people were not so lucky so they became poor.” In line with previous use of this measure (Burkholder et al., 2024), each item was analyzed separately to determine whether participants’ evaluations differed between the sources of inequality.
Expectations of the Sources of Wealth and Poverty
To test whether participants expected individual, structural, or random sources of economic inequality to be the main cause of wealth and poverty, participants were presented with two prompts: (1) “In general, what is the most important reason for why people are poor?”; and (2) “In general, what is the most important reason for why people are rich?” Participants selected one response for each prompt out of the following five statements: individual (work ethic): “Because they [did not work/worked] hard”; individual (intelligence): “Because they [were not so/were] smart”; structural (inheritance): “Because they were born into families with [a little bit/a lot] of money”; structural (unequal opportunities): “Because they [didn’t receive many/received many] opportunities”; and random (luck): “Because they [were not so/were] lucky.” Responses were categorically recorded as 0 (a structural source selected), 1 (an individual source selected), or 2 (a random source selected).
Perceptions of United States Wealth Distribution
To measure participants’ perceptions of the actual U.S. wealth distribution (Arsenio & Willems, 2017), participants were shown five drawings representing potential wealth distributions (Figure 1) and read the following instructions:
Not all countries are the same. Some countries might have a few rich people at the top with a lot of poor people at the bottom and not too many people in the middle. Other countries might have a lot of rich people, only a few poor people, and many people in the middle. Please look at the drawings below and check the bubble of the country that looks the most like the United States of America.
Participants indicated their response by selecting one of five options, each correlating with a drawing labeled alphabetically, with 1 (“Country A”) representing the most unequal distribution and 5 (“Country E”) representing the most egalitarian distribution (see Figure 1).
To measure participants’ perceptions of their ideal U.S. wealth distribution, participants were shown the same five drawings (Figure 1) and read the following prompt:
Previously, we had you consider what drawing you think best represents the United States of America. Now, we want you to consider what you think the United States of America should look like. Please look at the drawings below and check the bubble of the country that you think the United States of America should look like.
Participants again indicated their response by selecting one of five options.
Data Analytic Plan
Analyses were conducted using SPSS Version 28 and missing data were removed through listwise deletion. First, we explored how age, race, and gender relate to participants’ social mobility beliefs by conducting a multiple linear
regression with gender (female = 0, male = 1), race (person of color = 0, White = 1), and age as predictors. Multiple linear regression allowed for the examination of multiple predictors while controlling for shared variance.
Then, to test whether participants evaluated each source of inequality as acceptable or unacceptable, we conducted separate one sample t tests against a neutral response (3.5) for each inequality source evaluation (hidden, opportunities, inheritance, work ethic, intelligence, and luck). One sample t tests were used to determine whether participants’ evaluations significantly differed from neutral, indicating either rejection or acceptance of the inequality source. To investigate whether system justification beliefs and participant social statuses impacted inequality evaluations (controlling for participant age), we conducted multiple linear regressions with system justification, gender (female = 0, male = 1), race (person of color = 0, White = 1), and age as predictors of each inequality source evaluation. Multiple regression was used to determine the explained variance of these predictors on evaluations while controlling for age.
To examine whether participants expected wealth and poverty to be caused through structural or individual sources, we conducted binomial proportion tests against a neutral response (.5). These tests evaluated whether the proportion of structural versus individual attributions significantly differed from chance, reflecting a meaningful preference for one type of explanation. To investigate whether system justification beliefs and participant social status influenced their selection of an individual (0) or structural (1) source, we conducted logistic regressions with system justification beliefs, gender (female = 0, male = 1), race (person of color = 0, White = 1), and age as predictors of the acquisition
FIGURE 1
Depictions of Possible Wealth Distributions for Participants’ Expectations of
A. A country with a small rich group at the top, a lot of poor people at the bottom and only a few people in the middle.
B A country like a pyramid with a small rich group at the top, a lot of people in the middle, but most people are at the bottom.
C. A pyramid like country B, but with not so many poor people at the bottom.
of wealth and poverty. This test was appropriate given the dichotomous outcome variable, assessing the likelihood of structural attribution (compared to selecting an individual attribution) as a function of the predictors.
To determine whether participants’ perceptions of the actual U.S. wealth distribution differed from their ideal distribution, we conducted a paired samples t test. This test was selected to compare two withinsubjects measurements (actual vs. ideal), revealing whether participants’
TABLE 1
Correlations Between Study Variables
Variable 1 2 3 4 5 6 7 8 9 10 11 12 13
1. Male -
2. White .01 -
3. Age .13 .05 -
4. System Justification .27*** -.11 -.03 -
5. Evaluation: Hidden .30*** -.01 .10 .50*** -
6. Evaluation: Work Ethic .10 .03 .08 .38*** .64*** -
Note. Significant values are denoted with * = p < .05; ** = p < .01, *** = p < .001. “Male” represents the dichotomous gender variable (0 = Female, 1 = Male). “White” represents the dichotomous race variable (0 = participant of color, 1 = White).
TABLE 2
Unstandardized and Standardized Regression Coefficients Predicting Evaluations of Different Sources of Inequality
ideals deviated from their perceptions of reality. To investigate whether system justification and participant demographics influenced perceptions of societal wealth distribution, we conducted multiple linear regressions with system justification, gender (female = 0, male = 1), race (person of color = 0, White = 1), and age as predictors of participants’ actual and ideal perceptions of the U.S. wealth distribution. This approach identifies which factors predicted variance in distribution perceptions, controlling for the explained variance of all predictors.
Results
Correlations between all study variables are reported in Table 1. In general, university students viewed the system as unfair, M = 3.32, SD = 1.04, t(183) = 8.88, p < .001, d = 1.04. The model testing whether age, gender, and race influenced system justification beliefs was significant, F(3, 176) = 6.61, p < .001, R2 = .10, with all model predictors explaining 10% of the variance in system justification. When accounting for all other variables in the model, male participants (Mmale = 3.68, SDmale = 1.00, Mfemale = 3.11, SDfemale = 1.00, B = 0.61, SE = .15, β = .29, p < .001) and White participants (MWhite = 3.41, SDWhite = 1.07, MPoC = 3.09, SDPoC = 0.97, B = 0.39, SE = .17, β = .17, p = .02) had greater system justification beliefs. However, age did not influence system justification beliefs (B = 0.08, SE = .07, β = .08, p = .26).
Moral Evaluations of Different Sources of Wealth Inequality
Overall, one sample t tests revealed that participants evaluated a hidden source of inequality positively ( M = 3.72, SD = 1.42, t (188) = 2.13, p = .02, d = 1.42), and also evaluated both individual sources of inequality positively (Work Ethic: M = 4.98, SD = 1.11, t (188) = 18.33, p < .001, d = 1.11; Intelligence: M = 3.85, SD = 1.36, t(189) = 3.58, p < .001, d = 1.36).
In contrast, participants evaluated structural sources of inequality negatively (Opportunities: M = 2.65, SD = 1.18, t(188) = 9.91, p < .001, d = 1.12; Inheritance: M = 2.89, SD = 1.32, t(188) = 6.37, p < .001, d = 1.32), and also negatively evaluated the random inequality (luck), M = 3.20, SD = 1.37, t(188) = 3.03, p = .001, d = 1.37.
How System Justification and Status Predict Moral Evaluation of a Hidden Inequality
Note.Table reports unstandardized regression coefficients with standard error estimates and standardized regression coefficients. Significant values are denoted with * = p < .05; ** = p < .01, *** = p < .001. “Male” represents the dichotomous gender variable (0 = Female, 1 = Male). “White” represents the dichotomous race variable (0 = participant of color, 1 = White).
Unstandardized and standardized regression coefficients are reported in Table 2. For the regression testing participants’ evaluations of a hidden inequality, F(4, 173) = 18.16, p < .001, R 2 = .30, participants with greater system justification beliefs evaluated a hidden inequality more positively, p < .001. Male participants (M = 4.26, SD = 1.29) also evaluated the hidden inequality more favorably than
did female participants (M = 3.39, SD = 1.38), p = .003. However, there was no difference in evaluations by race (p = .70) or age (p = .26) when accounting for the other variables in the model. Therefore, partially consistent with our hypotheses, participants with higher system justification beliefs (H1.1) and men (H1.2) viewed hidden inequalities as more acceptable.
How System Justification and Status Predict Moral Evaluations of Individual Inequalities
We tested how system justification relates to evaluations of two individual sources of inequality: work ethic and intelligence. As shown in Table 2, when evaluating an inequality due to work ethic, F(4, 172) = 8.81, p < .001, R2 = .17, greater system justification beliefs predicted more acceptable evaluations of inequality, p < .001. However, there was no difference in evaluations by gender (p = .63), race (p = .14) or age (p = .54) when accounting for the other variables in the model. When evaluating an inequality due to intelligence, F(4, 173) = 8.75, p < .001, R2 = .17, participants with greater system justification beliefs (p < .001) and men (Mmale = 4.27, SDmale = 1.23, M female = 3.62, SD female = 1.35, p = .01) evaluated the inequality more favorably. There were no differences in evaluations by race (p = .73) or age (p = .40) with other variables in the model. Therefore, partially consistent with our hypotheses, higher system justification beliefs predicted more acceptance of individual inequalities (H1.1), and men viewed inequalities created through differences in intelligence more acceptably than did women (H1.2).
How System Justification and Status Predict Moral Evaluations of Structural Inequalities
We investigated the influence of system justification on two structural sources of inequality: unequal opportunities and inheritance. As reported in Table 2, when evaluating an inequality due to unequal opportunities, F(4, 173) = 25.82, p < .001, R2 = .37, participants with greater system justification beliefs (p < .001) and male participants (Mmale = 3.08, SDmale = 1.30, Mfemale = 2.39, SDfemale = 1.00, p = .02) viewed the inequality as more acceptable. However, race (p = .31) and age (p = .16) did not significantly predict evaluations when accounting for the other variables in the model. When evaluating an inequality due to unequal inheritance (Table 2), F(4, 172) = 26.25, p < .001, R2 = .38, participants with greater system justification beliefs (p < .001) viewed the inequality as more acceptable. However, there were no differences in evaluations by gender (p = .11), race (p = .95) or age (p = .81) when accounting for the other variables in the model. Therefore, partially consistent with our hypotheses, participants with higher system justification beliefs viewed structural inequalities as
more acceptable (H1.1). Men also viewed structural inequalities due to unequal opportunities as more acceptable than did women (H1.2).
How System Justification and Status Predict Moral Evaluation of a Random Inequality
When evaluating a random inequality created through luck (Table 2), F (4, 173) = 20.51, p < .001, R 2 = .25, Neubert and Burkholder | System
Predicted Probability of Expecting Individual (Versus Structural) Sources are the Most Important Cause of Wealth
Note. Figure represents participants’ predicted probabilities of choosing an individual cause (1) over a structural cause (0) as the most important reason for wealthiness by their system justification beliefs.
Predicted Probability of Expecting Individual (Versus Structural) Sources are the Most Important Cause of Poverty
Note. Figure
FIGURE 2
FIGURE 3
WINTER 2025
PSI CHI JOURNAL OF PSYCHOLOGICAL RESEARCH
participants with greater system justification beliefs (p < .001) and male participants (Mmale = 3.65, SDmale = 1.43, Mfemale = 2.94, SDfemale = 1.24, p = .05) evaluated the inequality more favorably. There were no differences in evaluations by race (p = .43) or age (p = .13) when accounting for the other variables in the model. Therefore, partially consistent with our hypotheses, participants with higher system justification beliefs (H1.1) and men (H1.2) viewed random inequalities as more acceptable.
Perceptions of the Cause of Wealth and Poverty
In line with our expectations (H2), significantly more participants selected a structural cause (n = 134, 74%) than an individual cause ( n = 48, 26%) as the most important reason for why people were poor, p < .001. Only marginally more participants selected a structural cause (n = 103, 57%) versus an individual cause (n = 77, 43%) as the most important reason for why people were rich, p = .06.
How System Justification and Status Predict Perceptions of the Cause of Wealth
For predicting why people become wealthy, LR χ2(4) = 30.01, Nagelkerke R2 = .22, p < .001, system justification was significant (Figure 2), B = 0.43, SE = .20, t = 21.55, p < .001, Exp(B) = 2.55, 95% CI [1.72, 3.79]. Gender, B = 0.11, SE = .38, t = 0.10, p = .76, Exp(B) = 0.89, 95% CI [0.44, 1.83], race, B = 0.36, SE = .40, t = 0.83, p = .36, Exp(B) = 0.70, 95% CI [0.32, 1.51], and age, B = 0.19, SE = .17, t = 1.18, p = .28, Exp( B ) = 0.83, 95% CI [0.59, 1.16], did not significantly predict participants’ perceptions of the cause of wealthiness when controlling for the other variables in the model.
and
Note. Table reports unstandardized regression coefficients with standard error estimates and standardized regression coefficients. Significant values are denoted with ** = p < .01. “Male” represents the dichotomous gender variable (0 = Female, 1 = Male). “White” represents the dichotomous race variable (0 = participant of color, 1 = White).
How System Justification and Status Predict Perceptions of the Cause of Poverty
For predicting why people become poor, LR χ2(4) = 18.20, Nagelkerke R2 = .15, p = .001, system justification was significant (Figure 3), B = 0.63, SE = 0.20, t = 10.14, p = .001, Exp(B) = 1.88, 95% CI [1.27, 2.77]. Gender, B = 0.42, SE = 0.38, t = 1.22, p = .27, Exp(B) = 1.53, 95% CI [0.72, 3.23], race, B = 0.32, SE = 0.41, t = 0.60, p = .44, Exp(B) = 0.73, 95% CI [0.32, 1.63], and age, B = 0.33, SE = 0.20, t = 2.78, p = .10, Exp(B) = 0.72, 95% CI [0.48, 1.06], did not significantly predict participants’ perceptions of the cause of poverty when controlling for the other variables in the model.
Thus, consistent with our hypothesis (H2), participants who held higher system justification beliefs were more likely to select an individual source of inequality as the cause of both wealth and poverty. However, contrary to our beliefs, gender and racial status did not influence participants’ perceptions (H2.1).
Perceptions of the United States Wealth Distribution
Supporting our hypothesis (H3), participants expected that the actual U.S. wealth distribution ( M = 2.82, SD = .94) was more unequal than what participants considered their ideal distribution (M = 4.04, SD = .81), t(183) = 14.49, p < .001, d = 1.07. Although participants thought the U.S. had an unequal wealth distribution, they preferred a more egalitarian distribution.
How System Justification and Status Predict Perceptions of the Actual Distribution of Wealth
For participants’ perceptions of the actual U.S. wealth distribution (Table 3) F(4,171) = 4.46, p < .001, R2 = .09, participants with greater system justification beliefs ( p = .002) and participants of color ( M PoC = 3.10, SD PoC = 0.86, M White = 2.73, SD White = 0.96, p = .002) viewed the wealth distribution as more egalitarian. However, gender (p = .39) and age (p = .15) did not significantly predict perceptions when accounting for the other variables in the model. Therefore, consistent with our hypothesis (H3.1), higher system justification beliefs were associated with rating the U.S. wealth distribution as more egalitarian. However, contrary to our expectations (H3.2), when controlling for system justification beliefs, participants of color viewed the actual U.S. wealth distribution as more egalitarian than did White participants.
How System Justification and Status Predict Perceptions of the Ideal Distribution of Wealth
For participants’ perceptions of the ideal U.S. wealth distribution (Table 3), F(4,171) = 4.46, p = .43, R2 = .02, although there was a trend toward participants with
greater system justification beliefs choosing a more unequal ideal distribution, it was not significant, p = .07. There were also no differences by gender (p = .75), race (p = .28), or age (p = .88) when accounting for the other variables in the model. Therefore, inconsistent with our hypotheses, participants’ perceptions of the ideal U.S. wealth distribution did not differ by system justification beliefs (H3.1) or gender and racial status (H3.2).
Discussion
The present study investigated the relationships between system justification beliefs and university students’ moral evaluations of economic inequality, perceptions of how wealth and poverty are formed, and ideas of how wealth is and should be distributed in the U.S. Overall, students with higher system justification beliefs viewed all sources of economic inequality (hidden, random, structural, individual) as more acceptable, and were also more likely to attribute wealth and poverty to individual sources. Additionally, those with higher system justification beliefs perceived the current distribution as more egalitarian and were trending toward believing the U.S. should have a less egalitarian distribution. This suggests that emerging adults’ perceptions and moral judgments of economic inequality, as well as how they think wealth is distributed in society, are related to their perceptions of system fairness. Men and White participants also reported higher system justification beliefs, and men believed that many sources of inequality (i.e., the hidden source, the random source, unequal opportunities, and intelligence) were more acceptable than did women. Thus, individuals with higherstatus group memberships may be more likely to justify the system, and men specifically may be less perturbed by some types of inequality.
University Students Who Justify the System Are More Accepting of Economic Inequality
To our knowledge, our findings are among the first to examine how system justification beliefs relate to moral evaluations of economic inequality in a sample of emerging adults. Most research on system justification beliefs and perceptions of inequality have focused on child or adult samples exclusively, and fewer have addressed how moral reasoning shifts by the source of inequality. As an educational setting largely comprised of young adults, higher education is a particularly influential environment for shaping perspectives on the U.S. social system (Broćić & Miles, 2021). In addition, issues related to the current economic system may be especially salient for university students who have the opportunity to practice selfsufficiency while not entirely achieving financial independence from their families (Flanagan & Levine, 2010).
University students in this study viewed the existing system as unfair. Their overall attitude supports previous literature displaying that Americans generally recognize significant wealth inequality, even though they tend to underestimate its full magnitude (Norton & Ariely, 2011). This finding also aligns with developmental research indicating that, with age, individuals increasingly recognize and critically evaluate existing social systems (Arsenio et al., 2012).
Despite recognizing that the existing system is unfair, university students positively evaluated the hidden inequality and both individual inequalities. This may be due to the belief that meritorious work makes some more deserving of monetary benefits than others (Burkholder et al., 2024). Both children and adults often view individual inequalities as fairer (Hussak & Cimpian, 2015; Jost et al., 2003); therefore, it is possible that the participants in this sample also viewed these sources as warranted. Support for the hidden source may be attributable to a broader belief in a just world, which could influence the endorsement of inequality as a necessary part of the economic system even if its source is unclear (GarcíaSánchez et al., 2022).
Conversely, university students evaluated a random source (luck) and both structural sources of inequality negatively. This may be because they viewed a random source such as luck as an unpredictable method of socioeconomic movement that is not openly offered or achievable by individual striving. This sample’s negative evaluation of luck differed from children and younger adolescents who evaluated this source positively, suggesting there may be a developmental shift in understanding of random inequalities during the university years (Burkholder et al., 2024). In addition, this study emphasizes that most individuals hold negative views of structural inequalities, as they may recognize them as oppressive and unaffected by personal merit (Kay et al., 2008). These findings suggest that students evaluate different sources of economic inequality in distinct ways, irrespective of their perception of system fairness.
One key finding was that university students with higher system justification beliefs evaluated all sources of economic inequality more favorably. Previous literature has demonstrated the propensity of system justifiers to view individual sources of inequality as necessary and acceptable (Hussak & Cimpian, 2015). However, endorsement of structural inequalities in the present study suggests that system justification beliefs may lead to rationalizing inequalities that are not directly under individual control, such as those due to systemic constraints or luck. Indeed, U.S. adults hold similar beliefs about the possibility of individual social mobility as their European peers; however, U.S. adults are overall more accepting of inequality (Day & Neubert and Burkholder |
Fiske, 2017). It may be that belief in a just system overrides contrary evidence of system unfairness.
It is also possible that individuals with higher system justification beliefs may perceive overall inequality as more acceptable because they are less likely to assume those at the lower end of the hierarchy are harmed. For example, one study found that adults exhibited higher system justification beliefs after being exposed to a “poor but happy” stereotype (Kay & Jost, 2003). Therefore, it may be that those with higher system justification beliefs are less inclined to view any source of inequality as detrimental to those who are poor. This cultural theme may be compounded with the American “bootstraps” narrative, in which even those who come from humble beginnings can become successful through hard work and individual merit (Davidai, 2018). From this perspective, the societal structure is assumed to be inherently fair, placing the responsibility on individuals and their own capabilities to improve their status. However, it remains unclear what additional mechanisms might underlie the positive association between system justification beliefs and evaluations of structural sources of inequality. This presents an interesting direction for future research.
Prior research suggests that social status plays a role in the development of societal fairness perceptions and evaluations. The current study found that system justification beliefs differed as a function of gender and race; male and White participants had higher system justification beliefs, indicating that members of advantaged groups may be more likely to engage in such thinking. This supports the widely held belief among social dominance theorists that members of higherstatus groups tend to hold more favorable attitudes toward maintaining social order compared to those from lowstatus groups (Schmitt et al., 2003). However, other studies have suggested that those who suffer the most from the system may have the greatest need to justify it to reduce cognitive dissonance (Jost et al., 2003). Our findings were inconsistent with this perspective, suggesting that disadvantaged individuals may be more likely to reject the status quo than advantaged individuals. Another possible reason that students of higher social status had higher system justification beliefs may be a function of our sample, which was collected from a predominantly White liberal arts university. It is possible that a more diverse sample in terms of race, ethnicity, and socioeconomic status would reflect more disadvantaged individuals who support the system.
Men were also generally more likely than women to find certain sources of inequality more acceptable, including the hidden source, the random source (i.e., luck), unequal opportunities, and intelligence. It is
possible that men viewed these sources of inequality as more acceptable than women because of their advantaged social position, which systemically provides them with more opportunities and reduces their personal experience with inequality.
System Justification Beliefs Relate to University Students’ Ideas of What Causes Wealth and Poverty
Overall, more university students believed that structural factors, over individual factors, were the primary causes of poverty, and marginally more students thought a structural factor was the most important cause of acquiring wealth. This aligns with previous research highlighting adolescents’ emerging concern about structural inequalities and their support for efforts to reduce them (Elenbaas, 2019). As individuals age, their economic awareness may continue to increase (Weiss et al., 2022). Further, as economic inequality rises, people increasingly attribute economic success and failure to external factors beyond an individual’s control (Davidai, 2018). Given the unprecedented levels of economic disparities in the U.S., it is not surprising that the present study’s results reflect this perspective. Perceptions of the acquisition of wealth had more mixed perceptions, with some individuals believing that wealth was achievable through merit even while simultaneously attributing poverty to external constraints.
Students who held higher system justification beliefs were more likely to believe that individual factors were the primary causes of both wealth and poverty. This finding aligns with previous research showing that system justifiers tend to support the idea of individual merit for achieving economic advancement and attribute less fortunate circumstances to individual shortcomings (Hussak & Cimpian, 2018). The use of individual factors to explain disparities may be due to individuals’ selfprotective motivation to believe that economic mobility is in their control (Kraus & Tan, 2015). Thus, perceptions of economic outcomes relate to system justification beliefs; those who believe the system is inherently fair are more likely to attribute wealth and poverty to factors within an individual’s control.
System Justification Predicts More Egalitarian Perceptions of the United States Wealth Distribution
Consistent with previous research, university students thought the U.S. had an unequal wealth distribution but preferred a more egalitarian distribution (Arsenio, 2018; Norton & Ariely, 2011). This suggests that young U.S. adults are aware of the state of their economic system and recognize the benefits of more egalitarian policies. Yet, those with higher system justification beliefs expected the U.S. to be more egalitarian. This is further
evidence that the relationship between system justification and perceptions of wealth distribution may develop among Americans during young adulthood rather than in adolescence (Arsenio & Willems, 2017). This finding is also consistent with previous research showing that system justifiers tend to legitimize the existing system by downplaying or overlooking evidence of inequality (Du & King, 2022; Goudarzi et al., 2020), contributing to a diminished awareness of the true extent of economic disparities. On the other hand, students with higher system justification beliefs marginally thought that the wealth distribution should be less egalitarian, which may reflect misperceptions of equality as restricting access to resources and inequality as necessary to their preservation of status (Brown et al., 2022). This partially supports previous research that many Americans may prefer some level of inequality (Arsenio & Willems, 2017; Norton, & Ariely, 2011), and higher system justification may be implicated in rationalizing societal inequality. Future research should further explore the relationship between system justification and ideal distributions of societal wealth.
Contrary to our hypothesis, White participants overall viewed the U.S. as more unequally distributed than did participants of color. This finding is inconsistent with recent research showing that those from minoritized backgrounds view the system as less fair and society as more unequal due to experiences of inequality (Browman et al., 2019; GarcíaCastro et al., 2023). However, other research has found that individuals from minoritized backgrounds, including Black and Latine individuals, support the system more than their more advantaged peers (Jost et al., 2003). It is possible that participants of color in this sample viewed society as more egalitarian as a protective factor to believe that economic mobility is in their control (Kraus & Tan, 2015). Indeed, previous research has shown that adolescents from minoritized racial and economic statuses are more likely to reference individual factors like work ethic to justify wage disparities (Flanagan et al., 2014). It is possible that this protective tendency may extend to broader expectations of how wealth is distributed in society. Interestingly, in the present study White participants reported higher system justification beliefs than did participants of color, despite assuming the U.S. wealth distribution was more unequal. This shows that recognition of inequality alone is not enough to reduce justification of the system, especially for those who may advantage from that system (Brown et al., 2022). These mixed findings from the present study and the extant literature show that individuals from disadvantaged backgrounds may either support or reject the system (Kesberg et al., 2024) and point to an important avenue for future research.
Limitations and Future Directions
Although the present study offers new insight into how university students perceive the fairness of the U.S. economic system and evaluate inequality, there are a variety of limitations and directions for future research. One main concern is the generalizability of findings due to the predominantly White U.S.based sample collected from a private liberal arts university. This may skew the sample toward reflecting socially advantaged groups (i.e., White, affluent). Although some research has indicated that advantaged groups are more likely to justify the system and evaluate certain forms of inequality as fair (Brown et al., 2022), other studies have suggested that disadvantaged groups may have more incentive to reduce ideological dissonance and thereby legitimize the system (Flanagan et al., 2014; Jost et al., 2003). Future research should aim to recruit a more diverse sample in terms of race, socioeconomic status, and institutional context to capture a wider range of perspectives.
The use of a cross sectional design offers both strengths and limitations for the present study. This research design enabled efficient data collection from a large sample of undergraduate students across an academic year, allowing for the timely exploration of identifying patterns and relationships among key constructs without the logistical demands of a longitudinal design. However, because data were collected at a single time point, the design does not allow for conclusions about causal directionality. Future research using longitudinal or experimental methods would help clarify causal mechanisms and more closely assess how economic beliefs develop over time.
Another area worth considering is the political affiliation of participants. In a study with adults, conservatives were more likely to justify the U.S. social system and think social inequalities were fair (Napier & Jost, 2008). Additionally, previous research has found that support for individual explanations for disparities predicts conservative ideology in both children and adults (Hussak & Cimpian, 2017). Although we did not measure political affiliation in this study, it is possible that students from more conservative backgrounds may evaluate economic inequalities more positively due to greater levels of system justifying beliefs, even when those inequalities are because of structural constraints. Additionally, future research should investigate how participants’ own economic status may influence their perceptions. Although many university students do not have direct knowledge of their family’s annual income, using measures like the subjective social status (Goodman et al., 2001)—a tool capturing perceptions of familial economic status compared to the community—may illuminate whether students from Neubert and Burkholder | System
higher income backgrounds have different patterns of responses compared to their lower income peers. Indeed, in a study with children and adolescents, those who rated themselves as higher in wealth were more likely than their lower wealth peers to say wealth was caused through structural advantages (Burkholder et al., 2024). Finally, this research may have implications for interventions and educational programs. For example, it would be interesting for future research to explore whether reducing system justification beliefs or highlighting structural sources would dampen support for economic inequality. Indeed, in a study with adults, prompting individuals to consider situational attributions for poverty increased their concerns for societal inequality (Piff et al., 2020). However, an educational curriculum intervention designed to prompt adolescents to consider structural explanations for poverty changed adolescents’ endorsements of the reasons for poverty and financial success, but not their beliefs about the government’s responsibility to aid the poor (Mistry et al., 2012). Therefore, the effectiveness of interventions or programs in changing psychological beliefs about economic inequality is an open area for research.
Conclusion
Economic inequality is a central problem impacting many indices of wellbeing (Duncan et al., 2010; GarcíaSánchez et al., 2024). Gaining insight into how people perceive economic inequality is essential for building a more comprehensive understanding of its causes and consequences, as well as for fostering public support for policies that promote equitable access to resources and opportunities, particularly for minoritized groups (Peters & Jetten, 2023). This study highlights how emerging adults’ justification of the economic system relates to their moral evaluations of various sources of inequality and perceptions of how wealth is currently and should ideally be distributed in the U.S. Those with higher system justification beliefs found inequality to be more acceptable, regardless of its source. They also perceived the current wealth distribution as more egalitarian and felt it should be marginally less egalitarian. Together, these patterns suggest that system justifiers tend to downplay or rationalize various sources of economic inequality, underestimate true wealth disparities, and show reduced motivation to support structural changes to wealth distribution. Further, university students who were male or White had higher system justification beliefs, and men believed that some sources of inequality were more acceptable than did women. This suggests that individuals with advantaged social identities may be more inclined to justify the status quo and view certain forms of inequality as more acceptable, potentially because the existing system benefits them.
Although adolescence lays the groundwork for developing socioeconomic views, emerging adulthood in a university context introduces new cognitive and social experiences that further shape these attitudes. In a world facing increasing disparities, this research reveals that although young adults are critically engaging with questions of economic inequality, their perceptions and attitudes may be distorted by psychological motivations to preserve existing systems. These findings point to the importance of early interventions that challenge systemjustifying narratives. Integrating discussions of structural inequality and social justice into civics courses may foster more critical awareness among youth. By helping students question dominant explanations for inequality and engage with the principles of equity and fairness, civics education can play a pivotal role in empowering the next generation to become informed, engaged citizens committed to promoting a more just society.
References
Amemiya, J., Mortenson, E., Heyman, G. D., & Walker C. M. (2023). Thinking structurally: A cognitive framework for understanding how people attribute inequality to structural causes. Perspectives on Psychological Science, 18(2), 259–274. https://doi.org/10.1177/17456916221093593
Arsenio, W. F. (2018). The wealth of nations: International judgments regarding actual and ideal resource distributions. Current Directions in Psychological Science, 27(5), 357–362. https://doi.org/10.1177/0963721418762377
Arsenio, W. F., Preziosi, S., Silberstein, E., & Hamburger, B. (2012). Adolescents’ perceptions of institutional fairness: Relations with moral reasoning, emotions, and behavior. New Directions for Youth Development, 2012(136), 95–110. https://doi.org/10.1002/yd.20041
Arsenio, W. F., & Willems, C. (2017). Adolescents’ conceptions of national wealth distribution: Connections with perceived societal fairness and academic plans. Developmental Psychology, 53(3), 463–474. https://doi.org/10.1037/dev0000263
Borelli, G. (2024, July 2). Americans are split over the state of the American dream. Pew Research Center. https://www.pewresearch.org/shortreads/2024/07/02/americans-are-split-over-the-state-of-the-american-dream/ Broćić, M., & Miles, A. (2021). College and the “Culture War”: Assessing higher education’s influence on moral attitudes. American Sociological Review, 86(5), 856–895. https://doi.org/10.1177/00031224211041094
Browman, A. S., Destin, M., Kearney, M. S., & Levine, P. B. (2019). How economic inequality shapes mobility expectations and behaviour in disadvantaged youth. Nature Human Behaviour, 3(3), 214–220. https://doi.org/10.1038/s41562-018-0523-0
Brown, N. D., Jacoby-Senghor, D. S., & Raymundo, I. (2022). If you rise, I fall: Equality is prevented by the misperception that it harms advantaged groups. Science Advances, 8(18), eabm2385. https://doi.org/10.1126/sciadv.abm2385
Burkholder, A. R., Sims, R. N., & Killen, M. (2024, March). How youth think about wealth inequalities created through structural, individual, and random reasons. Poster presented at the biennial meeting of the Cognitive Development Society, Pasadena, CA.
Christiani, L., Kelly, N.J. & Morgan, J. (2024). The structural origins of racial inequality and attitudes toward redistribution. Race and Social Problems, 17, 128–139. https://doi.org/10.1007/s12552-024-09427-9
Davidai, S. (2018). Why do Americans believe in economic mobility? Economic inequality, external attributions of wealth and poverty, and the belief in economic mobility. Journal of Experimental Social Psychology, 79, 138–148. https://doi.org/10.1016/j.jesp.2018.07.012
Day, M. V., & Fiske, S. T. (2017). Movin’ on up? How perceptions of social mobility affect our willingness to defend the system. Social Psychological and Personality Science, 8(3), 267–274. https://doi.org/10.1177/1948550616678454
Diaz, B., May, S., & Seider, S. (2023). Black and Latinx adolescents’ developing
understandings about poverty, inequality, and opportunity. Applied Developmental Science, 27(2), 115–135. https://doi.org/10.1080/10888691.2022.2040361
Du, H., & King, R. B. (2022). What predicts perceived economic inequality? The roles of actual inequality, system justification, and fairness considerations. British Journal of Social Psychology, 61(1), 19–36. https://doi.org/10.1111/bjso.12468
Duncan, G. J., Ziol-Guest, K. M., & Kalil, A. (2010). Early-childhood poverty and adult attainment, behavior, and health. Child Development, 81(1), 306–325. https://doi.org/10.1111/j.1467-8624.2009.01396.x
Elenbaas, L. (2019). Perceptions of economic inequality are related to children’s judgments about access to opportunities. Developmental Psychology, 55(3), 471–481. https://doi.org/10.1037/dev0000550
Flanagan, C., & Levine, P. (2010). Civic engagement and the transition to adulthood. The Future of Children, 20(1), 159–179. https://doi.org/10.1353/foc.0.0043
Flanagan, C. A., Kim, T., Pykett, A., Finlay, A., Gallay, E. E., & Pancer, M. (2014). Adolescents’ theories about economic inequality: Why are some people poor while others are rich? Developmental Psychology, 50(11), 2512–2525. https://doi.org/10.1037/a0037934
García-Castro, J. D., González, R., Frigolett, C., Jiménez-Moya, G., RodríguezBailón, R., & Willis, G. (2023). Changing attitudes toward redistribution: The role of perceived economic inequality in everyday life and intolerance of inequality. The Journal of Social Psychology, 163(4), 566–581. https://doi.org/10.1080/00224545.2021.2006126
García-Sánchez, E., Correia, I., Pereira, C. R., Willis, G. B., Rodríguez-Bailón, R., & Vala, J. (2022). How fair is economic inequality? Belief in a just world and the legitimation of economic disparities in 27 European countries. Personality and Social Psychology Bulletin, 48(3), 382–395. https://doi.org/10.1177/01461672211002366
García-Sánchez, E., Matamoros-Lima, J., Moreno-Bella, E., Melita, D., SánchezRodríguez, Á., García-Castro, J. D., Rodríguez-Bailón, R., & Willis, G. B. (2024). Perceived economic inequality is negatively associated with subjective well-being through status anxiety and social trust. Social Indicators Research, 172(1), 239–260. https://doi.org/10.1007/s11205-024-03306-x
Goodman, E., Adler, N. E., Kawachi, I., Frazier, A. L., Huang, B., & Colditz, G. A. (2001). Adolescents’ perceptions of social status: Development and evaluation of a new indicator. Pediatrics, 108(2), E31. https://doi.org/10.1542/peds.108.2.e31
Goudarzi, S., Pliskin, R., Jost, J. T., & Knowles, E. D. (2020). Economic system justification predicts muted emotional responses to inequality. Nature Communications, 11(1), 383. https://doi.org/10.1038/s41467-019-14193-z
Hussak, L. J., & Cimpian, A. (2015). An early-emerging explanatory heuristic promotes support for the status quo. Journal of Personality and Social Psychology, 109(5), 739–752. https://doi.org/10.1037/pspa0000033
Hussak, L. J., & Cimpian, A. (2018). Investigating the origins of political views: Biases in explanation predict conservative attitudes in children and adults. Developmental Science, 21(3), e12567. https://doi.org/10.1111/desc.12567
Jost, J. T., Pelham, B. W., Sheldon, O. and Ni Sullivan, B. (2003). Social inequality and the reduction of ideological dissonance on behalf of the system: Evidence of enhanced system justification among the disadvantaged. European Journal of Social Psychology, 33, 13–36. https://doi.org/10.1002/ejsp.127
Jost, J. T., Banaji, M. R., & Nosek, B. A. (2004). A decade of system justification theory: Accumulated evidence of conscious and unconscious bolstering of the status quo. Political Psychology, 25(6), 881–919. https://doi.org/10.1111/j.1467-9221.2004.00402.x
Kamande, A., Walker, J., Martin, M., & Lawson, M. (2024, June 11). The CRI Index 2024 https://www.inequalityindex.org/report/the-commitment-to-reducinginequality-2024/
Kay, A. C., & Jost, J. T. (2003). Complementary justice: Effects of “poor but happy” and “poor but honest” stereotype exemplars on system justification and implicit activation of the justice motive. Journal of Personality and Social Psychology, 85(5), 823–837. https://doi.org/10.1037/0022-3514.85.5.823
Kay, A., Gaucher, D., Napier, J., Callan, M., & Laurin, K. (2008). God and the government: Testing a compensatory control mechanism for the support of external systems. Journal of Personality and Social Psychology, 95, 18–35. https://doi.org/10.1037/0022-3514.95.1.18
Kesberg, R., Brandt, M. J., Easterbrook, M. J., Spruyt, B., & Turner‐Zwinkels, F. (2024). Finding (dis‐)advantaged system justifiers: A bottom‐up approach to explore system justification theory. European Journal of Social
Killen, M., & Dahl, A. (2021). Moral reasoning enables developmental and societal change. Perspectives on Psychological Science, 16(6), 1209–1225. https://doi.org/10.1177/1745691620964076
Kraus, M. W., & Tan, J. J. X. (2015). Americans overestimate social class mobility. Journal of Experimental Social Psychology, 58, 101–111. https://doi.org/10.1016/j.jesp.2015.01.005
Li, W., Wu, J., Yang, Y., Yuan, M., Lin, J., & Kou, Y. (2023). Longitudinal relations between perceived economic inequality and prosocial behavior among Chinese adolescents: The mediating role of system justification. Children and Youth Services Review, 155, 107316. https://doi.org/10.1016/j.childyouth.2023.107316
Mistry, R. S., Brown, C. S., Chow, K. A., & Collins, G. S. (2012). Increasing the complexity of young adolescents’ beliefs about poverty and inequality: Results of an 8th grade social studies curriculum intervention. Journal of Youth and Adolescence, 41(6), 704–716. https://doi.org/10.1007/s10964-011-9699-6
Napier, J. L., & Jost, J. T. (2008). Why are conservatives happier than liberals? Psychological Science, 19(6), 565–572. https://doi.org/10.1111/j.1467-9280.2008.02124.x
Norton, M. I., & Ariely, D. (2011). Building a better America—One wealth quintile at a time. Perspectives on Psychological Science, 6(1), 9–12. https://doi.org/10.1177/1745691610393524
Park, L E., Ward, D. E., Jung, H. Y., Weng, J. (2024). Perceived social mobility and system justification predict greater well-being, but less prosocial behaviour. European Journal of Social Psychology, 54(4), 859–877. https://doi.org/10.1002/ejsp.3054
Peters, K., & Jetten, J. (2023). How living in economically unequal societies shapes our minds and our social lives. British Journal of Psychology, 114(2), 515–531. https://doi.org/10.1111/bjop.12632
Piff, P. K., Wiwad, D., Robinson, A. R., Aknin, L. B., Mercier, B., & Shariff, A. (2020). Shifting attributions for poverty motivates opposition to inequality and enhances egalitarianism. Nature Human Behaviour, 4(5), 496–505. https://doi.org/10.1038/s41562-020-0835-8
Rizzo, M. T., & Killen, M. (2020). Children’s evaluations of individually and structurally based inequalities: The role of status. Developmental Psychology, 56(12), 2223–2235. https://doi.org/10.1037/dev0001118
Schmitt, M. T., Branscombe, N. R., & Kappen, D. M. (2003). Attitudes toward group-based inequality: Social dominance or social identity? The British Journal of Social Psychology, 42(2), 161–186. https://doi.org/10.1348/014466603322127166
Schofer, E., Ramirez, F. O., & Meyer, J. W. (2021). The societal consequences of higher education. Sociology of Education, 94(1), 1–19. https://doi.org/10.1177/0038040720942912
Suss, J., Kemeny, T., & Connor, D. S. (2024). GEOWEALTH-US: Spatial wealth inequality data for the United States, 1960–2020. Scientific Data, 11(1), 253. https://doi.org/10.1038/s41597-024-03059-9
Weiss, D., Greve, W., & Kunzmann, U. (2022). Responses to social inequality across the life span: The role of social status and upward mobility beliefs. International Journal of Behavioral Development, 46(4), 261–277. https://doi.org/10.1177/01650254221089615
Willis, G. B., García-Sánchez, E., Sánchez-Rodríguez, A.., García-Castro, J. D., & Rodríguez-Bailón, R. (2022). The psychosocial effects of economic inequality depend on its perception. Nature Reviews Psychology, 1(5), 301–309. https://doi.org/10.1038/s44159-022-00044-0
Author Note
The authors do not have financial support to report for the present study and have no competing interests to declare.
The authors thank the research assistants who supported this project and provided feedback on the manuscript: Rose Beacham, Margaret Belenky, Emme Edwards, Natalie Huber, Caitlin Witherow, and Sky’Asia Wright. We also thank Jason Hayden, who manages the database from which we recruited our participants. We show our sincere gratitude to the participants involved with this study.
Correspondence concerning this article should be addressed to Kayla Neubert, University of Oregon, Department of Psychology, Straub Hall, 1451 Onyx Street, Eugene, OR, 97403, USA.
Contact: kpneu@uoregon.edu; 7324030132 (phone).
Exploring the Interplay Between Lexical Context and Attentional
Allocation in the Lexical Decision Task
Olivia Sroka, Kaye Deenihan, Mariah Fraser, and Zane Zheng* Department of Psychology, Lasell University
ABSTRACT. The lexical decision task, commonly used in psycholinguistic research, measures response speed and accuracy to word and nonword stimuli. Although evidence suggests that the task operates under strategic control, the role of lexical context—defined by the types of stimuli present—on this control remains elusive. Here we attempted to explore whether lexical context influences attentional allocation during the lexical decision task. In Experiment 1, the context included both words (high and low frequency) and orthographically illegal nonwords, where decisions could be made based on orthographic information. Results showed that focusing on orthography required minimal attentional resources, leaving room for interference from a superimposed, unattended tilted grating. In Experiment 2, we removed the orthographically illegal nonwords, increasing the task’s attentional demands as decisions now required processing beyond orthography. This shift in demands eliminated interference from the tilted grating, suggesting that attentional resources were depleted. Importantly, word frequency information was accessed when attention was directed toward the lexical decision task but not when directed toward the tilted grating. Taken together, these findings indicate the dynamic interplay between lexical context and attentional allocation in the lexical decision task, highlighting the role of cognitive control in lexical processing.
The lexical decision task is a widely used experimental paradigm in psycholinguistics for investigating the cognitive processes underlying word recognition. In this task, participants are presented with a series of letter strings and must quickly decide whether each string forms a valid word (e.g., “book”) or a nonword (e.g., “boko”). Response times (RTs) and accuracy are typically measured, with faster and more accurate responses to real words (compared to nonwords) reflecting the efficiency of lexical access. The lexical decision task is commonly used to examine various factors influencing word recognition and processing, such as word frequency, semantic priming, and attentional effects.
Lexical decisions rely on distinguishing words from nonwords based on orthographic, phonological, and semantic properties (Rubenstein et al., 1970). However, because words and nonwords differ across multiple dimensions, the basis for discrimination can vary. Previous work has shown that judgments of “wordness” are influenced by lexical context, with responses to real words being faster and more accurate when
nonwords are orthographically illegal (e.g., “BRNT”) compared to when they resemble real words, such as pseudowords (e.g., “LAIP”) or pseudohomophones (e.g., “MEEN”; Evans et al., 2012; Ratcliff et al., 2004; Shulman & Davison, 1977). These findings suggest that lexical decisionmaking involves strategic control over processing (Stone & Van Orden, 1993).
Models of visual word recognition have considered the influence of context on lexical decision task performance (e.g., Coltheart, 1978; Paap & Noel, 1991; Rastle et al., 2003). The type of nonword used affects performance by shaping the optimal decision criteria, which in turn facilitates stimulus processing during the task (Seidenberg, 1990; Wagenmakers et al., 2008). For instance, orthographic information alone is sufficient to differentiate words and orthographically illegal nonwords (e.g., BRNT), whereas for words and pseudowords (e.g., LAIP), additional aspects of stimulus dimensions, such as semantic meaning, need to be considered for discrimination. Thus, the nature of nonwords determines which types of information are most relevant for optimizing task performance. At
the same time, the rate at which information is accumulated for decisionmaking depends on the quality of information provided by the stimulus (Ratcliffe et al., 2004). As nonwords become more wordlike (e.g., pseudohomophones), the increasing similarity between words and nonwords makes decision making more challenging. This effectively reduces the signaltonoise ratio in the decision process, leading to slower response times and decreased accuracy. Therefore, nonwords in a lexical decision task are not merely foils; they shape the decision context by influencing both the optimal stimulus dimensions and the overall signal strength of the decision.
When nonwords are orthographically illegal, orthographic regularity has been identified as the primary stimulus dimension for lexical decisionmaking (Grainger & Jacobs, 1996; Seidenberg & McClelland, 1989; Yap et al., 2006). This is supported by previous work showing that accurate lexical decisions can be made based solely on orthographic familiarity, with little or no involvement of phonological or semantic information (e.g., Edwards et al., 2005). Furthermore, when nonwords are distinctly separated from words in terms of orthographic composition, the signalto noise ratio of the discrimination process is enhanced. As such, there are two important implications for the strategic control of processing within contexts containing orthographically illegal nonwords. First, evidence suggests that participants tend to adopt an overall response strategy that efficiently facilitates the processing of both words and nonwords (e.g., Edwards et al., 2004; Gibbs & Van Orden, 1998; Pexman et al., 2001). When nonwords can be distinguished from words based solely on orthographic features, participants engage in less extensive processing beyond the orthographic level, compared to contexts where additional stimulus dimensions must be considered. Second, visual word recognition occurs through a sequential activation process involving visual, orthographic, phonological, and semantic stages (e.g., Coltheart et al., 2001; Grainger & Holcomb, 2009). If the visual/orthographic stage is sufficient for wordnonword discrimination, completing the entire sequence of activation becomes unnecessary, again resulting in less extensive processing. Less extensive processing implies that there is potentially more processing capacity left unused. Balota et al. (1999) proposed a flexible lexical processor in which local context drives attention to relevant processing dimensions. When the relevant dimension demands less extensive processing, as in the case of distinguishing words from orthographically illegal nonwords, greater attentional capacity remains unused. According to the perceptual load theory of attention (e.g., Lavie, 1995;
Lavie & Tsal, 1994), stimuli are processed until perceptual capacity is exhausted. If a task does not exhaust this capacity, any remaining resources may be allocated to the perception of irrelevant stimuli, such as distractors. Therefore, we reason that the presence of orthographically illegal nonwords in a lexical decision task creates a context in which intrusion from irrelevant distractors becomes highly likely.
Previous studies have examined the attentional demands of lexical processing using a dualtask paradigm, where participants perform a lexical decision task and a concurrent task, for example, an auditory probe task (e.g., Becker, 1976; Herdman & Dobbs, 1989; Kellas et al., 1988). The underlying assumption is that if the lexical decision task requires attentional resources, fewer resources will be available for the concurrent task, leading to decreased performance on the probe task in a dualtask versus singletask condition. There are, however, several issues associated with assessing attentional demands with a dualtask paradigm. First, the paradigm requires engaging in two tasks at the same time, which incurs timesharing costs and response competition. Second, actively monitoring both tasks requires additional attentional resources, which may interfere with performance on the primary lexical task. To address these issues, we propose an alternative approach that examines attentional influences within the lexical context using a more passive paradigm. Specifically, we seek evidence of unintentional distractor processing while participants naturally engage in the lexical decision task, without the need for a concurrent, secondary task.
Apart from nonwords, an equally important component of lexical context is the presence of words. This leads us to our next question: Does a lexical context containing orthographically illegal nonwords influence the processing of words in a lexical decision task? Specifically, we aim to examine whether the attentional demands of our lexical context influence the processing of word frequency, defined as the frequency of a word’s occurrence. Word frequency is a crucial source of lexical information that can shape how the mental lexicon is accessed. However, whether attention is required for processing word frequency remains a topic of debate (e.g., LaBerge & Samuels, 1974). Although some studies suggest that attention is necessary for lexicalsemantic processing (Besner et al., 2005; Lachter et al., 2004; McCann et al., 1992; Waechter et al., 2011), others have demonstrated visual word recognition can occur automatically, independent of attentional control (e.g., Allen et al., 2002; Cleland et al., 2006; Lien et al., 2006; Rabovsky et al., 2008). This raises the question of whether the attention allocated to distinguishing words
Interplay Between Context and Attention | Sroka, Deenihan, Fraser, and Zheng
from orthographically illegal nonwords is sufficient to facilitate word frequency processing.
In this study, we aimed to explore the interaction between context and attention in the lexical decision task. Specifically, we focused on a context involving orthographically illegal nonwords and words, manipulating attention through task demands. Two optically superimposed stimuli were presented: a letter string and a tilted Gabor grating. Participants were instructed to either attend to the letter string and perform a lexical decision task, or to attend to the tilted Gabor grating and perform an orientation judgment task. In the first experiment, the letter strings were either words (both high frequency and low frequency) or orthographically illegal nonwords, providing a context in which focusing solely on the orthographic dimension was sufficient for making lexical decisions. We expected that this would leave unused attentional resources available for processing the tilted Gabor gratings, even when it was not the orientation judgment task. Additionally, comparing the processing of high and lowfrequency words in the lexical decision versus the orientation judgment tasks allowed us to explore how attention affects access to word frequency information. In the second experiment, we used the same experimental paradigm but removed
orthographically illegal nonwords. We hypothesized that removing these nonwords would shift participants’ focus from orthographic information to other dimensions of the stimulus, which would be more attentionally demanding. This strategic shift was expected to eliminate unintentional processing of distractors in the lexical decision task, and access to word frequency information would remain unaffected. Overall, our goal was to test how attention interacts context—an oftenoverlooked factor—in the lexical decision task, shedding light on how context influences the processing of lexical information.
Experiment 1
Method Participants
With an a priori power analysis (Faul et al., 2007), we estimated that, for a medium effect size of d = 0.50, a total sample of 34 participants would be needed to achieve a power of .80. However, to account for potential technical issues or data loss, we recruited 50 undergraduate students (33 women; M age = 20.3 ; SD = 1.2) via campus flyers at a university in the Eastern U.S. Each participant received a monetary compensation ($5.00) for their participation, which lasted between 45 minutes and an hour. Due to reported vision or reading difficulty, three participants were eliminated from data analysis, for a total of 47 participants. All participants were righthanded, with no history of neurological disorders. All participants provided informed consent and our University Research Ethics Committee approved the experimental procedures.
Materials
Note. Each trial begins with the onset of a grey circle surrounding a central fixation point on the computer screen. Following a random delay of 1000 to 3000 ms, a Gabor grating and a letter string, superimposed on each other, are presented within the circle. The participant is expected to respond as quickly and accurately as possible by pressing a button on the RT box, based on the task requirements for that block. The next trial begins either immediately after the response or after a 3000 ms timeout. The example trials shown belong to a high-frequency block with 5° tilted gratings: the first trial features an orthographically illegal nonword (“tfca”) derived from a high-frequency word, and the second trial presents a high-frequency word (“seat”).
The experiment was conducted in a quiet, secluded lab space. Stimuli were programmed using PsychoToolBox in MATLAB (MathWorks Inc., MA), and delivered on an Apple iMac computer (2.5 GHz Intel Core i5 processor; 21.5inch monitor; 1920 x 1080 resolution) with a connected Response Time box (RTbox, version 6; Li et al., 2010). The two buttons in the middle of the RTbox, symmetrical through the midline of the computer monitor, were used in this experiment. Participants were seated in a chair that was adjusted such that their eye gaze was at the same level as the center of the computer screen, at a viewing distance of one and a half feet. Participants responded to stimuli by pressing the RTbox buttons with their index finger (left button) and their middle finger (right button) on their right hand.
There were two types of visual stimuli: a Gabor patch with tilted grating and a string of letters. The two stimuli were always superimposed on each other and presented together during the experiment (see Figure 1).
FIGURE 1
Schematic Diagram of the Experimental Procedure (Two Trials Shown)
Each Gabor patch consisted of a 15 cyclesperdegree sinusoidal grating modulated by a Gaussian envelope with full width at halfmaximum of 0.8o. The grating was either tilted to the left or to the right, with a tilted angle of either 5o or 30o from the vertical position.
Each string of letters contained four letters that made up either a word or a nonword. The words were either highfrequency or lowfrequency in terms of their occurrence in the English language, selected from the SUBTLEX database (Brysbaert & New, 2009). The SUBTLEX database, which contains wordfrequency counts based on the subtitles from American films and TV series, is thought to be a better index of the frequency of occurrence of words than widely used databases such as Kučera & Francis (1967) and Celex (Baayen et al., 1993; Balota et al., 2004; Zevin & Seidenberg, 2002). The selected highfrequency words each had a frequency count between 69 and 800 per million words, and the selected lowfrequency words each had a frequency count between 1 and 1.6 per million words. To control for lowlevel linguistic and phonological features, only concrete nouns without homophones were included as word stimuli. In addition, the high and lowfrequency word stimuli were matched on the average neighborhood density (Goldinger et al., 1989). In contrast, the nonwords were created by pseudorandomly mixing up the order of letters from the words (i.e., transposedletter nonwords; Grainger, 2008), such that the generated nonwords were all orthographically illegal (e.g., name > mnae).
There were 80 highfrequency words and 80 lowfrequency words selected for this experiment, which generated 160 corresponding nonwords. The combination of words and nonwords accounted for the 320 experimental trials described below (i.e., none of the stimuli was repeated).
Procedure
Each trial began with a grey circle (diameter = 0.9 in) presented at the center of the computer screen, enclosing a fixation point directly in the middle (see Figure 1). After a random delay between 1000 to 3000 ms, a Gabor patch and a string of letters, superimposed on each other, were presented together within the circle for 25 ms. The choice of 25 ms was based on our pilot testing, suggesting that this duration would keep the task difficult enough that one would need to process the stimuli with focused attention. Participants were instructed to respond as quickly and accurately as possible to the presented stimuli, by pressing one of the two buttons on the response time box. The next trial began after a response had been made, or a timeout of 3000 ms.
There were two types of tasks: orientation judgment and lexical decision. For the orientation judgment task, participants were instructed to pay attention to the tilted
Gabor grating while ignoring the string of letters. When the grating was tilted to the left, they should respond by pressing the left button of the response box. When the grating was tilted to the right, they should respond by pressing the right button of the response box. For the lexical decision task, participants were instructed to focus on the string of letters while ignoring the Gabor patch. When the string of letters was a word, they should respond by pressing the left button of the response box. When the string was a nonword, they should respond by pressing the right button. The orientation of the Gabor grating was counterbalanced with the lexicality of the letter strings to minimize the adaptation in response.
The experiment included 8 blocks of 40 trials each. The 8 blocks represented a 2x2x2 factorial design, involving withinparticipants factors of task (orientation judgment or lexical decision), angle of Gabor gratings (5 o or 30 o), and frequency (high frequency or low frequency) . Note that for the factor of frequency, each block contained an equal number of words and nonwords (e.g., for a highfrequency block, there were 20 trials of high frequency words and 20 trials of nonwords derived from the highfrequency words in the same block). The presentation order of blocks was randomly generated for each participant, and within each block, the trials were randomly permuted. Upon completion of a block, participants were encouraged to take a break and then continue onto their next block.
Before the experiment, there were two practice sessions for each participant, one for each task. The practice sessions were exactly the same as the experimental blocks, except that there were only ten trials. In addition, the experimenter was sitting beside the participant during the practice to ensure that they could follow the instructions and properly respond to the stimuli based on the task. Participants were encouraged to conduct the practice sessions as many times as possible, until optimal comfort in both tasks was achieved.
Results
We examined the interplay between context and attention through both manipulating the presence of different stimuli and imposing task demands. The task demands refer to performing either orientation judgment of Gabor gratings or lexical decision of letter strings. For a more granular analysis, we arranged the frequency of letter strings into four categories, namely highfrequency words (HFW), lowfrequency words (LFW), nonwords generated from highfrequency words (HFNW), and nonwords generated from lowfrequency words (LFNW). To avoid confusion, this frequency factor was then renamed lexicality, because nonwords do not have “frequency.” As a result, there were three
factors in our analysis: task (orientation judgment vs. lexical decision), angle (5o vs. 30o), and lexicality (HFW, LFW, HFNW, LFNW).
Accuracy
We first examined whether stimuli influenced accuracy of performance in either of the two tasks. For the orientation judgment task, a 2 (Angle) x 4 (Lexicality) ANOVA revealed a significant main effect of angle, F(1, 46) = 18.76, p < .001, ηp2 = .29, with higher accuracy for 30o gratings (M = 18.68 or 93.4%, 95% CI [18.15, 19.21]) compared to 5 o gratings ( M = 17.68 or 88.4%, 95% CI [16.99, 18.37]). No significant interaction was observed, F(3, 44) = 0.57, p = .641. For the lexical decision task, however, a 2 (Angle) x 4 (Lexicality) ANOVA showed no significant main effects of lexicality, F (3, 44) = 1.72, p = .177 (Word: M = 12.34 or 62%, 95% CI [11.70, 12.96]; Nonword: M = 11.59 or 58%, 95% CI [10.90, 12.24]), or angle, F (1, 46) = 1.67, p = .203. Additionally, there was no significant interaction, F(3, 44) = 0.02, p = .996. It is worth noting that accuracy across all conditions in both tasks was significantly above the chance level (10 correct trials out of 20), as the 95% confidence intervals for all conditions were above 10 and did not include it.
These results suggest that participants were more accurate in judging widerangle (30o) gratings during the orientation task, a pattern we refer to as the “grating
FIGURE 2
The Accuracy of Task Performance Shown as a Function of Stimulus Type
Note. The accuracy of task performance, measured as the number of correct responses (out of 20 per bar), is plotted against stimulus types for both tasks. In all conditions, performance was significantly above chance. The higher accuracy observed for larger-angle gratings (30°) in the orientation judgment task demonstrates the ‘grating angle effect.’ Because no such effect was found for letter stimuli, results for words and nonwords are presented without further differentiation. 30°: 30° tilted grating; 5°: 5° tilted grating; W: Word; NW: Nonword. Error bars represent standard errors.
angle effect” for simplicity. However, no evidence of an accuracy effect was observed for angle or lexicality in the lexical decision task (see Figure 2).
Response Time
To examine whether there was any interference imposed by either Gabor gratings or letter strings that was indicative of unintentional processing, we focused on the participants’ RT performance for evidence of an interaction between stimuli and task. We used a linear mixedeffects model to analyze RTs of correct trials, with both participants and items modeled as random effects (e.g., Baayen et al., 2008; Brysbaert, 2007). This analysis was based on singletrial data, thereby accounting for the nonindependence of observations within each participant and item. Random effects were introduced sequentially, and their effects on model fit were assessed based on likelihood tests. The final random structure model included participants and items as random intercepts, and angle, lexicality, and task as random slopes that were allowed to vary across participants (i.e., byparticipants random slopes).
We found a main effect of task, F(1, 58.51) = 70.57, p < .001, and a main effect of lexicality, F(3, 201.59) = 8.26, p < .001, qualified by a Task x Lexicality interaction, F(3, 194.42) = 13.44, p < .001. We also found a Task x Angle interaction, F(1, 194.58) = 18.12, p < .001.
For the Task x Lexicality interaction (Figure 3a), post hoc comparisons with Bonferroni corrections indicated that when the task was lexical decision, RTs were significantly shorter for highfrequency words (HFW: M = 658.99 ms, 95% CI [619.65, 698.33]) than for either low frequency words (LFW: M = 762.31 ms, 95% CI [723.77, 800.86]) or nonwords created from lowfrequency words (LFNW: M = 732.39 ms, 95% CI [693.39, 771.40]), ps < .001, demonstrating a robust word frequency effect (Rubenstein et al., 1970; Scarborough et al., 1977). In addition, RTs were longer for lowfrequency words (LFW: M = 762.31 ms, 95% CI [723.77, 800.86]) than for nonwords created from highfrequency words (HFNW: M = 695.98 ms, 95% CI [656.46, 735.49]), p < .001, a finding consistent with some previous work supporting a longer search time for lowfrequency words in mental lexicon (e.g., see Table 1 in Forster & Chambers, 1973). In contrast, when the task was orientation judgment, there was no evidence of a difference in RTs among words and nonwords (i.e., across levels of lexicality), ps = 1.
For the Task x Angle interaction (Figure 3b), post hoc comparisons with Bonferroni corrections indicated that RTs were shorter for 30 o gratings (M = 560.02 ms, 95% CI [524.06, 595.98]) than for 5o gratings (M = 585.89 ms, 95% CI [549.89, 621.88]) during the Interplay Between
Sroka, Deenihan, Fraser, and Zheng | Interplay Between Context
and Attention
orientation judgment task, p = .022. This corroborated the accuracy data in suggesting that judging the orientation of widerangle gratings was indeed easier. However, the pattern was reversed for the lexical decision task, where RTs became longer with the presence of 30o gratings (M = 728.16 ms, 95% CI [691.33, 764.99]) than 5o gratings (M = 696.68 ms, 95% CI [659.82, 733.53]), p = .013, indicating greater interference associated with gratings of wider angle.
Discussion
In this experiment, participants attended and responded to one of the two superimposed stimuli (tilted grating and letter string), as indicated by the task demand. Our results showed that taskguided attention influenced participants’ responses to different stimuli. Specifically, when attending to the letter stimuli, participants exhibited the word frequency effect, but the grating angle effect emerged when attention was directed to the tilted grating. Furthermore, although we found no evidence of the word frequency effect interfering with the orientation judgment task, there was clear evidence of interference from the grating angle effect in the lexical decision task. This interference was reflected in longer response times due to the greater intrusion of the 300 gratings. Overall, the absence of interference from the word frequency effect during the orientation judgement task, coupled with the unintentional processing of the grating angle effect during the lexical decision task, provides support for the interplay between context and attention.
The findings highlight the lexical decision task as a valuable tool for exploring how taskguided attention interacts with contextual factors. In everyday situations, attention is often divided between multiple stimuli, such as when reading while processing peripheral visual cues. The lexical decision task simulates these divided attention scenarios, offering insights into how task demands and stimulus types influence cognitive processing. For example, our results showed that attention to letter stimuli elicited the word frequency effect, but attention to the tilted grating led to the grating angle effect, demonstrating how attentional shifts prioritize different information. However, our findings also reveal that attention does not always shield from distractions. When the lexical decision task was less demanding, the tilted gratings still interfered, suggesting that available attentional resources can still lead to distractions, even with the intention to focus. This highlights the importance of balancing cognitive load and available resources, with implications for multitasking, indicating that, even with focused effort, distractions may still intrude when cognitive resources are not fully taxed.
The letter stimuli used in our experiment consisted of
both words and nonwords, with nonwords being derived from the words within the same block. To control for visual and orthographic confounds, words and nonwords within a block were matched on lowlevel visual features and character composition. This design ensured that any differences in responses to the stimuli could not be attributed to variations in visual features, as the same set of letters could appear as either a word or a nonword. Importantly, although we observed faster responses to high words compared to lowfrequency words in the lexical decision task, no difference in RTs were found for nonwords across the blocks, confirming the validity of our stimulus manipulation. As a result, the absence of interference from the letter stimuli during the orientation judgment task suggests that the observed difficulties in lexical access were driven by shifts in attention, rather than by inherent features of the stimuli.
FIGURE 3
Response Times Presented for the Performance of the Two Tasks
Note. (a) illustrates the task × lexicality interaction, where the word frequency effect was observed in the lexical decision task. LF Block refers to the low-frequency block, HF Block to the high-frequency block, W represents words, and NW represents nonwords. (b) depicts the Task × Angle interaction, showing that 30° gratings elicited faster responses than 5o gratings in the orientationjudgment task, and also caused greater interference during the lexical decision task. 30
grating;
tilted grating. Error bars represent standard errors.
Hoffman & Nelson (1981) demonstrated that accurate detection of a target letter enhanced the discrimination of the orientation of a cooccurring symbol located in the same general area, suggesting that the spread of attention across space. Based on this, one might expect that attention would similarly spread over the letter stimuli during the orientation judgment task, potentially leading to interference from the word frequency effect. However, the RT data from the orientation judgment task showed no evidence of such interference. Importantly, this lack of interference is unlikely to be attributed to attentional overload during the task, as we observed no intrusion of the word frequency effect even in the easy condition (i.e., 30o, largeangle grating) of the orientation judgment task. These findings thus support the idea that activating the word frequency effect requires directed attention.
Previous research suggests that attention can modulate unconscious processing of taskirrelevant stimuli, such as orientation (e.g., Bahrami et al., 2008). In our lexical decision task, the attention required to process orthographic information for judging words and nonwords may have spilled over to the tilted grating stimuli, leading to unintended orientation processing. We argue that this orientation processing occurred because the lexical context (words and orthographically illegal nonwords) accentuated orthographic disparity. The lexical decision task’s reliance on orthographic features required only limited attentional resources, which allowed the remaining resources to be diverted to the tilted gratings, thereby causing interference in the lexical decision task. This explains why the largerangle grating (30o), which was easier to process during the orientation judgment task, also resulted in greater RT costs during the lexical decision task. Because the ignored tilted gratings influenced responses to the attended letter stimuli, we believe that these gratings were processed using the available attentional resources that were not fully allocated to the lexical decision task.
However, a trivial explanation for the results of Experiment 1 is that the 30o grating somehow made the letter stimuli more difficult to visually identify than the 5o grating, leading to slower responses during the lexical decision trials with the 30o gratings. If this were the case, we would expect the interference from tilted gratings to persist, even when the lexical context changes. This is because the trivial explanation focuses on lowlevel visual distraction, rather than attentional allocation linked to the lexical context, as the root cause of the interference. Altering the context (or the type of letter stimuli) would not change the fact that the 30o grating induces more visual interference than the 5o grating. On the other hand, if the interference was driven by the context itself, we would expect that shifting the context to increase the attentional demands of the lexical decision task could eliminate the
interference from the tilted gratings, as fewer attentional resources would be available for the distractors. We tested this in Experiment 2.
Experiment 2
When lexical context requires more than just orthographic information for decisionmaking, additional stimulus dimensions need to be considered as well, increasing both processing load and attentional demand. This, in turn, reduces the likelihood of distractor interference. In Experiment 1, the presence of orthographically illegal nonwords contributed to an orthographic focus. Thus, the most straightforward way to eliminate this focus was to remove those nonwords altogether.
One alternative approach to increasing processing and attentional demand would have been to replace the orthographically illegal nonwords with other types of nonwords, such as pseudowords or orthographically legal nonwords. However, this substitution posed a challenge: pseudowords and orthographically legal nonwords may share varying degrees of orthographic similarity with the original illegal nonwords. Without additional measurements, we had no reliable way to assess how participants would judge “word like” nonwords or how much additional attentional resource their processing might require.
Familiaritybased theories of lexical decision (e.g., Balota & Chumbley, 1984) suggest that lexical decisions rely on the strength of the match between a stimulus and stored memory representations. Introducing pseudowords or orthographically legal nonwords—stimuli that do not exist in memory but resemble real words—could create uncertainty in the judgment process, leading to variability across stimuli and participants. If attentional allocation is influenced not by a global feature (such as orthography) but by the characteristics of individual nonwords, it would be difficult to determine whether observed effects stem from attentional resources or merely stimulusspecific features.
Given these considerations, we opted to remove the orthographically illegal nonwords without substitution, retaining only high and lowfrequency words. Participants in Experiment 2 were still instructed to make a word vs. nonword decision. However, because the absence of nonwords does not align with the conventional definition of a lexical decision task, we referred to this modified paradigm as a “pseudolexical decision task” in the experiment description.
Method
Participants
We recruited 50 undergraduate students (40 women; Mage = 20.6; SD = 1.3) via campus flyers at our university Interplay Between
Sroka, Deenihan,
Fraser,
and Zheng | Interplay Between Context and Attention
for this experiment. Each participant received a $5.00 monetary compensation for their participation, which lasted between 30 and 40 minutes. Due to reported vision difficulty and incompletion of the experiment, 8 participants were eliminated from data analysis, for a final sample size of 42. All participants were righthanded, with no history of neurological disorders. All participants provided informed consent and our University Research Ethics Committee approved the experimental procedures.
Experimental Procedures
The setting and paradigm were the same as Experiment 1, except that each block now contained 20 highfrequency and 20 lowfrequency words that were randomly permuted (i.e., nonwords removed). There were 4 blocks of 40 trials, corresponding to a 2x2 factorial design, with withinparticipants factors of task (orientation judgment or pseudolexical decision) and angle of Gabor grating (5o v.s. 30o). In addition, a factor of lexicality was used to represent high or lowfrequency words in each block.
Results
Accuracy
We examined whether stimulus types influenced accuracy in two tasks (see Figure 4). In the orientation judgment task, a 2 (Angle) x 2 (Lexicality) ANOVA revealed a main effect of angle, F(1, 41) = 8.61, p = .005, ηp2 = .17, where accuracy was higher for 30o gratings (M = 18.80, 95% CI [18.29, 19.31]) compared to 5o gratings (M = 17.58, 95% CI [16.75, 18.42]). For the lexical decision task, the 2 (Angle) x 2 (Lexicality) ANOVA showed no main effect of lexicality, F(1, 41) = 2.22, p = .144 (HF Word: M = 11.71, or 59%, 95% CI [11.22, 12.21]); LF Word: M = 11.32, or 57%, 95% CI [10.86, 11.79]), or angle F(1, 41) = 0.02, p = .883. Additionally, there was no significant interaction, F(1, 41) = 0.09, p = .770. We note that accuracy in all conditions across both tasks was significantly above chance level (10 out of 20), as none of the 95% confidence intervals included 10. These results replicate the accuracy patterns from Experiment 1, confirming that the only accuracy effect occurred for tilted gratings in the orientation judgment task, or the “grating angle effect.”
Response Time
We used a linear mixedeffects model to analyze RTs of correct trials, with participants and items modeled as random effects. Random effects were introduced sequentially, and their effects on model fit were assessed based on likelihood tests. Our final random structure model included participant and item as random intercepts, and angle, lexicality, and task as random slopes
that were allowed to vary across participants. We observed a main effect of task, F (1, 59.82) = 25.59, p < .001, and a main effect of lexicality, F(1, 112.78) = 7.35, p = .008, as well as a Task x Lexicality interaction, F (1, 112.42) = 13.25, p < .001. Post hoc
FIGURE 4
The Accuracy of Task Performance Shown as a Function of Stimulus Types
Note. The accuracy of task performance, represented by the number of correct responses (out of 20 for each bar), is plotted for each stimulus type across the two tasks. In all conditions, performance was significantly above the chance level. In the orientation judgment task, higher accuracy was observed for the 30° gratings compared to the 5° gratings, replicating the “grating angle effect.” 30°: 30° tilted grating; 5°: 5° tilted grating; HF: high-frequency words; LF: low-frequency words. Error bars represent standard errors.
FIGURE 5
Response Times Are Displayed for the Performance of the Two Tasks
Note. High-frequency words elicited faster responses than low-frequency words during the pseudo-lexical decision task, replicating the word frequency effect. However, in contrast to Experiment 1, the 30° gratings no longer interfered with performance on the pseudo-lexical decision task. Error bars represent standard errors.
WINTER 2025
PSI CHI JOURNAL OF PSYCHOLOGICAL RESEARCH
comparisons with Bonferroni corrections indicated that RTs were significantly longer for lowfrequency words ( M = 721.92 ms, 95% CI [674.50, 769.34]) than for highfrequency words (M = 648.97 ms, 95% CI [600.97, 696.96]) during the pseudolexical decision task, p < .001, demonstrating the word frequency effect (Figure 5). This effect vanished, however, when the task was orientation judgment (lowfrequency words: M = 568.20 ms, 95% CI [521.73, 614.67]; highfrequency words: M = 575.73 ms, 95% CI [529.29, 622.18]), p = .625. Overall, these results are consistent with those of Experiment 1, indicating the presence of the word frequency effect when attending to the pseudolexical decision task but the absence of the effect when attending to the orientation judgment task.
In contrast, unlike Experiment 1, we failed to observe a Task x Angle interaction, p = .11, suggesting that there was no evidence of interference from the grating angle effect in the pseudolexical decision task. This is in line with our expectation that the new lexical context increased the processing load and attentional demand of the pseudolexical decision task, consequently making it harder for the tilted gratings to intrude.
Given the absence of nonwords in the pseudolexical decision task, one might argue that participants could quickly recognize all items as words and therefore simply press the “word” button throughout the experiment, with no decision at all. If this were the case, we would expect higher accuracy and much faster RTs in the current experiment, compared to Experiment 1. However, when comparing lexical decision task data across the two experiments, we found that the only significant difference in accuracy occurred in the lowfrequency words with the 30 ° gratings condition, t (87) = 2.25, p = .027, where the accuracy in Experiment 1 was actually higher than in the current experiment, in the opposite direction of what would be expected. For RTs, no significant differences were found across all conditions in the lexical task between two experiments, t(87) < 1.60, ps > .114. Therefore, there was no evidence indicating that participants were simply responding by pressing the ‘word’ button throughout Exp 2 without engaging in cognitive processing. Furthermore, if participants had been simply performing the lexical task without mental processing, such as repeatedly pressing the same button, the task would have become trivial, increasing the likelihood of distractor interference. Given this, it seems counterintuitive that the grating interference in the lexical task would suddenly diminish under these conditions.
Discussion
With the altered context, we replicated both the grating angle effect and the word frequency effect observed in
Experiment 1. However, we found no evidence that either effect interfered with the performance on the opposite task. In particular, the absence of interference from the grating angle effect suggests that it was not the visual features of the tilted gratings causing the disruption. We argue that the increased attentional demand of performing lexical discrimination in the altered context led to the cessation of unintentional processing of irrelevant distractors.
These findings have important implications for everyday behavior, particularly in multitasking scenarios. They suggest that when a task requires more cognitive resources, the likelihood of being distracted by irrelevant stimuli decreases. This insight may inform strategies for optimizing focus in environments where attention must be selectively managed, such as reading in noising settings or working in visually cluttered spaces.
Despite the altered context, the word frequency effect persisted, aligning with our expectation that it would remain even after removing nonwords. In this context, lexical decisions could no longer rely solely on orthographic regularity but instead required access to additional stimulus dimensions, such as phonology and/ or semantic meaning. This may have strengthened the word frequency effect, as it reflects lexical access and subsequent computations that are attentionally demanding (e.g., Balota & Chumbley, 1984; McCann et al., 1992). Furthermore, as in Experiment 1, the word frequency effect did not interfere with the orientation judgment task, reinforcing the idea that lexical access, particularly word frequency processing, requires attention.
The replication of the grating angle effect confirmed that judging the orientation of a large angle (30o) was easier than a small angle (5o). In the current experiment, however, judging the large angle was not necessarily faster than judging the small angle, suggesting reduced sensitivity in orientation processing. One possible explanation is the impact of orthographic focus on spatial processing. Orthographic representation integrates letter identity and order (e.g., Grainger, 2016), and models of orthographic processing (e.g., Davis, 1999; Whitney, 2001) emphasize letter position coding in word recognition. In Experiment 1, the emphasis on orthography may have enhanced spatial sensitivity, making it easier to judge tilted gratings. In contrast, Experiment 2’s altered context deemphasized orthographic processing, likely diminishing spatial sensitivity during the orientation judgment task.
The absence of interference from the grating angle effect in the pseudolexical decision task is consistent with the increased processing load and attentional demands in the altered context. As the optimal basis for lexical decisions shifted from orthography to a multidimensional Interplay
Sroka, Deenihan, Fraser, and Zheng | Interplay Between Context and Attention
approach, including phonology and semantic meaning, processing complexity increased, depleting attentional resources. With fewer resources available, the grating angle effect no longer caused interference.
General Discussion
We demonstrated that context in a lexical decision task influences attentional allocation, which in turn affects task performance. However, word frequency information was accessed regardless of context, as long as attention remained on the lexical decision task. Overall, these findings highlight the interplay between task context and attentional control in shaping performance in the lexical decision task.
Research on reading has long highlighted the crucial role of attention in processing whole word phonology (e.g., Monsell et al., 1989; Rastle & Coltheart, 1999; Zevin & Balota, 2000). For instance, the dualroute model (Coltheart, 1978) distinguishes two pathways that allow readers to flexibly shift their reliance on word specific information: words that do not follow regular rules of pronunciation (e.g., “steak”) are processed through the lexical route, whereas nonwords not represented in the orthographic lexicon (e.g., “stik”) are decoded through the nonlexical route. This exemplifies the important role of attention in selectively processing lexical information based on orthographic codes. Further evidence suggests that this attentional control is contextdependent (Monsell et al., 1989; Rastle & Coltheart, 1999), with naming performance differing between blocks that contain only one type of stimuli (i.e., pure blocks) and blocks with mixed types of stimuli (i.e., mixed blocks). Pure blocks require less attentional switching between pathways, making reading more efficient. In contrast, our study presents another case where context influences attention, but within the framework of a lexical decision task. Unlike reading, lexical decision only requires a judgment of “wordness”, without the need to map orthography to phonology. In a context where words and nonwords differ sharply on a single dimension, the judgment can be made efficiently with minimal attentional resources, which then leads to the attentional spillover observed in our study. Reading, however, is a more complex task that likely involves dynamically changing contexts. Exploring whether and how readers strategically adjust their attention in response to these constantly changing contexts could deepen our understanding of the conditions under which reading becomes more susceptible to distractions.
Visual word recognition involves multiple, sequential stages of processing that differentiate between words and nonwords (e.g., Coltheart et al., 2001; Holcomb & Grainger, 2006). Evidence shows that word perception relies on
multiletter units of analysis based on orthographic/ morphological structure (Prinzmetal et al., 1991; Prinzmetal & MillisWright, 1984), where monosyllabic words are processed holistically but nonwords are processed by singleletter units. Letters serve as discrete features, and attention plays a key role in accurately localizing and binding these features (Ashby et al, 1996), or in encoding the spatial ordering of features (Wolford, 1975). The proper coding of relative feature positioning becomes particularly relevant for distinguishing words from nonwords, due to the distinct modes of feature integration during recognition. In line with this, our findings in the lexical decision task support the notion that attention is biased toward the spatial integration of features. Specifically, in Exp 1, the presence of nonwords seemed to heighten spatial sensitivity for judging orientation, reflecting spatial coding. In contrast, in Exp 2, which did not include nonwords, showed no such sensitivity, likely due to the holistic processing of words. Taken together with existing models of visual word recognition, our results suggest that context can influence both the extent and the mode of attention deployed during the lexical decision task.
One might argue that the interference from the tilted gratings observed in Experiment 1 was due to perceptual grouping or objectbased attention, where the tilted gratings and letter stimuli were integrated into a single object. According to existing evidence, when a distractor and target are part of the same object, increased processing of the target can actually enhance distractor interference (e.g., Chen, 2003; Murphy et al., 2016), as objectbased attention overrides the conditions of perceptual load in allocating attentional resources (Cosman & Vecera, 2012). However, we believe this was not the case, because if the tilted gratings (distractor) and letter stimuli (target) were perceived as a single object, we would have expected significantly more interference in Experiment 2, given the higher processing demands of the letter stimuli. In other words, objectbased attention would have led to simultaneous processing of the tilted gratings and the letter stimuli during the lexical task, which was not observed in Experiment 2. Therefore, the results from both experiments suggest that the tilted gratings and the letter stimuli were not perceptually grouped as a single object, but instead processed independently based on the demands of each task.
Previous research suggests that certain aspects of lexical access are sensitive to word frequency and require attention (e.g., Becker, 1976; Herdman, 1992). Dualtask paradigms involving a lexical decision task have shown that lowfrequency words and nonwords incur greater performance costs than highfrequency words, indicating that lexical access demands more attention for
Interplay Between Context and Attention | Sroka, Deenihan, Fraser, and Zheng
less familiar words (Becker, 1976; Herdman & Dobbs, 1989). Additionally, studies that cue the location of attention reveal that processing lowfrequency words and nonwords benefits from attention directed to their specific location, and identification of highfrequency words is generally facilitated by a broader attentional distribution across the stimulus space (Montani et al., 2014). Despite evidence that high frequency words typically require less attentional demand, we did not observe interference from highfrequency words during the orientation judgment task. This could be because frequencysensitive processes in lexical access demand more attentional resources than those available during the orientation judgment task, or because highfrequency words were processed in parallel with orientation processing, resulting in no measurable RT cost. Although our study does not resolve these competing explanations, future research could manipulate the characteristics of the secondary task to more directly examine the role of word frequency in lexical access in the absence of overt attention.
Although word frequency is a reliable source of the word frequency effect in lexical decision tasks (Gardner et al., 1987), previous work suggests that it is the decisionrelated processes in these tasks that amplify the effect (Balota & Chumbley, 1984); When the focus is on the concept or meaning of a word, as in the category verification task (e.g., verifying whether the word “robin” belongs to the category “bird”), the word frequency effect is minimal. This suggests that attention alone does not necessarily induce the word frequency effect. Conversely, when attention is directed toward task irrelevant stimuli, such as the tilted gratings in our study, the word frequency effect does not emerge, even when the word stimuli are easily accessible. This indicates that the word frequency effect does not occur without attention (e.g., Lien et al., 2006). Overall, it appears that attention is a necessary but not sufficient condition for the word frequency effect in lexical decision tasks.
There are several caveats to consider when interpreting our results. First, accuracy in our lexical tasks was generally lower than in typical lexical decision tasks, likely due to dual task interference and, primarily, the short stimulus presentation duration (25 msec). When selecting this duration, our goal was twofold: to minimize interference from the secondary task and to maintain a level of difficulty that required participants to stay fully engaged. If the task were too easy, the attentional demands central to our study would be undermined. At the same time, we aimed to ensure that the presentation was long enough to avoid unconscious or subliminal perception. Additionally, in Experiment 2, the brief stimulus duration may have led participants
to perceive the presence of nonwords, thereby treating the pseudolexical decision task as valid.
Given these considerations, we determined that 25 ms was an optimal stimulus duration ensuring participants actively attended to and consciously processed the stimuli (e.g., see Schräder et al., 2023). Indeed, the significantly abovechance accuracy levels confirmed the appropriateness of this choice. However, 25 msec is considerably shorter than the stimulus presentation times in most classic lexical decision tasks, so the observed lower accuracy was expected. Although we do not anticipate this lower accuracy compromising the validity of our findings, the extent of its impact remains an open question for future research.
Another limitation is that our data was collected from undergraduate students at a U.S. university without race/ethnicity information. This omission makes it difficult to assess the generalizability of our findings and potential cognitive differences across racial groups (e.g., Rouse, 2021). Given accumulating evidence that participant demographics can influence cognitive processes, future research should address this gap.
Conclusion
The lexical decision task, like other tasks in visual word recognition and reading, involves conscious processing of individual stimuli over time. The lexical context created by these stimuli can have a significant impact on task performance, influenced by factors such as the number, order, and neighborhood of the stimuli. The arrangement of stimuli triggers strategic control during task execution, optimizing the outcome. In the current study, we demonstrated that the context, specifically the mixture of different stimulus types, affected attentional allocation, which in turn influenced task performance in the lexical decision task. In contrast, the access to word frequency information remained unaffected despite the varying patterns of attention deployed across contexts. Our findings highlight the complexity of the interaction between contextual factors and cognitive control in lexical decision tasks, underscoring the need for future research to provide a more nuanced understanding of this interplay.
References
Allen, P. A., Smith, A. F., Groth, K. E., Pickle, J. L., Grabbe, J. W., & Madden, D. J. (2002). Differential age effects for case and hue mixing in visual word recognition. Psychology and Aging, 17(4), 622–635. https://doi.org/10.1037/0882-7974.17.4.622
Ashby, F. G., Prinzmetal, W., Ivry, R., & Maddox, T. (1996). A formal theory of illusory conjunctions. Psychological Review, 103, 165–192. https://doi.org/10.1037/0033-295X.103.1.165
Baayen, R., Davidson, D., & Bates, D. (2008). Mixed-effects modeling with crossed random effects for subjects and items. Journal of Memory and Language, 59(4), 390–412. https://doi.org/10.1016/j.jml.2007.12.005
Baayen, R. H., Piepenbrock, R., & van Rijn, H. (1993). The CELEX Lexical Database (CD-
Sroka, Deenihan, Fraser, and Zheng | Interplay Between Context and Attention
ROM), Linguistic Data Consortium, University of Pennsylvania, Philadelphia. Bahrami, B., Carmel, D., Walsh, V., Rees, G., & Lavie, N. (2008). Spatial attention can modulate unconscious orientation processing. Perception, 37, 1520–1528. https://doi.org/10.1068/p6045
Balota, D. A., Cortese, M. J., Sergent-Marshall, S. D., Spieler, D. H., & Yap, M. J. (2004). Visual word recognition of single-syllable words. Journal of Experimental Psychology: General, 133, 283–316. https://doi.org/10.1037/0096-3445.133.2.283
Balota, D. A., & Chumbley, J. I. (1984). Are lexical decisions a good measure of lexical access? The role of word frequency in the neglected decision stage. Journal of Experimental Psychology: Human Perception and Performance, 10, 340–357. https://doi.org/10.1037/0096-1523.10.3.340
Balota, D. A., Paul, S., & Spieler, D. H. (1999). Attentional control of lexical processing pathways during word recognition and reading. In S. Garrod & M. Pickering (Eds.), Language Processing (pp. 15–57). Psychology Press. Becker, C. A. (1976). Allocation of attention during visual word recognition. Journal of Experimental Psychology: Human Perception and Performance, 2(5), 556–566. https://doi.org/10.1037/0096-1523.2.5.556
Besner, D., Risko, E. F., & Sklair, N. (2005). Spatial attention as a necessary preliminary to early processes in reading. Canadian Journal of Experimental Psychology/Revue Canadienne de Psychologie Expérimentale, 59(2), 99–108. https://doi.org/10.1037/h0087460
Brysbaert, M. (2007). “The language-as-fixed-effect fallacy”: Some simple SPSS solutions to a complex problem (Version 2.0). Royal Holloway, University of London.
Brysbaert, M., & New, B. (2009). Moving beyond Kučera and Francis: A critical evaluation of current word frequency norms and the introduction of a new and improved word frequency measure for American English. Behavior Research Methods, 41(4), 977–990. https://doi.org/10.3758/BRM.41.4.977
Chen, Z. (2003). Attentional focus, processing load, and Stroop interference. Perception & Psychophysics, 65(5), 888–900. https://doi.org/10.3758/BF03194818
Cleland, A. A., Gaskell, M. G., Quinlan, P. T., & Tamminen, J. (2006). Frequency effects in spoken and visual word recognition: Evidence from dual-task methodologies. Journal of Experimental Psychology: Human Perception and Performance, 32(1), 104–119. https://doi.org/10.1037/0096-1523.32.1.104
Coltheart, M. (1978). Lexical access in simple reading tasks. In G. Underwood (Ed.), Strategies of Information Processing (pp. 151–216). Academic Press. Coltheart, M., Rastle, K., Perry, C., Langdon, R., & Ziegler, J. (2001). DRC: A dual route cascaded model of visual word recognition and reading aloud. Psychological Review, 108(1), 204–256. https://doi.org/10.1037/0033-295X.108.1.204
Cosman, J. D., & Vecera, S. P. (2012). Object-based attention overrides perceptual load to modulate visual distraction. Journal of Experimental Psychology: Human Perception and Performance, 38(3), 576–579. https://doi.org/10.1037/a0027406
Davis, C. J. (1999). The self-organizing lexical acquisition and recognition (SOLAR) model of visual word recognition. [Doctoral dissertation, University of New South Wales].
Edwards, J. D., Pexman, P. M., Goodyear, B. G., & Chambers, C. G. (2005). An fMRI investigation of strategies for word recognition. Cognitive Brain Research, 24(3), 648–662. https://doi.org/10.1016/j.cogbrainres.2005.03.007
Edwards, J. D., Pexman, P. M., & Hudson, C. E. (2004). Exploring the dynamics of the visual word recognition system: Homophone effects in lexical decision and naming. Language and Cognitive Processes, 19(4), 503–532. https://doi.org/10.1080/01690960444000070
Evans, G. A. L., Ralph, M. A. L., & Woollams, A. M. (2012). What’s in a word? A parametric study of semantic influences on visual word recognition. Psychonomic Bulletin & Review, 19(2), 325–331. https://doi.org/10.3758/s13423-011-0213-7
Faul, F., Erdfelder, E., Lang, A.-G., & Buchner, A. (2007). G*Power 3: A flexible statistical power analysis program for the social, behavioral, and biomedical sciences. Behavior Research Methods, 39(2), 175–191. https://doi.org/10.3758/BF03193146
Forster, K. I., & Chambers, S. M. (1973). Lexical access and naming time. Journal of Verbal Learning and Verbal Behavior, 12(6), 627–635. https://doi.org/10.1016/S0022-5371(73)80042-8
Gardner, M. K., Rothkopf, E. Z., Lapan, R., & Lafferty, T. (1987). The word frequency effect in lexical decision: Finding a frequency-based component. Memory & Cognition, 15(1), 24–28. https://doi.org/10.3758/BF03197709
Gibbs, P., & Van Orden, G. C. (1998). Pathway selection’s utility for control of word recognition. Journal of Experimental Psychology: Human Perception
and Performance, 24(4), 1162–1187. https://doi.org/10.1037/0096-1523.24.4.1162
Goldinger, S. D., Luce, P. A., & Pisoni, D. B. (1989). Priming lexical neighbors of spoken words: Effects of competition and inhibition. Journal of Memory and Language, 28(5), 501–518. https://doi.org/10.1016/0749-596X(89)90009-0
Grainger, J. (2008). Cracking the orthographic code: An introduction. Language and Cognitive Processes, 23(1), 1–35. https://doi.org/10.1080/01690960701578013
Grainger, J. (2016). Orthographic processing and reading. Visible Language, 50(2), 132–153. https://doi.org/10.1177/2327586216650501
Grainger, J., & Holcomb, P. J. (2009). Watching the word go by: On the timecourse of component processes in visual word recognition. Language and Linguistics Compass, 3(1), 128–156. https://doi.org/10.1111/j.1749-818X.2008.00121.x
Grainger, J., & Jacobs, A. M. (1996). Orthographic processing in visual word recognition: A multiple read-out model. Psychological Review, 103(3), 518–565. https://doi.org/10.1037/0033-295X.103.3.518
Herdman, C. M. (1992). Attentional resource demands of visual word recognition in naming and lexical decisions. Journal of Experimental Psychology: Human Perception and Performance, 18(2), 460–470. https://doi.org/10.1037/0096-1523.18.2.460
Herdman, C. M., & Dobbs, A. R. (1989). Attentional demands of visual word recognition. Journal of Experimental Psychology: Human Perception and Performance, 15(1), 124–132. https://doi.org/10.1037/0096-1523.15.1.124
Hoffman, J. E., & Nelson, B. (1981). Spatial selectivity in visual search. Perception & Psychophysics, 30(3), 283–290. https://doi.org/10.3758/BF03214286
Holcomb, P. J., & Grainger, J. (2006). On the time course of visual word recognition: An event-related potential investigation using masked repetition priming. Journal of Cognitive Neuroscience, 18(10), 1631–1643. https://doi.org/10.1162/jocn.2006.18.10.1631
Schräder, J., Habel, U., Jo, H.-G., Walter, F., & Wagels, L. (2023). Identifying the duration of emotional stimulus presentation for conscious versus subconscious perception via hierarchical drift diffusion models. Consciousness and Cognition, 110, 103493. https://doi.org/10.1016/j.concog.2023.103493
Kellas, G., Ferraro, F. R., & Simpson, G. B. (1988). Lexical ambiguity and the time course of attentional allocation in word recognition. Journal of Experimental Psychology: Human Perception and Performance, 14(4), 601–609. https://doi.org/10.1037/0096-1523.14.4.601
Kučera, H., & Francis, W. N. (1967). Computational analysis of present-day American English. Brown University Press.
LaBerge, D., & Samuels, S. J. (1974). Toward a theory of automatic information processing in reading. Cognitive Psychology, 6(2), 293–323. https://doi.org/10.1016/0010-0285(74)90015-2
Lachter, J., Forster, K. I., & Ruthruff, E. (2004). Forty-five years after Broadbent (1958): Still no identification without attention. Psychological Review, 111(4), 880–913. https://doi.org/10.1037/0033-295X.111.4.880
Lavie, N. (1995). Perceptual load as a necessary condition for selective attention. Journal of Experimental Psychology: Human Perception and Performance, 21(3), 451–468. https://doi.org/10.1037/0096-1523.21.3.451
Lavie, N., & Tsal, Y. (1994). Perceptual load as a major determinant of the locus of selection in visual attention. Perception & Psychophysics, 56(2), 183–197. https://doi.org/10.3758/BF03213897
Lien, M.-C., Allen, P. A., Ruthruff, E., Grabbe, J., McCann, R. S., & Remington, R. W. (2006). Visual word recognition without central attention: Evidence for greater automaticity with advancing age. Psychology and Aging, 21(3), 431–447. https://doi.org/10.1037/0882-7974.21.3.431
Li, X., Liang, Z., Kleiner, M., & Lu, Z.-L. (2010). RTbox: A device for highly accurate response time measurements. Behavior Research Methods, 42(1), 212–225. https://doi.org/10.3758/BRM.42.1.212
McCann, R. S., Folk, C. L., & Johnston, J. C. (1992). The role of spatial attention in visual word processing. Journal of Experimental Psychology: Human Perception and Performance, 18(4), 1015–1029. https://doi.org/10.1037/0096-1523.18.4.1015
Monsell, S., Doyle, M. C., & Haggard, P. N. (1989). Effects of frequency on visual word recognition tasks: Where are they? Journal of Experimental Psychology: General, 118(1), 43–71. https://doi.org/10.1037/0096-3445.118.1.43
Montani, V., Facoetti, A., & Zorzi, M. (2014). Spatial attention in written word perception. Frontiers in Human Neuroscience, 8(42). https://doi.org/10.3389/fnhum.2014.00042
Murphy, G., Groeger, J. A., & Greene, C. M. (2016). Twenty years of load theory—
WINTER 2025
PSI CHI JOURNAL OF PSYCHOLOGICAL RESEARCH
Where are we now, and where should we go next? Psychonomic Bulletin & Review, 23(5), 1316–1340. https://doi.org/10.3758/s13423-015-0982-5
Paap, K. R., & Noel, R. W. (1991). Dual-route models of print to sound: Still a good horse race. Psychological Research, 53(1), 13–24. https://doi.org/10.1007/BF00867328
Pexman, P. M., Lupker, S. J., & Jared, D. (2001). Homophone effects in lexical decision. Journal of Experimental Psychology: Learning, Memory, and Cognition, 27(1), 139–156. https://doi.org/10.1037/0278-7393.27.1.139
Prinzmetal, W., Hoffman, H., & Vest, K. (1991). Automatic processes in word perception: An analysis from illusory conjunctions. Journal of Experimental Psychology: Human Perception and Performance, 17(4), 902–923. https://doi.org/10.1037/0096-1523.17.4.902
Prinzmetal, W., & Millis-Wright, M. (1984). Cognitive and linguistic factors affect visual feature integration. Cognitive Psychology, 16(3), 305–340. https://doi.org/10.1016/0010-0285(84)90011-6
Rabovsky, M., Álvarez, C. J., Hohlfeld, A., & Sommer, W. (2008). Is lexical access autonomous? Evidence from combining overlapping tasks with recording event-related brain potentials. Brain Research, 1222, 156–165. https://doi.org/10.1016/j.brainres.2008.05.032
Rastle, K., & Coltheart, M. (1999). Serial and strategic effects in reading aloud. Journal of Experimental Psychology: Human Perception and Performance, 25(2), 482–503. https://doi.org/10.1037/0096-1523.25.2.482
Rastle, K., Kinoshita, S., Lupker, S. J., & Coltheart, M. (2003). Cross-task strategic effects. Memory & Cognition, 31(6), 867–876. https://doi.org/10.3758/BF03196439
Ratcliff, R., Gomez, P., & McKoon, G. (2004). A diffusion model account of the lexical decision task. Psychological Review, 111(1), 159–182. https://doi.org/10.1037/0033-295X.111.1.159
Rouse, S. V. (2021). Increasing the representation of diversity in the Psi Chi Journal. Psi Chi Journal of Psychological Research, 26(4), 360–362. https://doi.org/10.24839/2325-7342.JN26.4.360
Rubenstein, H. A., Garfield, L. A., & Millikan, J. A. (1970). Homographic entries in the internal lexicon. Journal of Verbal Learning and Verbal Behavior, 9(5), 487–494. https://doi.org/10.1016/S0022-5371(70)80091-3
Scarborough, D. L., Cortese, C., & Scarborough, H. S. (1977). Frequency and repetition effects in lexical memory. Journal of Experimental Psychology: Human Perception and Performance, 3(1), 1–17. https://doi.org/10.1037/0096-1523.3.1.1
Seidenberg, M. S. (1990). Lexical access: Another theoretical soupstone? In D. A. Balota, G. B. Flores d’Arcais, & K. Rayner (Eds.), Comprehension processes in reading (pp. 33–72). Erlbaum.
Seidenberg, M. S., & McClelland, J. L. (1989). A distributed, developmental model of word recognition and naming. Psychological Review, 96(4), 523–568. https://doi.org/10.1037/0033-295X.96.4.523
Stone, G. O., & Van Orden, G. C. (1993). Strategic control of processing in word recognition. Journal of Experimental Psychology: Human Perception and Performance, 19(4), 744–774. https://doi.org/10.1037/0096-1523.19.4.744
Waechter, S., Besner, D., & Stolz, J. A. (2011). Basic processes in reading: Spatial attention as a necessary preliminary to orthographic and semantic processing. Visual Cognition, 19(1), 171–202. https://doi.org/10.1080/13506285.2010.528249
Wagenmakers, E. J., Ratcliff, R., Gomez, P., & McKoon, G. (2008). A diffusion model account of criterion shifts in the lexical decision task. Journal of Memory and Language, 58(1), 140–159. https://doi.org/10.1016/j.jml.2007.04.001
Whitney, C. (2001). How the brain encodes the order of letters in a printed word: The SERIOL model and selective literature review. Psychonomic Bulletin & Review, 8(2), 221–243. https://doi.org/10.3758/BF03196158
Wolford, G. (1975). Perturbation model for letter identification. Psychological Review, 82(3), 184–199. https://doi.org/10.1037/h0076476
Yap, M. J., Balota, D. A., Cortese, M. J., & Watson, J. M. (2006). Single- versus dualprocess models of lexical decision performance: Insights from response time distributional analysis. Journal of Experimental Psychology: Human Perception and Performance, 32(6), 1324–1344. https://doi.org/10.1037/0096-1523.32.6.1324
Zevin, J. D., & Balota, D. A. (2000). Priming and attentional control of lexical and sublexical pathways during naming. Journal of Experimental Psychology: Learning, Memory, and Cognition, 26(1), 121–135. https://doi.org/10.1037/0278-7393.26.1.121
Zevin, J. D., & Seidenberg, M. S. (2002). Age of acquisition effects in word reading and other tasks. Journal of Memory and Language, 47(1), 1–29. https://doi.org/10.1006/jmla.2001.2834
Author Note
The authors report no conflicts of interests or competing interests. All procedures performed in this study involving human participants were in accordance with the ethical standards of the University Research Ethics Committee and with the 1964 Helsinki Declaration and its later amendments or comparable ethical standards. Informed consent was obtained from all individual participants included in the study. Authors affirm that human research participants provided informed consent for publication. Authors are willing to share their data, analytics methods, and study materials with other researchers. The material and data that support the findings of this study are available from the corresponding author, upon reasonable request.
Correspondence concerning this article should be addressed to Zane Zheng. Phone: (617) 2432337. Email: zzheng@lasell.edu Interplay Between Context and Attention | Sroka, Deenihan, Fraser, and Zheng
Shulman, H. G., & Davidson, T. C. (1977). Control properties of semantic coding in a lexical decision task. Journal of Verbal Learning and Verbal Behavior, 16(1),
Empowered to Choose: Investigating Job Autonomy and Parental Burnout in the Context of Work–Family Conflict
Brielle R. Croke and Adam H. Smiley* Department of Psychological Science and Neuroscience, Belmont University
ABSTRACT. From the lens of the selfdetermination theory, when individuals experience greater job autonomy, they tend to experience greater well being, work satisfaction, and less job burnout (Autin et al., 2021; Deci & Ryan, 2000; Fernet et al., 2010). However, less is known about how job autonomy relates to family life. We built on previous research and considered the association between job autonomy and parental burnout along with work–family conflict. We hypothesized that greater job autonomy would be associated with less parental burnout, and that strain related to work–family conflict (i.e., hours worked outside the home, being unmarried, number of children under the age of 5, and higher percentages of childcare responsibility) would have a main effect on parental burnout. In an original survey of 243 U.S. parents recruited via Prolific, we found that higher job autonomy (β = –.21, p < .001, 95% CI = [.39, .15]) predicted significantly less parental burnout. This pattern remained even when controlling for other measures of work–family conflict. Other measures of work–family conflict did not significantly predict more parental burnout. These findings indicate the importance of job autonomy in the lives of working parents.
Keywords: job autonomy, parental burnout, selfdetermination theory, spillover theory
Over 3.5 million U.S. parents experience parental burnout in some capacity (Roskam et al., 2018), with a burnout rate much higher than many other developed countries (Roskam et al., 2021). Parental burnout is harmful to both parents and children; parental burnout increases the likelihood of escape ideation, neglectful behaviors, and potentially other harmful actions toward one’s children (Mikolajczak et al., 2021). Working parents need to juggle responsibilities at home and at work. The number of working parents in the United States has increased dramatically over the last half century, driven in large part by an increase in working mothers. Nearly 75% of mothers were in the workforce as of 2017, up from 47% in 1975 (U.S. Census Bureau, 2018). In addition to a changing workforce, work experience for parents is
https://osf.io/gz62n
changing due to greater flexibility offered by remote and hybrid working opportunities (Punjwani & Campbell, 2024; Wigert et al., 2023). In the context of a changing workplace, we sought to identify whether greater job autonomy protects against parental burnout.
Following the COVID19 pandemic, researchers have identified and examined the phenomenon of “quiet quitting,” where an employee does the bare minimum at work (Lu et al., 2023). However, some scholars argue that this term is not new but rather a new way of describing classic symptoms of job burnout such as work disengagement and job neglect (Afrahi et al., 2022). Job burnout occurs when an individual experiences chronic stressors at work due to who they work with or their job responsibilities (Swider & Zimmerman, 2010). The symptoms of job burnout and parental burnout are
Open Data and Open Materials badges earned for transparent research practices. Data and materials are available at
similar, but rather than distancing from work colleagues and responsibilities, parental burnout is characterized by exhaustion, increased emotional distance between parent and child, and a parent’s feeling of being unproductive in their parenting strategies (Mikolajczak et al., 2018). Parental burnout and job burnout are connected, and it is possible that these two conditions may trigger each other (Wang et al., 2021). For instance, an increase in parental burnout could lead to job burnout.
Spillover theory is one explanation for the link between an individual’s work and family life. Both worktofamily timebased conflict and worktofamily strainbased conflict may contribute to an individual’s stress when trying to balance responsibilities between the work and family domains (Greenhaus & Beutell, 1985). Negative spillover occurs when stressors within the domain of work spill over to the domain of family (Lee et al., 2021). Research has shown that when an individual experiences social stressors at work, for example, their spouses report more withdrawn and negative marital behaviors (Pluut et al., 2022). In this case, social stress in the work domain is an example of negative spillover into the family domain. Similar findings exist when examining the role of timebased conflict (Lott & Wöhrmann, 2022). Individuals who face high work demands experience negative spillover into their own worklife balance (Lott & Wöhrmann, 2022). Moreover, research shows that in dualincome households, negative spillover not only affects the individual but also negatively impacts their partner (Lott & Wöhrmann, 2022). Although spillover can be negative, positive elements of one’s workplace may also affect an individual’s family life.
Past research has indicated that multiple factors in the workplace, such as mentorship, inclusive leadership, and family supportive supervisory behaviors can contribute to positive spillover at home (GarcíaSalirrosas et al., 2023; Hu et al., 2019; Zhu & Chen, 2022). Positive spillover is defined as experiences in the workplace that positively influence an individual’s home environment (Zhu & Chen, 2022). For example, workplace mentoring relationships not only contribute to growth in personal skill development in the workplace but are also associated with an improved home life (Hu et al., 2019). Increased personal skills learned in mentorship, such as active listening and effective communication, could benefit an individual in their skills as a parent or partner at home (Hu et al., 2019). Additionally, inclusive workplace leadership, where leaders exhibit openness, accessibility, and availability, can increase positive behaviors, skills, and values in both the workplace and in interactions with family (Zhu & Chen, 2022). Lastly, when considering worklife balance and the importance of job satisfaction in remote
work, familysupportive supervisory behaviors have been shown to positively contribute to job satisfaction, a relationship mediated by work to family positive spillover (GarcíaSalirrosas et al., 2023). This means that when a supervisor chooses to support employees in their family responsibilities, it spills over into family life by making an employee feel more supported in their family role, which then makes the employee more satisfied with their job.
Research on what makes work enjoyable and meaningful can inform what factors might create positive spillover from the workplace to family life. Selfdetermination theory is a framework for understanding what motivates people in the workplace, but it has been used in other areas since its creation (Deci & Ryan, 2000). The theory is based on three principles: autonomy, competence, and relatedness (Ryan & Deci, 2020). Autonomy refers to an individual’s sense of initiative, ownership, and action. Competence refers to the need for experiencing mastery and effectiveness within one’s interactions and activities, and relatedness is the feeling of belonging and connection with others. According to self determination theory, when all three needs are met, an individual can psychologically develop, specifically growing in intrinsic motivation. Because this theory is closely related to motivation, it has been used to inform initiatives in the workplace such as extrinsically motivating employees with bonuses for performances or seeking to intrinsically motivate them by increasing their job autonomy (Gerhart & Fang, 2015; Good et al., 2022). A metaanalysis conducted by Good and colleagues (2022) focused on salesperson performance, finding that across multiple studies, intrinsic motivation was more significantly associated with salesperson performance than extrinsic motivation even when controlling for sample characteristics. More specifically, one of the studies used in the analysis was conducted at two Fortune 500 companies, in which a selfselected incentive and a common quota incentive system were implemented at both companies (Bommaraju & Hohenberg, 2018). Results showed that across all experiments, individuals who set sales goals based on selfselected incentives significantly improved their sales performance compared to the groups that operated on the quota system. Additionally, results showed that performance did not decline immediately after conditions were removed, meaning that those who operated on a selfselected incentive system, in line with intrinsic motivation, continued to see the positive effects for a time even past using the incentive system.
In an early model of workplace motivation, Hackman and Oldham (1976) stated that job autonomy was one of the five key characteristics to a successful
workplace environment, describing job autonomy as the degree to which an individual can choose how and when they fulfill job responsibilities. When an employee becomes intrinsically motivated to perform a task, it is known as autonomous regulation (Manganelli et al., 2018). Past research has identified multiple areas in which autonomous regulation relates to positive outcomes, such as overall wellbeing, greater work satisfaction, less burnout, and more meaningful work (Autin et al., 2021; Deci & Ryan, 2000; Fernet et al., 2010). For example, Autin and colleagues (2021) investigated the relationships between workrelated autonomy, relatedness, competence, and meaningful work in a diverse sample of employed adults in the United States. Both autonomy and relatedness directly predicted intrinsic motivation and indirectly predicted work meaning through identified regulation, when an individual chooses to engage in a behavior due to personal value and importance even if the task itself is not enjoyable.
Job autonomy has also been shown to impact parents and their home environment, contributing as positive spillover (PerryJenkins et al., 2020; Slemp et al., 2018; Sok et al., 2014). Many workers report feeling that they do not spend enough time with their partner and kids, and these time constraints may be worse for individuals who are singleparents or live in a dualearner household due to lack of childcare (Bianchi et al., 2006; Kim, 2018). When examining parents who work both inside and outside of the home, results showed that when employees worked from home, they experienced less work–family conflict compared to the days when they worked in the office (Darouei & Pluut, 2021). On days when parents experienced more work–family conflict, they also reported more negative emotions toward their place of employment the following morning (Darouei & Pluut, 2021). Flexibility and remote working may be a factor of job autonomy that significantly impacts parent–child interactions (Darouei & Pluut, 2021; Kim, 2018). Working from home and parttime employment is associated with more frequent parent–child interactions for mothers and fathers, and in lowincome households, mothers who worked from home reported greater overall wellbeing (Kim, 2018). Some research, however, has shown that parental burnout might actually be greater when a parent works parttime or at home due to an increased number of parent–child interactions (LebertCharron et al., 2018; Roskam et al., 2018). Emotional exhaustion scores in maternal burnout were significantly lower for employed mothers compared to unemployed mothers and mothers who were employed parttime (LebertCharron et al., 2018). However, this finding was not extended to other parental burnout dimensions including depersonalization and decrease of personal
accomplishment, which was also examined in the study. The LebertCharron and colleagues (2018) study contradicts the previously mentioned studies, suggesting that factors related to job autonomy could increase parental burnout due to increased parent–child interactions. Other factors in addition to work outside the home that relate to parental burnout include marital status, having young children, and responsibility for childcare. In a study of parents with preschool aged children, marital satisfaction was associated with less parental burnout, which was mediated by support from partner coparenting, indicating that high marital satisfaction can alleviate parental burnout through a supportive coparent (Lu et al., 2024). Mikolajczak and colleagues (2018) also found a significant relationship between parentingrelated exhaustion and the level of marital satisfaction and quality of the coparenting relationship, in that lower levels of marital satisfaction and poorer quality of the coparenting relationship are related to higher levels of parental burnout. Additionally, greater exhaustion experienced by one parent has been found to be associated with higher levels of support from the other parent, indicating that strong relationships between partners are important in protecting against stressful aspects of parenting (Gillis & Roskam, 2019). In a study of parental burnout in the context of multiple sociodemographic factors, emotional exhaustion was found to be higher among parents with young children compared to older children (Le Vigouroux & Scola, 2018). In addition, having many children was a risk factor for emotional exhaustion and emotional distancing (Le Vigouroux & Scola, 2018). Similarly, a study conducted during the COVID19 pandemic found that child age was a predictor of parental burnout, specifically that in cases where there was at least one child under 4 years of age, higher parental burnout levels were observed (Giraldo et al., 2022). In addition, research has found an increased risk in parental burnout for those in Western countries in part due to individualism (Roskam et al., 2023). Parents tend to carry out parenting responsibilities on their own rather than with others in individualistic countries, known as low task sharing, which has been found to mediate the relationship between individualism and parental burnout (Roskam et al., 2023).
In the present study, we examined the relationship between job autonomy, work–family conflict, and parental burnout. We hypothesized that greater job autonomy would be associated with less parental burnout, and that strain related to work–family conflict, measured by a greater number of hours worked outside the home, being unmarried, a greater number of children under the age of 5, and higher percentages of childcare responsibility, would be associated with greater parental burnout.
Method
Participants
Participants were recruited through Prolific. To participate in the study, individuals had to be employed, 18 or older, live in the United States, and be a parent with at least one child under the age of 18 living in their household. Screening tools in Prolific were used
TABLE 1
Sociodemographic Characteristics
Participants
to only recruit participants who met these criteria. Two participants reported not having any children under 18, and they were excluded from the study. There were 5 participants excluded from the study due to failing the attention check. The attention check was a single question within the Parental Burnout Assessment in which participants were asked to select “somewhat disagree” to demonstrate they were paying attention. If a participant did not select the requested answer, they were then excluded from the study. The total sample size after excluding participants for failing the attention check or not having children in their household under the age of 18 was 243 (Mage = 39.13, SDage = 7.05). Participants’ demographics can be found in Table 1. Participants received $1.00 paid through Prolific for their participation.
Materials
Job Autonomy Assessment
To gather data on job autonomy, participants were asked to rate seven statements from the autonomy subscale of the Basic Psychological Need Satisfaction at Work Scale on a five point scale (1 = strongly disagree to 5 = strongly agree; Deci & Ryan, 2000). For example, participants would be asked to rate the following statements: “I am free to express my ideas and opinions on the job” and “I feel like I can make a lot of input in deciding how my job gets done.” The seven items of the autonomy subscale from the Basic Psychological Need Satisfaction at Work Scale were averaged to form a composite score of job autonomy. This subscale scale showed good criterion validity as it correlated as expected with other workrelated variables (Olafsen et al., 2021; Van den Broeck et al., 2010) and was invariant across samples in multiple countries (Van den Broeck et al., 2010). The Cronbach’s alpha in our sample (α = .81) indicated the scale had strong internal reliability.
Parental Burnout Assessment
To gather data on parental burnout, participants were asked to rate 23 statements from the Parental Burnout Assessment on a fivepoint scale (1 = strongly disagree to 5 = strongly agree; Roskam et al., 2018). For example, participants would be asked to rate the following statements: “I feel completely run down by my role as a parent” and “I’m no longer proud of myself as a parent.” The 23 items in the Parental Burnout Assessment would form a composite score to assess parent burnout. The Parental Burnout Assessment showed good criterion validity as it correlated as expected with other parenting and family structure variables (Roskam et al., 2018). The Cronbach’s alpha in our sample (α = .95) indicated high
reliability.
Work and Family Demographics
Participants also responded to questions related to their gender identity (man, woman, non-binary/third gender, and prefer not to say), age (text entry), race/ethnicity (select all that apply), and marital status (yes, no, other, and prefer not to say). They also entered whole numbers to indicate their number of hours worked outside the home per week, number of hours worked inside the home related to occupation, number of children under the age of 18 living within the household, number of children under the age of 5 living within the household, percent of the childcare responsibility they were personally responsible for, and the percent of their household income they personally contribute (see Table 1).
Procedure
Prior to data collection, approval was received from the IRB. A Qualtrics survey containing informed consent, debriefing language, and the scales listed in the previous section were linked to the Prolific website. Participants completed the informed consent process by indicating whether they were 18 or older, read the information given about the study, and wanted to participate in the study. Only participants who selected yes to all three screening questions were allowed to participate in the study. Participants then answered the survey questions. The order of the survey was counterbalanced so that half of participants were given the Basic Psychological Need Satisfaction at Work Scale (Deci & Ryan, 2000) first and the other half saw the Parental Burnout Assessment (Roskam et al., 2018) first. After completing demographic questions, participants could view the debriefing information at the end of the survey and then were redirected to Prolific for payment.
Results
Data was analyzed using R. ShapiroWilk tests were conducted on distributions of continuous study variables (i.e., job autonomy, W(241) = .98, p < .001), parental burnout, W(241) = .89, p < .001, number of hours worked outside the home, W(241) = .87, p < .001, childcare responsibility, W(241) = .87, p < .001, household income responsibility, W(241) = .92, p < .001, childcare responsibility, W(241) = .87, p < .001, to identify if study variables assumed a normal distribution. Distributions for variables departed significantly from normality. Due to the skewness of these distributions, nonparametric tests were used to conduct statistical analyses. Three participants’ results were identified as outliers due to zscores that had an absolute value greater than 3, indicating that their score was greater than 3 standard deviations from the mean on the given assessment, but their data was kept in as results were not meaningfully altered when removing data.
A Spearman’s correlation was used to test initial relationships between key variables and parental b urnout (see Table 2). The results of a Spearman’s correlation indicated a significant negative relationship between job autonomy and parental burnout, r(241) = .28, p < .001, 95% CI = [.39, .15], meaning that higher job autonomy was associated with lower parental burnout scores. A multiple linear regression was also conducted, predicting an individual’s parental burnout score from job autonomy and the following zscored covariates: number of hours worked outside the home, marital status, number of children under the age of 5, percentage of childcare responsibility, and gender (see Figure 1). Although gender was not a
TABLE 2
Study Variables Correlation Matrix
Note M and SD are used to represent mean and standard deviation, respectively. Values in square brackets indicate the 95% confidence interval for each correlation. * p < .05. ** p < .01.
Job Autonomy Is a Significant Predictor of Parental Burnout
Note. Dots represent the point estimate for each beta coefficient; whiskers (lines) represent the 95% CI.
FIGURE 1
WINTER 2025 PSI CHI JOURNAL OF PSYCHOLOGICAL RESEARCH
primary variable of interest in this investigation, it was included as a covariate as mothers have been shown to have higher levels of parental burnout than fathers (Roskam et al., 2018). Both gender and marital status were dummy coded to create binary variables that could be used in the regression model. Assumptions were checked by plotting residuals as well as checking that residuals followed a normal distribution within a QQ plot, supporting normality. In line with our hypothesis, there was a significant negative correlation between job autonomy and parental burnout with the other variables controlled (β = –.21, p <.001, 95% CI = [–.31, –.12]). This means that for every one standard deviation increase in job autonomy, there was an associated .21 decrease in parental burnout with all other variables held constant. Contrary to our hypotheses, we found that parental burnout was not significantly predicted by hours worked outside the home (β = .09, p = .06, 95% CI = [.01, .19]), marital status (β = .03, p = .57, 95% CI = [–.08, .15]), number of children under the age of five (β = .06, p = .21, 95% CI = [–.04, .16]) percent of household income responsible for (β = –.08, p = .18, 95% CI = [–.20, .04]), and percent of childcare responsible for (β = .03, p = .48, 95% CI = [–.15, .07]).
Discussion
In this study, we examined whether job autonomy and other demographic variables related to work–family conflict were correlated with parental burnout. In line with our hypothesis, we found that greater job autonomy was correlated with lower parental burnout and that variables related to work–family conflict (greater number of hours worked outside the home, being unmarried, a greater number of children under the age of 5, higher percentages of childcare responsibility) would be associated with higher parental burnout scores. This relationship held even when controlling for other demographic variables related to work–family conflict. Although the positive relationship between job autonomy and parental burnout held even when controlling for other demographic variables related to work–family conflict, demographic variables related to work–family conflict were not significantly associated with parental burnout. As mentioned previously, participant data related to work–family conflict were also examined through distributions for number of hours worked outside the home, percent of personal childcare responsibility, and number of children under the age of 5 and 18. Although these distributions departed from normality, these distributions covered a wide range of variability indicating that people with both lower and higher levels of strainbased and timebased work–family conflict were included in the study. This is a strength of our study as this suggests
we not only had participants who experienced low strain but also those who experienced higher levels of strain in terms of their work–family conflict.
Although previous research has not focused on the specific association between job autonomy and parental burnout through the lens of selfdetermination theory, the literature does point to positive outcomes associated with greater job autonomy (Gerhart & Fang, 2015; Good et al., 2022; Ryan & Deci, 2020). These positive outcomes include greater overall wellbeing, greater work satisfaction, and less job burnout (Autin et al., 2021; Deci & Ryan, 2000; Fernet et al., 2010). The findings of this study demonstrate that the benefits of job autonomy may extend to parenting as well.
Other demographic data related to work–family conflict were not significant predictors of parental burnout. However, job autonomy remained consistent in its negative association with parental burnout even when controlling for variables related to work–family conflict. This suggests that job autonomy, which can be exemplified by input, flexibility, and agency in the workplace, may be a significant factor in the home lives of working parents. When parents have more job autonomy, they have more frequent parent–child interactions (Kim, 2018). Greater job autonomy and less time working outside the home may give parents the ability to be fully present with their kids when needed, creating a more solidified boundary between a parent’s work life and home life.
It is interesting to consider why no significant relationship was found between some study variables and parental burnout. For example, past research points to higher parental burnout for individuals with young children, and it is interesting that our study did not show a significant relationship between participants with children under 5 and parental burnout (Le Vigouroux et al., 2022). One possible explanation could be a third variable that is unaccounted for in this study. For example, the severity of parental burnout has been linked to personality traits in parents, such that certain personality traits are more strongly associated with parental burnout when an individual is caring for a child under the age of seven, specifically in parents with lower scores in neuroticism and openness (Piotrowski et al., 2023). Because personality was not studied in our study, we do not know the impact that a parent’s specific personality has on the burnout, or lack thereof, they experience in caring for a young child.
Additionally, when examining the findings of childcare responsibility, it could be possible that certain individuals enjoy childcare tasks more than others and therefore decrease the risk of experiencing parental burnout based on their personal preference. Specifically,
research has shown that although men and women may both positively perceive childcare tasks, women tend to prefer childcare responsibility tasks more than men (BleskeRechek & Gunseor, 2022). A difference in preference to childcare responsibility may contribute to the extent to which an individual experiences parental burnout when carrying out childcare responsibilities. Posthoc analysis of data in the current study revealed differences between men and women in perceived income and childcare responsibilities. Despite working nearly the same number of total hours per week, women reported greater childcare responsibility by an average of 28%, with women indicating responsibility for 74% of childcare whereas men reported an average of 46% perceived responsibility. These roles were reversed in income responsibility, in that men responded being responsible for 76% of income, and women responded that they were responsible for 57% of household income. Interestingly, in both cases of childcare and income, average responsibility rating between men and women sum to be greater than 100%, indicating that both men and women may overclaim responsibility, which could occur due to a parent’s primary focus on their own responsibility (Schroeder et al., 2016). This post hoc finding suggests that gender may still play an important role for parents and could be examined in further research.
Additionally, perhaps those with more job autonomy are privileged in other ways, such as being more educated and therefore having higher pay. Similarly, the job sector that an individual works in may influence how much autonomy they have. Perhaps certain industries, such as selfemployment, may lead to more autonomous work.
An additional limitation to our study was the way in which some measures were operationalized. Due to focusing on participants’ marital status rather than broadening the scope to partner status, for example, we may have missed information that would have been helpful in analyzing the results. Future research should consider the implications of operationalizing participants’ marital and/or partner status so that data is as accurate as possible. The job autonomy assessment, though a welltested measure, was limited in items and focused more on input in the workplace. To extend findings to ideas such as flexibility and remotework, future research should use a broader measure for job autonomy and/or consider specific factors of autonomy that may reduce job burnout. For example, items in this study focused more on input in how one goes about their work, but it may be helpful to do more research on the influence of other specific factors related to autonomy such as flexibility, learning and development opportunities, or
Croke and Smiley |
the presence of personal goals within the workplace to understand the more distinct role these specific factors play in an individual’s perception of their job autonomy. It is also important to acknowledge that using quantitative measures to assess work and family life does not fully capture the experience of participants’ life as a parent. For example, two individuals may be very similar in their childcare responsibilities and perceived job autonomy, but one individual may feel very overwhelmed and the other may evaluate their worklife balance as satisfactory. Future studies could examine how differences in job autonomy within the same industry relate to parental burnout. It is also possible that parenting responsibilities and associated burnout may influence the employment decisions individuals make, so including variables related to employment status in future research may be helpful in gaining a better understanding of participants’ workrelated experiences and contextualizing results. Future studies using longitudinal or experimental methods would be useful for examining the causal relationship between these variables in addition to qualitative approaches (e.g., focus groups, observation, openended interviews), which could introduce new perspectives or yield different results. This study was also conducted exclusively with respondents in the United States, so further research in other countries is needed to establish the generalizability of these findings.
Overall, our findings extend selfdetermination theory (Deci & Ryan, 2020) into the domain of parenthood. Parents play a vital role in their children’s lives, and the nature of their work influences how they relate to them. By identifying the link between job autonomy and parental burnout, we demonstrate the importance of having control over one’s work life as it may have implications at home as well. Parents seeking to thrive at work and feel energized in their interactions with their children should consider the autonomy offered to them by different careers and positions. Furthermore, employers seeking to retain their employees and keep them happy should consider that the implications of job autonomy may extend beyond the workplace. Among various work–family conflict factors, job autonomy stands out as a meaningful influence in the life of a working parent.
References
Afrahi, B., Blenkinsopp, J., Fernandez de Arroyabe, J. C., & Karim, M. S. (2022). Work disengagement: A review of the literature. Human Resource Management Review, 32(2), 1–16. https://doi.org/10.1016/j.hrmr.2021.100822
Autin, K. L., Herdt, M. E., Garcia, R. G., & Ezema, G. N. (2021). Basic psychological need satisfaction, autonomous motivation, and meaningful work: A selfdetermination theory perspective. Journal of Career Assessment, 30(1), 78–93 https://doi.org/10.1177/10690727211018647
Bianchi, S. M., Robinson, J. P., & Milke, M. A. (2006). The changing rhythms of American family life. Russell Sage Foundation.
Bleske-Rechek, A., & Gunseor, M. M. (2022). Gendered perspectives on sharing
WINTER 2025 PSI CHI JOURNAL OF PSYCHOLOGICAL RESEARCH
the load: Men’s and women’s attitudes toward family roles and household and childcare tasks. Evolutionary Behavioral Sciences, 16(3), 201–219. https://doi.org/10.1037/ebs0000257
Bommaraju, R., & Hohenberg, S. (2018). Self-selected sales incentives: Evidence of their effectiveness, persistence, durability, and underlying mechanisms. Journal of Marketing, 82(5), 106–124. https://doi.org/10.1509/jm.17.0002
Darouei, M., & Pluut, H. (2021). Work from home today for a better tomorrow! How working from home influences work‐family conflict and employees’ start of the next workday. Stress and Health, 37(5), 986–999. https://doi.org/10.1002/smi.3053
Deci, E. L., & Ryan, R. M. (2000). The “what” and “why” of goal pursuits: Human needs and the self-determination of behavior. Psychological Inquiry, 11(4), 227–268. https://doi.org/10.1207/s15327965pli1104_01
Fernet, C., Gagné, M., & Austin, S. (2010). When does quality of relationships with coworkers predict burnout over time? The moderating role of work motivation. Journal of Organizational Behavior, 31(8), 1163–1180. https://doi.org/10.1002/job.673
García-Salirrosas, E. E., Rondon-Eusebio, R. F., Geraldo-Campos, L. A., & Acevedo-Duque, Á. (2023). Job satisfaction in remote work: The role of positive spillover from work to family and work–life balance. Behavioral Sciences, 13(11), 916. https://doi.org/10.3390/bs13110916
Gerhart, B., & Fang, M. (2015). Pay, intrinsic motivation, extrinsic motivation, performance, and creativity in the workplace: Revisiting long-held beliefs. Annual Review of Organizational Psychology and Organizational Behavior, 2(1), 489–521. https://doi.org/10.1146/annurev-orgpsych-032414-111418
Gillis, A., & Roskam, I. (2019). Regulation between daily exhaustion and support in parenting: A dyadic perspective. International Journal of Behavioral Development, 44(3), 226–235. https://doi.org/10.1177/0165025419868536
Giraldo, C. P., Santelices, M. P., Oyarce, D., Chalco, E. F., & Escobar, M. J. (2022). Children’s age matters: Parental burnout in Chilean families during the COVID-19 pandemic. Frontiers in Psychology, 13. https://doi.org/10.3389/fpsyg.2022.946705
Good, V., Hughes, D. E., Kirca, A. H., & McGrath, S. (2022). A self-determination theory-based meta-analysis on the differential effects of intrinsic and extrinsic motivation on salesperson performance. Journal of the Academy of Marketing Science, 50(3), 586–614. https://doi.org/10.1007/s11747-021-00827-6
Greenhaus, J. H., & Beutell, N. J. (1985). Sources of conflict between work and family roles. Academy of Management Review, 10(1), 76–88. https://doi.org/10.5465/amr.1985.4277352
Hackman, J. R., & Oldham, G. R. (1976). Motivation through the design of work: Test of a theory. Organizational Behavior and Human Performance, 16(2), 250–279. https://doi.org/10.1016/0030-5073(76)90016-7
Hu, Y., Wang, M., Kwan, H. K., & Yi, J. (2019). Mentorship quality and mentors’ work-to-family positive spillover: The mediating role of personal skill development and the moderating role of core self-evaluation. The International Journal of Human Resource Management, 32(9), 1899–1922. https://doi.org/10.1080/09585192.2019.1579244
Kim, J. (2018). Workplace flexibility and parent–child interactions among working parents in the U.S. Social Indicators Research, 151(2), 427–469. https://doi.org/10.1007/s11205-018-2032-y
Lebert-Charron, A., Dorard, G., Boujut, E., & Wendland, J. (2018). Maternal burnout syndrome: Contextual and psychological associated factors. Frontiers in Psychology, 9, 1–12. https://doi.org/10.3389/fpsyg.2018.00885
Lee, D.-W., Hong, Y.-C., Seo, H., Yun, J.-Y., Nam, S., & Lee, N. (2021). Different influence of negative and positive spillover between work and life on depression in a longitudinal study. Safety and Health at Work, 12(3), 377–383 https://doi.org/10.1016/j.shaw.2021.05.002
Le Vigouroux, S., Charbonnier, E., & Scola, C. (2022). Profiles and age-related differences in the expression of the three parental burnout dimensions. European Journal of Developmental Psychology, 19(6), 885–904. https://doi.org/10.1080/17405629.2021.1990749
Le Vigouroux, S., & Scola, C. (2018). Differences in parental burnout: Influence of demographic factors and personality of parents and children. Frontiers in Psychology, 9 https://doi.org/10.3389/fpsyg.2018.00887
Lott, Y., & Wöhrmann, A. M. (2022). Spillover and crossover effects of working time demands on work–life balance satisfaction among dual-earner couples: The mediating role of work–life conflict. Current Psychology, 42(15), 12957–12973. https://doi.org/10.1007/s12144-022-03850-0
Lu, B., Sun, J., Sun, F., Yang, J., & Chen, B.-B. (2024). The association between marital satisfaction and parental burnout: A moderated mediation model of parents’ and grandparents’ coparenting. Journal of Child and Family
Lu, M., Al Mamun, A., Chen, X., Yang, Q., & Masukujjaman, M. (2023). Quiet quitting during COVID-19: The role of psychological empowerment. Humanities and Social Sciences Communications, 10(1), 1–16. https://doi.org/10.1057/s41599-023-02012-2
Manganelli L., Thibault-Landry A., Forest J., & Carpentier J. (2018). Selfdetermination theory can help you generate performance and well-being in the workplace: A review of the literature. Advances in Developing Human Resources, 20(2), 227–240. https://doi.org/10.1177/1523422318757210
Mikolajczak, M., Gross, J. J., & Roskam, I. (2021). Beyond job burnout: Parental burnout! Trends in Cognitive Sciences, 25(5), 333–336. https://doi.org/10.1016/j.tics.2021.01.012
Mikolajczak, M., Raes, M.-E., Avalosse, H., & Roskam, I. (2018). Exhausted parents: Sociodemographic, child-related, parent-related, parenting and family-functioning correlates of parental burnout. Key Topics in Behavioral Sciences, 27, 602–614 https://doi.org/10.1007/s10826-017-0892-4
Olafsen, A. H., Halvari, H., & Frølund, C. W. (2021). The basic psychological need satisfaction and need frustration at work scale: A validation study. Frontiers in Psychology, 12. https://doi.org/10.3389/fpsyg.2021.697306
Perry-Jenkins, M., Laws, H. B., Sayer, A., & Newkirk, K. (2020). Parents’ work and children’s development: A longitudinal investigation of working-class families. Journal of Family Psychology, 34(3), 257–268. https://doi.org/10.1037/fam0000580
Piotrowski, K., Bojanowska, A., Szczygieł, D., Mikolajczak, M., & Roskam, I. (2023). Parental burnout at different stages of parenthood: Links with temperament, big five traits, and parental identity. Frontiers in Psychology, 14 https://doi.org/10.3389/fpsyg.2023.1087977
Pluut, H., Ilies, R., Su, R., Weng, Q., & Liang, A. X. (2022). How social stressors at work influence marital behaviors at home: An interpersonal model of work–family spillover. Journal of Occupational Health Psychology, 27(1), 74–88. https://doi.org/10.1037/ocp0000298
Punjwani, M., & Campell, S. (2024, April 3). Remote work statistics and trends in 2024. USA Today. https://www.usatoday.com/money/blueprint/business/ hr-payroll/remote-work-statistics/#sources
Roskam, I., Aguiar, J., Akgun, E., Arena, A. F., Arikan, G., Aunola, K., Besson, E., Beyers, W., Boujut, E., Brianda, M. E., Brytek-Matera, A., Budak, A. M., Carbonneau, N., César, F., Chen, B.-B., Dorard, G., dos Santos Elias, L. C., Dunsmuir, S., Egorova, N., … Mikolajczak, M. (2023). Three reasons why parental burnout is more prevalent in individualistic countries: A mediation study in 36 countries. Social Psychiatry and Psychiatric Epidemiology, 59(4), 681–694. https://doi.org/10.1007/s00127-023-02487-z
Roskam, I., Aguiar, J., Akgun, E., Arikan, G., Artavia, M., Avalosse, H., Aunola, K., Bader, M., Bahati, C., Barham, E. J., Besson, E., Beyers, W., Boujut, E., Brianda, M.-E., Brytek-Matera A., Carbonneau, N., César, F., Chen, B.-B., ... Mikolajczak, M. (2021). Parental burnout around the globe: A 42-country study. Affective Science, 2(1), 58–79. https://doi.org/10.1007/s42761-020-00028-4
Roskam, I., Brianda, M.-E., & Mikolajczak, M. (2018). A step forward in the conceptualization and measurement of parental burnout: The Parental Burnout Assessment (PBA). Frontiers in Psychology, 9(758). https://doi.org/10.3389/fpsyg.2018.00758
Ryan, R. M., & Deci, E. L. (2020). Intrinsic and extrinsic motivation from a selfdetermination theory perspective: Definitions, theory, practices, and future directions. Contemporary Educational Psychology, 61, 101860. https://doi.org/10.1016/j.cedpsych.2020.101860
Schroeder, J., Caruso, E. M., & Epley, N. (2016). Many hands make overlooked work: Over-claiming of responsibility increases with group size. Journal of Experimental Psychology: Applied, 22(2), 238–246. https://doi.org/10.1037/xap0000080
Slemp, G. R., Kern, M. L., Patrick, K. J., & Ryan, R. M. (2018). Leader autonomy support in the workplace: A meta-analytic review. Motivation and Emotion, 42(5), 706–724. https://doi.org/10.1007/s11031-018-9698-y
Sok, J., Blomme, R., & Tromp, D. (2014). Positive and negative spillover from work to home: The role of organizational culture and supportive arrangements. British Journal of Management, 25(3), 456–472. https://doi.org/10.1111/1467-8551.12058
Swider, B. W., & Zimmerman, R. D. (2010). Born to burnout: A meta-analytic path model of personality, job burnout, and work outcomes. Journal of Vocational Behavior, 76(3), 487–506. https://doi.org/10.1016/j.jvb.2010.01.003
U.S. Census Bureau. (2018). Table FM-1. Families by presence of own children under 18: 1950 to present https://www.census.gov/newsroom/stories/2018/single-parent.html
Van den Broeck, A., Vansteenkiste, M., De Witte, H., Soenens, B., & Lens, W. (2010). Capturing autonomy, competence, and relatedness at work: Construction and initial validation of the work‐related Basic Need Satisfaction Scale. Journal of Occupational and Organizational Psychology, 83(4), 981–1002. https://doi.org/10.1348/096317909X481382
Wang, W., Wang, S., Liu, X., & Li, Y. (2021). Parental and job burnout in a Chinese sample. Current Psychology, 42(2), 1564–1574. https://doi.org/10.1007/s12144-021-01498-w
Wigert, B., Harter, J., & Agrawal, S. (2023, December 12). The future of the office has arrived: It’s hybrid https://www.gallup.com/workplace/511994/future-officearrived-hybrid.aspx
Zhu, H., & Chen, A. Y. (2022). Work-to-family effects of inclusive leadership: The roles of work-to-family positive spillover and complementary values. Frontiers in Psychology, 13 https://doi.org/10.3389/fpsyg.2022.1004297
Croke and Smiley | Job Autonomy and Parental Burnout
Author Note
Brielle R. Croke https://orcid.org/0009-0000-7851-4392
Adam H. Smiley https://orcid.org/0000-0001-5479-6102
Materials and data for this study can be accessed at https://osf.io/gz62n
We have no known conflict of interest to disclose. This study was supported by Belmont University’s College of Science and Mathematics.
Correspondence concerning this article should be addressed to Brielle R. Croke, Belmont University, Nashville, TN. Email: briellecroke@gmail com
WINTER 2025
PSI CHI JOURNAL OF PSYCHOLOGICAL
Perceptions of Sex Work: What Drives Opposition?
Tiffany R. Abrams, Lauren M. Banicki, and Angela G. Pirlott* Department of Psychology, Saint Xavier University
ABSTRACT. The current studies intended to understand opposition to sex work among a sample of U.S. Americans using a mixedmethods approach. In Study 1, we examined beliefs about sex work using an openended approach without relying on researcherconceived perceptions. In Study 2, we examined whether opposition to sex work stems primarily from the presumed negative confounding factors (identified in Study 1) and explored reasons for remaining opposition. In Study 1, 116 U.S. adults recruited from Amazon Mechanical Turk (MTurk) reported up to 10 beliefs about sex work. Researchers coded responses and identified common themes, including desperation, STIs/disease, physical abuse, drugs/alcohol, trafficking, exploitation, cheating, enslavement, legal issues, and immorality. In Study 2, we used a withinsubjects quantitative experimental design in which 153 U.S. adults recruited from MTurk read 2 sex work scenarios—1 including the presumed cooccurring negative contextual factors and 1 neutralizing those factors—and rated their opposition and provided reasoning for such opposition. Neutralizing the negative confounding factors decreased opposition to sex work (from 95% to 19%; OR = 10.65; d = 1.76; ps < .001). Residual opposition to sex work in the neutralized condition stemmed from lingering beliefs about harm and “immorality.” These studies extend the literature by identifying common perceptions of sex work and evincing that the presumed confounding negative factors primarily drive opposition to sex work. The discussion explores reasons underlying residual opposition in the neutralized condition.
Keywords: sex work, transactional sex, mixed methods, attitudes, beliefs
Approximately 6% of U.S. adults have paid for or have been paid for sex since age 18 during their lifetime with 2% having paid for or been paid for sex in the last year (based on a representative sample of U.S. Americans; Davern et al., 2021). This suggests that, at minimum, sex work affects a fair number of U.S. Americans. The legal definition of sex work varies between U.S. state jurisdictions but generally refers to the “exchange of sexual services for goods or money” (Ditmore, 2011 p. xix). Some research distinguishes between “outdoor” and “indoor” sex work, which refers to solicitation occurring “on the streets” versus in an enclosed space
Open Materials badge earned for transparent research practices. Materials are available at https://osf.io/u893n/
(e.g., strip club, brothel), respectively. This paper uses the phrase “sex work” to refer to the exchange of sexual behaviors (e.g., intercourse, oral sex, manual sex) for money or other highly valued goods (e.g., drugs) and will specifically focus on sex work as sold by women and purchased by men,1 even though sex work more 1We acknowledge that other pairings of sex work exist, (e.g., as bought and sold by men, as bought by women and sold by men). However, sex as bought by men and sold by women seems to be the most common form of sex work (e.g., Ditmore, 2011), and due to its commonality, is likely what comes to mind when thinking about sex work and therefore is likely the salient scenario that drives “attitudes toward sex work.” As such, this paper focuses on sex work as sold by women and purchased by men.
broadly includes the exchange of sex for money or other goods in addition to exotic dancing, sexual massage, pornography, etc.
Attitudes Toward Sex Work
U.S. Americans’ attitudes toward sex work vary. Results from the 2016 Marist Institute poll, which utilized a representative sample of U.S. adults, suggest that 49% of U.S. adults believe that sex work between two consenting adults should be legal, whereas 44% disagree. Results from a representative sample from the 2016 YouGov poll suggest that more U.S. Americans think buying and selling sex should be illegal (45% and 43%, respectively) than legal (39% and 40%, respectively), and that buying and selling sex is morally wrong (57% and 56%, respectively) compared to morally acceptable (24% and 25%, respectively). Using the most recent 2017 U.S. World Values Survey data (Haerpfer et al., 2022), our own analyses revealed that U.S. Americans predominantly oppose sex work (M = 3.60, SD = 2.70) on a scale of 1 (never justifiable) to 10 (always justifiable), with 37% of adults agreeing that sex work is never justifiable. However, U.S. adults’ attitudes toward sex work became more accepting over time [1981 to present; r(6,430) = .21, p < .001] based on our own analyses. The current investigation sought to understand the reasons underlying opposition to sex work in a U.S. sample.
Explaining Attitudes Toward Sex Work
Understandable given its position as an interdisciplinary issue (e.g., examined in criminal justice, public and social policy, public health, feminism, sociology, psychology), sex work has been abundantly examined (e.g., over 320,000 results on Google scholar for “attitudes toward prostitution”). However, not much of the research has focused on explaining attitudes toward sex work, and therefore, given this lack of research and given the cultural similarities between the U.S. and the “Western World,” (e.g., Canada, Australia, and Western Europe), we include research from the “Western World” to help inform the current investigation, which focuses on U.S. Americans’ attitudes. Several common patterns have arisen, which we summarize below.
Worldviews or values systems predicting opposition to sex work have been identified in the literature. Religiosity consistently predicts opposition to beliefs that sex work is justifiable, acceptable, or moral, or should be legal, among samples of U.S. Americans, Canadians, Danes, Norwegians, Swedes, and crosscultural samples (Cao et al., 2017; Cao & Maguire, 2013; Chon, 2015; Hansen & Johansson, 2022; Jakobsson & Kotsadam, 2011; Jonsson & Jakobsson, 2017; Mancini et al., 2020). Authoritarianism also routinely predicts opposition
to beliefs that sex work is justifiable, among samples of U.S. Americans and Canadians (Cao et al., 2017; Cao & Maguire, 2013). Research findings on whether conservatism or liberalism predicts opposition to sex work have been mixed (e.g., Chon, 2015; Hansen & Johansson, 2022; Jonsson & Jakobsson, 2017). Studies sampling U.S. Americans have demonstrated that conservatism predicts reduced support for legalized sex work among men (Mancini et al., 2020), and selfidentified Republicans are more likely than Democrats to believe that buying and selling sex is morally wrong and should be illegal (YouGov Poll, 2016). Religiosity, authoritarianism, and conservatism have been proposed to reflect a common underlying trait of “obedience to authority” (Bouchard, 2009) and thus it makes sense that these characteristics correlate with opposition to sex work, particularly if sex work is illegal.
Gender role attitudes are also typically related to attitudes toward sex work. Among samples in Denmark, France, Germany, the Netherlands, Norway, Sweden, Spain, and the U.K., support of gender equality predicts beliefs that sex work is morally wrong and opposition to buying and selling sex and legalizing the buying and selling of sex (Jonsson & Jakobsson, 2017). Endorsement of traditional (i.e., nonegalitarian) gender roles also predicts acceptability of sex work among a Canadian sample (Cao et al., 2017).
Somewhat similarly, attitudes toward sex work routinely differ by gender, with women being more opposed to sex work and its legalization than men. Women are more likely than men to believe that buying and selling sex is not justifiable, is morally wrong, and should be illegal or criminalized among samples in Canada, Denmark, France, Germany, the Netherlands, Norway, Spain, Sweden, the U.K., the U.S., and a crosscultural sample (Cao et al., 2017; Cao & Maguire, 2013; Chon, 2015; Hansen & Johansson, 2022; Jakobsson & Kotsadam, 2011; Jonsson & Jakobsson, 2017; Marist Institute, 2016; Morton et al., 2012; YouGov Poll, 2016).
Experimental research is less common but demonstrates that contextual factors also affect reactions to sex work. For example, scenario studies demonstrate that stories about women forced into sex work elicit greater moral outrage and empathy than stories about women freely choosing sex work among samples of Spaniards and U.S. Americans (Bonache et al., 2021; Silver et al., 2015), suggesting that these contextual factors affect participant responses and demonstrating the importance of clearly defining sex work when measuring reactions.
Overview of the Current Investigation
Much of the literature examining attitudes toward sex work has (a) been descriptive, in that it focused
WINTER 2025 PSI CHI JOURNAL OF PSYCHOLOGICAL RESEARCH
on providing an estimate of countries’ overall support or opposition to sex work (e.g., studies using the World Values Survey such as Cao et al., 2017; Cao & Maquire, 2013; Marist Institute, 2016; YouGov, 2016), (b) identified worldviews, values systems, or individual differences that correlate with attitudes toward sex work, as summarized above, or (c) theorized about the reason for opposition to or support for sex work without explicitly testing those predictions (e.g., Kissil & Davey, 2010; Moen, 2014; Weitzer, 2024). In addition, (d) much work has been conducted in other cultures, (e.g., particularly in Asia; over 99,000 citations in Google Scholar for “attitudes toward prostitution in Asia”), and given cultural differences in norms, beliefs, value systems, and worldviews, findings may or may not apply to a U.S. sample. In contrast, the current investigation attempted to understand opposition to sex work in a U.S. sample. Specifically, what reasons underlie opposition to sex work, and if those reasons can be mitigated, what opposition remains, and why?
The current investigation sought to identify reasons for opposition to sex work among a U.S. sample and to test the causal relationship of those beliefs on opposition to sex work. As such, in Study 1, we qualitatively surveyed a U.S. sample’s beliefs about sex work to identify themes that could explain opposition to sex work. Specifically, we sought to understand what U.S. adults believe sex work entails. Then, using themes identified in Study 1, in Study 2, we experimentally examined whether opposition to sex work is driven primarily by the negative themes assumed to cooccur with sex work or if significant residual opposition to sex work remains unexplained and requires further examination. Beyond experimentally examining whether negative confounding factors drive opposition to sex work, in Study 2 we solicited participants’ qualitative explanations for their responses to enable a further exploration of residual opposition to sex work, particularly when harmful contextual factors are neutralized. Thus, our investigation in Study 2 enables an examination of attitudes toward sex work in a “best case scenario,” and even in the “best case scenario,” what lingering opposition exists, and why.
Study 1
In Study 1 we sought to understand beliefs about sex work among a U.S. sample. As such, we used a qualitative methodology in which participants generated their own thoughts about sex work, which we then examined and coded for themes. Inviting participants to provide their own reactions, rather than to simply rate their agreement with researchergenerated items, enables a fuller understanding of beliefs about sex work and the identification of issues not previously acknowledged by
researchers. The study was approved by the Saint Xavier University Institutional Review Board.
Method
Participants and Sampling
One hundred forty timeslots were posted to Amazon Mechanical Turk (MTurk), restricting participation to participants with U.S. IP addresses, aged 18 and older, and with a 95% or higher approval rating. One hundred seventyseven adults began and 152 completed most of the study in Qualtrics. However, we reviewed responses for possible evidence of fraudulent participants and omitted participants whose responses were copied from an online source or were otherwise unrelated to the prompt (n = 36; 24%), thus leaving 116 participants with usable data.
Accordingly, of the 116 participants included in analyses, 64 self identified as cisgender male, 49 as cisgender female, 1 as transgender, and 1 as other. In addition, they predominantly identified as heterosexual (88%) with 10% bisexual, 2% gay/lesbian and 1% other. Participants were also predominately White (73%) with 11% Black/African American, 7% Hispanic/Latino, 4% Asian American, and 4% other. They reported a mean age of 36.19 years, (SD = 11.31, range 21 to 70), a median income of $40,000–$49,999 (range below $20,000 to $100,000–249,999), a median social class of middle class (range lower class to upper middle class), and a median education level of bachelor’s degree (range high school diploma to graduate or professional degree). Additionally, seven participants indicated that they paid someone for sex and one participant indicated that they received money for sex.
Design and Procedure
Participants completed a series of demographic questions and reported up to ten thoughts about sex work and were then thanked, debriefed, and paid. See the codebook at https://osf.io/u893n/
Measures
Perceptions of Sex Work. Instructions stated, “On the following page, we will ask you to write down ten things you think of when you think of sex work. Each unique thought should be on its own line. Full sentences are not necessary. If you run out of ideas, you do not have to fill all ten lines, but we appreciate you providing as many thoughts as possible. We appreciate your honest answers to each question. There are no right or wrong answers; simply write down what you truly and personally associate with sex work. It is incredibly important that you provide your honest response to each situation.” After the general instructions, participants were asked to
“Please list ten things you think of when you think about sex work. Write down the first things that come to mind.” Coding. The first author and third author reviewed the responses, independently identified common themes, and collaborated to finalize and create operational definitions of the themes (see Online Supplemental Study 1 Codebook at https://osf.io/u893n/). We generated eleven themes including cheating (cheating on a significant other by either party), desperation (lack of alternative options, e.g., homeless), drugs and alcohol (use of or addiction to drugs or alcohol by either party), enslavement (forced into sex work without consent, autonomy, or free will), exploitation (someone taking advantage of or financially profiting off the woman in sex work), immorality, legal status, physical abuse, pregnancy, STIs and disease, and trafficking (sex or human trafficking, kidnapping). The first author trained the second author in coding by reviewing each operational definition and conducting independent practice coding rounds and comparing codes. The first and second authors subsequently independently coded each response for the presence (1 = present, 0 = absent) of each theme across comments. Across themes, interrater reliability was sufficient: Cohen’s κs ranged .681.00. Discrepancies were then discussed and resolved.
Results
Perceptions of Sex Work
We conducted a chi square goodness of fit test for each theme to determine whether the proportion of people generating each theme significantly differed from .01; the null hypothesis would articulate that the proportion of people generating each theme = .00 (i.e., that a particular belief does not exist). However, we substituted the null hypothesis proportion of .01 for .00 given that chisquare tests cannot test against a proportion of .00. Online Supplemental Table 1 at https://osf.io/u893n/ fully summarizes the results. Common themes included legal status (47%), physical abuse (41%), STIs and disease (34%), immorality (29%), desperation (28%), drugs and alcohol (28%), exploitation (20%), trafficking (19%), enslavement (8%), and cheating (7%), the proportion of which all of which significantly differed from .01, ps < .05. Only sexual abuse (3%) and pregnancy (1%) did not significantly differ from .01, ps > .09.
Exploratory Analyses of Gender Differences
Given the consistent gender differences in the existing literature documenting women’s greater disapproval toward sex work relative to men (Cao et al., 2017; Cao & Maguire, 2013; Chon, 2015; Hansen & Johansson, 2022; Jakobsson & Kotsadam, 2011; Jonsson & Jakobsson, 2017; Marist Institute, 2016; Morton et al., Abrams, Banicki, and Pirlott
TABLE 1
Study 2’s Neutralized and Negative Factors Conditions, Separated by Theme
An adult man and adult woman decide to arrange an exchange of sex for money. The woman agrees to provide sexual services for the man and the man agrees to pay the woman a previously decided monetary amount. [scenario continues using the text listed below, in the order listed below]
Both people are currently single and not in a romantic relationship.
Illegal In this area, sex-for-money exchanges are fully legal between consenting adults, and this exchange was fully legal.
Trafficking The woman was not and is not being human trafficked, meaning that she was never kidnapped or forced to engage in sex-for-money exchanges against her will.
Enslavement
The woman voluntarily chose to engage in sexual exchanges for money with full autonomy and free will over all sexual exchanges.
Exploitation The woman takes home all of the money from the exchange; she does not have to pay any portion of her earnings to anyone else.
Desperation The woman is financially independent and financially secure, and is fully able to afford the lifestyle she desires.
Drugs & Alcohol
Use of drugs and alcohol or being under the influence of drugs or alcohol during the sexual exchange is strictly prohibited. Both parties need to pass a drug and alcohol test before entering into the sexual exchange. Neither person was under the influence of drugs or alcohol, and neither person had ever used illegal drugs or illegally obtained prescription drugs.
Physical Threat Physical aggression is strictly prohibited and both parties have access to an alert system if they need help. Neither person used physical aggression toward the other person during the sexual exchange.
STIs & Disease Prior to the exchange, both parties are required to be tested for STIs and are required to come back “clean” with medical documentation. Neither the man nor the woman had any STIs or HIV/AIDS. Medical documentation was provided.
Condom Misuse
Both people are currently in committed romantic relationships with other people which are presumed to be monogamous; neither person’s romantic partner knows about the sexual exchange.
In this area, sex-for-money exchanges are completely illegal and this exchange was illegal.
The woman was kidnapped and taken to a different location, far away from her home, and is forced to engage in sex-formoney exchanges against her will.
The woman was forced to engage in sexual exchanges for money without choice, free will, or autonomy over the sexual exchanges.
The woman does not take home all of the money from the exchange; she has to pay a significant portion of her earnings to others.
The woman struggles to make ends meet financially, including obtaining stable access to housing, food, employment, transportation, etc.
Both parties were under the influence of drugs and alcohol, and the woman is currently dealing with drug addiction.
The man used physical aggression toward the woman during the sexual exchange.
Neither party is required to be tested for STIs and HIV/AIDS.
Condoms are required to be used at all times and the man wore a condom during the entire sexual exchange.
Condoms are not required to be used and the man did not wear a condom during the sexual exchange.
Pregnancy
2012; YouGov Poll, 2016), we also explored whether men and women differed in their beliefs about sex work by conducting a series of chisquare tests of independence for each of the themes. Interestingly, men and women did not differ in the themes generated, ps > .09. Online Supplemental Table 2 at https://osf.io/u893n/provides a full summary of the results.
Discussion
Asking participants to generate their own perceptions led to the discovery of specific perceptions about sex work beyond measuring opposition to sex work. Accordingly, in this study, we identified beliefs about sex work among a U.S. sample, many of which held negative and harmrelated connotations. Allowing participants to provide their own reasons for opposition enables a deeper examination of the factors driving opposition. Overall, many of these themes embodied negative connotations, and many emphasized concerns about harm and fairness; all provide insights into perceptions of sex work and were used in Study 1 to examine whether these factors fully explain opposition to sex work. Given the prominence of harmrelated beliefs about sex work, we wondered whether opposition to sex work predominantly arises from opposition to the potentially
TABLE 2
harminflicting factors presumed to cooccur with sex work more than from opposition to the exchange of sex for money. Specifically, if participants assume that sex work causes harm, will they likely oppose sex work scenarios that include harmful elements but not oppose sex work scenarios in the absence of harm? Does the mitigation of harm eliminate opposition to sex work, or do other factors nonetheless contribute to opposition to sex work, and if so, what are the other contributing factors? We sought to answer these remaining questions in Study 2.
Study 2
In Study 1 we identified common perceptions of sex work, many of which were negative and harm related. We extended these findings in Study 2 to examine whether opposition to sex work, among a U.S. sample, stems specifically from opposition to the negative and harmful factors presumed to cooccur with sex work, as identified in Study 1. Accordingly, we used a withinsubjects experimental design to examine whether opposition to sex work is primarily driven by negative and harmful confounding factors. Thus, participants were randomized to the order of conditions: one which included the negative confounding factors (cheating, condom misuse, desperation, drug and alcohol, enslavement, exploitation, illegality, physical threat, STIs and disease, and trafficking) and one which neutralized these factors. This enabled us to examine opposition to sex work in the “worst case scenario” and “best case scenario” to determine whether the “best case scenario” would fully eliminate opposition or merely reduce opposition relative to the negative factors condition. Participants were also asked to provide reasons for their reactions in each scenario, which enabled an exploration of remaining reasons for residual opposition, if any, in the neutralized condition. The study was approved by the Saint Xavier University Institutional Review Board.
Method
Participants and Sampling
*** 2%
2 = (1, n = 153) = 66.96, p < .001 3.67
2 = (1, n = 153) = 2.50, p < .11 1.83
= (1, n = 153) = 17.39, p < .001 3.83 STIs & Disease
= (1, n = 153) = 53.73, p < .001 3.78
2 = (1, n = 153) = 75.01, p < .001 8.91
Note. The percentages indicate the percent of participants who generated each theme in each condition and were tested with the chi-square goodness fit test against a proportion of .01 to indicate whether a significant proportion of participants generated each theme. *** p < .001. ** p < .01. * p < .05.
Two hundred timeslots were posted to Amazon Mechanical Turk. Respondents were limited to participants with U.S. IP addresses, aged 18 and older, and with a 95% or higher approval rating. Two hundred ninetytwo adults began the study and 231 completed most of the study. However, we reviewed the openended reactions to the scenarios and omitted participants whose responses indicated poor quality, in that the response copied elements of the scenario, no responses were provided in either scenario, or the responses were otherwise unrelated to the prompt (n = 78; 34%), thus leaving 153 participants with usable data.
Accordingly, of the 153 participants included in analyses, 81 selfidentified as cisgender male, 70 as cisgender female, and 2 as transgender. They mostly identified as heterosexual (88%) with 9% bisexual and 3% gay/lesbian. In addition, the majority identified as White (81%) with 11% Black/African American, 3% Asian, 3% Hispanic/Latino, and 3% other. They reported a mean age of 36.80 years (SD = 10.19, range 21 to 68), a median income of $50,000–$74,999 (range below $20,000 to $100,000–249,999), a median social class of middle class (range lower class to upper middle class), and a median education level of bachelor’s degree (range high school diploma to graduate or professional degree). In addition, twelve participants indicated that they paid someone for sex and one participant indicated that they received money for sex.
Design and Procedure
Participants first answered demographic questions and then were randomly assigned to the order of a sex work scenario in which the negative confounding factors (derived from the Study 1) were present or neutralized. Participants then reported whether or not they opposed the scenario, reported up to ten reasons for their beliefs, reread the scenario, rated their agreement with items assessing their perception of the presence or absence of each of the negative factors (i.e., the manipulation check; items randomized), and lastly rated the extent of their opposition to the scenario (items randomized). They were then thanked, debriefed, and paid. (See Online Supplemental Study 2 Codebook at https://osf.io/u893n/)
Experimental Manipulation. Participants were presented with sex work scenarios describing an interaction between a woman (seller) and man (buyer) who exchanged sex for money. The scenarios either included or neutralized the negative factors identified in Study 1. Table 1 provides the language for the negative and neutralized factors conditions separated by theme.
Negative Factors Condition. The negative factors condition included the themes generated in Study 1 to create a sex work scenario with those themes present. Those themes included cheating, condom misuse, desperation, drug and alcohol, enslavement, exploitation, illegal, physical threat, STIs and disease, and trafficking. For example, we included the trafficking theme by explicitly stating that the woman was being trafficked: “The woman was kidnapped and taken to a different location, far away from her home, and is forced to engage in sexformoney exchanges against her will.”
Neutralized Factors Condition. In the neutralized factors condition, we attempted to mitigate the negative factors presumed to cooccur with sex work situations. For example, we neutralized the theme of trafficking by explicitly stating that the woman was not being trafficked:
“The woman was not and is not being human trafficked, meaning that she was never kidnapped or forced to engage in sexformoney exchanges against her will.”
Dependent Measures
Manipulation Checks. To confirm that the negative factors condition sufficiently portrayed cheating, condom misuse, desperation, drug and alcohol, enslavement, exploitation, illegal, physical threat, STIs and disease, and trafficking relative to the neutralized condition, participants rated their level of agreement (1 = strongly disagree to 7 = strongly agree) with items measuring the extent of the presence of each theme in each scenario (see Online Supplemental Study 2 Codebook). These themes included: cheating (by either party), condom misuse (lack of condom use), desperation (engaging in a sexformoney exchange out of financial need), drug and alcohol use, enslavement (lack of autonomy), exploitation (third party profiting off the exchange), illegal, physical abuse, STIs and disease (risk of STI or disease transmission), and trafficking. To measure the absence or presence of these factors, participants rated their agreement on 2–4 items measuring each construct. Interitem reliabilities were sufficient for constructs in both conditions: Cronbach’s αs ranged .67–.922 across item sets and conditions.
Opposition. To examine whether the negative factors and their neutralization affected opposition, participants reported their opposition/support for each scenario in two ways. To mimic polling measures and to align with some previous research using dichotomized assessments, one measure simply asked “are you opposed to the above scenario” with the options “yes” or “no.” To also assess variance in attitudes, participants rated their level of agreement (1 = strongly disagree to 7 = strongly agree) across four items: “I [support/oppose/approve of/ disapprove of] the above scenario.” The positive items were reversescored and the items were then combined to create a composite score based on a mean of the four items. Interitem reliability indicated sufficient reliability in both the negative factors and neutralized factors conditions (Cronbach’s αs ranged .87–.94).
Reasons for Opposition. To enable a further examination of the reasons for opposition, participants reported up to ten reasons why they opposed or did not oppose each 2Because interitem reliability for the desperation item set was fair in the neutralized factors condition (α = .75) but poor for the negative factors condition (α = .51), the authors eliminated two out of three items and instead used a singleitem measure that the authors perceived to have the highest face validity. In addition, the interitem reliability for one item in the trafficking item set was fair in the neutralized condition (α = .76) but was poor in the negative factors condition (α = .66) and thus was dropped. The full set of original and final items is available in the Online Supplement Study 2 Codebook. Abrams, Banicki, and Pirlott
scenario. The first author and third author reviewed the responses, independently identified common themes, and collaborated to finalize and create operational definitions of the themes. We created operational definitions for each theme (see Online Supplemental Study 2 Codebook at https://osf.io/u893n/). The fourteen themes generated include cheating, condom misuse, desperation, drugs and alcohol, emotional damage (potential or experienced psychological, mental, or emotional harm), enslavement, exploitation, illegal, immoral, lack of romance (lack of emotional or romantic connection), physical threat, pregnancy, sexual abuse, STIs and disease, and trafficking After developing the themes, the first and second authors independently coded each individual response for the presence (1 = presence, 0 = absence) of each theme. Interrater reliability was sufficient for the neutral and negative factors conditions, Cohen’s κs ranged .67–1.00. Discrepancies were then discussed and resolved.
Results Manipulation Checks
To confirm the efficacy of the manipulation, we conducted a twofactor withinsubjects analysis of variance
TABLE 3
Comparisons of Themes Generated Between Participants Who Opposed Versus Did Not Oppose Sex Work in the Neutralized Scenario in Study 2
Desperation
Enslavement
Exploitation
Immoral 52%*** 1%
Lack Romance 17%*** 0%
2 = (1, n = 150) = 69.63, p = .001, V=.68
2 = (1, n = 150) = 23.56, p = .001, V=.4
Physical Threat 24%*** 1% χ2 = (1, n = 150) = 18.07, p = .001, V=.35
Pregnancy 10%*** 0% χ2 = (1, n = 150) = 13.95, p = .001, V=.31
Sexual Abuse 10%*** 0% χ2 = (1, n = 150) = 4.59, p = .032, V=.18
STIs & Disease 14%*** 1% χ2 = (1, n = 150) = 9.05, p = .003, V=.2
Trafficking 0% 0% +
Note. The percentages indicate the percent of participants who generated each theme in the neutralized condition between those who opposed and did not oppose sex work were tested with the chi-square goodness fit test against a proportion of .01 to indicate whether a significant proportion of participants generated each theme.
+ an insufficient number of cases to test *** p < .001. ** p < .01. * p < .05.
(ANOVA) examining the effect of condition on the different belief sets and using the belief sets as an additional withinsubjects factor. We specifically focused on the main effect of condition across belief sets, and the simple main effect of condition within belief sets. The main effect of condition was significant [F(1, 148) = 485.56, p < .001, ηp2 = .77)] such that the negative factors condition increased negative beliefs (M = 6.16, SD = 1.11, 95% CI[6.00, 6.35]) relative to the neutralized condition (M = 2.30, SD = 1.20, 95% CI[2.10, 2.49]). Furthermore, the simple main effect tests revealed that this pattern was consistent for all belief sets, ps < .001, ηp2s ranging from .11 to .76. Relative to the negative factors condition, participants in the neutralized condition were less likely to believe that cheating occurred, the exchange was illegal, sex trafficking occurred, the woman was enslaved, the woman was exploited, the woman was desperate, the woman was using or addicted to drugs or alcohol, physical abuse occurred, STIs and diseases were spread, and condoms were not used, thus suggesting the manipulation effectively neutralized the proposed negative factors. Importantly, however, although the neutralized condition significantly reduced the negative beliefs relative to the negative factors condition, participants’ endorsement of those beliefs in the neutralized condition were nonetheless above the lowest point on the scale. In other words, although the manipulation effectively reduced those beliefs, it did not, on average, eliminate those beliefs. Online Supplemental Table 3 at https://osf.io/u893n/ fully summarizes the results.
Opposition
We examined opposition to sex work in two ways: comparing the proportion of people opposed to the sex work scenario in each condition using a McNemar chisquare test and comparing the extent of opposition to the sex work scenario in each condition using a paired samples t test. The proportion of adults who opposed the sex work exchange scenario significantly differed between the two scenarios: A greater proportion of adults opposed the sex work scenario in the negative factors condition (95%) relative to the neutralized condition (19%). Specifically, 116 (76%) were opposed in the negative condition but changed to unopposed in the neutralized condition, 29 (19%) participants remained opposed in both scenarios, 7 (5%) remained unopposed in both scenarios, and 0 (0%) were opposed in the neutral condition but unopposed in the negative condition, χ2(1, n = 152) = 114.01, p < .001, OR3 = 10.65. Likewise, the extent of opposition differed such that participants were more opposed to sex work in the negative factors
3Formula for a withinsubjects binary 2 by 2 odds ratio provided by David B. Wilson (personal communication, January 1, 2021).
condition (M = 6.40, SD = 1.06) than the neutralized factors condition (M = 2.52, SD = 1.72); MD = 3.88, SD D = 2.20, 95% CI[ 4.23, 3.53], t (152) = 21.76, p < .001, d = 1.76.
Reasons for Opposition
As a second examination of whether the presence of negative factors changed beliefs about sex work, we conducted a series of McNemar chisquare tests to compare the proportion of people qualitatively generating each theme between the negative factors and neutralized conditions. Table 2 summarizes the results. A significantly larger proportion of people in the negative factors condition, relative to the neutralized condition, generated themes about enslavement (60% vs. 0%), trafficking (50% vs. 0%), cheating (42% vs. 1%), exploitation (39% vs. 0%), condom misuse (32% vs. 1%), desperation (15% vs. 0%), illegal (59% vs. 5%), drugs and alcohol (36% vs. 2%), sexual abuse (16% vs. 2%), STIs and disease (43% vs. 3%), physical threat (55% vs. 5%), and immorality (24% vs. 11%), and with odds ratios ranging 1.83 to 9.58. Interestingly, an equivalent proportion of people in both conditions commented on emotional damage (7% vs. 3%), pregnancy (6% vs. 2%) and the lack of romance and intimacy (2% versus 3%).
Exploratory Follow-Up Analyses
Examining Gender Differences. To examine gender differences in the continuous measure of opposition, we ran a 2 (gender; betweensubjects) by 2 (condition; withinsubjects) mixed ANOVA on opposition among cisgender participants.4 Across conditions, women (M = 4.76, SD = 0.86, 95% CI[4.55, 4.96]) were more strongly opposed than men (M = 4.21, SD =0.86, 95% CI[4.02, 4.40]), F(1, 149) = 14.70, p < .001, ηp2 = .09, and gender did not significantly interact with condition, F(1, 148) = 1.53, p = .22, ηp2 = .01, with simple effect tests of gender within each condition revealing women’s elevated opposition relative to men’s (negative condition: women: M = 6.61, SD = 0.90, 95% CI[6.37, 6.85], men: M = 6.28, SD = 1.12, 95% CI[6.06, 6.51); neutralized condition: women: M = 2.90, SD = 2.00, 95% CI[2.51, 3.30], men: M = 2.14, SD = 1.32, 95% CI[1.77, 2.51]), p s ≤ .05. No similar analysis exists for the categorical outcome variable, so we instead ran two chisquare tests of independence examining gender differences in opposition in the negative and neutralized conditions. Equivalent proportions of men and women opposed the neutral scenario (16% of men, 20% of women), χ2 (1, 150) = 0.45, p = .50, V = .06, as well as the negative factors scenario (94% of men, 97% of women), χ 2 (1, 151) = 0.93,
4It is unclear whether “gender” differences might be primarily driven by sex or gender so the authors used “both” by running analyses with cisgender participants.
p = .33, V = .08. We also examined gender differences in reasons for opposition within the neutralized and negative conditions. Online Supplemental Table 4 at https://osf.io/u893n/ summarizes the full results. In the neutral condition, women were more likely to mention immorality (17%) than men (5%), χ2 (1, 151) = 5.90, p = .015, V = .20; no other gender differences emerged, ps > 09.
Examining Residual Opposition. Although neutralizing the negative cooccurring factors decreased opposition to sex work from 95% opposition to 19%, a fair amount of people still opposed sex work in the neutralized condition. We examined possible reasons for the residual opposition in the neutralized condition by examining the differences in reasons (i.e., themes) generated between opposed and unopposed participants using a series of chisquare test of independence tests. Table 3 summarizes the differences in reasons generated between opposed and unopposed participants in the neutralized condition. Some of the strongest differences between opposed and unopposed participants were elements that were not mitigated between conditions: immorality (52% vs. 1%), in particular, as well as lack of emotional or romantic connection (17% vs. 0%), pregnancy (10% vs. 0%), emotional damage (14% vs. 0%), and sexual assault (10% vs. 0%). Additionally, opposed participants were more likely to raise concerns about illegality (28% vs. 0%), physical harm (24% vs. 1%), drug and alcohol use (10% vs. 0%), STI and disease transmission (14% vs. 1%), cheating (7% vs. 0%), and lack of condoms (3% vs. 0%). They did not differ in mentioning desperation (0% vs. 0%), enslavement (0% vs. 0%), exploitation (0% vs. 0%), or trafficking (0% vs. 0%).
Discussion
The results of this study suggest that opposition to sex work, among this sample of U.S. Americans, is primarily due to the negative associated factors. Thus, these participants oppose sex work when sex work participants are under the influence of drugs and alcohol; the interaction is illegal, contributes to relationship cheating, transmits infections and disease, and involves unsafe sexual practices; and the woman is trafficked, enslaved, financially desperate, and exploited. Interestingly, participants also mentioned additional concerns, which were not explicitly neutralized, including that the exchange lacked an emotional connection, could enable sexual assault, could produce an unplanned pregnancy, and could cause emotional harm. The prevalence of those themes was greater in the negative factors condition relative to the neutralized condition, with the exception of lacking a romantic connection, emotional damage, and potential for unwanted pregnancy, which did not differ in prevalence between conditions.
General Discussion
Beliefs About Sex Work: Study 1
The findings from Study 1 revealed that associations with sex work were predominantly negative. These include assumptions that sex workers are enslaved, exploited, abused, and trafficked and that participants involved in sex work are cheating, spreading infections and diseases, and misusing drugs and alcohol. Participants also commented that sex work is illegal and immoral. These findings are generally consistent with other research measuring undergraduate students’ beliefs about sex work in Canada, which includes similar themes such as risks to health, physical abuse, drug usage, illegality, and low socioeconomic status (Morton et al., 2012). In addition, the current approach enabled the discovery of the additional themes of trafficking and cheating, thus extending the current literature.
What Explains Opposition to Sex Work? Study 2
In Study 2 we used the negative themes from Study 1 to create two sex work scenarios, one with the negative factors included and one with the negative factors neutralized, to determine whether those negative factors were the primary drivers of opposition to sex work. Results confirmed that the negative contextual factors are primary drivers of opposition to sex work, as indicated by a large reduction in opposition in the neutralized condition. This is consistent with other experimental investigations, which have shown that scenarios depicting women being forced into sex work increase moral opposition (Bonache et al., 2021; Silver et al., 2015). However, a fair proportion of the sample nonetheless opposed sex work even with those negative factors neutralized. Examining these participants’ reasons for their answers revealed five themes for which a fair proportion of participants still noted in the neutralized condition: physical threat, STIs and disease, illegality, emotional damage, lack of intimate connection, and immorality.
Gender Differences
In addition, and consistent with previous investigations (e.g., Cao et al., 2017; Cao & Maguire, 2013; Chon, 2015; Hansen & Johansson, 2022; Jakobsson & Kotsadam, 2011; Jonsson & Jakobsson, 2017; Marist Institute, 2016; Morton et al., 2012; YouGov Poll, 2016), women were more likely to be opposed to sex work than men in both conditions in Study 2. Further, women were more likely to state that sex work is immoral even in the neutralized condition in Study 2.
Limitations and Future Directions
One potential limitation of Study 2 was that it manipulated the presence of multiple negative factors concurrently. This prevents one from understanding exactly
which factors drive opposition toward sex work. It is also possible that reallife sex work scenarios do not necessarily include all negative factors concurrently. However, the presence of these factors seems to be consistent with realworld descriptions of sex work (Preble et al., 2019; Shaver et al., 2011). In addition, in Study 1 we collected lay peoples’ concerns about what they believe occurs in sex work exchanges and used these concerns in the manipulation in Study 2. Therefore, we believe this to be a strength in enhancing external validity by including all possible negative factors and mitigating any potential confounding risk. However, future research could contrast the effects of each of the negative factors individually to determine if one particular factor drives opposition. For example, future studies could use our neutralized condition and manipulate only one of the negative factors in a condition across several conditions to determine if any of the negative factors we concurrently manipulated did not, in fact, increase opposition to the sex work scenario or to compare the magnitude of the effect of the particular elements.
Along similar lines, was the neutralized condition unrepresentative of real world sex work scenarios, and therefore limited external validity? Although it is possible that reallife sex work exchanges might not include all of these safety precautions, the neutralized condition nonetheless parallels those utilized in real places where sex work is legal (Brents & Hausbeck, 2005). For instance, Nevada brothels implement a multitude of safety precautions, such as panic buttons, audio monitoring, required condom use for all sexual acts, knowledge of where the women in sex work are, and required weekly STI checks for the women in sex work (Brents & Hausbeck, 2005), thus suggesting that some of the mitigations within the neutralized scenario were, in fact, realistic.
In Study 2 we found that average opposition to the sex work exchange in the neutralized condition (M = 2.52, SD = 1.72, on a scale of 1 to 7) was similar to U.S. adult’s ratings on sex work justifiability on the World Values Survey (M = 3.60, SD = 2.70, on a scale of 1 to 10) in 2017 (Haerpfer et al., 2021). This could suggest that the manipulation artificially inflated opposition to sex work in the negative factors condition and that the sex work exchange in the neutralized condition represents what some U.S. Americans believe sex work exchanges look like. However, in using the beliefs generated in Study 1 as the foundation for the scenarios in Study 2 eliminates this potential limitation, we thus ensured that the negative factors scenario was representative of beliefs about sex work. Also, previous survey measures did not define specific instances of sex work, meaning that participants rated opposition to sex work as defined
by their own heuristics and beliefs about sex work rather than as defined by the researcher. The results of the current study suggest that the sample of U.S. adults predominantly opposes sex work due to the negative confounding factors, whereas future research could examine the role of immorality in maintaining opposition to otherwise harmreduced sex work.
Sample Validity
Early research heralded the use of Amazon Mechanical Turk as a lowcost way of amassing large online samples (e.g., Buhrmester et al. 2011). Among other strengths, MTurk is more diverse than college student samples and provides a better (although not representative) sample of adults (e.g., Buhrmester et al. 2011). Recently, however, the quality of MTurkers decreased substantially, with researchers noting, for example, that “starting in summer 2018, social media and online discussions emerged expressing concerns about bots (i.e., computer programs that automatically complete HITs) and/or farmers (i.e., individuals using server farms to bypass MTurk location restrictions) on MTurk” (Chmielewski & Kucker, 2020, p. 464), particularly as noted in unusual open ended responses (see Chmielewski & Kucker, 2020). Longitudinal studies documented an increase in poorquality respondents around 2018 (Chmielewski & Kucker, 2020). Of note, however, poorquality online respondents are not limited to Amazon Mechanical Turk (e.g., Salinas, 2023).
The authors excluded from analyses participants identified as poor respondents, and as such, believe the results reflect results obtained from primarily nonfraudulent participants and are thus valid. First, the currently used exclusion practices are in line with current recommendations. In the authors’ exclusion review, what the authors independently suspected indicated fraud is consistent with recommendations made by others (e.g., see Chmielewski & Kucker, 2020). Furthermore, the percentage of flagged responses in the current studies is consistent with longitudinal research examining MTurk response quality at about the same time (Chmielewski & Kucker, 2020). In addition, the use of a withinsubjects design minimizes the potential for differential attrition between conditions to introduce confounds (e.g., see Zhou & Fishbach, 2016). Lastly, excluding the perceived fraudulent data had a very small impact on the results. The pattern of the results was largely unchanged, with the exception of strengthening and sharpening effects, which can happen when the identified poor responders’ responses are mostly random responding and therefore primarily add unsystematic error variance, which serves to dilute the systematic variance of the overall effects.
As such, with the exclusion of poor responders, with identification practices consistent with professional recommendations, and with the exclusion only exerting a minor effect on the results, the authors are confident in the validity of the results for a sample of American adults. That the current results are similar to other similar investigations conducted with different sampling techniques (e.g., Bonache et al., 2021; Haerpfer et al., 2021; Morton et al., 2012; Silver et al., 2015) adds further support in the validity of the current findings.
Why Is Sex Work “Immoral?”
Theoretical Implications
Sex work seems to be a “moral” issue. Beliefs about sex work seem to primarily include concerns of harm (Study 1) and opposition to sex work seems to primarily (but not exclusively) be in response to harm (Study 2). Wanting to minimize harm to others is seemingly a common “moral” belief, at least according to moral foundations theory (e.g., Graham et al., 2013). A large component of opposition to sex work, as evinced in the current studies, is the perception of potential for harm. And yet, a sizable proportion of people were still opposed to sex work, even in the neutralized condition, in which harm was largely mitigated.
The issue of “morality” was not explicitly mitigated in the neutralized condition. (How could researchers make sex work “moral?”) This was the largest concern expressed, particularly among those opposed to sex work in the neutralized condition. Future research examining attitudes toward sex work should focus specifically on understanding the “morality” of sex work.
Large drivers of the moral opposition to sex work among U.S. Americans, we suspect, could be due to religious definitions of and restrictions surrounding sex and the consequential imbuing of sex with moral importance. For example, marriage (including its sexual consummation) is a sacrament in the Roman Catholic Church and is a sacred institution or holy ordinance of God in the Protestant churches (with Christians the most common religious identity among U.S. Americans at 68%; Gallup, 2024). As such, for some, the act of sexual intercourse is one with deep spiritual meaning and is reserved as a holy act to be performed only within marriage. Exchanging sex for money would violate the religious “holy act” or sacrament of marriage. In support of the idea that opposition to sex work could stem from beliefs that sex work violates religious morals, as religiosity in America has decreased (e.g., Pew Research Center, 2022), opposition to sex work has similarly decreased (e.g., Cao & Maguire, 2013).
In trying to understand residual opposition in the neutralized condition, radical feminist theories suggest Abrams, Banicki, and Pirlott
that, under patriarchal conditions, women are never truly fully sexually empowered (e.g., Gerassi, 2015). Furthermore, for a phenomenon in which there is a common sexspecific dynamic, in which one sex (male) typically pays for a service typically provided by the other sex (female), and the reverse situation (women paying men for sex) is rarer; again, some might believe that women are never fully sexually empowered. In other words, in exchanges like sex work, this logic might argue that women are always being taken advantage of, and these exchanges are never truly “fair” because the goods the woman provides (sex) is invaluable and cannot truly ever be fairly commodified by money. And thus, this situation is always exploitative and cannot ever truly be “fair.”
In a similar vein, some of that residual opposition might be due to the sexspecific nature of the arrangement of women selling sex and men buying sex, which could be perceived as inherently exploitative. For example, men’s greater average physical size and upper body strength makes it easier for them, on average, to physically and sexually assault women, and women, not men, risk bearing an unwanted pregnancy. However, other sexspecific pairs in sex work exist. Arrangements in which women purchase sex from men would not negate that the male seller, given average sex differences in size and strength, could more easily physically and sexually assault the woman, or that the woman could incur an unwanted pregnancy, and so some U.S. Americans might nonetheless be somewhat opposed to that transaction. However, because men are the sellers and women are the buyers, there might be reduced perceptions that the transaction is exploitative. For malemale and femalefemale sex work, there is no risk of unwanted pregnancy, nor is there necessarily an average size and strength difference between the buyer and seller. As such, some U.S. Americans might be even less opposed to that form of transactional sex. Examining the reactions to other sexspecific dynamics in sex work provides an interesting avenue for future research.
Conclusion
The existing literature lacks an understanding of the reasons for which U.S. samples oppose sex work, aside from individual difference and worldview predictors of opposition. The present studies offer an initial investigation into addressing this shortcoming. Results from these studies identified respondentgenerated beliefs about sex work, which were primarily negative, and these negative perceptions of sex work, particularly perceptions of harm toward sex workers, partially explained opposition toward sex work. Unexplained residual opposition seemed to revolve around a more diffuse concept of
“morality,” which the discussion sought to unpack. Ambivalence toward sex work, among some U.S. Americans, might reflect two different issues: a desire to reduce harm toward people (particularly women) in sex work, while nonetheless remaining morally opposed to sex work. This research helps continue the discussion.
References
Bonache, H., Delgado, N., Pina, A., & Hernandez-Cabrera, J. A. (2021). Prostitution policies and attitudes toward prostitutes. Archives of Sexual Behavior, 50, 1–16. https://doi.org/10.1007/s10508-020-01891-9
Bouchard, T. J., Jr. (2009). Authoritarianism, religiousness, and conservatism: Is “obedience to authority” the explanation for their clustering, universality and evolution? In E. Voland & W. Schiefenhövel (Eds.), The biological evolution of religious mind and behavior (pp. 165–180). Springer Science + Business Media. https://doi.org/10.1007/978-3-642-00128-4_11
Brents, B. G., & Hausbeck, K. (2005). Violence and legalized brothel prostitution in Nevada: Examining safety, risk, and prostitution policy. Journal of Interpersonal Violence, 20(3), 270–295. https://doi.org/10.1177/0886260504270333
Buhrmester, M. D., Kwang, T., & Gosling, S. D. (2011). Amazon’s Mechanical Turk: A new source of inexpensive, yet high-quality, data? Perspectives on Psychological Science, 6, 3–5. https://doi.org/10.1177/1745691610393980
Cao, L., Lu, R., & Mei, X. (2017). Acceptance of prostitution and its social determinants in Canada. International Journal of Offender Therapy and Comparative Criminology, 61(10), 1171–1190. https://doi.org/10.1177/0306624X15609920
Cao, L., & Maguire, E. R. (2013). A test of the temperance hypothesis: Class, religiosity, and tolerance of prostitution. Social Problems, 60(2), 188–205. https://doi.org/10.1525/sp.2013.60.2.188
Chmielewski, M., & Kucker, S. C. (2020). An MTurk crisis? Shifts in data quality and the impact on study results. Social Psychological and Personality Science, 11(4), 464–473. https://doi.org/10.1177/1948550619875149
Chon, D. S. (2015). Gender equality, liberalism and attitude toward Prostitution: Variation in cross-national study. Journal of Family Violence, 30, 827–838. https://doi.org10.1007/s10896-015-9713-y
Davern, M., Bautista, R., Freese, J., Morgan, S.L., & Smith, T.W. (2021). General social surveys, 1972–2021 [dataset and codebook.] NORC at the University of Chicago gssdataexplorer.norc.org
Ditmore, M. H. (2011). Prostitution and sex work. Greenwood Press. Gallup. (2024, March 29). How religious are Americans? Gallup. https://news.gallup.com/poll/358364/religious-americans.aspx
Gerassi, L. (2015). A heated debate: Theoretical perspectives of sexual exploitation and sex work. Journal of Sociology and Social Welfare, 42(4), 79–100. https://www.ncbi.nlm.nih.gov/pmc/articles/PMC4730391/ Graham, J., Haidt, J., Koleva, S., Motyl, M., Iyer, R., Wojcik, S. P., & Ditto, P. H. (2013). Moral foundations theory: The pragmatic validity of moral pluralism. In P. Devine & A. Plant (Eds.) Advances in Experimental Social Psychology, 47, pp. 55–130. https://doi.org/10.1016/B978-0-12-407236-7.00002-4
Hansen, M. A., & Johansson, I. (2022). Predicting attitudes towards transactional sex: The interactive relationship between gender and attitudes on sexual behaviour. Sexuality Research and Social Policy, 19, 91–104. https://doi.org/10.1007/s13178-020-00527-w
Haerpfer, C., Inglehart, R., Moreno, A., Welzel, C., Kizilova, K., Diez-Medrano J., Lagos, M., Norris, P., Ponarin, E., & Puranen, B. (2022). World values survey trend file (1981-2022) cross-national dataset. [Data set]. JD Systems Institute & WVSA Secretariat https://doi.org/10.14281/18241.23
Jakobsson, N., & Kotsadam, A. (2011). Gender equity and prostitution: An investigation of attitudes in Norway and Sweden. Feminist Economics, 17, 31–58. https://www.tandfonline.com/doi/full/10.1080/13545701.2010.541863
Jonsson, S., & Jakobsson, N. (2017). Is buying sex morally wrong? Comparing attitudes toward prostitution using individual-level data across eight Western European countries. Women’s Studies International Forum, 61, 58–69. https://doi.org/10.1016/j.wsif.2016.12.007
Kissil, K., & Davey, M. (2010). The prostitution debate in feminism: Current trends, policy and clinical issues facing an invisible population. Journal of Feminist Family Therapy: An International Forum, 22(1), 1–21. https://doi.org/10.1080/08952830903453604
Abrams, Banicki, and Pirlott | Perceptions of and Opposition to Sex Work
Mancini, C., Pickett, J. T., Budd, K. M., Bontrager, S., & Roe-Sepowitz, D. (2020). Examining policy preferences for prostitution regulation among American males: The influence of contextual beliefs. Criminal Justice Review, 45(4), 413–429. https://doi.org/10.1177/0734016820906601
Marist Institute. (2016). Should prostitution be legal? Marist College Institute for Public Opinion. Retrieved from https://maristpoll.marist.edu/wp-content/misc/usapolls/us160524/ Point%20Taken/Prostitution/Exclusive%20Point%20Taken_Marist%20 Poll_Complete%20Survey%20Findings_May%202016.pdf
Moen, O.M. (2014). Is prostitution harmful? Journal of Medical Ethics, 40, 73–81. https://doi.org/10.1136/medethics-2011-100367
Morton, H., Klein, C., & Gorzalka, B. B. (2012). Attitudes, beliefs, and knowledge of prostitution and the law in Canada. Canadian Journal of Criminology and Criminal Justice, 54(2), 229–244. https://doi.org/10.3138/cjccj.2010.E.46
Pew Research Center. (2022, September 13). Modeling the future of religion in America. Retrieved from https://www.pewresearch.org/religion/2022/09/13/how-u-s-religiouscomposition-has-changed-in-recent-decades/
Preble, K., Magruder, K., & Cimino, A. (2019). “It’s like being an electrician, you’re gonna get shocked”: Differences in the perceived risks of indoor and outdoor sex work and its impact on exiting. Victims & Offenders, 14(5), 625–646. https://doi.org/10.1080/15564886.2019.1630043
Salinas, M. R. (2023). Are your participants real? Dealing with fraud in recruiting older adults online. Western Journal of Nursing Research, 45(1), 93–99. https://doi.org/10.1177/01939459221098468
Shaver, F., Lewis, J., & Maticka‐Tyndale, E. (2011). Rising to the challenge: Addressing the concerns of people working in the sex industry. Canadian
Review of Sociology/Revue Canadienne de Sociologie, 48(1), 47–65. https://doi.org/10.1111/j.1755-618X.2011.01249.x
Silver, K. E., Karakurt, G., & Boysen, S. T. (2015). Predicting prosocial behavior toward sex-trafficked persons: The roles of empathy, belief in a just world, and attitudes toward prostitution, Journal of Aggression, Maltreatment & Trauma, 24(8), 932–954. https://doi.org/10.1080/10926771.2015.1070231
YouGov Poll. (2015). Polling the political debate on the legalization of prostitution. https://d25d2506sfb94s.cloudfront.net/cumulus_uploads/ document/xivicl1avj/tabs_OP_Prostitution_20160307.pdf
Weitzer, R. (2024). Theorizing sex work: A sectoral approach. Theory and Society, 53, 1245–1265. https://doi.org/10.1007/211186-024-09573-4
Zhou, H., & Fishbach, A. (2016). The pitfall of experimenting on the web: How unattended selective attrition leads to surprising (yet false) research conclusions. Journal of Personality and Social Psychology, 111(4), 493–504. https://doi.org/10.1037/pspa0000056
Author Note
Angela G. Pirlott https://orcid.org/0000-0002-9262-2530
Studies were funded by the Saint Xavier University Honors Program. We thank David Wilson for his assistance with the withinsubjects binary effect size calculations. None of the authors have any known financial or nonfinancial conflicting interests to disclose.
Correspondence concerning this article should be addressed to Angela Pirlott, Saint Xavier University, Department of Psychology, 3700 W. 103rd St., Chicago, IL, 60655, USA.
Email: pirlott@sxu.edu
“Where
Are You REALLY From?” Navigating Rejection Sensitivity, Perceiving Microaggressions, and Anxiety Among South Asian Students
Megha Datta1, Zeena R. Whayeb1, Pam McAuslan*2, and Robert Hymes*2
1University of Michigan-Dearborn
2Department of Behavioral Sciences, University of Michigan-Dearborn
ABSTRACT. Three in four people of color experience discrimination within their daily lives (WongPadoongpatt et al., 2020). However, despite the wellknown link between racial microaggressions and mental health, little is known about the impact of microaggressions on South Asian students, as existing studies frequently aggregate all Asian populations rather than distinguishing South Asians as a distinct subgroup (Ogunyemi et al., 2020; TorresHarding et al., 2020; WongPadoongpatt et al., 2020). The present study examined the relationships between discrimination, rejection sensitivity, and emotional and physiological reactions among South Asian American students. Participants were 192 postsecondary students who completed an online 2part longitudinal study. Participants completed selfreport questionnaires and recorded their heart rate before and after viewing a video depicting discriminatory interactions with South Asian characters from popular shows and movies. Correlational analyses revealed that greater past discriminatory experience was related to greater rejection sensitivity, r(190) = .61, p < .001, and tendency to perceive the interactions in the video as microaggressive, r(190) = .15, p = .032. Further analyses revealed evidence that the relationship between past discriminatory experiences and emotional and physiological reactions (increase in heart rate and negative affect and decrease in positive affect) was serially mediated through rejection sensitivity and perception of microaggressions. Implications for future research and strategies involving stress management, conflict resolution, and multicultural training are discussed.
Keywords: South Asian, racial microaggressions, rejection sensitivity, health
Asian Americans are the fastest growing minority group in the United States; however, psychological research regarding the distinct experiences of South Asians within this broader category is relatively rare (Budiman & Ruiz, 2021). South Asians—composed of individuals from countries such as India, Pakistan, Bangladesh, Sri Lanka, and
Nepal—remain underrepresented in empirical studies, particularly those examining the psychological and physiological consequences of discriminatory and microaggressive experiences. The “model minority” stereotype has further minimized issues experienced by South Asians such as discrimination, ethnic harassment, and racial profiling (KaduvettoorDavidson & Inman,
Diversity badge earned for conducting research focusing on aspects of diversity.
2013). One particularly pervasive form of contemporary discrimination is racial microaggressions, which are subtle statements or actions that communicate derogatory or exclusionary messages towards marginalized groups (Lui, 2020). Although the harmful effects of discrimination and microaggressions on psychological and physiological health have been welldocumented among other minority groups (Keels et al., 2017; TorresHarding et al., 2020), limited research has examined how South Asians, and more specifically postsecondary South Asians, perceive and respond to these incidents—particularly when experienced vicariously in media. This study seeks to address this critical gap by investigating the relationship between past experiences with perceived discrimination, rejection sensitivity, emotional and physiological responses, and perceived microaggressions in media among South Asian postsecondary students.
Asian Americans and the Model Minority Theory
Individuals of Asian descent are a growing minority group within North America as families immigrate with the hopes of improving quality of life (Bakhtiari et al., 2018; Sharma et al., 2020). Individuals of Asian ethnicity represent 5.9% of the total population in the United States of America (U.S), with the total South Asian population estimated to be 5.4 million (SAALT, 2019). Despite this growth, studies sometimes neglect intracultural diversity, with Asian and Asian Americans often depicted as homogeneous, despite being composed of a variety of religious, ethnic, and linguistic backgrounds (Poolokasingham et al., 2014).
The model minority theory depicts individuals of Asian descent as industrious and accomplished minorities who have overcome racism and successfully integrated within American society (Kramer, 2003). The model minority theory is often promoted in media depicting Asian Americans as a representation of the “American Dream” compared to other people of color (POC; Kramer, 2003). The negative discriminatory experiences faced by South Asians are often diminished, possibly because they are perceived as a “model minority,” and this stereotype often emphasizes success while minimizing issues such as discrimination, ethnic harassment, and racial profiling (KaduvettoorDavidson & Inman, 2013).
Despite this reputation of being a model minority, Asian Americans are thought to experience the same amount of discrimination as other minorities (Chan & MendozaDenton, 2008). More specifically, Ruiz et al. (2023) reported that six in ten Asian adults stated they have experienced discrimination. The United States Department of Justice (2024) released an analysis of reported crimes
in 2023, revealing that 52.5% of hate crimes reported to police were motivated by bias against race/ethnicity/ ancestry—6.7% of which were antiAsian biases.
The repercussions of the model minority stereotype may extend into various settings, including postsecondary education. Although postsecondary education is frequently a stressful environment for young adults, mental health issues such as anxiety seem to occur more often among students of color and appear to relate to experiencing discrimination (RobinsonPerez et al., 2020). With the increasing diversity found among the student body in academia, findings by Solórzano and colleagues (2000; as cited by Ogunyemi et al., 2020) suggest that subtle microaggressions were more likely to be present within educational institutes compared to overt racism. Exposure to a racially hostile campus is depleting for students of color, increasing risk of stress, depression, binge drinking, and in some cases contributes to symptoms of posttraumatic stress disorder (PTSD; Ogunyemi et al., 2020).
Rejection Sensitivity
Rejection sensitivity refers to an individual’s expectation or fear of potential rejection from others due to a particular bias (e.g., race, sexual orientation, status, gender; Mellin, 2008). Repeated experiences communicating rejection rather than acceptance, such as experiences of prejudice, discrimination, or exclusion based on social membership, can produce anxious expectations regarding the occurrence of future statusbased rejection (MendozaDenton et al., 2002). Thus, different individuals may not appraise a discriminatory or microaggressive situation in the same way (McCullough et al., 2021; WongPadoongpatt et al., 2020). Various factors impact an individual’s cognitive and emotional response to these experiences. These include gender and their overall level of rejection sensitivity, but also expectations regarding the exchange, the content or type of microaggression, location of the occurrence, or the perpetrator (i.e., role differences; TorresHarding et al., 2020).
Rejection sensitivity is conceptualized as a defensive motivational system allowing individuals to provide a quick response to a potential rejection associated with an environmental stimulus. However, affective and behavioral overreactions can be a consequence, resulting in hypervigilance during ambiguous situations, causing individuals to readily perceive intentional rejection and potentially respond with anger, hostility, withdrawal, or other maladaptive coping to handle the exchange (Downey & Feldman, 1996; Henson et al., 2013; Mellin, 2008). Students with higher hypersensitivity or rejection sensitivity were more likely to partake in emotional mechanisms such as rumination (Henson et al., 2013).
Individuals tend to think about the situation over an extended period which prolongs the emotional and cognitive reactions associated with the experiences, thus leading to higher risk for depression, anxiety, anger, and stress (Downey & Feldman, 1996; Henson et al., 2013, Mellin, 2008). In summary, past repeated experiences with discrimination may increase anxious expectations of rejection in future situations, which may relate to how ambiguous events are interpreted and what emotional responses are elicited (MendozaDenton et al., 2002).
Racial Microaggression
The nature of racism is thought to have shifted to a more modern and subtle form that is referred to as microaggressions, which are ambiguous and often hard to identify forms of discrimination (Sue et al., 2007). Although discrimination towards racial minorities may manifest overtly through blatant physical violence or unjust treatment, Lui (2020) suggested that microaggressions differ from overt discrimination as they occur more frequently and place a significant psychological burden on recipients (Lui, 2020). Microaggressions are thought to stem from unconscious racism and may be directed towards any marginalized group including, but not limited to, gender, sexual orientation, or race (Lui, 2020; Lui & Quezada, 2019). They are characterized as brief, everyday exchanges which communicate hostile, offensive, or derogatory messages—whether intentional or not—directed towards individuals belonging to a racial minority (Ogunyemi et al., 2020; TorresHarding et al., 2020).
Microaggressions often result in the marginalized individual experiencing psychological and physiological distress with a negative effect on social wellbeing (Pooloksingham et al., 2014; Sue et al., 2007). For example, one common microaggression experienced by Asian Americans and other minority groups is the question “Where are you really from?” which is rooted in the assumption that the person was not born in the United States (Sue, 2010). Furthermore, experiencing racial microaggressions from faculty and other peers is related to social, academic, and emotional challenges for students of color (RobinsonPerez et al., 2020). For example, Farber et al. (2021) found that nonWhite college students’ experiences of microaggressions were associated with greater depressive and stress symptoms. Individuals faced with the ambiguous nature of microaggressions undergo an arduous process as they must first determine whether the incident occurred, if the perpetrator consciously behaved in a discriminatory manner, and then decide on a sufficient response (Keels et al., 2017). This framework suggests that microaggressions may have stronger effects than overt racial discrimination,
as individuals are affected even if they do not consciously recognize the fact that they have been a victim of a microaggression (Keels et al., 2017). Experiencing racial microaggressions results in an expenditure of significant emotional and cognitive energy and can lead to an increase in perceived stress, which negatively impacts the mental and physical health of minority students (Keels et al., 2017; TorresHarding, 2020).
Microaggressions in Media
Microaggressions are visually present in many forms of media, including television. Prior research has used examples of microaggressions and discrimination from social media (Tao & Fisher, 2022) and American television shows (Mastro et al., 2008; Washington et al., 2021) to study the effects of witnessing similar others experiencing discrimination. There is a large body of research that demonstrates the complex effects of media on individuals (e.g., Valkenburg et al., 2016). For stigmatized groups, negative portrayals and cultural messages shown in media can foster prejudice, and are associated with negative health outcomes (National Academy of Medicine, 2017). For example, a study conducted by Roberts and colleagues (2017) recruited African American students to assess their reactions to descriptions of fatal shootings of African Americans and found that higher racebased rejection sensitivity and components of racial identity increased feelings of distress. Armstead and colleagues (1989) reported that African American participants experienced increases in blood pressure after viewing excerpts from popular movies that depicted racism directed at African American characters.
Viewing microaggressions or discrimination in the media has been recognized as a form of vicarious discrimination, which is the witnessing of racism targeting one’s own racial or ethnic group (Verdugo et al., 2024). Studies show that vicarious discrimination, whether witnessed through social media or inperson, is related to poorer mental health (ElTohamy et al., 2024; Verdugo et al., 2024). Research during the COVID19 pandemic provided evidence that the experience of vicarious discrimination associated with antiAsian hate crime was related to increased anxiety and depressive symptoms in Asian Americans (e.g., Yi et al. 2023).
Psychophysiological Impacts of Discrimination
Prior research indicates that individuals born to immigrant families may experience difficulty being accepted as full members of society, with many South Asians perceived as foreigners despite being born or raised in America (KaduvettoorDavidson & Inman, 2013; Tineo et al., 2021). The minority stress theory suggests that the prejudice and discrimination faced by individuals
of racially marginalized groups results in elevated levels of stress (WongPadoongpatt et al., 2020), which may be predictive of internalizing symptoms associated with higher levels of anxiety. Furthermore, these experiences may lead to feelings of alienation, diminished participation in campus life, identity confusion, and increased levels of suicidality (Ogunyemi et al., 2020; Tineo et al., 2021). Additionally, discrimination is strongly related to trait and state anxiety (Hwang & Goto, 2009).
Few studies have examined anxiety among youth in relation to discrimination, despite the fact that an exchange or situation perceived as discriminatory can result in psychological stress responses (Clark et al., 1999; Stein et al., 2019). These responses include but are not limited to shame, anger, and anxiety which can impact physiological responses within the body (Clark et al., 1999; Stein et al., 2019).
Moreover, an individual’s primary appraisal of a situation determines whether a situation is irrelevant, harmless, positive, or stressful, which can in turn result in various physiological responses (Clark et al., 1999; Ogunyemi et al., 2020). The minority stress theory states that prejudice and discrimination faced by individuals of racially marginalized groups can result in elevated levels of stress, which are often associated with a surge of the cardiovascular system commonly resulting in an increased heart rate and blood pressure, decreased heart rate variability, and a risk for cardiovascular disease (Clark et al., 1999; Hoggard et al., 2015; WongPadoongpatt et al., 2020). Despite the association of racial discrimination with negative health outcomes, there is little understanding of the mechanisms through which racial discrimination influences the changes in physiological systems and health outcomes (Hoggard et al., 2015).
The Present Study
Considering the psychological and physiological distress associated with experiencing microaggressions and the growing diversity of the student body in higher education (Ogunyemi et al., 2020), the present study sought to examine the relationships between past experiences of perceived racial discrimination, rejection sensitivity, microaggressions and emotional and physiological reactions among South Asian students. There were two parts to this longitudinal study: the first part examined past perceived discrimination and rejection sensitivity, and the second part used videos from popular shows and movies to examine the impact of watching a video depicting South Asian characters experiencing microaggressions on participants’ mood and heart rate.
We anticipated that labelling the interactions in the video as microaggressive was expected to influence
emotional and physiological reactions to the video. This hypothesis was based on the research that demonstrates that experiencing microaggressions is associated with negative psychological and physiological responses (e.g., Keels et al., 2017; TorresHarding et al., 2020), as well as research that indicated that individuals who watch media portrayals of characters like them who experience discrimination also have elevated physiological and psychological responses (ElTohamy et al., 2024; Verdugo et al., 2024). Figure 1 depicts this hypothesized model. We hypothesized that greater perceived past discrimination would relate to more rejection sensitivity and to increased heart rate and negative affect, as well as decreased positive affect after viewing the video. Rejection sensitivity was expected to be positively associated with identifying microaggressions in the video. Labelling the video as more microaggressive was expected to relate to subsequent increases in heart rate and negative affect and a decrease in positive affect after viewing the video. Rejection sensitivity and labelling the video as microaggressive were hypothesized to serially mediate the relationship between perceptions of past discrimination and emotional and physiological reactions to the video.
Methods
Participants
Participants were 192 students recruited from Amazon Mechanical Turk (MTurk). Participants ranged in age from 19 to 30 (M = 23.92; SD = 2.30); 108 selfidentified as men (56.3%), 80 as women (41.7%), four identified as nonbinary or did not say (2.0%). Participants were postsecondary students in the United States who selfidentified as South Asian Americans (53.1% Indian, 13.5 % Pakistani, 4.2% Bangladeshi, 14.1% Sri Lankan, 9.4% Nepali, 5.7% other), with the most born in the United States (93.8%).
Measures
Demographics
Demographics included questionnaires regarding eligibility (i.e., born or raised in North America, attending postsecondary school, and type or model of Apple Watch/Fitbit), age, gender, specific ethnic background (e.g., Indian, Pakistani). Participants were required to own an Apple Watch or Fitbit to be eligible for the study in order to measure heart rate. Most reported having an Apple Watch (69.3%) with the remainder being Fitbit users (30.7%).
Previous Discriminatory Experience
The Everyday Discrimination Scale (EDS), a 9item selfreport questionnaire, was used to assess
WINTER 2025
PSI CHI JOURNAL OF PSYCHOLOGICAL RESEARCH
perceptions of the frequency of previous discriminatory experiences (Kershaw et al., 2016; Williams et al., 1997) by asking participants to report how often each item occurs to them in their day to day lives. Some example items include, “You are treated with less courtesy than other people are,” and “You are treated with less respect than other people are” (Kershaw et al., 2016; Williams et al., 1977). Participants responded to each item using a six point scale ranging from never (1) to almost every day (6). Strong reliability was indicated in past research (α = .88; Kershaw et al., 2016) and in the present study (α = .91).
Rejection Sensitivity
The Status Based Rejection Sensitivity for Asian Americans (RSA) was utilized to assess statusbased rejection sensitivity (Chan & Mendoza Denton, 2008). The 11item selfreport questionnaire describes situations in which Asian American students may experience discrimination due to their ethnicity or race. Some examples of the situations include, “One of your classmates who happens to be of the same ethnicity is having difficulty with a class assignment. You offer your help to the person,” and “You are at a party, and you are introduced to a friend of a friend, who proceeds to ask you where you’re from” (Chan & MendozaDenton, 2008). Participants responded to each item twice, first using a sixpoint scale ranging from unconcerned (1) to very concerned (6) to indicate their concern and anxiety regarding possible rejection, then indicating the likelihood of the other person engaging in a rejecting manner due to their race, with responses ranging from very unlikely (1) to very likely (6). Scores for each situation are obtained by multiplying the degree of anxiety with likelihood of rejection, then total scores were obtained. Past research indicates high reliability (α = .83; Chan & MendozaDenton, 2008). Through a technical error, one of the situations was not included. Alpha was .94.
Heart Rate
Heart rate (HR) was measured to assess the physiological response at baseline and after viewing the video. Participants were provided with instructions about how to use their Apple Watch or Fitbit to measure their heart rate before and after viewing the videos to assess any change in heart rate. Apple Watches have the strongest association with the Polar heart rate monitor (r = .59.99), followed by Fitbit (r = .16.99; Dooley et al., 2017). Baseline heart rate was controlled for in the analyses.
Mood
The Positive and Negative Affect Schedule (PANAS) was utilized to assess affect prior to and after viewing the
video (Watson et al., 1998). The questionnaire consists of 10 items measuring positive affect (PA) and 10 items measuring negative affect (NA) with responses rated on a fivepoint scale, ranging from very slightly or not at all (1) to extremely (5). Examples of items used to assess PA were “Interested” and “Excited.” Examples of items used to assess NA were “Guilty” and “Scared.” Alpha in the present study was .92 for PA and .95 for NA during Time 1 (T1) and .93 for PA and .93 for NA during Time 2 (T2). Baseline affect was controlled for in analyses.
Post Video Reaction
The item “On a scale of one to five, with (1) being not at all and (5) being very, rate whether the media clip depicts racial microaggressions” was used for the purpose of analyses.
Materials
Diaphragmatic Breathing
Participants were provided with instructions for diaphragmatic breathing to be done for one minute to obtain an accurate baseline heart rate (see Appendix; Russell et al., 2014).
Video
We sought out examples of microaggressions targeting South Asian characters in popular media. However, based on the underrepresentation of prominent South Asian characters in Western media, options which clearly illustrated microaggressive incidents involving the South Asian character in a lead role or significant side role were quite limited. Following the selection process, a video montage of four scenes from popular TV shows and movies displaying various racial microaggressions directed at SA characters was created (see Table 3 for greater detail). A pilot study with 31 university students indicated that the montage with four scenes that included microaggressions were viewed as significantly more microaggressive than a montage of four scenes from the same popular TV shows and movies that depicted neutral interactions between the characters, t(30) = 3.92, p < .001, 95% CI [4.09; 1.32]. The duration of the video was 3 minutes and 23 seconds with the mean length for each scene being approximately 50 seconds.
Procedure
The study was approved by the university Institutional Review Board prior to data collection. Participants were recruited via Amazon Mechanical Turk (MTurk) and completed screening questions to determine eligibility. Eligible participants were directed to a consent form outlining their rights and the purpose of the study. Participants created a unique ID at the beginning of
the T1 survey and were informed of the potential to participate in the T2 study. During T1, participants answered demographic questions and completed the RSA and the EDS. The average time was 18 minutes and 39 seconds and participants were compensated $1.00. Participants who successfully completed the T1 survey were contacted one week later through MTurk to invite participation in T2. After providing consent they were instructed to sit quietly in a room with minimal distractions to complete a brief diaphragmatic breathing exercise. Participants then measured and reported their baseline heart rate using their smartwatch and completed the PANAS. Next, participants were directed to the YouTube video. They measured and reported their heart rate and completed the PANAS a second time after viewing the video. Participants then responded to the postvideo questions to assess their attitudes towards the video. The average time for T2 was 12 minutes and 26 seconds. Participants were compensated $2.00.
Data Cleaning
After 103 participants were excluded because of failed attention checks or major inconsistencies in their survey responses, data were cleaned and checked for missing items and outliers. In total, 13 additional cases were excluded from analyses (10 were identified as multivariate outliers based on a regression analysis predicting T2 heart rate with all of the predictors; Tababchnick & Fidell, 2007), one provided blood pressure rather than heart rate, and two additional cases were removed because the reported heart rates that were outside of the plausible range (20–220bpm based on Avram et al., 2019). There was no missing data for the variables included in the analyses.
Results
The means, standard deviations, and correlation coefficients for all study variables were considered (see Table 1). There was a large positive relationship between discrimination and rejection sensitivity, with individuals reporting more past racial discrimination tending to have higher levels of rejection sensitivity. Both greater discrimination and rejection sensitivity were associated with perceiving racial microaggressions in the video. Higher rejection sensitivity was significantly related to a greater T2 heart rate and negative affect but not T2 positive affect. The tendency to label the video as microaggressive was significantly related to higher T2 heart rate and negative affect and lower T2 positive affect.
Mediation Analyses
The primary analyses focused on whether the relationship between past discrimination and the emotional
Whayeb,
and physiological responses to the video were serially mediated through rejection sensitivity and the tendency to label the video as racially microaggressive, controlling for the relevant T1 emotional and physiological measures (see Figure 1).
Initial Mediation Analyses
Initially, a series of simple mediation analyses using Hayes’ (2018) PROCESS macro Model 4, based on bootstrapping of 10,000 samples, was conducted to assess the simple mediation relationships between the variables prior to running the full serial mediation model. Specifically, we aimed to assess whether rejection sensitivity mediates the relationship between perceptions of past discrimination and labeling interactions in the videos as microaggressive? Further, we explored whether labeling the interactions
TABLE 1
Note. *** p < .001; ** p < .01, * p < .05.
FIGURE 1
Discrimination to Response: Serial Mediation Model
Note. Hypothesized serial mediation relationship between previous discriminatory experience and T2 emotional/physiological responses to video through rejection sensitivity and labelling as microaggressive, controlling for baseline (T1) emotional/physiological responses.
in the video as microaggressive mediates the relationship between rejection sensitivity and the emotional and physiological reactions (i.e., T2HR, T2PA, T2NA) when controlling for T1 emotional and physiological reactions (i.e., T1HR, T1PA, T1NA)?
The first analysis examined the possible mediating effect of rejection sensitivity on the relationship between perceptions of past discrimination and labeling the video as microaggressive. There was a significant effect
TABLE 2
Indirect Effects of Previous Experiences of Discrimination on Reactions to Video Through Rejection Sensitivity and Labeling Microaggressions
1. INDIRECT EFFECT: DISC→RS→MA→T2HR (T1HR AS COVARIATE)
2. INDIRECT EFFECT: DISC→RS→MA→T2 PA (T1PA AS COVARIATE)
DISC-RS-PA
DISC-RS-MA-PA
3. INDIRECT EFFECT: DISC→RS→MA→T2NA (T1NA AS COVARIATE)
DISC-RS-NA .03 .02 -.01 to .08
DISC-MA-NA
Note. DISC = discrimination. HR = heart rate. PA = positive affect. NA = negative affect. RS = rejection sensitivity. MA = microaggresive. * CI does not contain 0 indicating a significant path
FIGURE 2
Discrimination to Response: Serial Mediation Model
from perceptions of past discrimination to rejection sensitivity (b = 3.40; SE = .32; p < .001), but the effect of discrimination to labeling the video as microaggressive was not significant (b = 0.03; SE = .10; p = .718). The path from rejection sensitivity to labeling the video as microaggressive was significant (b = 0.04; SE = .02; p = .027). The effect of perceptions of past discrimination on labeling the interactions in the video as microaggressive was mediated through rejection sensitivity (b = 0.13; SE = .06; LLCI = .03; ULCI = .25), such that greater perceived past discrimination was related to higher levels of rejection sensitivity which related to a greater likelihood of labeling the interactions as microaggressive.
The next set of analyses examined the possible mediation effect of labeling the interactions in the video as microaggressive on the relationship between rejection sensitivity and T2 emotional and physiological reactions, while controlling for the relevant T1 emotional and physiological reaction. First, we examined the possible mediation of labeling the interactions in the video as microaggressive on the relationship between rejection sensitivity and T2 heart rate, controlling for T1 heart rate (RS→MA→T2HR). There was a significant effect from rejection sensitivity to labeling the interactions in the video as microaggressive ( b = 0.04; SE = .01; p = .003) but no significant effect from rejection sensitivity to T2 heart rate (b = 0.15; SE = .10; p = .113). There was a significant effect from labeling the interactions as microaggressive to T2 heart rate when controlling for T1 heart rate (b = 2.09; SE = .49; p < .001). The effect of rejection sensitivity on T2 heart rate (controlling for T1 heart rate) was mediated by labeling the interactions in the video as microaggressive ( b = 0.09; SE = .04; LLCI = .03; ULCI = .16).
Similar analyses were conducted to understand these relationships for positive and negative affect. For RS→MA→T2PA (controlling for T1PA), there was a significant effect from rejection sensitivity to labeling the interactions in the video as microaggressive (b = 0.04; SE = .01; p = .004) but no significant effect from rejection sensitivity to T2PA (b = 0.01; SE = .01; p = .261). There was a significant effect from labeling the interactions as microaggressive to T2PA when controlling for T1PA (b = 0.14; SE = .04; p < .001). The effect of rejection sensitivity on T2PA (controlling for T1PA) was mediated by labeling the interactions in the video as microaggressive (b = 0.01; SE = .00; LLCI = .01; ULCI = .002).
Note. Serial Mediation: DISC → RS →MA →T2HR controlling for T1HR. Only significant paths indicated in the model; *** p < .001; ** p < .01, * p < .05
For RS→MA→T2NA (controlling for T1NA), there was a significant effect from rejection sensitivity to labeling the interactions in the video as microaggressive (b = 0.04; SE = .01; p = .003) but no significant effect from rejection sensitivity to T2NA (b = 0.01; SE = .01;
Datta, Whayeb, McAuslan, and Hymes | Where Are You REALLY From?
p = .114). There was a significant effect from labeling the interactions as microaggressive to T2NA when controlling for T1NA (b = 0.14; SE = .03; p < .001). The effect of rejection sensitivity on T2NA (controlling for T1NA) was partially mediated by labeling the interactions in the video as microaggressive ( b = 0.01; SE = .00; LLCI = .002; ULCI = .012).
The simple mediation analyses described in this section provided support for each of the hypothesized paths in the model depicted in Figure 1. The next step involved conducting serial mediation analyses.
Serial Mediation Analyses
Next, three serial mediation models were considered using Hayes’ Model 6 in the PROCESS macro, based on bootstrapping of 10,000 samples. For heart rate, the direct effect of perceived past racial discrimination on T2HR (controlling for T1HR) was not significant (b = 0.51; SE = .67; p = .447). However, the total effect of perceived discrimination on T2HR through the indirect effects of rejection sensitivity and labeling the interactions in the video as microaggressive was significant (b = 1.19; SE = .56; p = .036). The effect of discrimination on T2HR is serially mediated through rejection sensitivity and labeling the interactions in the video as microaggressive with more discrimination related to more rejection sensitivity, which related to a greater tendency to label the video as microaggressive, which related to a higher heart rate after viewing the video when controlling for T1 heart rate. The other possible mediating paths were not statistically significant (i.e., DISC→RS→T2HR; DISC→MA→T2HR; see Table 2 and Figure 2).
For positive affect, the direct effect of perceptions of past racial discrimination on T2PA (controlling for T1PA) was not significant (b = 0.03; SE = .05; p = .578) nor was the total effect of discrimination on T2PA through the indirect effects of rejection sensitivity and labeling the interactions in the video as microaggressive (b = 0.03; SE = .04; p = .547). However, there was evidence that the relationship between discrimination and T2PA is serially mediated through rejection sensitivity and labeling the interactions in the video as microaggressive with more discrimination related to more rejection sensitivity, which related to a greater tendency to label the video as microaggressive, which related to less positive affect after viewing the video when controlling for T1 positive affect . Again, the other possible mediating paths were not statistically significant. See Table 2 and Figure 3.
Finally, a similar pattern was found for negative affect. The direct effect of discrimination on T2NA (controlling for T1NA) was not significant (b = 0.01; SE = .04; p = .921) nor was the total effect of discrimination
on T2NA through the indirect effects of rejection sensitivity and labeling the interactions in the video as microaggressive (b = 0.03; SE = .04; p = .547). However, as was the case for positive affect, there was evidence that the relationship between discrimination and T2NA is serially mediated through rejection sensitivity and labeling the interactions in the video as microaggressive with greater discrimination related to higher rejection sensitivity, which related to a greater tendency to label the video as microaggressive, which related to more negative affect when controlling for T1 negative affect. The other possible mediating paths were not statistically significant. See Table 2 and Figure 4.
. Serial Mediation: DISC → RS → MA → T2PA controlling for T1PA. Only significant paths indicated in the model; *** p < .001; ** p < .01, * p < .05
Note
FIGURE 3
Serial Mediation of Discrimination Effects on Positive Affect
Note
FIGURE 4
Serial Mediation of Discrimination Effects on Negative Affect
Discussion
Studies have shown that three in four POC experience discrimination within their daily lives (WongPadoongpatt et al, 2020). Despite research focusing on the link between racial microaggressions and health, the impact of microaggressions on South Asians has received little attention (Ogunyemi et al., 2020). This study addresses this gap by examining the relationship between perceptions of past discrimination, racially based rejection sensitivity, and emotional and physiological responses of South Asian American postsecondary students to viewing scenes from popular media that depicted microaggressions directed at South Asian characters.
Individuals who perceived greater prior discrimination and those with higher levels of rejection sensitivity tended to label the interactions in videos as more microaggressive, which was related to their emotional and physiological responses following the video. There was strong evidence for the serial mediation model presented in Figure 1. Specifically, the effect of perceived discrimination on T2 heart rate (controlling for T1 heart rate) was serially mediated through rejection sensitivity and labeling the interactions in the video as microaggressive. Similarly, the hypothesized serial mediation pathways from perceived past racial discrimination through rejection sensitivity through labeling the video as microaggressive to increased negative affect and decreased positive affect were both significant. The results suggest that perceiving greater past racial discrimination relates to higher levels of statusbased rejection sensitivity which primes individuals to see the interactions in the video as microaggressive, which
TABLE 3
Descriptions of Video Clips Depicting Microaggressive Interactions Targeting South Asian Characters
Show/Movie Name Description URL
The Office Episode: Email Surveillance (Season 2, Episode 9)
Bend it like Beckham
Parks and Recreation
Episode: The Stakeout (Season 2, Episode 2)
Harold and Kumar Escape from Guantanamo Bay
Micheel is upset that the IT specialist, Sadiq, was given an invitation to Jim’s BBQ over him.
While Jazz is at Juliette’s house, Juliette’s mom enters a discussion with Jazz about her name, culture, and arranged marriages
Leslie questions where Tom is from. Not satisfied with the answer, Leslie rephrases her question and asks Tom where he lived prior to North Carolina.
While Harold and Kumar are seated in their plane, a fellow passenger is seen to be looking at Kumar in a suspicious manner.
relates to an increase in heart rate and negative affect and a decrease in positive affect.
This is consistent with research suggesting that experiencing microaggressions can lead to psychological and physiological responses associated with stress, negatively impacting mental and physical health (TorresHarding, 2020). As mentioned earlier, frequent encounters with discrimination can lead individuals to develop hypervigilance, causing them to interpret situations as intentional acts of rejection (Downey & Feldman, 1996; Mellin, 2008; MendozaDenton et al., 2002). In the present study, individuals who reported higher levels of racially based rejection sensitivity were more likely to identify the interactions in the video as microaggressive and this subsequently influenced their emotional and physiological responses to the video.
These findings are also consistent with research that shows experiencing vicarious discrimination, whether inperson or through the media, is related to increased distress and negative health outcomes (e.g., National Academy of Medicine, 2017; Roberts et al., 2017). It is important to consider the content of the videos used in the present study which depicted mild microaggressive incidents targeting South Asian characters from popular media. Many of the young adults who participated in this study were likely familiar with these TV shows and movies. Thus, some may have perceived the microaggressive interactions as entertainment rather than discriminatory. However, for individuals who are primed to see rejection in racial situations (i.e., those high in rejection sensitivity), even the “mild” microaggressive interactions depicted in the video appeared were related to heart rate and affect.
Starting at 0:00
https://www.youtube.com/ watch?v=j67vMy2D9d0
Starting at 0:35
https://www.youtube.com/ watch?v=j67vMy2D9d0
Starting at 1:51
https://www.youtube.com/ watch?v=j67vMy2D9d0
Starting at 2:41
https://www.youtube.com/ watch?v=j67vMy2D9d0
The fact that we found evidence of the hypothesized serial mediation when using relatively mild examples of microaggressions is critically important as these are the types of events that participants likely encounter daily. Individuals who have experienced discrimination are primed for anxious expectations, making it more likely that they identify microaggressions in their daily life—in the media they consume and in their interactions— which was related to increased heart rate and negative affect and decreased positive affect. In the present study, it’s possible that merely viewing these mild microaggressive interactions triggered participants to recall their own past negative encounters and contributed to the emotional and physiological response.
In addition, seeing media depictions of microaggressive or discriminatory acts directed at South Asians, whether in popular TV shows, movies, or in the local news, is common. Studies have shown individuals can experience negative consequences associated with observing discriminatory interactions, such as subtle
microaggressions seen in media (Ozier et al., 2019). Thus, it is very likely that South Asian young adults, particularly those who are primed to anticipate statusbased rejection based on their past experiences with discrimination, may be at risk for regularly experiencing the emotional and physiological responses assessed in this study. These experiences can strain social relationships, compromise the students’ sense of belonging at the educational institution, and result in greater symptoms of depression and anxiety (MendozaDenton et al., 2002; TorresHarding et al., 2020).
Strengths, Limitations, and Future Directions
The small sample size was a limitation. Although a power analysis for serial mediation models indicated our sample was sufficient (Schoemann et al., 2017), this model does not account for covariates and some of our effects were smaller than expected, meaning that the analyses were likely underpowered. Another limitation may be the familiarity participants had with the comedic TV shows and movie clips used in the video montage. This may have reduced the effect of witnessing microaggressions against the South Asian characters. The use of MTurk as a means of recruiting participants was also a potential limitation. However, we considered common concerns often seen with crowdsourcing platforms and utilized solutions suggested by Hauser and colleagues (2019) to help mitigate these concerns. For example, to ensure that participants were attentive, the survey was brief in length, contained multiple attention checks at both time points for the survey, and included open ended questions to assess whether participants were fluent English speakers. Furthermore, participants who completed the survey in less than half of the average time, who missed more than half the attention checks, or had substantial missing or problematic data were not included. Settings within both Qualtrics and MTurk were utilized to restrict the geographic location of participants to the U.S., as well as to prevent multiple submissions and indexing. Finally, we also utilized multivariate outlier detection to remove additional problematic cases. Despite these efforts, it remains possible that some individuals may not have fully participated as intended (e.g., finding a quiet place, following all of the steps or diaphragmatic breathing, or fully watching the video montage).
Despite the limitations, this study has significant strengths. First, this study considered the types of racially charged encounters individuals of South Asian descent may regularly experience. The study is innovative in terms of assessing everyday microaggressions compared to overt experiences of discrimination. Despite growing research, little is known about South
Asians and this study helps to fill that gap. Furthermore, an individual’s identity and selfesteem can be shaped by the media they consume (McCullough et al., 2021). Thus, utilizing clips from popular media to investigate the impact of previous discriminatory experiences on rejection sensitivity and physiological and psychological reaction was a strength. Another innovation was assessing participant’s heart rate online via smartwatches both prior to and after viewing the video.
Future research could replicate the findings of this study in person rather than online and may consider creating original video clips or using noncomedic clips. For example, original media content depicting various microaggressions could be created using artificial intelligence to allow for manipulation of scenarios (microaggressive vs. not) across different ethnic and racial groups (Haut et al., 2021). Based on the heterogeneity of the South Asian population, future research may also consider investigating whether there are any differences among different South Asian cultural groups.
Implications
Findings could influence practices within educational institutions where one may not only experience microaggression directed at themselves but may also experience vicarious discrimination when viewing fellow peers of similar ethnicities experiencing discrimination . Repeated exposure to discrimination can lead to heightened rejection sensitivity which makes it likely that the person sees potential rejection even in ambiguous situations (MendozaDenton et al., 2002). Thus, it may be helpful to implement practices that provide individuals with the appropriate stress coping strategies to adequately assess and respond to discriminatory experiences while ensuring that they don’t become hypervigilant to rejection. Other coping strategies may involve engagement mechanisms, such as social support, problem solving, expression of emotion, which is showcased to mediate the link between microaggressions and mental health (Ogumyemi et al., 2020).
Implementing practices tailored towards raising cultural sensitivity among postsecondary institutions is also critically important. Our results have shown that perceived past discrimination can lead to heightened rejection sensitivity which in turn primes individuals to view microaggressions and sustain emotional and physiological changes. Given the increasing diversity among the student body and that intolerance can lead to a hostile campus where POC are associated with negative stereotypes, it is important that all faculty, students, and staff work towards facilitating a positive campus environment (Ogunyemi et al., 2020). This may include an environment which includes higher
campus diversity and cultural competency to prevent themes such as classroom bias (Ogunyemi et al., 2020). This can be achieved by implementing multicultural training to educate members on how to identify and respond to racial microaggressions on campus along with conducting cultural sensitivity workshops during student orientation (Houshmand et al., 2014). Provided that individual factors, such as rejection sensitivity, are observed to influence an individual’s response to a racially ambiguous situation, it may be beneficial to implement educational workshops related to the concept of rejection sensitivity and discuss how it may influence emotional and cognitive responses (Clark et al., 1999).
Conclusion
Overall, the present study contributes to the literature regarding experiences with microaggressions by highlighting the potential impact of perceived racial discrimination and microaggressions on the emotional and physiological wellbeing of South Asian American postsecondary students. Our findings showcase that individuals who perceive greater past discrimination are more likely to develop heightened rejection sensitivity, which in turn primes them to identify racial microaggressions in their environment—including vicariously through the media they consume—which we believe relates to increased heart rate, heightened negative affect, and decreased positive affect.
The fact that these findings were observed in response to relatively mild microaggressions depicted in popular media suggests that the cumulative impact of these experiences in real life interactions may be even more detrimental. Given that microaggressions are commonplace in educational settings, media representation, and workplaces, these findings have crucial implications for mental health interventions, institutional policies, and media representation.
Future research should include longitudinal studies that can explore the longterm consequences of chronic exposure to microaggressions. It should also include a larger sample size and investigate cultural differences among other ethnic groups, ideally considering how witnessing microaggressions directed at someone from your culture compares to witnessing microaggressions directed at someone from another ethnic group. Additionally, curating original videos potentially through the use of AI demonstrating microaggressions of varying distress levels rather than those with a comedic undertone may be beneficial.
References
Armstead, C. A., Lawler, K. A., Gorden, G., Cross, J., & Gibbons, J. (1989). Relationship of racial stressors to blood pressure responses and anger expression in Black college students. Health Psychology, 8(5), 541–556. https://doi.org/10.1037/0278-6133.8.5.541
Avram, R., Tison, G. H., Aschbacher, K., Kuhar, P., Vittinghoff, E., Butzner, M., Runge, R., Wu, N., Pletcher, M. J., Marcus, G. M., & Olgin, J.. (2019). Real world heart rate norms in the health eHeart study. npj Digital Medicine, 2(58) https://doi.org/10.1038/s41746-019-0134-9
Bakhtiari, F., Benner, A. D., & Plunkett, S. W. (2018). Life quality of university students from immigrant families in the United States. Family and Consumer Sciences Research Journal, 46(4), 331–346. https://doi.org/10.1111/fcsr.12260
Budiman, A., & Ruiz, N. (2021, April 9). Asian Americans are the fastest-growing racial or ethnic group in the U.S. Pew Research Center. https://www.pewresearch.org/short-reads/2021/04/09/asian-americansare-the-fastest-growing-racial-or-ethnic-group-in-the-u-s/
Chan, W., & Mendoza-Denton, R. (2008). Status-based rejection sensitivity among Asian Americans: Implications for psychological distress. Journal of Personality, 76(5), 1317–1346. https://doi.org/10.1111/j.1467-6494.2008.00522.x
Clark, R., Anderson, N. B., Clark, V.R., & Williams, D. R. (1999). Racism as a stressor for African Americans: A biopsychosocial model. American Psychologist, 54(10), 805–816. https://doi.org/10.1037/0003-066X.54.10.805
Dooley, E. E., Golaszewski, N. M., & Bartholomew, J. B. (2017). Estimating accuracy at exercise intensities: A comparative study of self-monitoring heart rate and physicalactivity wearable devices. JMIR mHealth and uHealth, 5(3), 34. https://doi.org/10.2196/mhealth.7043
Downey, G., & Feldman, S. I. (1996). Implications of rejection sensitivity for intimate relationships. Journal of Personality and Social Psychology, 70(6), 1327–1343. https://doi.org/10.1037/0022-3514.70.6.1327
ElTohamy, A., Hyun, S., Rastogi, R., Finneas Wong, G. T., Kim, G. S., Chae, D. H., Hahm, H., & Liu, C. H. (2024). Effect of vicarious discrimination on racebased stress symptoms among Asian American young adults during the COVID-19 pandemic. Psychological Trauma: Theory, Research, Practice, and Policy, 16(2), 217–224. https://doi.org/10.1037/tra0001480
Farber, R., Wedell, E., Herchenroeder, L., Dickter, C. L., Pearson, M. R., Bravo, A. (2021). Microaggressions and psychological health among college students: A moderated mediation model of rumination and social structure beliefs. Journal of Racial and Ethnic Health Disparities, 8, 245–255. https://doi.org/10.1007/s40615-020-00778-8
Hayes, A. F. (2018). Introduction to mediation, moderation, and conditional process analysis: A regression-based approach (2nd ed.). The Guilford Press. Hauser, D., Paolacci, G., & Chandler, J. (2019). Common concerns with MTurk as a participant pool: Evidence and solutions. In F. R. Kardes, P. M. Herr, & N. Schwarz (Eds.), Handbook of research methods in consumer psychology (pp. 319–337). Routledge/Taylor & Francis Group. https://doi.org/10.4324/9781351137713-17
Haut, K., Wohn, C., Antony, V., Goldfarb, A., Welsh, M., Sumanthiran, D., Jang, J., Ali, R., Hoque, E. (2021). Could you become more credible by being White? Assessing impact of race on credibility with deepfakes. https://doi.org/10.48550/arXiv.2102.08054
Henson, J. M., Derlega, V. J., Pearson, M. R., Ferrer, R., & Holmes, K. (2013). African American student’s responses to racial discrimination: How race-based rejection sensitivity and social constraints are related to psychological reactions. Journal of Social and Clinical Psychology, 32(5), 504–529. https://doi.org/10.1521/jscp.2013.32.5.504
Hoggard, L. S., Hill, L. K., Gray, D. L., & Sellers, R. M. (2015). Capturing the cardiac effects of racial discrimination: Do the effects "keep going"? International Journal of Psychophysiology, 97(2), 163–170. https://doi.org/10.1016/j.ijpsycho.2015.04.015
Houshmand, S., Spanierman, L. B., & Tafarodi, R. W. (2014). Excluded and avoided: Racialmicroaggressions targeting Asian international students in Canada. Cultural Diversity & Ethnic Minority Psychology, 20(3), 377–388. https://doi.org/10.1037/a0035404
Hwang, W., & Goto, S. (2009). The impact of perceived racial discrimination on the mental health of Asian American and Latino college students. Asian American Journal of Psychology, S(1), 15–28. https://doi.org/10.1037/1948-1985.S.1.15
Kaduvettoor-Davidson, A., & Inman, A. G. (2013). South Asian Americans: Perceived discrimination, stress, and well-being. Asian American Journal of Psychology, 4(3), 155–165. https://doi.org/10.1037/a0030634
Keels, M., Durkee, M., & Hope, E. (2017). The psychological and academic costs of school based racial and ethnic microaggressions. American Educational Research Journal, 54(6), 1316–1344. https://doi.org/10.3102/0002831217722120
WINTER
Kershaw, K. N., Lewis, T. T., Roux, A. V. D., Jenny, N. S., Liu, K., Penedo, R. J., & Carnethon, M. R. (2016). Self-reported experiences of discrimination and inflammation among men and women: The multi-ethnic study of atherosclerosis. Health Psychology, 35(4), 343–350. https://doi.org/10.1037/hea0000331
Kramer, E. M. (Ed.). (2003). The emerging monoculture: Assimilation and the “model minority.” Praeger.
Lui, P. P. (2020). Racial microaggression, overt discrimination, and distress: (In)direct associations with psychological adjustment. The Counseling Psychologist, 48(4), 551–582. https://doi.org/10.1177/0011000020901714
Lui, P. P., & Quezada, L. (2019). Associations between microaggression and adjustment outcomes: A meta-analytic and narrative review. Psychological Bulletin, 145(1), 45–78. https://doi.org/10.1037/bul0000172
Mastro, D. E., Behm-Morawitz, E., Kopacz, M. A. (2008). Exposure to television portrayals of Latinos: The implications of aversive racism and social identity theory. Human Communication Research, 34(1), 1–27. https://doi.org/10.1111/j.1468-2958.2007.00311.x
McCullough, K. M., Wong, Y. J., & Deng, K. (2021). Exploring the connections between watching Asian American YouTubers, racial identity, and selfesteem. Asian AmericanJournal of Psychology, 12(1), 41–51. https://doi.org/10.1037/aap0000218
Mellin, E. A. (2008). Rejection sensitivity and college student depression: Findings andimplications for counseling. Journal of College Counseling, 11(1), 32–41.https://doi.org/10.1002/j.2161-1882.2008.tb00022.x
Mendoza-Denton, R., Downey, G., Purdie, V. J., Davis, A., & Pietrzak, J. (2002). Sensitivity to status-based rejection: Implications for African American students› college experience. Journal of Personality and Social Psychology, 83(4), 896–918. https://doi.org/10.1037/0022-3514.83.4.896
National Academy of Medicine. (2017). Perspectives on health equity and social determinants of health. The National Academies Press. https://doi.org/10.17226/27117
Ogunyemi, D., Clare, C., Astudillo, Y. M., Marseille, M., Manu, E., & Kim, S. (2020). Microaggressions in the learning environment: A systematic review. Journal of Diversity in Higher Education 13(2), 97–119. https://doi.org/10.1037/dhe0000107
Ozier, E. M., Taylor, V. J., & Murphy, M. C. (2019). The cognitive effects of experiencing and observing subtle racial discrimination. Journal of Social Issues, 75(4), 1087–1115. https://doi.org/10.1111/josi.12349
Poolokasingham, G., Spanierman, L. B., Kleiman, S., & Houshmand, S. (2014). "Fresh off the boat?" Racial microaggressions that target South Asian Canadian students. Journal of Diversity in Higher Education, 7(3), 194–210. https://doi.org/10.1037/a0037285
Roberts, L. B., Maduro, R. S., Derlega, V. J., Peterkin, A. L., Hacker, D. S., & Ellis, K. T. (2017). Race-based rejection sensitivity and racial identity predict African American students' reactions to the fatal shooting of other African Americans: Personal threat and identification with shooting victims as mediators. Journal of Loss & Trauma, 22(6), 472–486. https://doi.org/10.1080/15325024.2017.1328242
Robinson-Perez, A., Marzell, M., & Han, W. (2020). Racial microaggressions and psychological distress among undergraduate college students of color: Implications for social work practice. Clinical Social Work Journal, 48(2), 343–350. https://doi.org/10.1007/s10615-019-00711-5
Ruiz, N. G., Im, C., Tian, Z. (2023, November 30). Discrimination experiences shape most Asian Americans’ lives. Pew Research Center. https://www.pewresearch.org/?p=109265
Russell, M. E. B., Hoffman, B., Stromber, S., & Carlson, C. R. (2014). Use of controlled diaphragmatic breathing for the management of motion sickness in a virtual realityenvironment. Applied Psychophysiology and Biofeedback, 39(3–4), 269–277. https://doi.org/10.1007/s10484-014-9265-6
Schoemann, A. M., Boulton, A. J., & Short, S. D. (2017). Determining power and sample size for simple and complex mediation models. Social Psychological and Personality Science, 8(4), 379–386. https://doi.org/10.1177/1948550617715068
Sharma, N., Shaligram, D., & Yoon, G. H. (2020). Engaging South Asian youth and families: A clinical review. International Journal of Social Psychiatry 66(6), 584–592. https://doi.org/10.1177/0020764020922881
South Asian Americans Leading Together (SAALT). (2019). Demographic snapshot of South Asians in the United States https://saalt.org/wp-content/ uploads/2019/04/SAALT-Demographic-Snapshot-2019.pdf
Solórzano, D., Ceja, M., & Yosso, T. (2000). Critical race theory, racial microaggressions, and campus racial climate: The experiences of African American college students. Journal of Negro Education, 69(1/2), 60–73. https://www.jstor.org/stable/2696265
Stein, G. L., Castro-Schilo, L., Cavanaugh, A. M., Mejia, Y., Christophe, N. K., & Robins, R. (2019). When discrimination hurts: The longitudinal impact of increases in peer discrimination on anxiety and depressive symptoms in Mexican-origin youth. Journal of Youth and Adolescence, 48(5), 864–875. https://doi.org/10.1007/s10964-019-01012-3
Sue, D. W., Capodilupo, C. M., Torino, G. C., Bucceri, J. M., Holder, A. M. B., Nadal, K. L., & Esquilin, M. (2007). Racial microaggressions in everyday life: Implications for clinical practice. American Psychologist, 62(4), 271–286. https://doi.org/10.1037/0003-066X.62.4.271
Sue, D. W. (2010). Microaggressions in everyday life: Race, gender, and sexual orientation. John Wiley & Sons, Inc.
Tao, X., & Fisher, C. (2022). Exposure to social media racial discrimination and mental health among adolescents of color. Journal of Youth and Adolescence, 51(1), 30–44. https://doi.org/10.1007/s10964-021-01514-z
The United States Department of Justice. (2024). Hate Crime Statistics, 2023: Victims. https://www.justice.gov/crs/news/2023-hate-crime-statistics
Tineo, P., Lowe, S. R., Reyes-Portillo, J. A., & Fuentes, M. A. (2021). Impact of perceived discrimination on depression and anxiety among Muslim college students: The role of acculturative stress, religious support, and Muslim identity. American Journal of Orthopsychiatry, 91(4), 454–463. https://doi.org/10.1037/ort0000545
Torres-Harding, S., Torres, L., & Yeo, E. (2020). Depression and perceived stress as mediators between racial microaggressions and somatic symptoms in college students of color. American Journal of Orthopsychiatry, 90(1), 125–135. https://doi.org/10.1037/ort0000408
Valkenburg, P. M., Peter, J., & Walther, J. B. (2016). Media effects: Theory and research. Annual Review of Psychology, 67(1), 315–338. https://doi.org/10.1146/annurev-psych-122414-033608
Verdugo, J. L., Kong, Z., Liyanage, D. S., Keum, B. T., Moody, M. D., Oh, H. Y. (2024). Associations between vicarious discrimination and mental health among young adult college students: Findings from the 2020–2021 Healthy Minds Study. Journal of Affective Disorders, 361, 760–767. https://doi.org/10.1016/j.jad.2024.06.082
Washington, G., Mance, G., Aryal, S., Ngueajio, M., Salaam, C., & Alim, C. (2021). ABL-MICRO: Opportunities for affective AI built using a multimodal microaggression dataset. AffCon@AAAI, 2897. https://ceur-ws.org/Vol-2897/AffconAAAI-21_paper3.pdf
Watson, D., Clark, L. A., & Tellegen, A. (1988). Development and validation of brief measures of positive and negative affect: The PANAS scales. Journal of Personality and Social Psychology, 54(6), 1063–1070. https://doi.org/10.1037/0022-3514.54.6.1063
Williams, Yu, Y., Jackson, J. S., & Anderson, N.B. (1997). Racial differences in physical and mental Health: Socioeconomic status, stress, and discrimination. Journal of Health Psychology, 2, 335–351. https://doi.org/10.1177/135910539700200305
Wong-Padoongpatt, G., Zane, N., Okazaki, S., & Saw, A. (2020). Individual variations in stress response to racial microaggressions among Asian Americans. Asian American Journal of Psychology 11(3), 126–137. https://doi.org/10.1037/aap00001
Yi, J., La, R., Lee, B. A., & Saw, A. (2023). Internalization of the model minority myth and sociodemographic factors shaping Asians/Asian Americans’ experiences of discrimination during COVID‐19. American Journal of Community Psychology, 71(1–2), 123–135. https://doi.org/10.1002/ajcp.12635
Data collection were sponsored by the UMDearborn Experience+ Office. Portions of these findings were presented as a poster at the 2023 American Psychological Association Convention, Washington, DC, United States. We have no conflicts of interest to disclose.
Correspondence concerning this article should be addressed to Megha Datta. Email: meghad@umich.edu
APPENDIX
Instructions for Diaphragmatic Breathing
Participants were provided with the following instructions to partake in diaphragmatic breathing for one minute to obtain a baseline heartrate. The instructions were obtained from a study conducted by Russell and colleagues (2014) pertaining to diaphragmatic breathing:
1. Please find a comfortable position with your head centered and supported. Relax your shoulders and sit with your knees and feet apart.
2. Close your eyes, smooth your forehead, and relax your mouth to ensure you are not clenching your jaw.
3. Place your right hand on top of your stomach, right below the ribcage. Release air from your body by exhaling in a complete and relaxed manner without controlling or forcing air from your body.
4. When you are ready, take your next breath. Ensure your stomach is gently rising as you inhale, you may feel it pushing against your hand. Count to three while you breath in.
5. Release your muscles and let your stomach fall as you exhale. Count to three as you release your breath in a relaxed manner.
Repeat the cycle for one minute and record the baseline heart as displayed on your Apple Watch or Fitbit.
Educating psychologists since 1969
For
over 50 years, we have been
preparing the next generation of mental health professionals.
Founded as the first freestanding school of psychology, our California School of Professional Psychology (CSPP) enjoys APA, CACREP, CSWE, and COAMFTE accreditations, and provides students small cohorts, exceptional support, a wide network of alumni in the field, and a curriculum rooted in a history of notable faculty including Abraham Maslow, Viktor Frankl, Igor Ansoff, Jay Haley, and many others.
Clinical Psychology general application deadline is December 15. Get started at alliant.edu
Our programs
• Clinical Psychology (PhD and PsyD)
• Clinical Psychopharmacology (MS)*
• Clinical Counseling (MA)
• Marital & Family Therapy (MA and PhD)
• Industrial & Organizational Psychology (PhD)*
• Organizational Psychology (MA)*
• Social Work (MSW)* *onlineprogramsonly
Our locations
Publish Your Research in Psi Chi Journal
Undergraduate, graduate, and faculty submissions are welcome year round. Only one author (either first author or coauthor) is required to be a Psi Chi member. All submissions are free. Reasons to submit include
• a unique, doctorallevel, peerreview process
• indexing in PsycInfo, EBSCO, Web of Science's Emerging Sources Citation Index, and Crossref databases
• free access of all articles at psichi.org
• our efficient online submissions portal
View Submission Guidelines and submit your research at https://www.psichi.org/?page=JN_Submissions
Become a Journal Reviewer
Doctorallevel faculty in psychology and related fields who are passionate about educating others on conducting and reporting quality empirical research are invited become reviewers for Psi Chi Journal. Our editorial team is uniquely dedicated to mentorship and promoting professional development of our authors—Please join us!
To become a reviewer, visit https://www.psichi.org/page/JN_BecomeAReviewer
Resources for Student Research
Looking for solid examples of student manuscripts and educational editorials about conducting psychological research? Download as many free articles to share in your classrooms as you would like.
Search past issues, or articles by subject area or author at https://www.psichi.org/journal_past
Learn About Psi Chi
Psi Chi is the International Honor Society in Psychology. Membership is primarily open to undergraduates, graduate students, transfer students, fulltime and parttime faculty members, and alumni.
See membership benefits and a link to apply at https://www.psichi.org/page/member_benefits
Register an account: https://pcj.msubmit.net/cgi-bin/main.plex