The Reserve at Lake Keowee Market Report
 Presented By David Vandeputte
2023
March 31,
The Reserve at Lake Keowee Market Report March 31, 2023
Reserve at Lake Keowee Real
Your
Estate Specialist

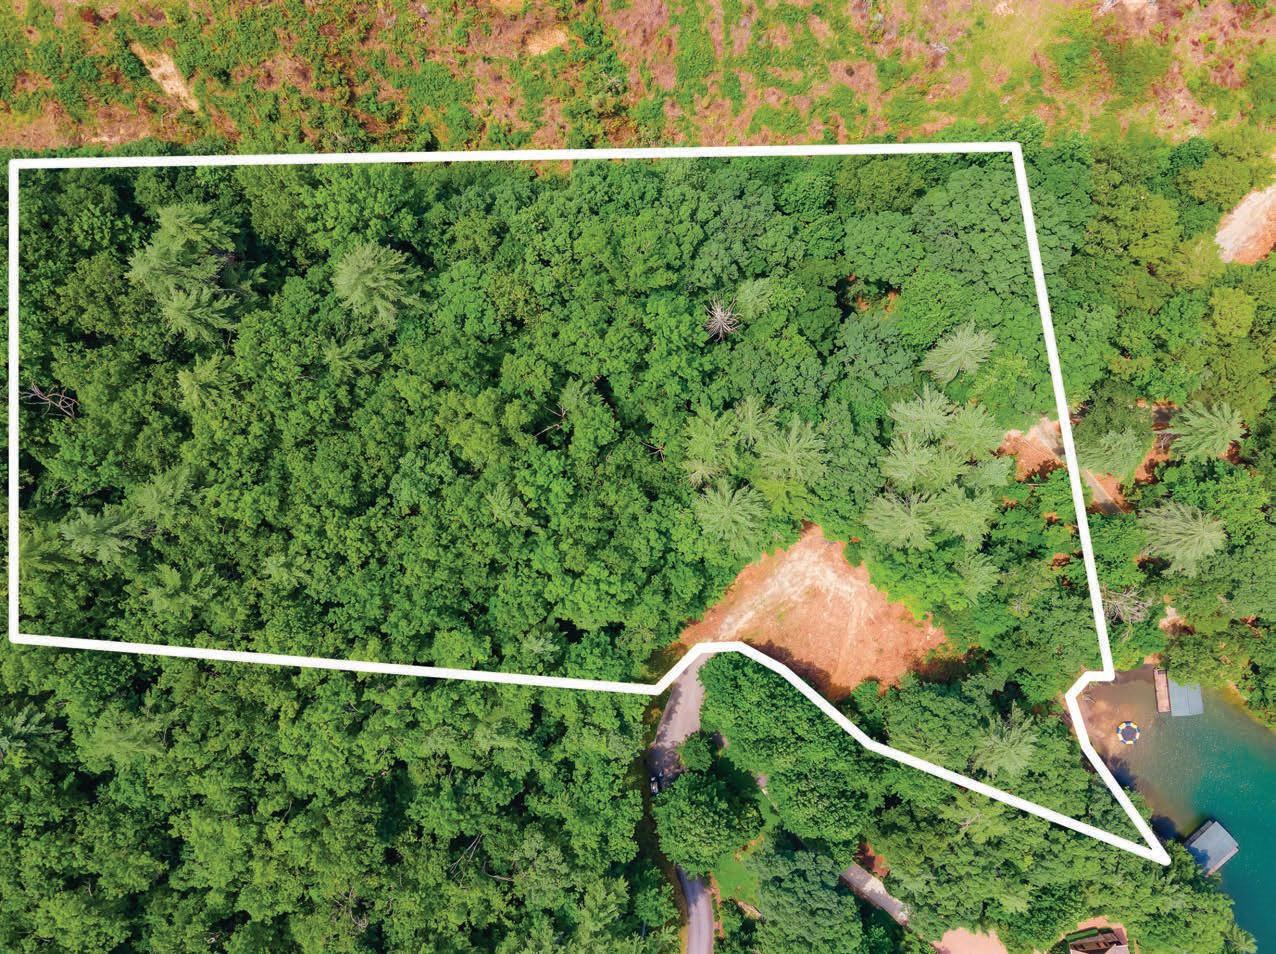


Magnificent Sanctuary with Unlimited Opportunities E-18 Lake View Court Cliffs Falls North $359,676 David Vandeputte Prominent Keowee Properties Email: David@JHA-SothebysRealty.com Mobile: 864.508.1717 prominentkeoweeproperties.com Joan Herlong and Associates Sotheby’s International Realty 148 Thomas Greene Blvd., Clemson, SC 29631 1 McDaniel Greene, Greenville, SC 29601
Happy Spring!
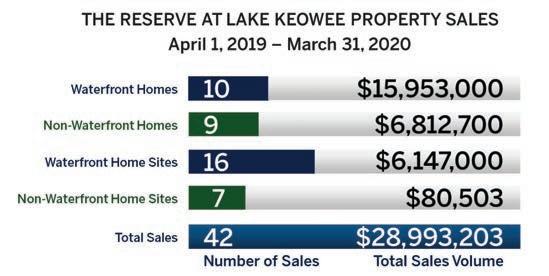
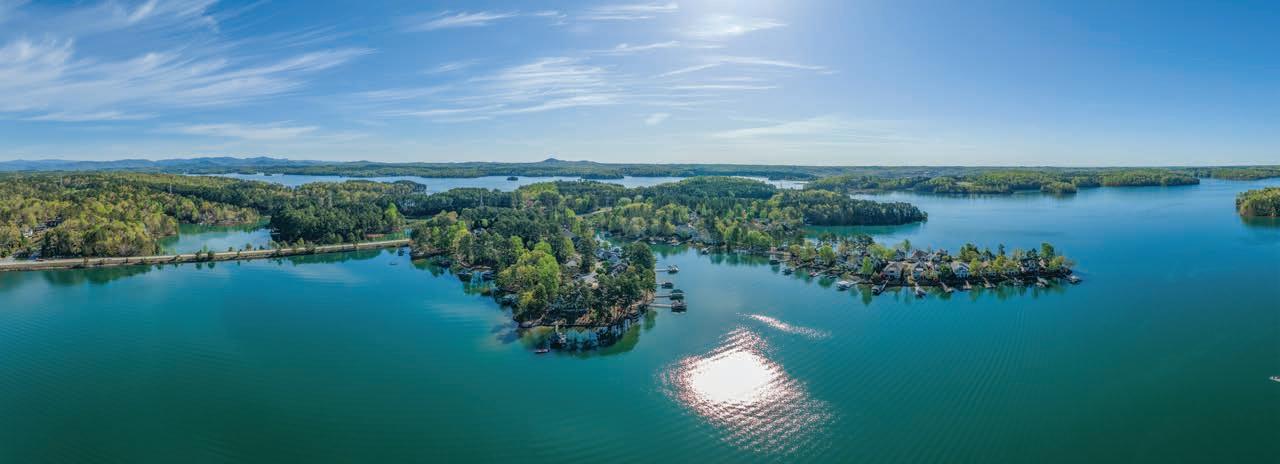
I am sure this is no surprise to those of us who live and work in this area that Lake Keowee and Lake Jocassee were recently named by Southern Living Magazine as among “The 10 Best Lakes in South Carolina for a Sunny Escape.” The real estate market in our area is a direct reflection of the popularity of our lake region. Inventory in the Reserve remains very low with just 3 waterfront homes and 7 non-waterfront homes currently listed for sale. What is significant, however, is that waterfront homes in the Reserve have median sale prices that are 133% higher than in 2020 when the pandemic first began. Non-waterfront home sale prices are up 107% in the same period. Home prices rose significantly in these past three years, and are holding steady as we move into the Spring.
As Sotheby International Realty’s Chief Marketing Officer A. Bradley Nelson wrote in the 2023 Luxury Outlook, “We believe the reasons for prices staying strong are multifold—first, the world’s seen a surge of wealth creation in recent years and the affluent still have more money to spend; second, many luxury purchases are made in cash, so the high-end sector remains somewhat insulated from interest-rate fluctuations. Finally, there’s a lifestyle change resulting from Covid-19 that we believe is here to stay: people are spending more of their time at home and putting more of an emphasis on their home lives, even as the world has opened up. What that means is luxury homeowners can rationalize the expenses of owning
multiple properties since they are spending more time in them and are therefore less likely to put them up for sale. As such, inventory continues to be low coupled with an under supply of new construction.”
The Institute of Luxury Home Marketing Report concurs with the anticipation of a strong seller’s market saying, “This may only be the start of a possible trend, but if it continues in this direction, buyer demand, which has remained hesitant for the last few months, could return as we enter the spring market.”
I see several trends occurring in the real estate market at the Reserve as we move into the Spring and the remainder of the year:
• Waterfront and non-waterfront home inventory may increase slightly as homeowners consider liquidating their investment.
• Median and average home sale prices have approximately doubled since 2020, expect much more modest increases.
• Long term prospects for the community is better off given the new ownership group
• Buyers will continue to invest in the Reserve for the lifestyle, creating generational family memories and long-term gains.
Many investors have purchased homes and property in the Reserve, and will realize a significant return on their investment if they choose to sell. If you would like to discuss the real estate market in The Reserve in relation to your priorities, please contact me.
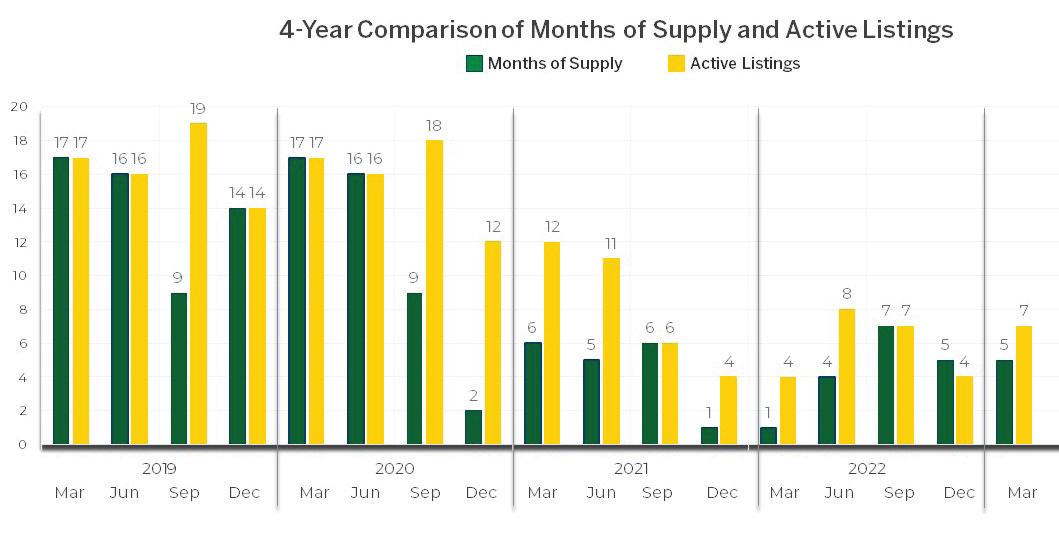
WATERFRONT HOMES
1 - March 31


2020202120222023 MEDIANSALESPRICE $1.40m$1.71m$2.65m +22%+55% $3.26m +23% 2020202120222023 MEDIANSALESTOLISTPRICERATIO 93%98%96% +5%-2% 97% +1% 2020202120222023 MEDIANPRICEPERSQUAREFOOT $268$400$522 +49%+31% $549 +5% 2020202120222023 MEDIANDAYSONTHEMARKET 31213351 -57%-62% 83 +63% April
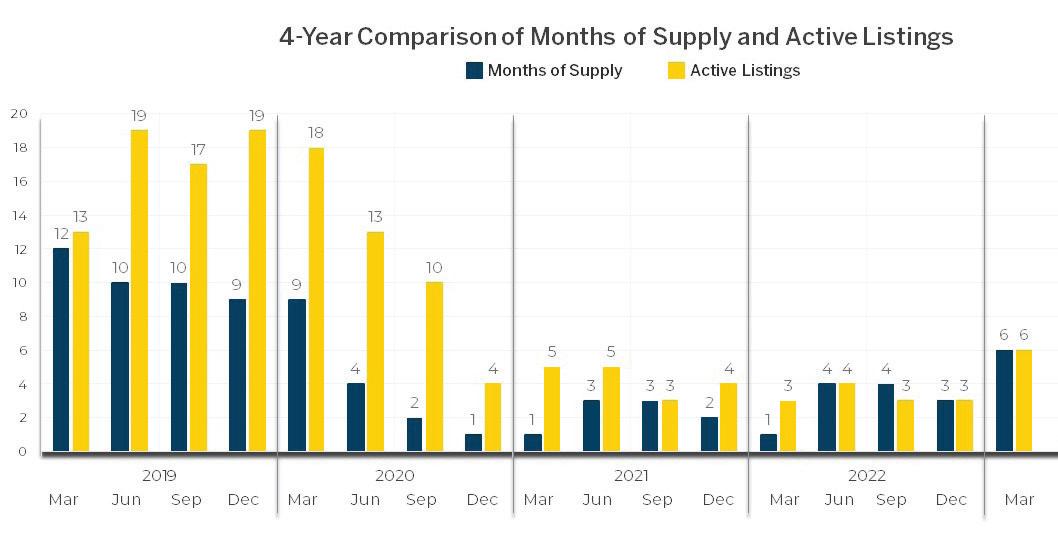
2020202120222023 AVERAGESALESPRICE $1.60m$1.86m$2.98m +16+60% % $3.20m +8% 2020202120222023 AVERAGESALESTOLISTPRICERATIO 93%98%96% +5%-2% 95% -1% 2020202120222023 AVERAGEPRICEPERSQUAREFOOT $299$406$526 +36%+30% $566 +8% 2020202120222023 AVERAGEDAYSONTHEMARKET 28917059 -41%-65% 95 +61% Price BandInventory Sales PendingMonths of Supply >$4.5m 01 00/Seller’s $4.25m-$4.5m1 1 012/Buyer’s $4.0m -$4.25m000 –$3.75m-$4.0m100 –$3.5m-$3.75m000 –$3.25m-$3.5m02 20/Seller’s $3.0m-$3.25m01 00/Seller’s $2.75m-$3.0m100 –$2.5m-$2.75m000 –$2.25m-$2.5m000 –$2.0m-$2.25m000 –$1.75m-2.0m0200/Seller’s <$1.75m 01 10/Seller’s Total 38 33/Seller’s April 1, 2022 - March 31, 2023 The months of supply calculates how many months it would take to sell a property given the current sales pace, inventory level and no new properties are offered for sale. The industry standard is that 6 months of supply is a balanced/neutral market, 5 months or less is a seller’s market and 7 months or more a buyer’s market.
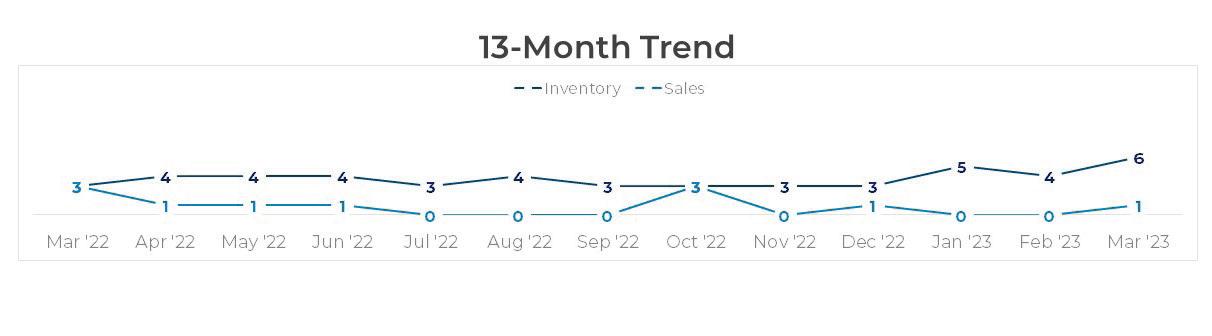

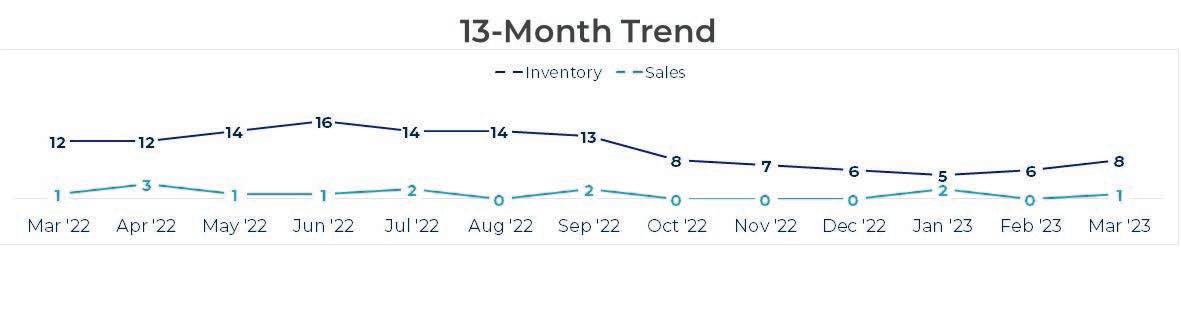
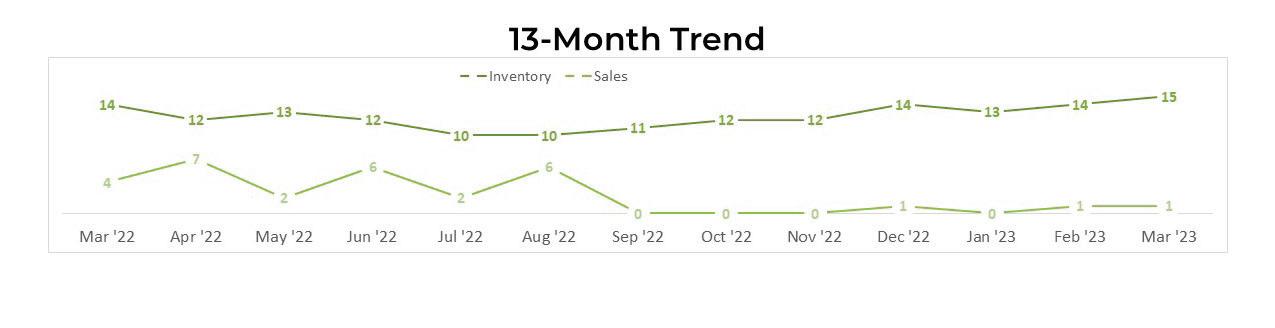
13-Month Trend Median Sales Price $2.70m $5.75m $3.20m$3.46m000$3.33m0$1.95m00$1.71m 13-Month Trend Average Sales Price $2.95m $5.75m $3.20m$3.46m000$3.20m0$1.95m00$1.71m2023
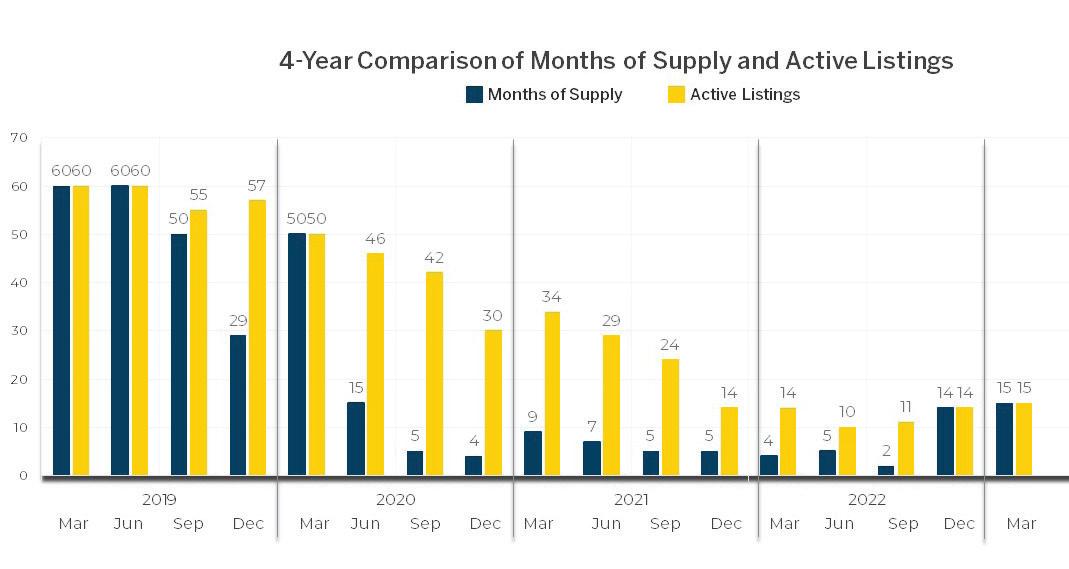
NON-WATERFRONT HOMES
April 1 - March 31- December 31
April 1, 2022 - March 31, 2023


2020202120222023 MEDIANSALESPRICE $809k$845k$1.15m +4%+36% $1.68m +46% 2020202120222023 MEDIANSALETOLISTPRICERATIO 92%97%94% +5%-3% 96% +2% 2020202120222023 MEDIANPRICEPERSQUAREFOOT $160$237$293 +48%+24% $388 +32% 2020202120222023 MEDIANDAYSONTHEMARKET 141122115 -13%-6% 71 -38%
2020202120222023 AVERAGESALESPRICE $757k$877k$1.15m +16%+31% $1.49m +30% 2020202120222023 AVERAGESALESTOLISTPRICERATIO 93%96%95% +3%-1% 96% +1% 2020202120222023 AVERAGEPRICEPERSQUAREFOOT $172$256$308 +49%+20% $389 +26% 2020202120222023 AVERAGEDAYSONTHEMARKET 200165128 -18%-22% 83 -35% Price BandInventory Sales PendingMonths of Supply >$1.9m 32 18/Buyer’s $1.8m-$1.9m0200/Seller’s $1.7m-$1.8m22012/Buyer’s $1.6m -$1.7m21 024/Buyer’s $1.5m-$1.6m01 00/Seller’s $1.4m-$1.5m000 –$1.3m-$1.4m000 –$1.2m-$1.3m000 –$1.1m-$1.2m01 00/Seller’s $1.0m-$1.1m000 –$900k-$1.0m01 00/Seller’s $800k-$900k01 00/Seller’s <800k 01 00/Seller’s Total 71207/Buyer’s
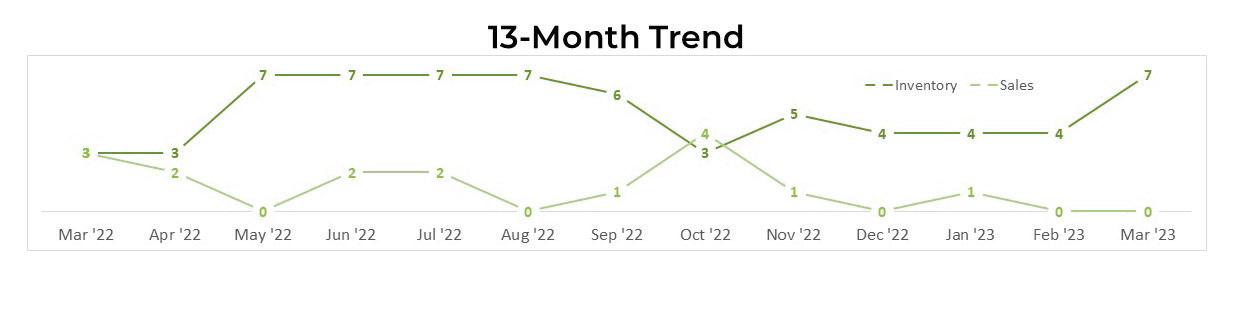

13-Month Trend Median Sales Price $1.20m$1.92m0$1.38m$1.80m0$1.75m$1.63m$950k0$825k00 13-Month Trend Average Sales Price $1.34m$1.92m0$1.38k$1.80m0$1.75m$1.49m$950k0$825k00 2023
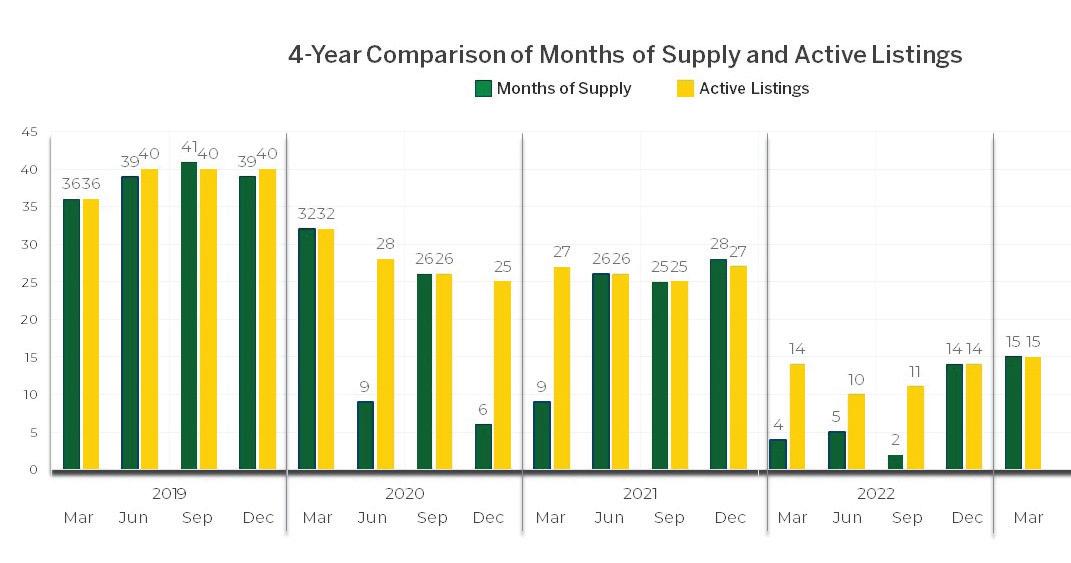
WATERFRONT HOME SITES
April 1, 2022 - March 31, 2022


The months of supply calculates how many months it would take to sell a property given the current sales pace, inventory level and no new properties are offered for sale. The industry standard is that 6 months of supply is a balanced/neutral market, 5 months or less is a seller’s market and 7 months or more a buyer’s market.


2020202120222023 MEDIANSALESPRICE $324K$517K$500K +60%-3% $475K -5% 2020202120222023 MEDIANDAYSONTHEMARKET 160154154 -4%0% 283 +84% 2020202120222023 MEDIANSALETOLISTPRICERATIO 90%96%96% +6%0% 96% 0% April 1 - March 31 2020202120222022 AVERAGESALESPRICE $384k$505k$555k +31%+10% $475k -15% 2020202120222023 AVERAGEDAYSONTHEMARKET 194184207 -5%+13% 265 +28% 2019202020212022 AVERAGESALESTOLISTPRICERATIO 89%94%94% +6%0% 95% +1%
Price BandInventory Sales PendingMonths of Supply >$900k 000 –$800k-$900k100 –$700k-$800k02 10/Seller’s $600k-$700k01 00/Seller’s $500k-$600k33012/Buyer’s $400k-$500k1 1 012/Buyer’s $300k-$400k12 14/Seller’s $200k-$300k03 10/Seller’s <$200k 00 10/Seller’s Total 61245/Seller’s

13-Month Trend Median Sales Price $1.1m $265k $390k$569k$490k0$562k000$725k$0$300k 13-Month Trend Average Sales Price $1.1m$294k$390k$569k$490k0$562k000$725k0$300k 2023
NON-WATERFRONT HOME SITES
April 1 - March 31
April 1, 2022 - March 31, 2022
The months of supply calculates how many months it would take to sell a property given the current sales pace, inventory level and no new properties are offered for sale. The industry standard is that 6 months of supply is a balanced/neutral market, 5 months or less is a seller’s market and 7 months or more a buyer’s market.
2020202120222023 MEDIANSALESPRICE $2K$15K$28K +897%+84% $15K -45% 2020202120222023 MEDIANDAYSONTHEMARKET 161150179 -7%+19% 143 -20% 2010202120222023 MEDIANSALETOLISTPRICERATIO 100%100%100% 0%0% 90% -10%
2020202120222023 AVERAGESALESPRICE $12k$38k$74k +230%+94% $64k -14% 2020202120222023 AVERAGEDAYSONTHEMARKET 213253261 +19%+3% 218 -16% 2020202120222023 AVERAGESALESTOLISTPRICERATIO 73%90%96% +23%+7% 76% -21%
Price BandInventory Sales PendingMonths of Supply >$400k 000 –$350k-$400k100 –$300k-$350k1 1 012/Buyer’s $250k-$300k200 –$200k-$250k1206/Balanced $150k-$200k22012/Buyer’s $100k-$150k1 1 012/Buyer’s $50k-$100k22012/Buyer’s <$50k 41803/Seller’s Total 14 2606/Balanced
13-Month Trend Median Sales Price $72k $8k$13k$16k$283k$34k000$12k0$135k$99k 13-Month Trend Average Sales Price $106k$9k$13k $76k $283k$53k000$12k0$135k$99k 2023
• We leverage our brand’s heritage and sophistication.
• Connect with affluent consumers who share our vision.

• Go above and beyond to meet clients’ needs.
• Offer the only true, worldwide luxury real estate network.

• Partner with leading media to obtain the best exposure.
• Provide unparalleled reach to qualified buyers and sellers.
• Showcase every listing with the highest quality production.

• Utilize the latest technology for even greater impact.

• Deliver a singular client experience.

Doing more is our distinction.
