
TheReserveatLakeKeowee MarketReport September30,2023 TheReserveatLakeKeowee MarketReport September30,2023 PresentedBy DavidVandeputte YourReserveatLakeKeoweeRealEstateSpecialist PhotobyLaurieMetzger

DavidVandeputte ProminentKeoweeProperties Email:David@JHA-SothebysRealty.com Mobile:864.508.1717 prominentkeoweeproperties.com JoanHerlongandAssociatesSotheby’sInternationalRealty 148ThomasGreeneBlvd.,Clemson,SC29631 1McDanielGreene,Greenville,SC29601 Extraordinary Properties My Buyer’s Purchased
IhopeyouareenjoyingFall.Itismy favoritetimeoftheyear.Extraordinary weatherandtemperatureshereare perfectforalloutdooractivities.
AJunenewsstoryinthe PostandCourier recordstheimpactofthestrong pandemic-drivenlakerealestate market:“Nosurpriseforamarketthat’s seenrecordpricespushabove$6million: LakeKeoweeisthemostexpensivelake inSouthCarolina,with52percentofits listingspricedat$1millionormore…The averagesalespriceonLakeKeoweeis $1.584million,morethandoublethatof thePalmettoState’ssecond-priciestlake, LakeMurraynearColumbia,wheretheaveragepriceis$771,713.LakeKeoweehas 71homeslistedformorethan$1million comparedwithLakeMurrayat43and LakeHartwellat23…”
FromJanuary-September2021,there were149propertysalesintheCliffs,with anoverallsalestotalofjustover$90 million.Forthesameperiodin2023,98 Cliffssalestotalednearly$119million, a32%increaseinvolumewith51fewer propertysales.
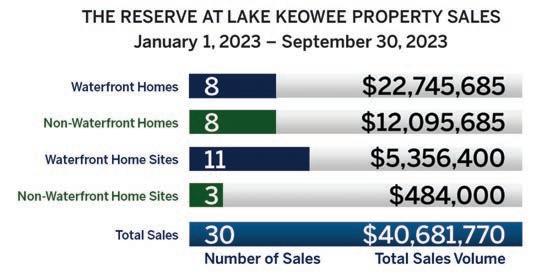
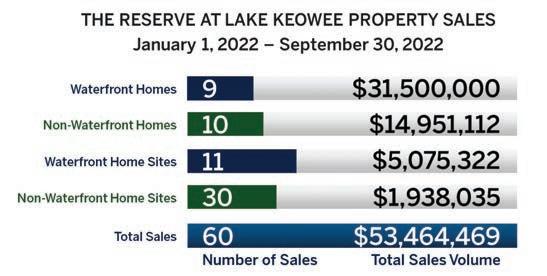
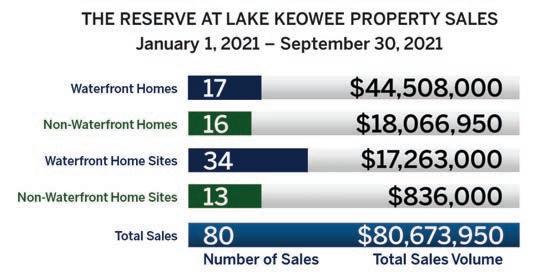
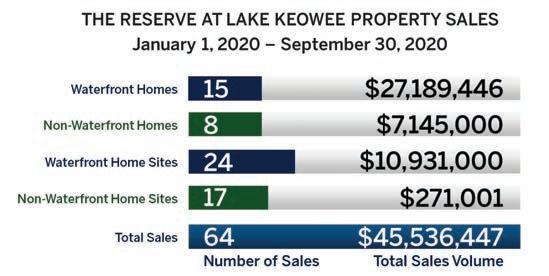
Interestingly,theReservepeakedin2021 aswell,andhasdeclinedeachyearsince. Thoughtheoverallsalesdecreased,one metricfordeterminingvalueisaverage salespricepersquarefootwhichhas increased23%inthelasttwoyears.
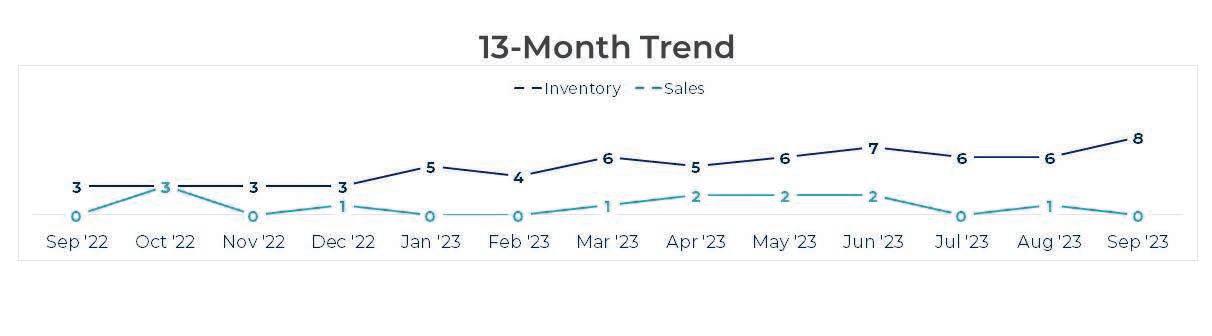
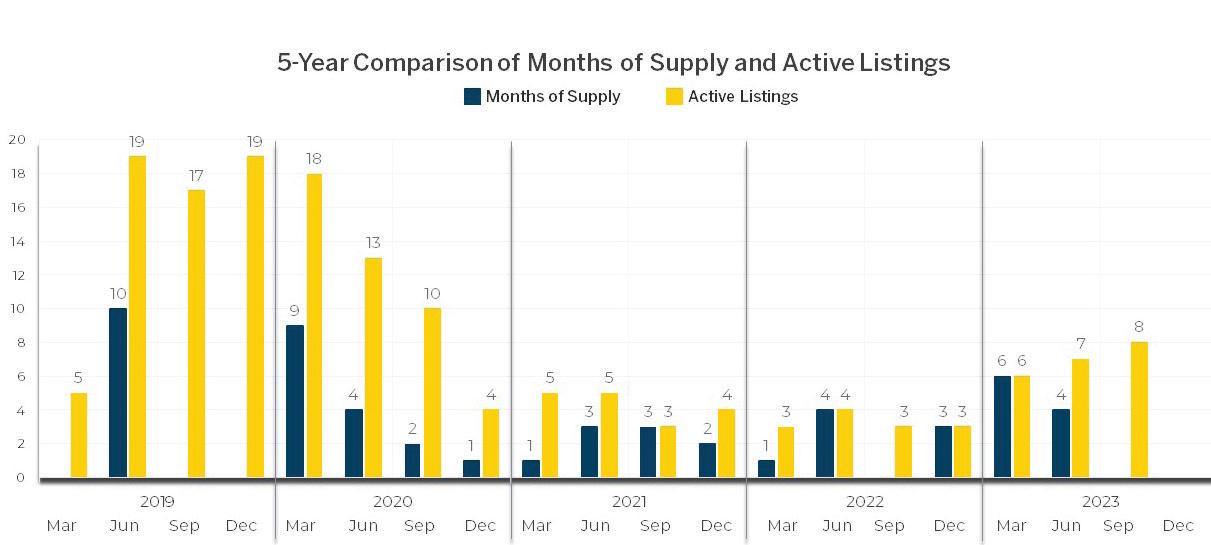
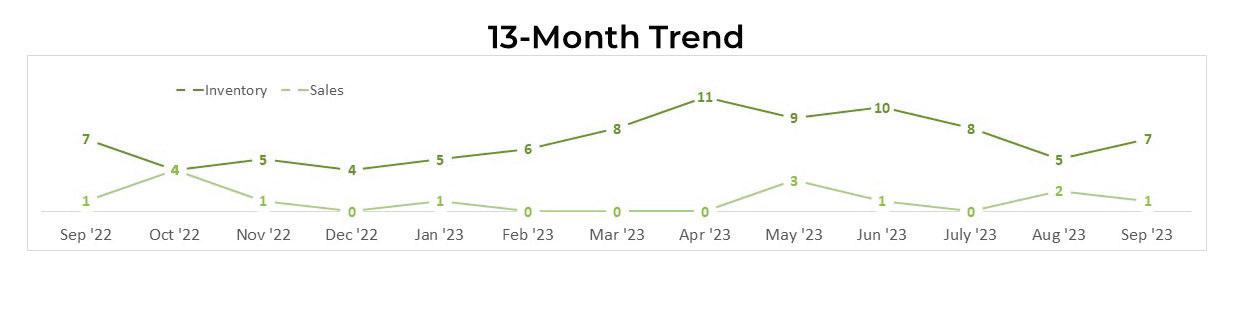
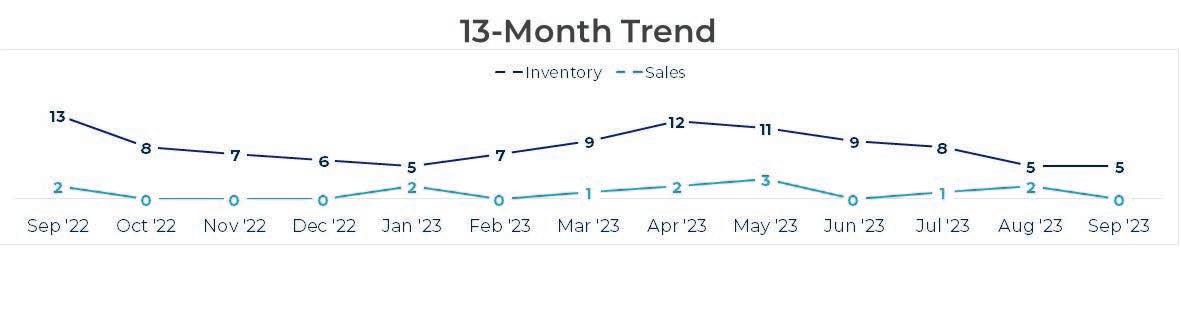
BoththeCliffsandtheReservehaveset thebarforpropertysalesonLake Keowee.Inventoryisstilllow,soifyou wouldliketodiscussyourpersonal situation,pleasereachout.
–David


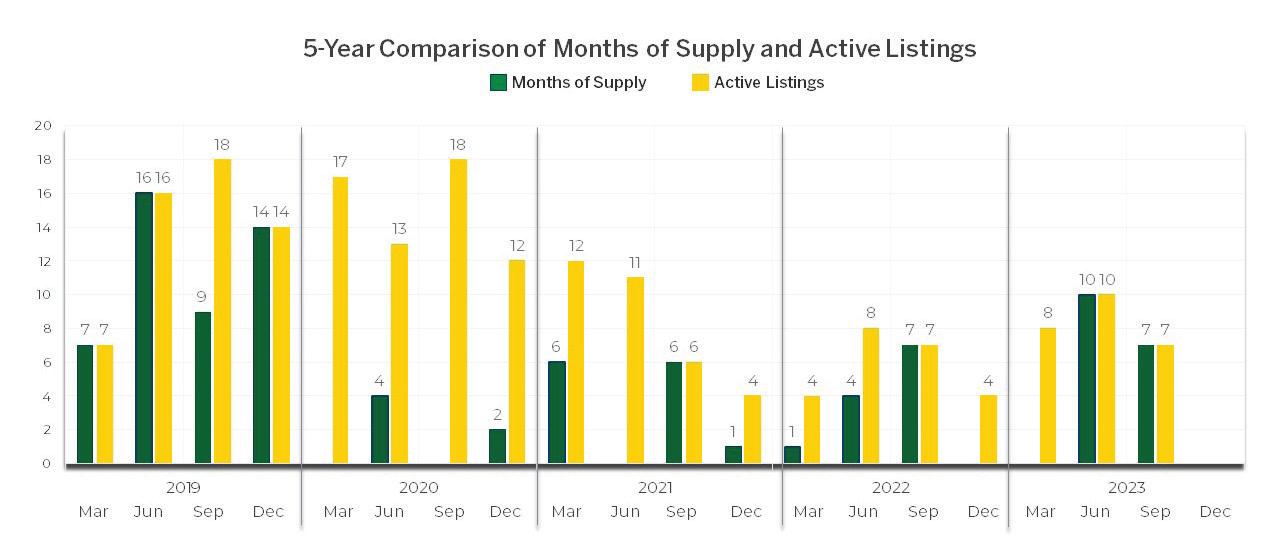
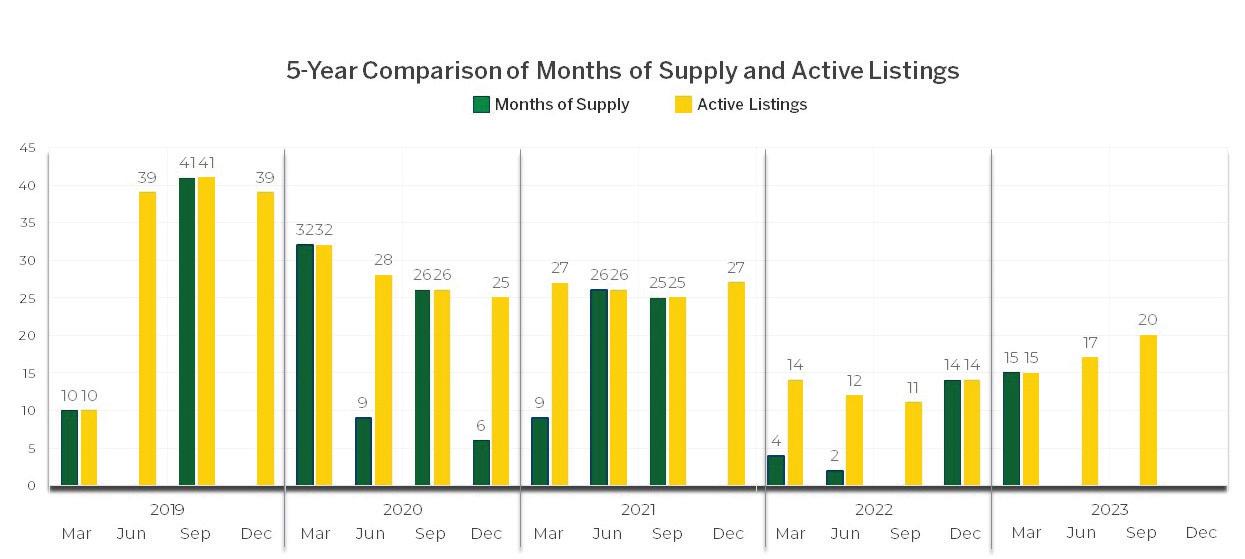
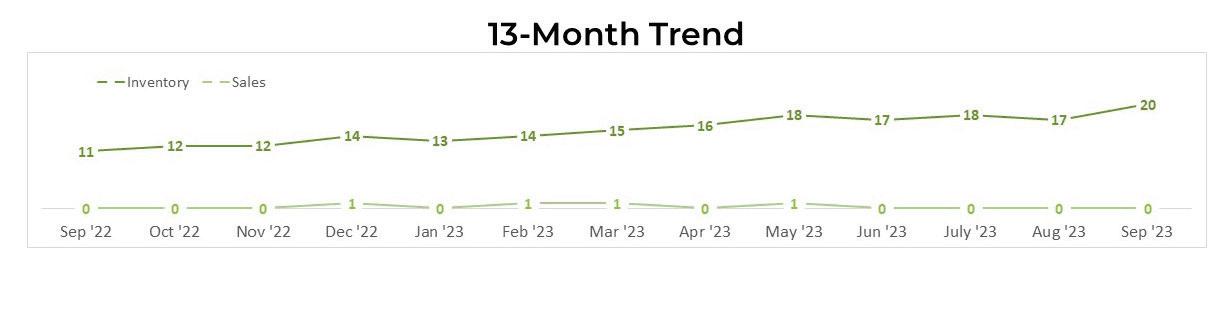
WATERFRONTHOMES 2020202120222023 MEDIANSALESPRICE $1.67m$2.35m$3.20m +41%+36% $3.08m -4% 2020202120222023 MEDIANSALESTOLISTPRICERATIO 97%98%96% +1%-2% 98% +2% 2020202120222023 MEDIANPRICEPERSQUAREFOOT $332$472$606 +42%+28% $550 -9% 2020202120222023 MEDIANDAYSONTHEMARKET 2006738 -67%-43% 64 +68% January1-September30 2020202120222023 AVERAGESALESPRICE $1.81m$2.61m$3.50m +44%+34% $2.84m -19% 2020202120222023 AVERAGESALESTOLISTPRICERATIO 98%96%94% -2%-2% 97% +3% 2020202120222023 AVERAGEPRICEPERSQUAREFOOT $357$457$616 +28%+35% $560 -9% 2020202120222023 AVERAGEDAYSONTHEMARKET 22110164 -54%-37% 66 +3% PriceBandInventorySalesPendingMonthsofSupply >$4.5m1019/Buyer’s $4.25m-$4.5m100–$4.0m-$4.25m0100/Seller’s $3.75m-$4.0m100–$3.5m-$3.75m1109/Buyer’s $3.25m-$3.5m1123/Seller’s $3.0m-$3.25m1109/Buyer’s $2.75m-$3.0m0100/Seller’s $2.5m-$2.75m0100/Seller’s $2.25m-$2.5m000–$2.0m-$2.25m000–$1.75m-2.0m0100/Seller’s <$1.75m0100/Seller’s Total6835/Seller’s January1-September30,2023 Themonthsofsupplycalculateshowmanymonthsitwouldtaketosellapropertygiventhecurrentsalespace,inventorylevelandnonewpropertiesareofferedforsale.Theindustrystandardisthat6 monthsofsupplyisabalanced/neutralmarket,5monthsorlessisaseller’smarketand7monthsormoreabuyer’smarket.

13-MonthTrendMedianSalesPrice 0$3.32m0$1.95m00$1.71m$2.74m$2.38m$3.59m0$3.58m0 13-MonthTrendAverageSalesPrice 0$3.20m0$1.95m00$1.71m$2.74m$2.38m$3.59m0$3.58m0


2020202120222023 MEDIANSALESPRICE $873k$1.15m$1.68m +33%+45% $1.63m -3% 2020202120222023 MEDIANSALETOLISTPRICERATIO 96%95%96% -1%+1% 93% -3% 2020202120222023 MEDIANPRICEPERSQUAREFOOT $231$282$378 +22%+34% $414 +10% 2020202120222023 MEDIANDAYSONTHEMARKET 24614354 -42%-62% 97 +80% January1-September30 2020202120222023 AVERAGESALESPRICE $893k$1.12m$1.49m +26%+32% $1.51m +1% 2020202120222023 AVERAGESALETOLISTPRICERATIO 94%95%97% +1%+2% 93% -4% 2020202120222023 AVERAGEPRICEPERSQUAREFOOT $222$283$358 +27%+27% $394 +10% 2020202120222023 AVERAGEDAYSONTHEMARKET 26516771 -37%-57% 144 +103% +103% PriceBandInventorySalesPendingMonthsofSupply >$2.0m21018/Buyer’s $1.9m-$2.0m000–$1.8m-$1.9m000–$1.7m-$1.8m1303/Seller’s $1.6m-$1.7m100–$1.5m-$1.6m21018/Buyer’s $1.4m-$1.5m0100/Seller’s $1.3m-$1.4m0010/Seller’s $1.2m-$1.3m000–$1.1m-$1.2m000–$1.0m-$1.1m000–$900k-$1.0m000–<900k0200/Seller’s Total6816/Balanced January1-September30,2023
NON-WATERFRONTHOMES

13-MonthTrendMedianSalesPrice $1.75m$1.62m$950k0$825k000$1.72m$2.19m0$1.30m$1.45m 13-MonthTrendAverageSalesPrice $1.75k$1.49m$950k0$825k000$1.67m$2.19m0$1.30m$1.45m
WATERFRONTHOMESITES
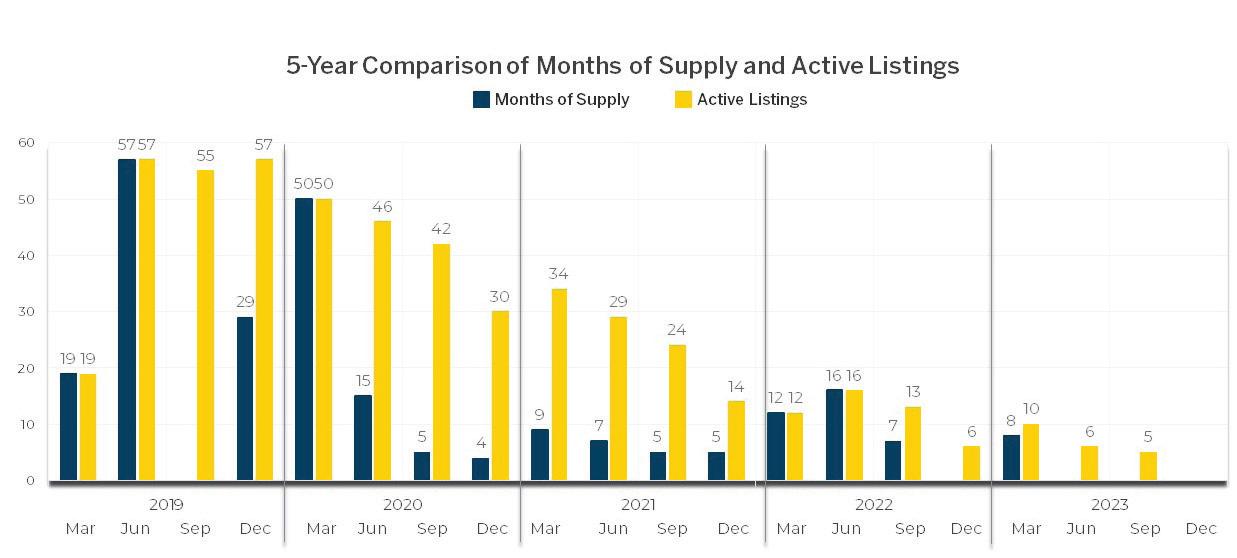
Themonthsofsupplycalculateshowmanymonthsitwouldtaketosellaproperty giventhecurrentsalespace,inventorylevelandnonewpropertiesareoffered forsale.Theindustrystandardisthat6monthsofsupplyisabalanced/neutral market,5monthsorlessisaseller’smarketand7monthsormoreabuyer’s market.
2020202120222023 MEDIANSALESPRICE $373k$494k$450k +33%-9% $450k 0% 2020202120222023 MEDIANDAYSONTHEMARKET 188132177 -30%+34% 277 +56% 2020202120222023 MEDIANSALETOLISTPRICERATIO 94%95%96% +1%+1% 97% +1% January1-September30 2020202120222023 AVERAGESALESPRICE $419k$507k$461k +21%-9% $486k +6% 2020202120222023 AVERAGEDAYSONTHEMARKET 180191214 +6%+12% 256 +20% 2020202120222023 AVERAGESALETOLISTPRICERATIO 93%94%92% +1%-2% 95% +3%
PriceBandInventorySalesPendingMonthsofSupply >$1.75m000–$1.5m-$1.75m000–$1.25m-$1.50m000–$1.0m-$1.25m-000–$900k-$1.0m000–$800k-$900k0o0–$700k-$800k0310/Seller’s $600k-$700k0200/Seller’s $500k-$600k1025/Seller’s $400k-$500k0200/Seller’s $300k-$400k21018/Buyer’s <$300k0300/Seller’s Total31132/Seller’s January1-September30,2023

13-MonthTrendMedianSalesPrice $562k000$724k0$300k$214k$450k0$265k$657k0 13-MonthTrendAverageSalesPrice $562k000$724k0$300k$214k$533k0$265k$657k0
NON-WATERFRONTHOMESITES
January1-September30,2023


Themonthsofsupplycalculateshowmanymonthsitwouldtaketosella propertygiventhecurrentsalespace,inventorylevelandnonewpropertiesare offeredforsale.Theindustrystandardisthat6monthsofsupplyisabalanced/ neutralmarket,5monthsorlessisaseller’smarketand7monthsormorea buyer’smarket.
2020202120222023 MEDIANSALESPRICE $500$36k$15k +7100%-58% $135k +785% 2020202120222023 MEDIANDAYSONTHEMARKET 330111214 -66%+93% 143 -49% 2010202120222023 MEDIANSALETOLISTPRICERATIO 100%93%94% -7%+1% 90% -4% January1-September30 2020202120222023 AVERAGESALESPRICE $16k$64k$65k +301%+1% $161k +149% 2020202120222023 AVERAGEDAYSONTHEMARKET 350114279 -67%+145% 124 -56% 2010202120222023 AVERAGESALETOLISTPRICERATIO 112%112%84% 0%-25% 92% +10%
PriceBandInventorySalesPendingMonthsofSupply >$400k000–$350k-$400k100–$300k-$350k100–$250k-$300k0100/Seller’s–$200k-$250k200–$150k-$200k200–$100k-$150k31027/Buyer’s $50k-$100k71063/Buyer’s <$50k400–Total203060/Buyer’s

13-MonthTrendMedianSalesPrice 000$12k0$135k$99k0$250k0000 13-MonthTrendAverageSalesPrice 000$12k0$135k$99k0$250k0000
• We leverage our brand’s heritage and sophistication.

• Connect with affluent consumers who share our vision.

• Go above and beyond to meet clients’ needs.
• Offer the only true, worldwide luxury real estate network.

• Partner with leading media to obtain the best exposure.


• Provide unparalleled reach to qualified buyers and sellers.
• Showcase every listing with the highest quality production.

• Utilize the latest technology for even greater impact.
• Deliver a singular client experience.

Goodbye Summer welcome Fall with us and do more of what you love! SCAN TO GET OFFER
Doing more is our distinction.
