

I hope you are enjoying Fall. It is my favorite time of the year. Extraordinary weather and temperatures here are perfect for all outdoor activities.
A June news story in the PostandCourier records the impact of the strong pandemic-driven lake real estate market: “No surprise for a market that’s seen record prices push above $6 million: Lake Keowee is the most expensive lake in South Carolina, with 52 percent of its listings priced at $1 million or more…The average sales price on Lake Keowee is $1.584 million, more than double that of the Palmetto State’s second-priciest lake, Lake Murray near Columbia, where the average price is $771,713. Lake Keowee has 71 homes listed for more than $1 million compared with Lake Murray at 43 and Lake Hartwell at 23…”
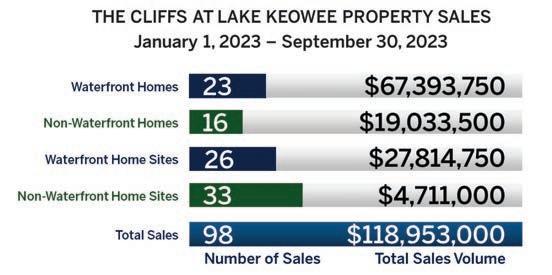
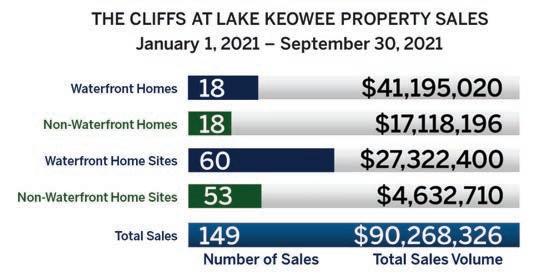
From January - September 2021, there were 149 property sales in the Cliffs, with an overall sales total of just over $90 million. For the same period in 2023, 98 Cliffs sales totaled nearly $119 million, a 32% increase in volume with 51 fewer property sales.
Interestingly, the Reserve peaked in 2021 as well, and has declined each year since. Though the overall sales decreased, one metric for determining value is average sales price per square foot which has increased 23% in the last two years. Both the Cliffs and the Reserve have set the bar for property sales on Lake Keowee. Inventory is still low, so if you would like to discuss your personal situation, please reach out.
–DavidJanuary1-September30


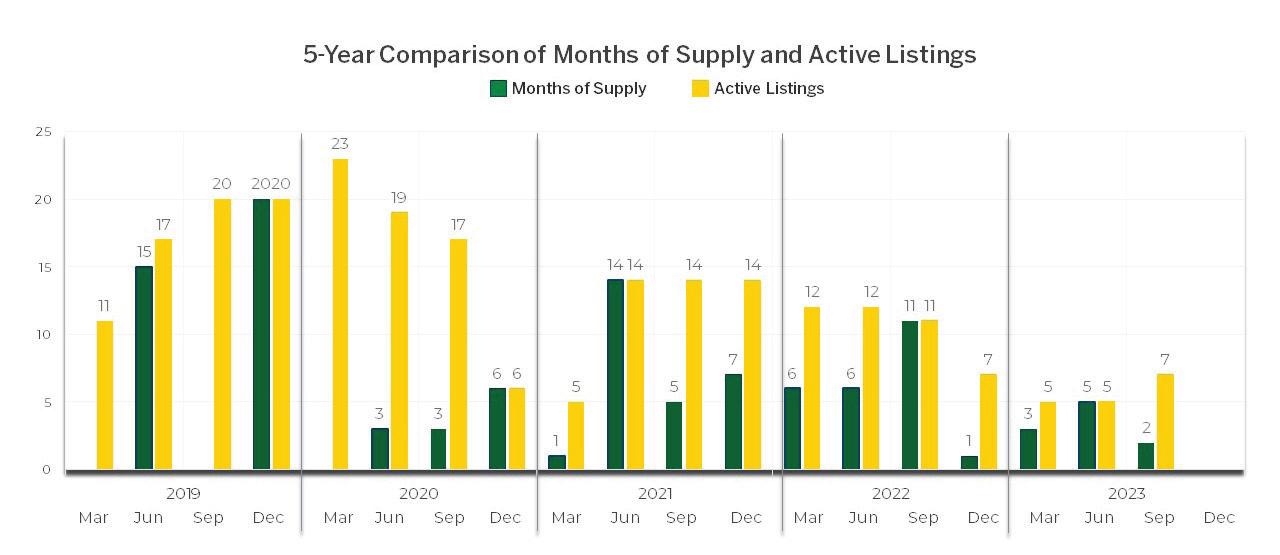
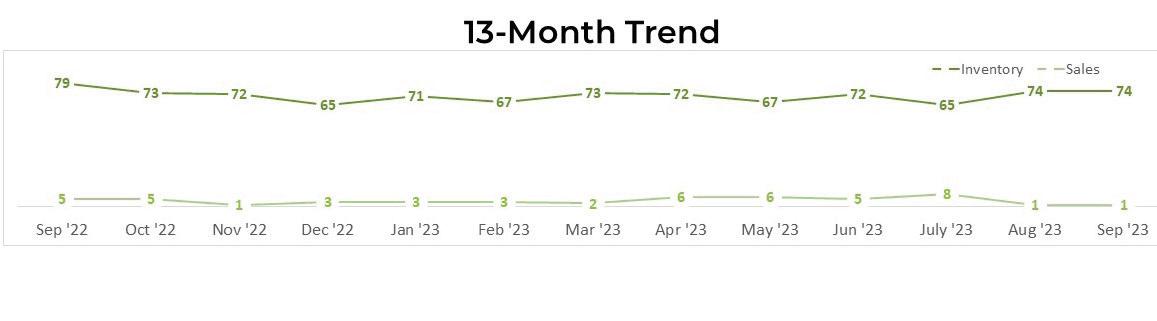
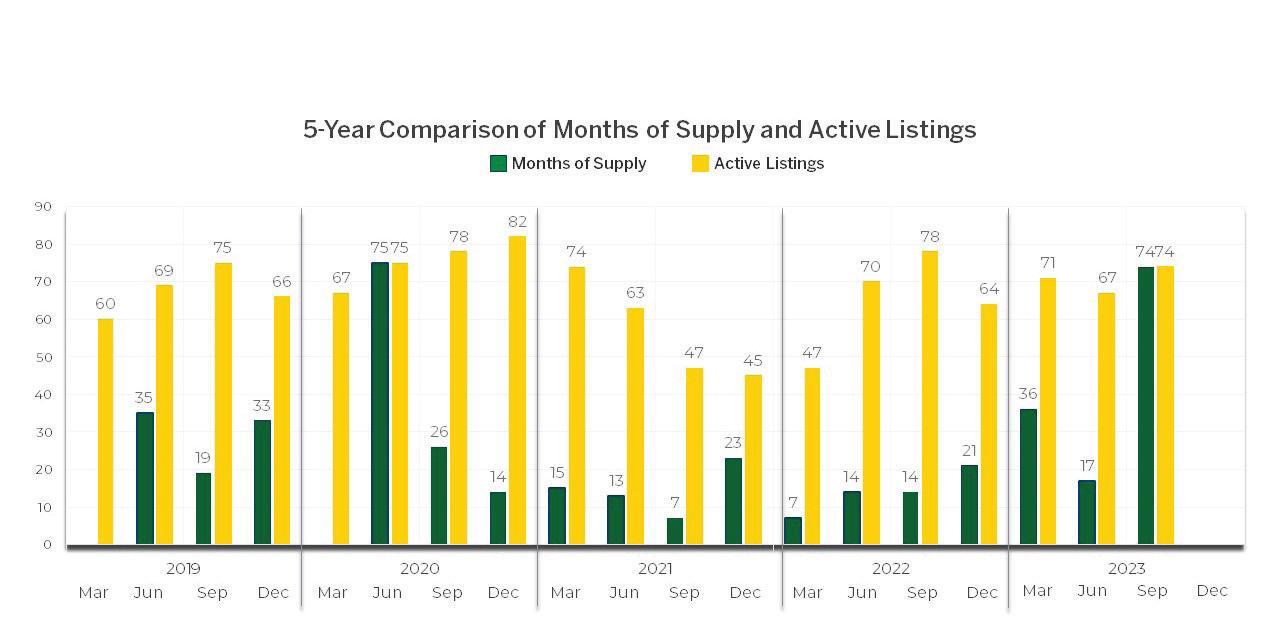
The months of supply calculates how many months it would take to sell a property given the current sales pace, inventory level and no new properties are offered for sale. The industry standard is that 6 months of supply is a balanced/neutral market, 5 months or less is a seller’s market and 7 months or more a buyer’s market.
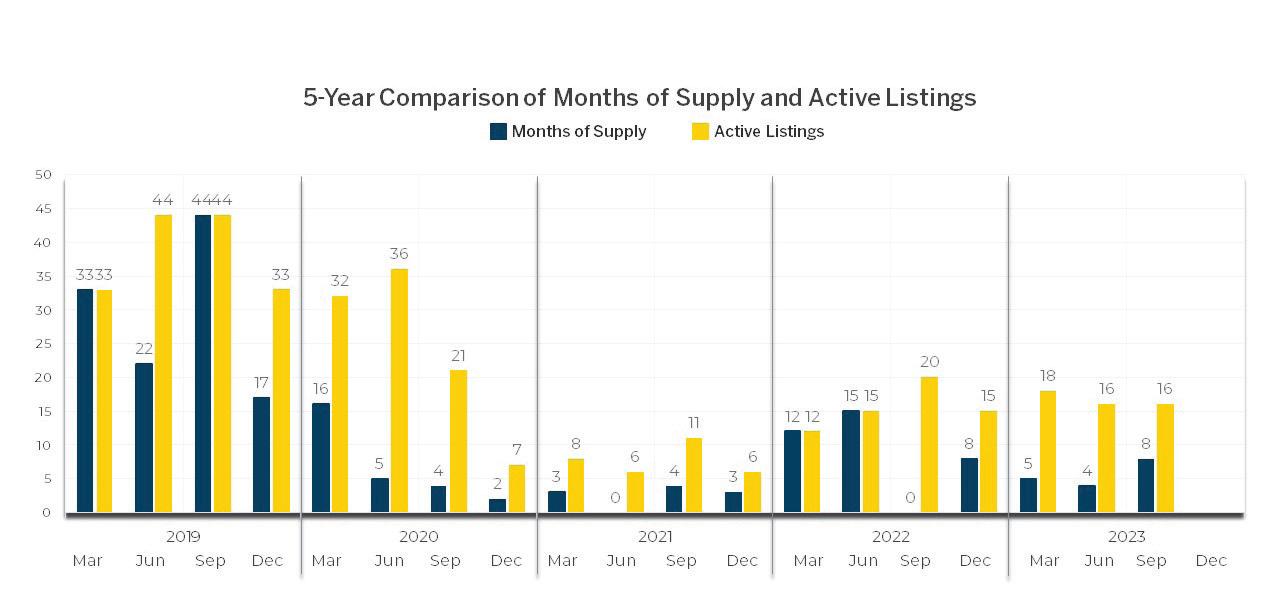


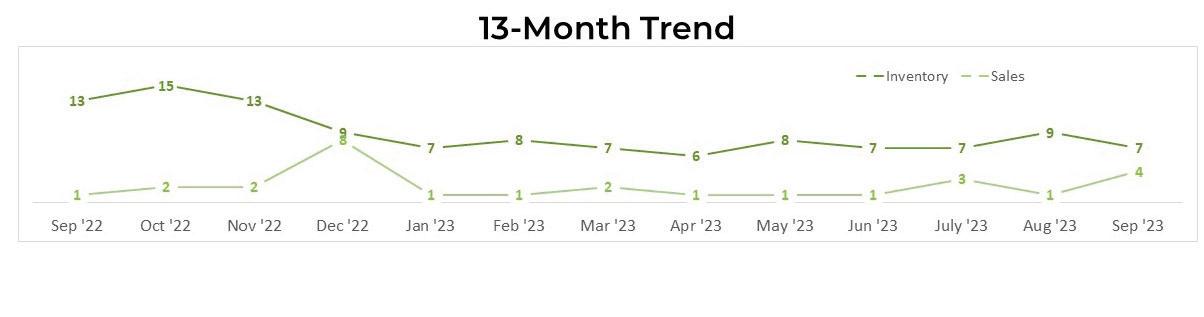
The months of supply calculates how many months it would take to sell a property given the current sales pace, inventory level and no new properties are offered for sale. The industry standard is that 6 months of supply is a balanced/neutral market, 5 months or less is a seller’s market and 7 months or more a buyer’s market.
The data contained in this report was extracted from the Western Upstate Multiple Listing Service. The information is deemed reliable but not guaranteed. It excludes private transactions and certain developer transactions that were not entered into MLS. As a result actual numbers could be different.


January1-September30,2023
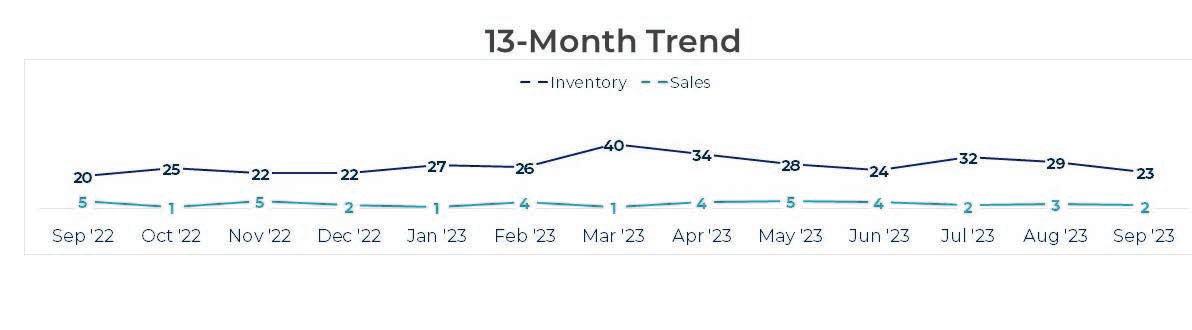
The months of supply calculates how many months it would take to sell a property given the current sales pace, inventory level and no new properties are offered for sale. The industry standard is that 6 months of supply is a balanced/ neutral market, 5 months or less is a seller’s market and 7 months or more a buyer’s market.
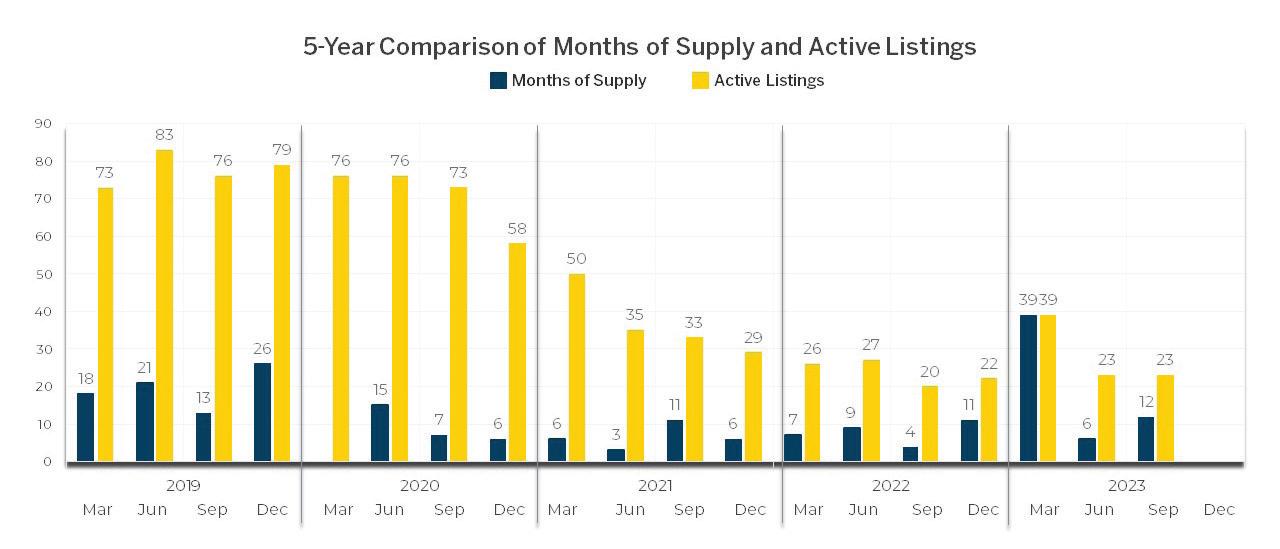


The months of supply calculates how many months it would take to sell a property given the current sales pace, inventory level and no new properties are offered for sale. The industry standard is that 6 months of supply is a balanced/neutral market, 5 months or less is a seller’s market and 7 months or more a buyer’s market.
• We leverage our brand’s heritage and sophistication.

• Connect with affluent consumers who share our vision.

• Go above and beyond to meet clients’ needs.
• Offer the only true, worldwide luxury real estate network.

• Partner with leading media to obtain the best exposure.


• Provide unparalleled reach to qualified buyers and sellers.
• Showcase every listing with the highest quality production.


• Utilize the latest technology for even greater impact.
• Deliver a singular client experience. Doing