The Reserve at Lake Keowee Market Report
Page 1

The Reserve at Lake Keowee Market Report
The Reserve at Lake Keowee Market Report
December
2023
December
31,
31, 2022
Presented By David Vandeputte
Your Reserve at Lake
Keowee Real Estate Specialist
SOLD! 128 BIG CREEK TR $2,400,000 Multiple Offers David Vandeputte Prominent Keowee Properties Email: David@JHA-SothebysRealty.com Mobile: 864.508.1717 prominentkeoweeproperties.com Joan Herlong and Associates Sotheby’s International Realty 148 Thomas Greene Blvd., Clemson, SC 29631 1 McDaniel Greene, Greenville, SC 29601 Your Neighbor & Reserve at Lake Keowee Specialist

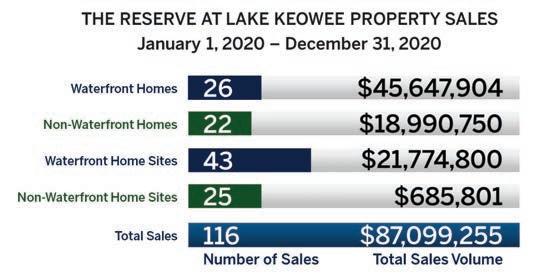
Looking back three years to January 2020, I recall a few friends being sicker than they have ever been in their life and the duration of the illness lasting significantly longer than usual. A couple months later we all learned about COVID and our lifestyle dramatically changed. I’m grateful that in the grand scheme of everything, it was much easier living here than in most places in the country.

I think it is safe to say that no one could have predicted how the ongoing pandemic would impact the real estate market. As you know, there was an unprecedented surge in sales, prices and new construction in our area. This resulted in an extraordinarily strong seller’s market here as well as in most areas of the country. Nationally sales have slowed and it wasn’t a sustainable market given the high rate of sales of 2021. The Institute of Luxury Home Marketing noted “Despite the decline in the number of transactions over the last few months, there are no critical signs of distress in the luxury market. Low inventory levels are containing the ability for buyers to low-ball offers and home values continue to remain stable.”

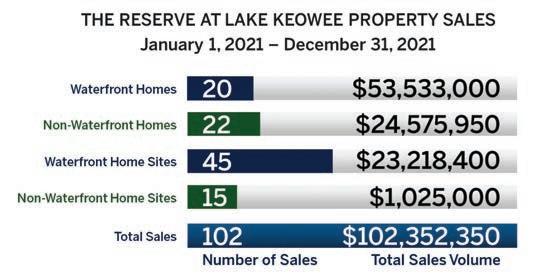
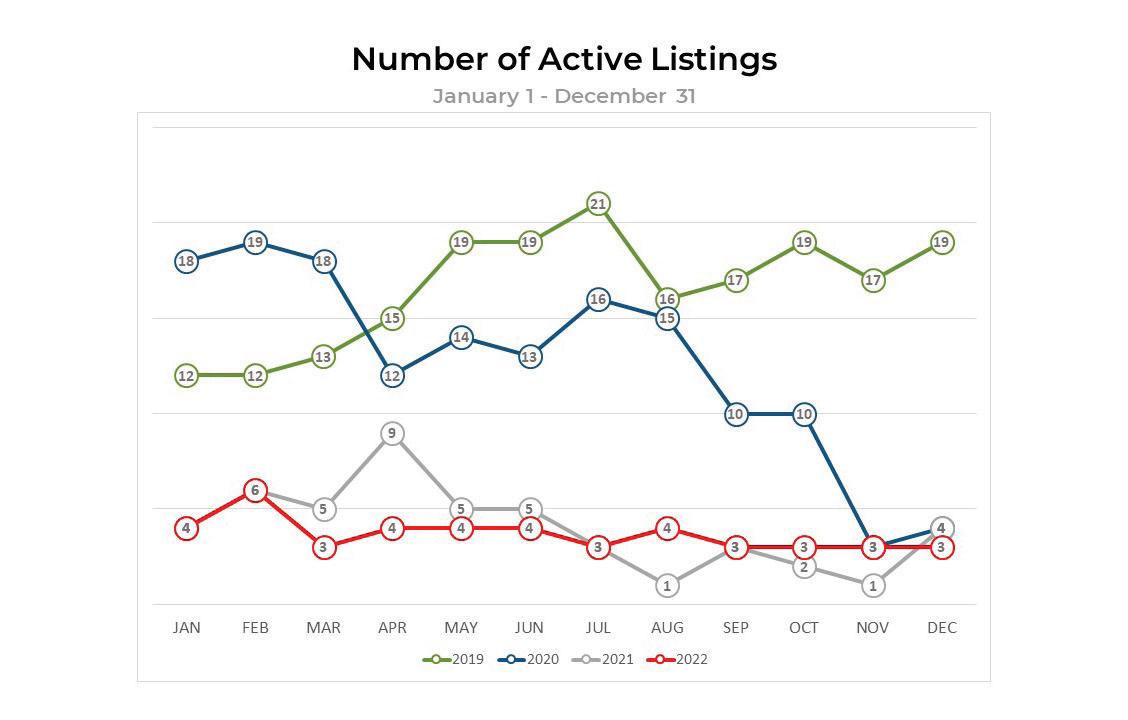
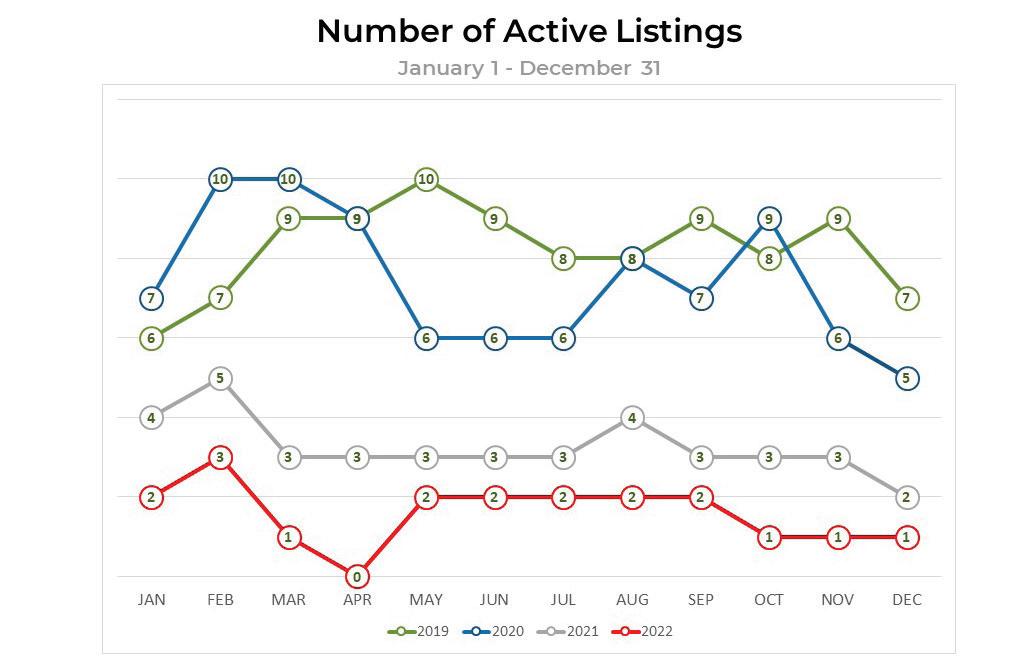
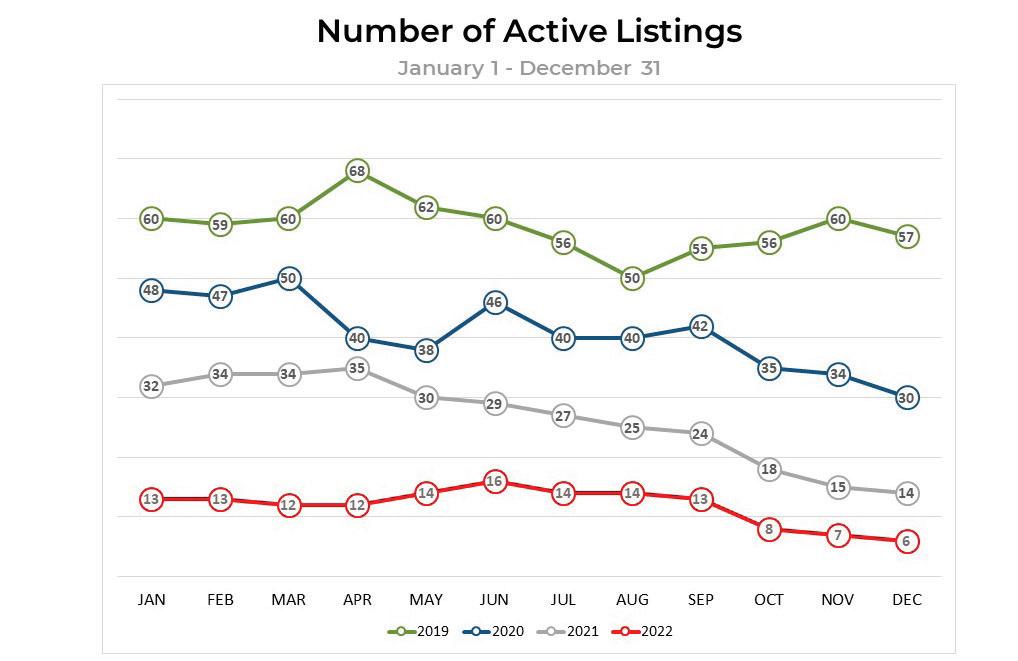
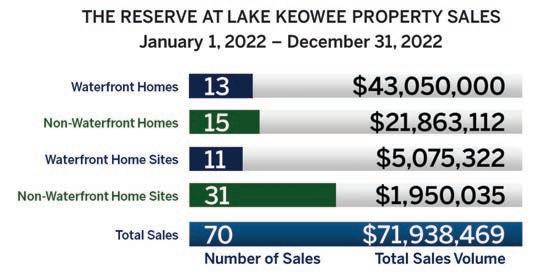
Sales have slowed at RLK throughout 2022, as 66% of the total sales in the year were in the first 6 months. For comparison purposes, The Cliffs sales were evenly split between the first and second half of the year. Compared to 2021, the RLK number of sales in 2022 was down 31% and the dollar amount down 30%. At the three Cliffs communities on the lake, the number of transactions was down -36% and the dollar amount up 6%. This is due to: low inventory levels (The Cliffs have 14 homes listed and RLK 7), higher interest rates, uncertainty in the stock

market, buyers’ return to a normal mindset (vs the feeding frenzy of 2020-2021), and, to some extent, the fluctuation in the ownership status at RLK.

Following the initial change in ownership in 2022, RLK management subcontracted its real estate sales effort to a small, real estate company in Travelers Rest, SC. While that arrangement is expected to change, no official announcement has been made.

Joan Herlong & Associates Sotheby’s International Realty is the largest affiliate in the Upstate. We have two offices: Clemson/Lakes office in Patrick Square with a focused attention on RLK and in downtown Greenville.

If you are looking for additional details of real estate statistics in RLK and The Cliffs, please visit www.prominentkeoweeproperties.com.

Forecast for 2023:

• Real estate market continues a return to normalcy

• Continued tight inventory of homes in RLK and Lake Keowee area
• Flat to a modest increase in home prices

• Interest rates hikes to curb inflation will slow in 2023

• Mortgage rates to remain flat

• Soft landing to the US economy provided the interest rate hikes continue to curb inflation and also slow wage growth which should help relax the tight labor market

Read Sotheby’s International Realty 2023 Luxury Outlook.

If you would like to discuss the real estate market in The Reserve in relation to your priorities, please contact me.

Happy New Year! I hope you had a relaxing holiday and wish you the best for 2023!
WATERFRONT HOMES 2019202020212022 MEDIANSALESPRICE $1.56m$1.63m$2.43m +49% $2.43m +4%+49% $3.20m +32% 2019202020212022 MEDIANSALESTOLISTPRICERATIO 95%97%97% +2%0% 96% -1% 2019202020212022 MEDIANPRICEPERSQUAREFOOT $309$370$485 +20%+31% $606 +25% 2019202020212022 MEDIANDAYSONTHEMARKET 29513857 -53%-59% 38 -33% January 1 - December 31 2019202020212022 AVERAGESALESPRICE $1.60m$1.76m$2.68m +9%+53% $3.31m +24% 2019202020212022 AVERAGESALESTOLISTPRICERATIO 94%98%96% +4%-2% 94% -2% 2019202020212022 AVERAGEPRICEPERSQUAREFOOT $327$376$480 +15%+28% $601 +25% 2019202020212022 AVERAGEDAYSONTHEMARKET 29318987 -35%-54% 78 -10% $3.2m$2.6m$3.8m$2.7m$5.8m$3.2m$3.5m$0$0$0$3.3m$0$2.0m Median Sale Price

• The median sales prices is up 100% over the last three years.

• Price per square foot has topped $600 for the first time.

• Sales price to list price ratios are decreasing. To compete in this market, sellers are agreeing to more concessions. It is imperative that these homes be expertly presented and professionally marketed to attract highest offers.

Cliffs Comparison

12/31/22 Reserve Cliffs

>4.5m 0200/Seller’s $4.25m-$4.5m0200/Seller’s $4.0m -$4.25m000 –$3.75m-$4.0m000 –$3.5m-$3.75m000 –$3.25m-$3.5m22012/Buyer’s $3.0m-$3.25m01 00/Seller’s $2.75m-$3.0m100 –$2.5m-$2.75m0200/Seller’s $2.25m-$2.5m000 –$2.0m-$2.25m01 00/Seller’s $1.75m-2.0m0300/Seller’s <$1.75m 000 –Total 3 13 03/Seller’s

Median Sale Price per Sq. Ft. $606$560 Median Days on the Market 38 74

12/31/20214

The months of supply calculates how many months it would take to sell a property given the current sales pace, inventory level and no new properties are offered for sale. The industry standard is that 6 months of supply is a balanced/ neutral market, 5 months or less is a seller’s market and 7 months or more a buyer’s market.

Price BandInventory Sales PendingMonths of Supply
On
20 32/Seller’s January 1, 2022 - December 31, 2022
Median Sale Price$3.2m$2.7m Average Sale Price $3.3m$2.9m
Address Sale Price List Price Bed/Full/Half Bath Days on Market Date Sold 102 Wedge Ct $5,750,000$5,999,0005/6/2 114 4/29/22 434 Peninsula Rdge $5,500,000$5,800,0005/5/2 13 2/28/22 386 Peninsula Rdge $4,400,000$4,500,6854/4/2 3 10/11/22 408 Palmer Way $4,325,000$4,690,0004/4/1 185 3/21/22 431 Peninsula Rdge $3,460,000$3,599,0004/4/0 119 6/30/22 522 Palmer Way $3,325,000$ 3,425,6854/5/1 25 10/27/22 204 Saranac Dr $3,200,000$3,290,0005/5/1 38 5/9/22 The Reserve at Lake Keowee Waterfront Home Sales
Address Sale PriceList PriceBed/Bull/Half Bath Days on Market Date Sold 232 Featherstone Dr $2,695,000$3,195,0004/4/1 4 3/4/22 113 Burwood Ct $2,595,000$2,689,0004/4/1 8 1/14/22 324 S Cove Rd $2,150,000$2,295,0004/4/1 4 2/2/22 134 Gnarled Pine Ct $1,950,000$2,395,6855/4/1 249 12/6/22 135 Village Point Dr $1,875,000$1,875,0005/5/1 160 10/03 229 Governor Glen Dr$1,825,000$1,895,0004/5/0 90 3/07/22 January 1, 2021 - December 31, 2022
NON-WATERFRONT HOMES 2019202020212022 MEDIANSALESPRICE $809k$848k$1.14m +5%+35% $1.65m +44% 2019202020212022 MEDIANSALETOLISTPRICERATIO 92%97%95% +5%-2% 96% +1% 2019202020212022 MEDIANPRICEPERSQUAREFOOT $160$235$298 +47%+27% $387 +30% 2019202020212022 MEDIANDAYSONTHEMARKET 251108117 -57%+8% 68 -42% January 1 - December 31 2019202020212022 AVERAGESALESPRICE $768k$863k$1.11m +12%+29% $1.45m +30% 2019202020212022 AVERAGESALESTOLISTPRICERATIO 93%96%95% +3%-1% 96% +1% 2019202020212022 AVERAGEPRICEPERSQUAREFOOT $173$241$312 +39%+29% $364 +17% 2019202020212022 AVERAGEDAYSONTHEMARKET 276168138 -39%-18% 87 -37% $1.2m$0$800k$1.2m$1.9m$0$1.4m$1.8m$0$1.8m$1.6m$950k$0 Median Sale Price

>1.8m 3409/Buyer’s $1.7m-$1.8m0300/Seller’s $1.6m -$1.7m1 1 012/Buyer’s $1.5m-$1.6m01 00/Seller’s $1.4m-$1.5m000 –$1.3m-$1.4m000 –$1.2m-$1.3m01 00/Seller’s $1.1m-$1.2m0200/Seller’s $1.0m-$1.1m000 –$900k-$1.0m01 00/Seller’s $800k-$900k00 10/Seller’s $700k-800k0200/Seller’s <$700k 000 –Total 41513/Seller’s

On 12/31/2132112/Seller’s

The months of supply calculates how many months it would take to sell a property given the current sales pace, inventory level and no new properties are offered for sale. The industry standard is that 6 months of supply is a balanced/ neutral market, 5 months or less is a seller’s market and 7 months or more a buyer’s market.

Price BandInventory Sales PendingMonths of Supply
January 1, 2022 - December 31, 2022
Comparison 12/31/22 Reserve Cliffs Median Sale Price$1.7m$1.3m Average Sale Price $1.5m$1.4m Median Sale Price per Sq. Ft. $387$333 Average Sale Price per Sq. Ft. $364$330
Days
6856 Average Days
87 59
• The median sales price has doubled over the last three years. • Number of sales was down 32% possibly due to lower inventory every month compared to 2021. Cliffs
Median
on the Market
on the Market
Address Sale Price List Price Bed/Full/Half Bath Days on Market Date Sold 105 Settlement Village Dr $762,000$799,0003/3/1 177 10/24/22 109 Settlement Village Dr# Lot #33$799,800$908,0004/4/1 1912/25/22 113 Settlement Village Dr $950,000$989,0005/5/1 – 11/04/22 107 Augusta Way $1,100,000$1,100,0004/3/1 456/17/22 133 Drewberry Ln $1,100,000$1,170,0004/3/1 17 3/25/22 301 Augusta Way $1,200,000$1,275,0004/3/1 1513/24/22 124 S Lawn Dr $1,550,000$1,695,0006/5/1 71 10/25/22 The Reserve at Lake Keowee Waterfront Home Sales
Address Sale PriceList PriceBed/Bull/Half Bath Days on Market Date Sold 105 Laurel Pond Way $1,650,000$1,795,0004/4/1 57 6/29/22 123 Saranac Dr $1,700,000$1,750,0004/4/0 163 10/28 815 Top Ridge Dr $1,710,000$1,600,0004/3/1 10 3/18/22 104 Golden Bear Dr $1,750,685$1,750,6856/5/3 73 9/1/22 118 Steele Ct $1,800,000$1,775,0004/4/2 497/7/22 106 Oakmont Ct $ 1,815,627$1,899,5004/6/1 514/22/22 302 Top Ridge Dr $1,950,000$1,995,0005/4/1 92 10/12/22 168 Settlement Village Dr $2,025,000$2,100,0006/6/2 664/19/22 January 1, 2021 - December 31, 2022
2019202020212022 MEDIANSALESPRICE $477K$515K$500K +8%-3% $450K -10% 2019202020212022 MEDIANDAYSONTHEMARKET 223150172 -33%+15% 177 +3% 2019202020212022 MEDIANSALETOLISTPRICERATIO 93%96%96% +3%0% 96% 0% January 1 - December 31 2019202020212022 AVERAGESALESPRICE $481k$506k$516k +5%+2% $461k -11% 2019202020212022 AVERAGEDAYSONTHEMARKET 334166218 -50%+31% 214 -2% 2019202020212022 AVERAGESALESTOLISTPRICERATIO 91%94%95% +3%+1% 92% -3% WATERFRONT HOME SITES $465k$30k$0$1.1m$883k$390k$569k$980k$0$1.1m$0$0$0 Median Sale Price

• 75% decline in sales from 2021 to 2022 reflects the fact that there are a limited number of developer or re-sale waterfront home sites available.

• Sales prices have decline more than 10% suggests that the most desirable home sites have been purchased, homes built, or future construction is planned.

• The median days on the market statistic has increased over the past two years, also suggesting a slower market for these home sites.

>1.2m 000 –$1.1m-$1.2m01 00/Seller’s $1.0m -$1.1m000 –$900k-$1.0m000 –$800k-$900k00 10/Seller’s $700k-$800k10 112/Buyer’s $600k-$700k01 0 0 $500k-$600k2308/Buyer’s $400k-$500k01 00/Seller’s $300k-$400k0200/Seller’s $200k-$300k1206/Balanced <$200k 1 1 012/Buyer’s Total 51125/Seller’s

On 12/31/21 13 4513/Seller’s

The months of supply calculates how many months it would take to sell a property given the current sales pace, inventory level and no new properties are offered for sale. The industry standard is that 6 months of supply is a balanced/ neutral market, 5 months or less is a seller’s market and 7 months or more a buyer’s market.

BandInventory Sales PendingMonths of Supply
Price
January 1, 2022 - December 31, 2022
Cliffs Comparison 12/31/22 Reserve Cliffs Median Sale Price$450k$660k Average Sale Price $461k $717k
Address Sale Price List Price Days on Market Date Sold 108 S Turtle Rock Rd $1,100,000`$1,480,000154 3/4/22 213 E Fort George Way$624,000$624,000 27 9/30/22 449 Peninsula Rdge $568,822$630,000 459 6/30/22 113 Misty Water Loop $530,000$579,000 19 7/28/22 112 Misty Water Loop $500,000$569,000 3239/13/22 The Reserve at Lake Keowee Non-Waterfront Home Site Sales
Address Sale PriceList PriceDays on Market Date Sold 109 E Fort George Way$450,000$459,685 103 7/20/22 106 Peninsula Ct $390,000$399,9004665/26/22 212 Featherstone Dr $367,500$384,685 1904/20/22 149 Saranac Dr $265,000$265,000 34 4/20/22 307 Bear Creek Valley #H 87$250,000$259,000 3984/8/22 137 Saranac Dr $30,000 $39,900 177 1/26/22 January 1, 2021 - December 31, 2022
2019202020212022 MEDIANSALESPRICE $15k$5k$36k -67%+620% $15k -58% 2019202020212022 MEDIANDAYSONTHEMARKET 101291111 +188%-62% 207 +86% 2019202020212022 MEDIANSALETOLISTPRICERATIO 100%100%95% 0%-5% 94% -1% January 1 - December 31 2019202020212022 AVERAGESALESPRICE $18k$28k$68k +52%+148% $62k -8% 2019202020212022 AVERAGEDAYSONTHEMARKET 105297135 +183%-55% 272 +100% 2019202020212022 AVERAGESALESTOLISTPRICERATIO 100%100%100% 0%0% 82% -18% NON-WATERFRONT HOME SITES $0$17k$46k $72k $8k$13k$16k$282k$34k$0$0$0$12k Median Sale Price

• A seller’s market with 4 months of supply is misleading because 75% of sales occurred in the <$50k price band. • Average days on the market has doubled since 2021.

Cliffs Comparison

The months of supply calculates how many months it would take to sell a property given the current sales pace, inventory level and no new properties are offered for sale. The industry standard is that 6 months of supply is a balanced/ neutral market, 5 months or less is a seller’s market and 7 months or more a buyer’s market.

Price BandInventory Sales PendingMonths of Supply
January 1, 2022 - December 31, 2022
>$300k 1 1 012/Buyer’s $250k-$300k1 1 16/Balanced $200k-$250k0200/Seller’s $150k-$200k22 18/Buyer’s $100k-$150k1 1 012/Buyer’s $50k-$100k22012/Buyer’s <$50k 52203/Seller’s Total 123124/Seller’s On 12/31/212315216/Buyer’s
12/31/22 Reserve Cliffs Median Sale Price$15k$87k Average Sale Price $63k$118k Median Days on the Market 207 136 Average Days on the Market 272 187
139 Drewberry Ln$28,000 167 South Fallls Rd$25,000 $36,000 155 6/28/22 322 Golden Bear Dr$17,000 $19,000 754 1/31/22 325 Keowee Ave$15,500 $24,000 4 8/30/22 325 Keowee Ave$15,500 $15,000 379 5/11/22
January 1, 2021 - December 31, 2022 Address Sale PriceList PriceDays on Market Date Sold 361 Keowee Ave $15,000 $35,000 3554/4/22 112 Baltusrol Ct $15,000 $19,500 597 3/16/22 120 Baltustrol Ct $12,500 $12,500 36 2/28/22 120 Baltusrol Ct $12,000 $24,999 62 12/23/22 624 Top Ridge Dr# F100$11,000 $59,000 4344/25/22 102 Foxglove Common Ct$10,685 $10,685 70 5/17/22 305 Augusta Way $7,500 $7,500 3 6/29/22 113 Augusta Way $6,000 $10,000 46 8/5/22 317 Golden Bear $6,000 $3,000 3996/30/22 E-18 Muirfield Ct $5,500 $5,500 182 4/29/22 114 Muirfield Ct $5,000 $5,000 9 6/29/22 612 Top Ridge Dr $5,000 $5,000 8344/27/22 652 Top Ridge Dr $4,950 $9,900 38 6/29/22 105 Northington Ct# E191$1,500 $9,500 3624/29/22 108 Northington Ct $1,000 $1,000 713 4/29/22 207 Golden Bear Dr $1 $50,000 5254/29/22

• We leverage our brand’s heritage and sophistication.

• Connect with affluent consumers who share our vision.

• Go above and beyond to meet clients’ needs.

• Offer the only true, worldwide luxury real estate network.

• Partner with leading media to obtain the best exposure.

• Provide unparalleled reach to qualified buyers and sellers.

• Showcase every listing with the highest quality production.

• Utilize the latest technology for even greater impact.

• Deliver a singular client experience. Doing

Elevate the Everyday. Proud recipient of the 2022 Wine Spectator Award! 119 Ram Cat Alley, Seneca, SC • 864.973.8887 • www.vangelisbistro.com Its not Christmas anymore… but we do have: 183 Different Wines 30 Bourbons 15 Tequilas 13 Gins 12 Whiskeys 11 Scotches 10 Vodkas 9 Rums 8 Ryes 7 Servers 5 Chefs 3 Bartenders No Partridge in a Pear Tree but… Some of the best food in the Upstate!* *(Google Rating 4.8 out of 5)
more is our distinction.
Issuu converts static files into: digital portfolios, online yearbooks, online catalogs, digital photo albums and more. Sign up and create your flipbook.