INTELLIGENT RISK knowledge for the PRMIA community

©2022 - All Rights Reserved Professional Risk Managers’ International Association November // 2022


PROFESSIONAL RISK MANAGERS’ INTERNATIONAL ASSOCIATION FIND US ON prmia.org/irisk @prmia INSIDE THIS ISSUE Thanks to our sponsors, the exclusive content of Intelligent Risk is freely distributed worldwide. If you would like more information about sponsorship opportunities contact sponsorship@prmia.org Intelligent Risk - November 2022 002 CONTENT EDITORS Steve Lindo Principal, SRL Advisory Services and Lecturer at Columbia University Carl Densem Risk Manager, Community Savings Credit Union SPECIAL THANKS 003 Editor introduction 048 Conduct risk - by Shuvajit Chakraborty 012 Assessing cryptocurrency risk for institutional investors by Thomas J. Blackburn, Dan diBartolomeo & William Zieff 043 Risk dynamics of cryptocurrencies - by Peter Gross 036 Potential role of insurance sector in mitigating climate risk by Sonjai Kumar 024 Becoming cyber resilient in a new threat landscape by Michael Balfiore & Sara Downey 052 The climate (ESG) risk management & net-zero wave: the non-financial corporate perspective - by Peter Plochan 039 Operational resilience maturity: How you can reach ‘sophistication’ by 2025 - by Gary Lynam 004 Measuring systematic risk exposures by Barbara C. Matthews 028 The climate risk impact on corporate default rates by Francesca Bell & Gary van Vuuren 059 Build digital infrastructure for operational risk management by Peter Ding 019 Inflation and its drivers by Aleksei Kirilov & Valeriy Kirilov 032 Normalising US interest rates: the Fed can move beyond taming inflation - by Divyansh Awasthi 009 The here and now: ESG through the lens of the war in Ukraine - by Elisabeth A. Wilson 062 ESG, sustainability and non-financial risks a call for action 046 Canadian Risk Forum – Executive Leader Session
editor introduction

 Steve Lindo Editor, PRMIA Carl Densem Editor, PRMIA
This issue marks a new chapter for PRMIA’s quarterly Intelligent Risk publication, which was first published more than ten years ago. In keeping with PRMIA’s mission to promote, develop and share professional risk management practices globally, the topics now featured in Intelligent Risk are aligned with those currently identified as the highest priority by industry leaders, and the articles hand-picked from an impressive array of contributions from risk practitioners around the world. Most notably, this issue is capped by an article from Barbara Matthews, whose groundbreaking work in measuring public policy volatility and systematic risk follows a distinguished career in the global banking industry and US government financial policy roles.
Recognizing that the topics covered in this issue are dynamically evolving and the subject of ongoing debate, PRMIA has created an Intelligent Risk Community, where readers can exchange views on the topics featured in current and past issues with authors, editors and other PRMIA members on an ongoing basis. We encourage you to add your own comments to this Community and follow the comments of your peers.
Lastly, we would greatly value your feedback on Intelligent Risk’s new style, format, style, and content, which you can send to iriskeditors@prmia.org. We hope that you enjoy reading this issue’s contributions as much as we did editing them!
our sponsor
Dell creates technologies that drive human progress. Today, Dell Technologies is instrumental in changing the digital landscape the world over. We are among the world’s leading technology companies helping to transform people’s lives with extraordinary capabilities. From hybrid cloud solutions to high-performance computing to ambitious social impact and sustainability initiatives, what we do impacts everyone, everywhere.

003 Intelligent Risk - November 2022
Synopsis
Conventional wisdom holds that public policy risks are systematic in nature, which means they cannot be measured or hedged. That is changing, as advanced technology and data analytics are being used to quantify public policy language, allowing risk professionals to chart public policy volatility and quantify systematic risk.
measuring systematic risk exposures
 by Barbara C. Matthews
Conventional wisdom holds that risks related to public policy shifts are systematic in nature. They cannot be measured or managed quantitatively because they constitute random, exogenous variables. Historical data provides only limited guidance on risk exposures for risks which have no precedence. According to this convention, policy-related systematic risk exposures cannot be hedged.
Systematic risks undoubtedly exist. Public policy risks present primarily in verbal form, which makes them difficult to quantify. Paradigm shifts in the public policy context generate horizontal, systematic impacts across industry sectors and asset classes, which makes these risks systematic in nature. However, the ongoing technology and data revolutions continue to provide risk managers with the capacity to measure risks that previously were deemed impossible to quantify. Public policy risks are now within the scope of risks which can be measured and managed proactively, objectively, and quantitatively.
moving the efficient frontier
Consider credit risk. During the 1990s, conventional wisdom held that credit risks could not be measured and modeled on a par with market risks because deteriorations in credit quality demonstrated different path dependencies relative to market risks. In addition, observable data regarding credit risk was difficult to obtain in the absence of a traded market in credit risk.
Conventional wisdom was turned on its head in 1999, when Duffie, Singleton, and Pan published their seminal paper on jump diffusion processes1 that provided a paradigm for pricing credit risk using an intensity-based default model.
1 / Transform Analysis and Asset Pricing for Affine Jump-Diffusions, Darrell Diffie, Jun Pan, Kenneth Singleton, NBER Working Paper 7105 (April 1999). A version of this paper was subsequently presented at a Bank of England research conference in November 2000 and in Econometrica, Vol 68, No. 6 (Nov. 2000).
Intelligent
-
004
Risk
November 2022
The new approach permitted financial engineers and risk managers to apply multi-factor models for the purpose of pricing credit risks.2
A new technological and data revolution beckons decades later. This article covers three inter-related topics for consideration:
• A high-level description of systematic risk;
• A discussion of why public policy risks are commonly considered to be systematic in nature;
• How the data revolution chips away at the boundary between the efficient frontier and systematic risk.
Increasingly, data-driven decisions are possible regarding policy-related systematic risk.
systematic risks – the basics
Systematic risks present in four main silos: market risk, interest rate risk, exchange rate risk, and inflation risk
3. They are profoundly momentum-driven. Policymakers attempt to constrain volatility related to those dynamics using tools familiar to most market participants:
• Market Risk: trading halts/circuit breakers; central bank asset purchases.
• Interest Rate Risk and Inflation Risk: Monetary policy.
• Exchange Rate Risk: Trade policy and geopolitical positioning play an outsized role in triggering exchange rate volatility.
Investment analysts and strategists allocate considerable time to assessing how individual firms may be exposed to a broad range of risks 4 in order to identify appropriate mitigation strategies. The ability to trade volatility through the VIX specifically provides opportunities to hedge exposures to systematic risks both directly and through related derivative products.5
The framework for assessing exposure to systematic risks is thus well understood within financial markets even if full insulation from those risks through hedging strategies may not be available. But until recently it has not been possible to measure exposure to systematic risks related to shifts in public policy, much less a broader range of public policy risks that drive market volatility (e.g., cryptocurrency regulation, climaterelated policy risks, energy policy, monetary policy) through discontinuous price movements triggered by headlines.
2
/ The hazards associated with racing towards tradeable credit risks before the credit process had been fully digitized and before a broader universe of analysts and consumers understood the implications of trading credit risk were noted at the time. Regulatory Use of Credit Ratings: Implications for Banks, Supervisors, and Markets, Barbara C. Matthews, Credit Rating: Methodologies, Rationale and Default Risk (Chapter 12), Dr. Michael Ong editor (RISK Books: 2002).
3 / Systematic Risk - Learn How to Identify and Calculate Systematic Risk (corporatefinanceinstitute.com)
4
/ The Essentials of Risk Management, Second Edition, By Michel Crouhy, Dan Galai, Robert Mark (2013) The Essentials of Risk ManagementThe Essentials of Risk Management Digital Handbook (prmia.org)
5
/ The VIX index and volatility-based global indexes and trading instruments: A Guide to Investment and Trading Features, CFA Research Foundation (2020) https://www.cfainstitute.org/-/media/documents/article/rf-brief/rfbr-moran-vix-volatility.ashx
005 Intelligent Risk - November 2022
The reaction function between public policy and markets is well known, driving financial firms to be early adopters of advanced technology that accelerates their access to news. The reaction function has a name: headline risk.6 It encompasses a broad range of media coverage, including corporate announcements and litigation announcements.7 Unsurprisingly, high correlations exist between media coverage and market volatility.8
The high correlation between headline risk and market volatility intensifies the perception that public policy risk is a random exogenous variable, because media attention to public policy developments can be discontinuous over time. Media coverage tends to arise during key inflection points at seemingly random intervals which do not line up with key market timelines (e,g. the opening of trading, options expiration dates, quarterly report filing deadlines).
In addition, public policy volatility is expressed in words while markets must measure volatility quantitatively.
The net impact leads markets and risk professionals to conclude that public policy decisions are random. The inability to measure the informational content (not the definition, not the sentiment) from public policy processes has left the risk discipline flying blind, unable to spot a signal or path dependencies. The inability to access objective historical data regarding the language of public policy has also left the risk discipline unable to apply jump diffusion or other risk estimation processes.
The data revolution changes everything.
The capacity to quantify public policy language provides risk professionals with the first opportunity to begin charting public policy volatility, identify the path towards decisions, and anticipate related market reaction functions.
Consider the technical and macro risks featured in this edition of iRisk. Few, if any, are easily subject to objective quantification using traditional mechanisms. Risks and volatility that impact asset pricing for most if not all of these issues materialize first in the form of words, making it difficult for financial engineers and traders to incorporate these risks into their pricing algorithms. New advances in automated text analytics bring language-related public policy risks within the reach of risk measurement.
6 / Notable accelerants over the last century have included: the telegraph, the tickertape, the teletype, the telephone, the Bloomberg Terminal, Blackberries, cable news, program/algorithmic trading, server co-location, automated headline-reading bots that accelerate trading signal extraction from the news cycle, machine-readable institutional news feeds, and social media.
7
/ Headline risk is formally defined as: “the possibility that a news story will adversely affect the price of an investment, such as a stock or commodity. Headline risk can also impact the performance of a specific sector or the entire stock market.” Headline Risk (investopedia.com).
8 / Policy News and Stock Market Volatility, by Scott R. Baker, Nicholas Bloom, Steven J. Davis and Kyle Kost (25 March 2019), available at: https://www.policyuncertainty.com/media/Policy%20News%20and%20Stock%20Market%20Volatility.pdf
how text analytics extend the efficient frontier
why markets define public policy as a type of systematic risk
006 Intelligent Risk - November 2022
Financial firms and central banks increasingly use text analytics to improve the performance of their nowcasting models.9 Researchers are exploring how a broad range of alternative data derived from language can generate insight into market volatility and firm-specific risks. Input sources so far have included transcripts from quarterly corporate earnings calls10, Google search term data,11 Google/Factiva sentiment ratings, 12 and business leader surveys.13
Given the role that the Federal Reserve’s monetary policy decisions play in driving market dynamics, sentiment analysis of the Federal Open Market Committee minutes has delivered a rich source for new insight regarding public policy trajectories.14 The findings are consistent: the language used to communicate monetary policy is more important than the underlying data. Even the Federal Reserve15 and the Bank for International Settlements16 17 18 created language-based indices illustrating the point.
Converting words into numbers holds value beyond monetary policy, from financial stability reports to other non-monetary policy central bank communications.20 21 22
Backtests of our own PolicyScope data show that volume data generated by our patented process provide advance notice of market volatility by as much as 10 days to 22 days across a broad range of issue areas that far exceed monetary policy, such as digital currency policy, trade policy, and the LIBOR transmission.23
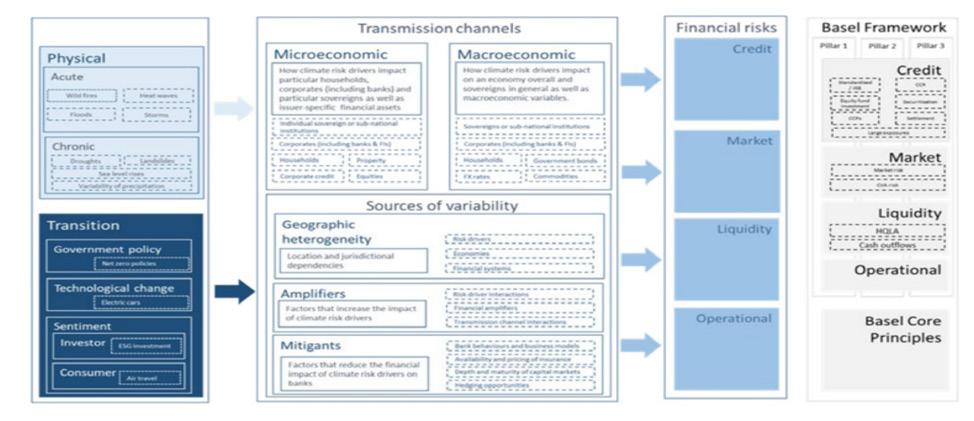
The research arises just as policymakers themselves recognize that public policy shifts create unique risks for markets and economies. For example, public policy shifts are increasingly recognized as a source of macroeconomic risks in relation to climate change. Consider the risk landscape featured in a recent United Nations report 24:
9 / Nowcasting euro area GDP with news sentiment; a tale of two crises, ECB Working Paper 821 (2021).
10 / Firm-level Political Risk: Measurement and Effects, NBER Working Paper No. 24029 (2017)
11 / Predicting the Present with Google Trends, Economic Record 88 (2012)
12 / Measuring Central Bank Communication: An Automated Approach with Application to FOMC Statements, NBR Working Paper 15367 (2009).
13 / Enrichment of the Banque de France’s Monthly Business Survey: Lessons from Textual Analysis of Business Leaders’ Comments, Banque de France Working Paper 821 (2021).
14 / Transparency and Deliberation Within the FOMC: A Computational Linguistics Approach, The Quarterly Journal of Economics (2017).
15 / Words Speak as Loudly as Actions: Central Bank Communication and the Response of Equity Prices to Macroeconomic Announcements, Finance and Economics Discussion Series FEDS Notes 2021-074, Board of Governors of the Federal Reserve System (2021).
16 / Seeing the Forest for the Trees: Using hLDA Models to Evaluate Communication in Banco Central do Brasil, BIS Working Papers No 1021 (2022).
17 / Effects of Banco de la Republica’s Communication on the Yield Curve, BIS Working Papers No. 1022 (2022).
18 / Monetary Policy Press Releases: An International Comparison, BIS Working Papers No. 1023 (2022). “Much of the co-movement between the sentiment index and monetary policy rates may simply reflect the economic data discussed in the press releases and used in the termination of monetary policy. So, if we want to analyze if there is additional information in the monetary policy documents, it is necessary to filter this common information.”
19 / Central Bank Communication on Financial Stability Economic Journal (2014).
20 / Global Spillovers of the Fed Information Effect, Bank of England Staff Working Paper no. 952 944 (2021).
21 / The Narrative About the Economy as a Shadow Forecast: An Analysis Using Banco de Espana Quarterly Reports, Banco de Espana Working Paper 2042 (2020) (observing that “a ‘sophisticated’ reader could infer GDP growth projections based on the text of the reports, somewhat beyond what is told in just the numbers.” They did not specify whether the ‘sophisticated’ reader they had in mind at the time was a machine or a human).
22 / Fed Communication on Financial Stability Concerns and Monetary Policy Decisions: Revelations from Speeches, Banco de Espana Working Paper 2110 (2021) “A higher speaking time (topic proportion) or a higher negative tone on Financial Conditions, Financial Stability and Supervision and Regulation correlate with a more accommodative monetary policy stance while communication on House with a tighter policy stance….speeches by Fed presidents seem to convey timely and strong information for financial-related concerns and the likely direction of monetary policy.”)
23 / PolicyScope Data: Backtest Results, BCMstrategy, Inc. (September 2021).
24 / Economic Impacts of Climate Change: Exploring short-term climate related shocks for financial actors with macroeconomic models, United Nations Environment Program (2022).
007 Intelligent Risk - November 2022
What is true for climate-related policy is true for other arenas as well. What policymakers say matters. Advanced technology for the first time delivers to risk professionals the capacity to measure momentum embedded within the words as well as the sentiment conveyed by those words. Firms that start measuring and pricing these macro-policy risks effectively can ride the innovation wave, extending the efficient frontier. Using text analytics, a small portion of systematic risk can now be measured, managed, hedged, and anticipated.
Barbara C. Matthews
Barbara C.
Inc., a data company
helps
market volatility from public policy risks. She has served in various senior positions in the global banking industry as well as the U.S. government, including service as the first U.S. Treasury Attache to the European Union with the Senate-confirmed diplomatic rank of Minister-Counselor. She was also the first Regulatory Counsel to the Institute of International Finance, where she worked directly with Chief Risk Officers and Chief Executive Officers of the world’s largest banks. She holds advanced degrees in
 Figure: Macroeconomic transmission channels for climate risks
Steve Lindo
Matthews is Founder and CEO of BCMstrategy,
that
portfolio managers and strategic analysts anticipate
international relations (Georgetown University) and two law degrees (Duke Law School).
Founder and CEO of BCMstrategy, Inc
Figure: Macroeconomic transmission channels for climate risks
Steve Lindo
Matthews is Founder and CEO of BCMstrategy,
that
portfolio managers and strategic analysts anticipate
international relations (Georgetown University) and two law degrees (Duke Law School).
Founder and CEO of BCMstrategy, Inc
author 008 Intelligent Risk - November 2022
peer reviewer
Synopsis
The war in Ukraine places new emphasis on the ESG lens already gaining traction in the financial services industry and with regulatory bodies. The author’s discussion of each pillar, E, S and G, in the context of the conflict offer each new significance and explanatory power, while outlining the needs for formal reporting and potential challenges to this shift.
the here and now: ESG through the lens of the war in Ukraine
by Elisabeth A. Wilson
A recent onslaught of proposed climate change-related financial disclosure regulatory guidance has only served to fuel the meteoric rise of Environmental, Social and Governance (ESG). Business leaders and risk practitioners are scratching their heads trying to determine where and how to start the long journey that will entail ESG compliance—and more importantly, win the consumer seal of approval. However, regulatory requirements are still in the (albeit probably not-so-distant) future and may be inhibited by legal interventions.1
Then there is the ongoing war in Ukraine, which is raising the ESG stakes even higher. Suddenly, every element across the E, S and G pillars has been brought into sharper focus by the tragedy unfolding in Europe. While conflict, unlike anything seen since World War II, continues the impetus on ESG across the financial industry is only growing.

environmental
The economy and inflation have taken a substantial hit due to the United States’2 and Europe’s 3 decision to ban Russian oil imports. It is apparent that the pain the average consumer is facing as a result will not abate any time soon. With nuclear weapons always on the table, Western powers have leveraged Russia’s economy as their alternate weapon of choice, with the goal of exacting maximum damage and slashing Russia’s war chest. In response, Russia has sparked concern over retaliatory moves to cut Finland’s electrical power4 and to stop essential gas supplies to Europe 5
As the West releases oil reserves in response to subsequent supply chain constrictions, controversy over the potential impacts this may have on climate change is fueling greater angst.
Intelligent Risk - November 2022
009
More importantly, the war in Ukraine has highlighted, more than ever, the financial and political benefits of transitioning to a net zero economy. The introduction of clean energy in every sense—both green and oligarch-free—would further isolate Russia’s economy and destabilize its expansionist goals. Beyond the implications of climate change, now there is a need to reduce the United States’ and Europe’s reliance on increasingly volatile countries and regions for its energy supplies. Focus on the E in ESG has taken on new impetus and is evolving into a mechanism necessary to maintaining political, economic, financial, natural and moral balance.
At the outset of the war in Ukraine, a Yale professor published a spreadsheet listing all the foreign companies that continued to do business in Russia. Due to the resulting consumer response, companies that previously had been silent rapidly began making definitive statements and promoting their business strategies to wind down operations and close stores. Companies began leaving Russia in a mass exodus—forfeiting revenue along the way—because they were unwilling to face public displeasure and consumer boycotts that, in the long run, would do far more to degrade profits and tarnish their brands.
The S In ESG has been heavily promoted by shareholders, investors and consumers who want to align themselves with companies that embody their values. These same advocates of sustainable and ethical business practices, these champions of Diversity, Equity and Inclusion, have galvanized the financial industry in the last two years, turning ESG into a veritable grassroots movement. As a result, it is not so surprising that consumers—standing up to Russian aggression on an individual basis—made the impact they did while the world was reeling at the onslaught on Ukraine. It is also a clear reminder to financial institutions still on the fence about ESG that consumers can—and will—hold a company in check if its practices do not line up with a more en vogue world view.
social governance
Wave after wave of economic sanctions against Russia, its political figures and its citizens have placed an additional onus on financial institutions. Compliance and Information Security departments already stand on the front lines in the fight against global terrorism, but now the former must stay abreast of increasingly labyrinthine updated agency guidance while ensuring policies, practices and teammates remain robust and effective.
Knock on wood, significant retaliatory cyber-attacks led by Russia against Western powers providing aid to Ukraine have not materialized as previously feared, but that does not change the fact that the financial industry is still on tenterhooks. Data privacy and cybersecurity play a prominent role in ESG and can align back and forth with either the S or G pillars. When it comes to the potential damage Russia could exert on the financial industry and the world economy—not to mention individual institutions, their shareholders and customers— Information Security teams are sorely aware that the balance has tipped toward governance. The stakes are substantial if system vulnerabilities remain unchecked or employee training efforts to drive recognition of suspicious activity fall short. 010 Intelligent Risk - November 2022
ESG as a whole
ESG is interwoven in the very fabric of our financial industry and economy. These are key concepts and practices that make up our world as a whole. It is why ESG has come to prominence in a world fatigued after a pandemic, unprecedented social unrest and economic instability. Now the world and the financial industry must grapple with a war in Europe, a concept we thought had passed away. When one part of the world behaves in a chillingly provocative manner and the rest bears the brunt—whether directly in the line of fire or by experiencing economic and supply chain constrictions across the globe—, the resulting imbalance highlights the need for consolidation and change.
The financial industry is already equipped to facilitate proactive movement on the ESG front, however there is still a lot to hash out when it comes to appropriate policy and reporting in a way that can satisfy regulators, consumers and an already heavily-burdened financial industry.
ESG is not a new concept. In the last two years, foundations have been laid by financial practitioners, foundations that will serve not only shareholders, investors and consumers, but will help promote global stability going forward.
Disclaimer: All views expressed in this article are my own and do not represent the opinions of any entity that I may be associated with.
peer reviewer
Steve Lindo
Elisabeth A. Wilson
Elisabeth A. Wilson has worked for over 14 years in the financial industry. She was recruited to Atlantic Union Bank’s Enterprise Risk Management Department in 2016 to support development of the company’s then-burgeoning risk management framework. Recently charged with crafting the Bank’s Environmental, Social and Governance (ESG) Risk Framework, Elisabeth continues to build, implement, and manage key risk programs, driving regulatory alignment and promoting bank-wide engagement while simultaneously supporting business line risk oversight. She has also contributed to the ABA Banking Journal, The RMA Journal, and Risk Management Magazine. Elisabeth is based in Richmond, Virginia.

author 011 Intelligent Risk - November 2022
Synopsis
Already volatile crypto coins have come under new pressures in 2022, most dropping severely as investors flee risky assets, but recognition of their utility is also growing as more institutions take serious looks at their possibilities. The authors propose an analytical process for crypto risk related to current practices for commodities and frontier currencies, allowing easier integration with risk models for other asset classes.
assessing cryptocurrency risk for institutional investors
by Thomas J. Blackburn, Dan diBartolomeo & William Zieff
introduction
Recently the value of most cryptocurrencies has declined significantly with Bitcoin now trading at less than 40% of its all-time high value. A major cryptocurrency exchange, Coinbase, has disclosed operating losses of nearly $500 million dollars in the first quarter and $1 billion in the second1, respectively, and raised the possibility that investor crypto deposited with the exchange might be lost if they are forced into bankruptcy. In addition, Terra and Luna cryptos have become basically worthless. The related stable coin TerraUSD has traded for as low as $0.08, a massive failure for an asset purportedly pegged to be worth $1.00 dollar.
Since the circulation of the original Bitcoin white paper in 2008, the value of all cryptocurrencies has risen to now exceed one percent of all traded wealth. There have been large variations in the values of major cryptocurrencies like Bitcoin and Ethereum, in addition to frequent massive shifts in the values of lesser known cryptos. The institutional landscape continues to evolve rapidly with firms like Goldman Sachs and Fidelity setting up trading facilities, while other organizations like HSBC have steadfastly advised clients to keep away from crypto. A useful overview of the current state of play appears in Horne (Journal of Performance Measurement, Summer 2021). Irrespective of intrinsic or extrinsic value, we expect that such items will be present in institutional investor portfolios from time to time. As such it is necessary to have methods in place to assess the risk of holding cryptocurrencies and the incremental impact of crypto holdings on overall institutional portfolios.

Intelligent Risk - November 2022 012
1 / https://investor.coinbase.com/financials/quarterly-results/default.aspx
The main portion of our proposal focuses on key building blocks for understanding the risk of cryptocurrencies and what magnitude of return expectations would justify those risks for a typical investor. Our process involves both historical and forward-looking information, as well as several nuances in the statistical estimation of a covariance matrix (within crypto and between crypto and other assets).
An additional feature is a means to incorporate “tail risk” as might arise from geopolitical events (being outlawed or severely regulated) and operational risks (e.g. theft, loss of private keys) based on use of mixture distributions and the method of Cornish and Fisher (Review of the International Statistics Institute, 1938). This relevance of tail risk is motivated by real world events such as the aggressive regulation of crypto activities by China and other countries, and the persistent occurrence of large hacks (e.g. Poly Networks in August 2021) wherein losses of a half billion dollars or more are almost ordinary.
While the emergence of cryptocurrencies has led to numerous working papers within the academic community, we draw attention to Alexander and Imeraj (SSRN, 2019) which addressed the empirical volatility of major cryptos as being on the order of 80% annualized. Schwenkler and Zheng (SSRN, 2020) identify pairwise covariance structures in the behavior of cryptocurrencies which they ascribe to news coverage. The classic work of Hotelling (Economic Journal, 1929) also offers a relevant foundation given that a major purported benefit of cryptocurrencies is their built-in limitation of a finite supply (at least for each individual cryptocurrency).
analytical method for market risk
Our coverage of cryptocurrencies is closely related to the methods we routinely use for commodities and fiat currencies of frontier market countries. For fiat currencies, we create groups of currencies based on geographic proximity, trade relations, and cultural similarity. A similar grouping concept is used for cryptos. The grouping scheme allows us to build principal component factor exposures for crypto currencies, which are then mapped onto existing risk model factors for non-crypto assets.
The first step is to use a principal component analysis (PCA) of one or more groups of crypto assets to estimate statistical factors that are common drivers of observed returns. These factors may be difficult to identify and may change over time. PCA is a traditional way to deal with such situations which generates factors based on the covariance matrix of the asset returns themselves. In the usual manner of a statistical risk model, we keep the statistical factors which contribute the most to variance and dismiss smaller ones as representing noise. A useful model for drawing the line between PCA factors and noise is presented in Bouchard, Cizeau, Laloux, and Potters (World Scientific, 1999).
Once the statistical factors for a sample period have been identified, the second step maps the statistical factors onto existing factors in other models to determine the correlations between a crypto asset and traditional assets. A general discussion of factor modeling methods is diBartolomeo (chapter in Oxford Handbook of Quantitative Asset Management, 2014). 013 Intelligent Risk - November 2022
To keep the model parsimonious and to try to avoid overfitting, the number of identified factors on to which each statistical factor is mapped should be limited. One does not know the nature of statistical factors, hence one does not know which risk model factors are most likely to be relevant to it. To select among traditional risk model factors in a systematic fashion, a cross validated LASSO regression is used. This procedure automatically drops factors which do not add to the explanatory power of the model for cryptocurrencies, while simultaneously shrinking remaining risk factor loadings towards zero to combat overfitting. An illustration of the same process applied to commodities is presented in Figure 1.
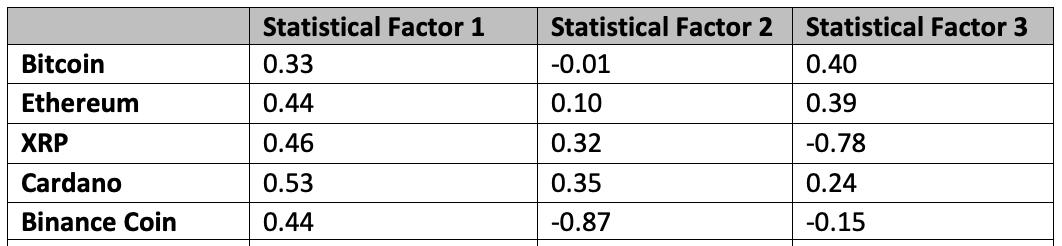
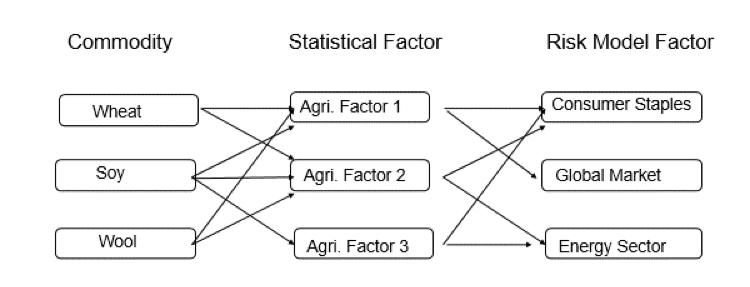
Figure 1: A conceputual diagram illustrating the stages of our modelling process.
Preliminary results show that PCA in this case picks up a crypto “market” factor which loads positively on all the major cryptocurrencies. Subsequent statistical factors tend to reflect the movement of cryptocurrencies around this market factor. These statistical factors can then be mapped onto our risk model with the LASSO regression. Some unique challenges are presented in this case by the very short history of most cryptocurrencies. One simple approach is to take Bitcoin as an indication of the crypto market and use traditional regressions to estimate “beta” to Bitcoin as a metric of risk for small cryptos that cannot be included in the original PCA cohort.
Figure 2: An example result for five cryptocurrency loadings on statistical factors for a single time period
014 Intelligent Risk - November 2022
Besides defining the cohort set, the statistical process for cryptocurrency must account for several uncommon features. The first is a very large departure from our usual independent and identically distributed (IID) return assumptions. Cryptocurrencies have exhibited high degrees of skew, kurtosis, and serial correlation in their returns. These behaviors may arise from speculative interest from retail investors, the erratic nature of interest from major financial institutions, or fear of cryptocurrencies being severely hampered by regulation (as seen recently in China).
With respect to non-IID behavior we employ four analytical nuances to improve the transformation from purely historical observation to forward looking risk forecasts. The first is the use of “root mean square” (RMS) rather than standard deviation as the measure of dispersion of factor returns. We are treating factor return time series as if markets are relatively efficient so mean returns to a factor should be close to zero, rather than whatever time series mean is observed. For example, a return time series that goes up 10% per month every month for two years (as was roughly observed with Internet stocks in the late 1990s) would have a standard deviation of zero but a significant value for root mean square.

The second technique is the idea of “range based” volatility measures, also replacing the usual definition of standard deviation of returns. One way to think about the volatility of an asset is to consider the percentage distance between the highest and lowest prices observed during a particular period (e.g. day, month, year). If the high and low prices are close together, the asset has low volatility. If the high and low prices are far apart, the asset is volatile. Several papers starting with Parkinson (Journal of Business, 1980) have shown that if returns are IID, there is a direct algebraic transformation between traditional return volatility and range-based measures. A very simplified range-based measure of volatility would just be : . For example, if we observe that a cryptocurrency had a low price of $1,000 and a high price of $3,000 over the past month, we get a volatility of =50% per month.

The third proposed input to ex-ante currency risk estimation is the availability of a “carry trade” wherein bank deposits denominated in a particular currency offer higher interest rates than in major currencies. As cryptocurrency deposit accounts do not carry any form of government deposit insurance the risk of counterparty failure is substantial. At the current time retail “Bitcoin savings accounts” are available with yields over 8% annually, as compared to close to zero for ordinary bank accounts in the US.
Our final key input is the concept of “convenience yield”. The anonymity and ease of global transactions has material economic value to certain market participants (criminals, tax evaders, investors in countries with capital controls). While this effect is hard to quantify directly there is a long history of low or negative interest rates in countries with strong banking secrecy laws. In the 1980s Swiss banks routinely offered negative interest rates on deposit accounts while US banks were offering a rate of around 5% (the maximum allowable under Federal Reserve Regulation Q until 1986).
At present, the combination of convenience yield and interest premium is probably around 12-13% which implies a volatility equivalent (i.e. inclusive of higher moments) of 70-80% annually for major cryptos. For a derivation of this relationship see Estimating an Investor’s Volatility/Return Tradeoff: The Answer is Always Six which is an extension of Rubinstein (Journal of Finance, 1976) and Wilcox (Journal of Portfolio Management, 2000 & 2003). There is also a thinly traded Bitcoin Volatility Index (BVOL) whose value has ranged from a low of around 19% to a high of 188% annualized. As of May 2022, the BVOL value was 79.3%.
015 Intelligent Risk - November 2022
In addition to large scale thefts and the possibility of being outlawed in some countries, there have been many cases of lost computer files, passwords known only to a decedent, and other situations where cryptocurrencies are inaccessible to the rightful owners. There have been successes by law enforcement or quasi self-regulation in recovering significant amounts of stolen crypto as in the Colonial Pipeline case and the recent seizure of purportedly stolen crypto valued at $3.6 billion by the US Department of Justice. Perversely this trend may decrease the acceptability of cryptocurrencies among participants seeking anonymity, decreasing the “convenience yield” premium in crypto valuation. On the other hand, East Caribbean Currency Union is the first central bank to issue a blockchain-based, central bank digital currency (CBDC), and other countries are exploring or have launched pilots. El Salvador has recently recognized Bitcoin as legal tender.
The disclosure of financial problems at Coinbase adds yet another potential operational risk for crypto participants. Unlike securities exchanges and brokerages which are highly regulated by the SEC “net capital rule” 15c3-1 (a 300 page set of rules and reporting requirements) in terms of their financial reserves, crypto exchanges are essentially unregulated. The Coinbase disclosures came about because they are a US public company not because they are a cryptocurrency exchange.
To provide a framework for modeling such event risks, we propose a simple two state model. In one state, there is an event risk incident with probability P and an expected return (loss) L with standard deviation S0. In the other state, there is no operational risk incident with probability (1-P), but there is market risk with expected return E and volatility S. We combine the two states into a single distribution using a “mixture of normal distributions” process. See Robertson and Fryer (Skand Aktuarietidskr, 1969). The resultant combined distribution will have four moments with negative skew and positive excess kurtosis. We then use the aforementioned method of Cornish and Fisher to convert to the closest fit normal distribution.
As an example, we can assume our “regular state” has 0.999 probability per day with a daily volatility of 5% and an expected arithmetic return of 0.1% per trading day. The “incident” state has a probability of 0.001 per day (P). We assume that in the event of an incident, the expected loss is 80% (L) with a standard error of 3% (S0). Including both market risk and “event” risk we get a combined equivalent daily volatility of 9.08%. Annualizing under IID assumptions we get 144% per annum. It should be noted that if we cut the incident probability to 0.0001 we get a volatility of 5.07% per trading day, just a tiny bit higher than with a zero probability of an incident.
modelling event risk stable coins
A sidelight to the cryptocurrency discussion is the matter of stable coins like Tether where a coin issuer functions like an 18th century bank issuing its own currency. Commercial banks in Hong Kong and Scotland still routinely issue their own bank notes.
016 Intelligent Risk - November 2022
To stabilize the value of cryptocurrencies at a relatively fixed value in US$ (like a pegged currency) the “custodian” holds financial reserves that purportedly assure that the stable coins have a claim on assets that can be converted to conventional currency.
However, experts including Gary Gorton of Yale, have questioned the validity of the collateral in these structures: Yale Economist Gorton Questions the Stability of Stablecoins. Lacking complete confidence in the collateral, we can treat this concern as we would counterparty risk in an OTC derivative acting in reliance on a clearing organization for sound collateral management, or a recognized credit rating for the counterparty. This view seems well justified given recent developments with TerraUSD.
On an annualized basis the return volatility of cryptocurrencies looks enormous (80% for the majors, far higher for many of the lesser known). Investors are depending on high liquidity to allow them to exit an asset quickly to limit losses. Under typical IID assumptions, 80% per annum is about 5% per trading day, so a three standard deviation event is a 15% loss per trading day. Even if we “fatten the tails” consistent with a T-5 distribution we end up around a 20% loss.
However, it should be noted that liquidity is not infinite for any asset. On October 19, 1987, the US stock market lost $1 trillion in capitalization (a roughly 22% decline) when the NYSE DOT execution system was overwhelmed. This massive decline was the result of only $15 Billion in trading volume. While the core blockchain capacity for Ethereum was significantly upgraded in 2021, crypto transactions done on “Decentralized Finance” peer-to-peer networks are highly vulnerable to disruption which could lead to extreme cases of “jump diffusion” in prices.
conclusions
Our proposed analytical process for crypto risk is closely related to our current practices for commodities and frontier currencies. This process makes for relatively simple integration with risk models for other asset classes.
The assessment of volatility and market risk is highly dependent on a nuanced understanding of the extent of non-IID returns with unstable means. If we include operational risk, the resultant volatility estimates are extremely sensitive to the probability of an “incident”. Even seemingly low probabilities like 1 in 1,000 create a profound increase in volatility equivalence and joint measures of market and operational risk (e.g. Value at Risk).
liquidity as the risk mitigation method
017 Intelligent Risk - November 2022
Carl Densem peer reviewer
authors
Thomas (T.J.) Blackburn
Thomas (T.J.) Blackburn has worked in the finance industry since 2014, after receiving his PhD. in physics in 2013. After an internship at Northfield Information Services, he worked at BNY Mellon and then State Street from 2015-2019. He has since returned to a Northfield as a senior risk analyst.
Dan diBartolomeo


Dan diBartolomeo is President and founder of Northfield Information Services, Inc. which develops quantitative models of financial markets. He has prominent roles in numerous industry organizations including PRMIA, IAQF, and CQA. He is a director and past president of the Boston Economic Club. His publication record includes more than fifty books, book chapters, and peer-review journal articles. In addition, Dan spent several years as a Visiting Professor at Brunel University. He has been admitted as an expert witness in litigation matters regarding investment management practices and derivatives in both US Federal and state courts. He became an editor in chief of the Journal of Asset Management at the start of 2019.
William Zieff
William Zieff is Director at Northfield Information Services. Bill has extensive experience in quantitative investing. Prior to Northfield, he was Chief Investment Officer of Global Strategic Products, Wells Fargo Asset Management; Partner and Co-Chief Investment Officer of Global Asset Allocation, Putnam Investments; and Director of Asset Allocation, Grantham, Mayo, Van Otterloo. Bill has taught master’s and undergraduate courses in quantitative finance. Bill holds an A.B. degree in Economics and Mathematics from Brown University and MBA from Harvard Business School.

018 Intelligent Risk - November 2022
The Federal Reserve’s efforts to manage inflation depend on its use of two main policy instruments. This article examines the impact of each of these instruments on inflation and how they are currently being used by the Fed to combat the recent surge in inflation.
by Aleksei Kirilov & Valeriy Kirilov
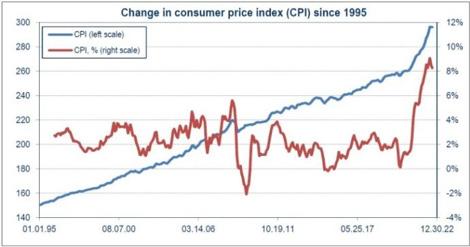
Everyone has been talking about inflation lately: housewives, businesspeople, investors, officials. Indeed, the Americans have not seen such inflation for decades, see Figure 1. That is why the Fed says that the fight against inflation is its main task. In its analysis, the Fed uses the Consumer Price Index (CPI) as a measure of inflation. This indicator is calculated every month by the Bureau of Labor Statistics. A percentage value is usually used, showing how the index has changed compared to the same month a year ago. But no less representative is the absolute value of the index. Figure 1 shows both the absolute and relative values of the index since 1995.
Figure 1 Figure 2
Source: https://www.bls.gov/cpi/
inflation and its drivers Intelligent Risk

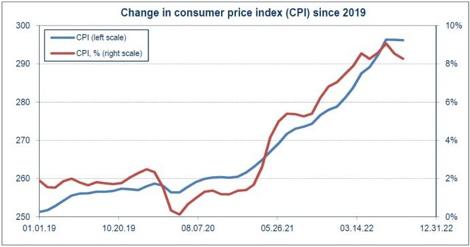
A noticeable acceleration of inflation began around March last year, and then this growth became more and more strong, see Figure 2. Recall that back in July 2021, we wrote that the Fed needs to immediately complete the quantitative easing program to prevent further inflation growth1. And that otherwise the economy will inevitably face a strong surge in inflation. However, the Fed began to take real steps to combat inflation only in March of this year. First the Fed raised the rate by 0.25% and then, a month later, began to reduce its balance sheet.
November
019
-
2022
Synopsis 1 / Aleksei Kirilov, Valeriy Kirilov. U.S. Economic Recovery Mirrored in the Stock Market. Intelligent Risk (PRMIA), July 2021, https://issuu.com/prmia/docs/intelligent_risk-july_2021-issuu
In discussions about the reasons for such a sharp increase in inflation, the assumption of the dominant role of commodity prices and, above all, the price of oil is often expressed. Indeed, if we compare the change in CPI with the price of WTI over the past few years, then such an assumption seems quite appropriate, see Figure 3. The correlation coefficient of these two parameters over a relatively short interval of about 5 years was 74%. The figure shows data from Crude Oil Prices: West Texas Intermediate (WTI) - Cushing, Oklahoma, Dollars per Barrel, Monthly, Not Seasonally Adjusted.
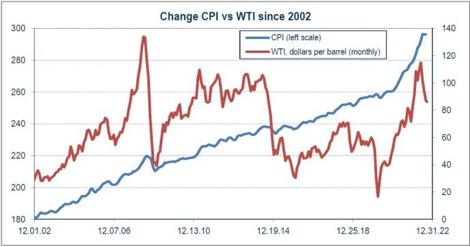
Figure 3
Source: : https://fred.stlouisfed.org/series/MCOILWTICO
Figure 4
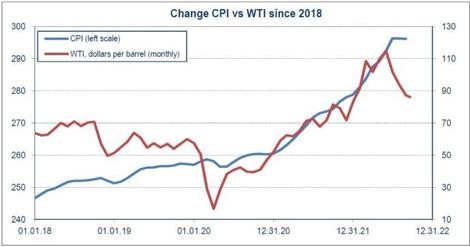
If we look at the dynamics of changes in parameters over a longer period of time, then such a conclusion seems rather controversial. Figure 4 shows data on changes in CPI and WTI prices over the past 20 years. At this time interval, the correlation coefficient of CPI and WTI is only 21%. Of course, macroeconomic conditions have changed a lot over the past 20 years. Perhaps the prices of commodities are not the main reason for the recent surge in inflation.
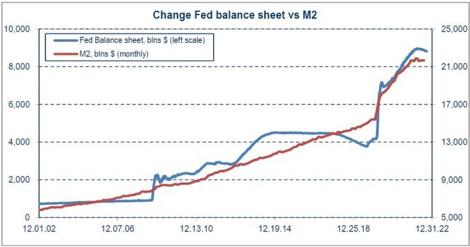
Recall that during the pandemic and even after it ended, as part of the quantitative easing program, the Fed added a huge amount of liquidity to the market by buying Treasury and mortgage bonds, greatly increasing its balance sheet. This caused the sharp growth in the M2 money supply. In addition, huge funds have been allocated by the government, with the approval of Congress, to help households and businesses. This led to even greater growth in the M2 money supply. To put this in perspective: from February 2020 to April 2022, the Fed’s balance sheet increased by $4,806.8 billion. According to the Fed, M2 increased by $6,477.2 billion over the same time.
Figure 5
Source: : https://fred.stlouisfed.org/series/WALCL
Figure 6
Source: https://fred.stlouisfed.org/series/M2NS
020 Intelligent Risk - November 2022
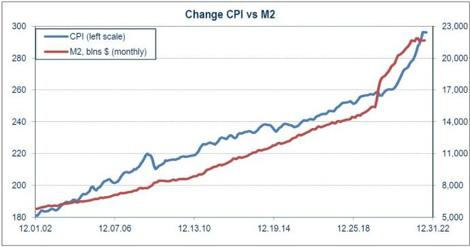
The change in the balance of the Fed and M2 over the past 20 years is shown in Figure 5. Of course, the supply of huge monetary liquidity in the market was bound to lead to higher prices. And this includes the rise in prices for oil and other commodities. Undoubtedly, disruptions in supply chains have also contributed to price increases, but the increase in the money supply was probably the decisive factor. Figure 5 clearly shows that starting from February 2020, there has been explosive growth in the Fed’s balance sheet and the M2 money supply.
Changing M2 is very similar to changing CPI. This is clearly seen in Figure 6, on which both parameters are plotted. On a twenty-year interval, the correlation coefficient of CPI and M2 is 96%. See Appendix for the statistical tests performed, confirming our assumption that the current surge in inflation is largely due to an increase in the money supply.
Figure 7 Figure 8
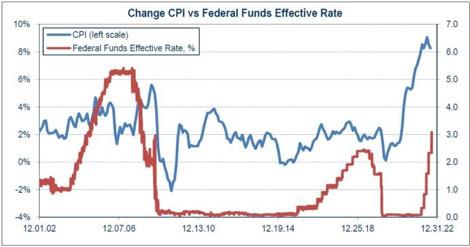
In an effort to reduce inflation, the Fed is aggressively raising interest rates, see Figure 7. However, as can be seen, until this approach has brought the desired results, inflation remains unacceptably high. Of course, by continuing such a policy –increasing the cost of money– in the end it will be possible to achieve a reduction in inflation to an acceptable level. According to our estimates, the Fed will have to raise the rate above 6% for this. Which, given current policy, could take many months.
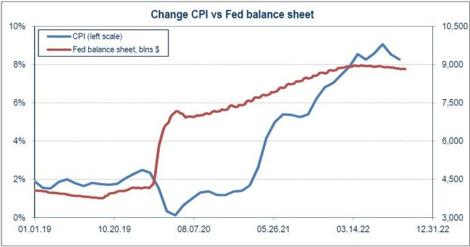
Perhaps a more effective decision would be for the Fed to reduce its balance sheet more quickly, see Figure 8. Moreover, inflation is caused to a large extent, as we have shown, by a disproportionately large money supply. So far the Fed is not implementing its own plans to reduce the balance sheet.
It should be noted that the belated measures taken by the Fed to combat inflation led to extremely negative consequences for the stock market. First to the bubble in the market towards the end of last year. And then to a sharp decline in the stock market this year, which is probably far from over. So far, the Fed has been able to prevent the market from collapsing, but a further strong increase in interest rates and a simultaneous sharp decrease in the balance sheet may at some point lead to a panic sale, triggering margin calls and a series of bankruptcies of large financial companies. To prevent such a scenario, the Fed should probably choose only one of their available instruments: either a further increase in interest rates or a sharp decrease in the balance sheet. Judging by previous actions, the Fed intends to choose the first option. 021 Intelligent Risk - November 2022
However, such a decision threatens to have serious negative consequences for the economy due to the long-term persistence of inflation and interest rates at extremely high levels. According to our estimates, if the Fed’s current policy is maintained, inflation could remain above 6% for at least another 12 months.
appendix: testing the relationship between CPI and M2
Note that both time series, CPI(t) and M2(t), are non-stationary so spurious regression is possible. This is tested for using the Durbin-Watson statistic, which, in this case, is 0.022, indicating positive autocorrelation.
Therefore, it is necessary to additionally check whether the dependence of CPI(t) on M2(t) is statistically significant. At this first stage, we check the data on the Sims test for Granger causality. To do this, we build regressions of CPI(t) from past, current and future values of M2(t). The entire time interval is divided into three equal segments of 82 months. The results are as follows: regressions from past and current values of M2(t) are not significant based on both t-statistics for the coefficients and F statistic for the equations. For the regression of CPI(t) from future values of M2(t), significant results were obtained:
• the coefficients are 0.81543 and -0.00061, respectively
• the t-statistics for the coefficients are 4.57 and -6.78, respectively, which is much higher than the critical value of 1.99. Therefore, the obtained values of the coefficients are significant
• the F statistic is 45.93, well above the critical value of 3.96
Thus, the Sims test for Granger causality is positive.
Second, an additional test for cointegration is carried out. As can be seen in Figure 6, both time series show clear trends. Using the least squares method, the trend components were identified in the form of a linear dependence:
Then, for each of the series under consideration, the residuals CPI - Trend(CPI) and M2 - Trend(M2) were calculated. A regression was built for the residuals CPI - Trend(CPI) from M2 - Trend(M2) over the last ten years:
The t-statistics for the coefficients are 8.52 and -2.45, respectively, which is higher than the critical value of 1.98. Therefore, the obtained values of the coefficients are significant. The F statistic is 72.7, well above the critical value of 3.92. Therefore, the obtained regression equation is significant.
That is, CPI - Trend(CPI) can be represented as a linear dependence on M2 - Trend(M2) plus the remainder of the next order of smallness. Thus, CPI - Trend(CPI) and M2 - Trend(M2) are cointegrated. This means that there is a statistically significant relationship between CPI(t) and M2(t).
022 Intelligent Risk - November 2022
peer reviewer
Dan diBartolomeo
authors
Aleksei Kirilov
Conflate is a Russian management consulting company specialized in strategy, risk management, asset management and venture investment. As the partner of Conflate, Aleksei is responsible for asset management and venture investment. He specializes in the US stock and debt markets. Aleksei has more than 15 years of experience in financial services including development of financial strategy and financial KPI, liquidity management; controlling system, allocation of expense on business unit, financial modeling and debt finance. He has cross industries experience: banks, oil & gas manufacturing, real estate.
Aleksei has an MBA from Duke University (Fuqua School of Business), a financial degree from Russian Plekhanov Economic Academy and an engineering degree from Moscow Engineering Physics Institute.
Valeriy Kirilov


Valeriy is the General Manager at Conflate LLC. He has 15+ years’ experience in risk management and management consulting (BDO, Technoserv, then at Conflate). Besides he previously worked in the nuclear power industry (safety of Nuclear Power Plants).
Valeriy has an MBA from London Metropolitan University as well as a financial degree from Moscow International Higher Business School MIRBIS and an engineering degree from Moscow Engineering Physics Institute. He holds the PRM and FRM certifications and the certificate of Federal Commission for Securities Market of series 1.0. Valeriy was a member of the Supervisory board of the Russian Risk Management Society in 2009 – 2010.
Partner, Conflate LLC General Manager at Conflate LLC
023 Intelligent Risk - November 2022
Synopsis
Industry experts share their opinions on the cyber security challenges posed by the explosion of technology devices and data.
becoming cyber resilient in a new threat landscape
 by Michael Balfiore & Sara Downey
Experts discuss how to safeguard data amidst heightened vulnerability, a privacy conundrum and an AI paradox.
Will quantum computing break cybersecurity? How much responsibility should individuals have for safeguarding their data? How can organizations foster a culture of security? In May 2022, cybersecurity experts convened on a panel at Dell Technologies World to answer these questions and more.
Participants included data scientist Chris Wylie, best known as the Cambridge Analytica whistleblower, Bhavani Thuraisingham, founding executive director of the Cyber Security Institute at the University of Texas at Dallas, and Vivek Tiwari, vice president of Product Assurance and Security at Intel. Their conversation was moderated by John Scimone, president and chief security officer at Dell Technologies. He asked the panelists to weigh in on what they see as today’s gravest security challenges—given that, as Scimone mentioned frankly, cyber threats are getting worse each quarter, by every measure.
the data threat
We are living in the data age. On the one hand, we have never created and captured so much data. On the other, there are gaps in our data sharing. Companies are still reluctant to share their attack data. As Thuraisingham notes, this is problematic. We need this intelligence to identify groups of threats that behave similarly and use these discoveries to predict an attacker’s next step.
There was general agreement that the proliferation of data represents a double-edged sword. Wylie cited the weaponization of information as a significant threat. “If you radicalize people, and those people then go on to commit harm, you’ve created a weapon,” he said.
Intelligent
- November
Risk
2022
024
Scimone called out the mushrooming of data created by the ever-expanding internet of things as another challenge to security. “The explosion of technology devices creates exponentially more potential to do really good things,” he said, “but also really nefarious things.”
Thuraisingham agreed. “We’ve got data arriving continuously, so machine learning models have to change,” she said. “We [have to] come up with dynamically changing models,” she said of artificial intelligence (AI) designed to fend off attacks.
When it comes to AI, the panel noted an interesting paradox. Tiwari talked about “AI for security” and “security for AI.”
AI—the very technology that can help threat detection solutions find anomalies in the network and act as a co-pilot in secure development, secure coding and secure assurance—can also be wielded by cybercriminals. The same technology that protects companies could also be used by hackers to inflict unrelenting, automated attacks that any human would struggle to combat, as well as represent a new set of “attack surface” that hackers can manipulate and exploit to cause the AI systems to have unintended effects.
As a path forward, Tiwari talked about protecting the models and data that are integral to AI algorithms, using confidential computing, secure enclaves and trusted domains. He cautioned that these measures need to be built into every product as every product now has AI.
While secure product development is foundational, the insider threat is also a cogent factor. Scimone noted that he found the stat in Dell’s recent Breakthrough study, showing more than half (52%) of workers have not meaningfully improved their security awareness/behavior after hearing about high profile cyberattacks “a little disheartening.”
the AI paradox whose responsibility is it?
” When it comes to the general population, I think it’s actually unfair to expect that people should become more security conscious.”
025 Intelligent Risk - November 2022
Chris Wylie, social researcher and data scientist
According to Tiwari, businesses can move the needle by building a culture of security. This culture starts with leaders clearly articulating the security strategy, vision and principles. Then you need to provide processes to enable employees to implement these. For instance, with secure development lifecycle. Of course, you need a robust training program which is tied into the company’s recognition system metrics to gauge your security culture’s effectiveness.
Tiwari emphasized that security is the responsibility of everyone in an organization. Wylie disagreed.
“When it comes to the general population, I think it’s actually unfair to expect that people should become more security conscious,” Wylie said. Instead, Wylie essentially argues that safety standards should be built into digital technologies just as they are with physical products.
the privacy conundrum
Noting that Dell Technologies World 2022 took place in Las Vegas, a city known for extensive video surveillance in its casinos, Scimone asked the panelists for their opinions on how to weigh security concerns against the need for privacy.
For Tiwari, it comes down to clear, transparent and enforceable policies. “I think as long as you work within those principles and guardrails, you can find the right technological solutions to address those things,” he said of balancing privacy and security. “And be ready to have that engagement with government agencies, with policy bodies, because you have to do this openly.”
Thuraisingham returned to AI’s prevalence as a reason why trustworthy AI is so important. If it’s in most products and making decisions based on the data it collects, it needs to be secure, private and fair.
Wylie noted that a vital element getting lost in most privacy discussions is the idea of human agency. “When we’re creating systems that constantly are collecting data, and then using that data to start to alter information in front of you,” he said, “those are starting to scratch at fundamental things about who you want to be as a person, how you want to interface with society.” In other words, people using such systems risk losing their autonomy. “How do you grow as a person when you’ve got an information system that is constantly deciding things for you?” he asked.
10 years from now
Looking ahead at the next five to 10 years of cybersecurity, Tiwari said he expected challenges to include physical security, supply chain attacks and weaponized AI. Even so, he sees the threat landscape improving for businesses and individuals thanks to dedicated efforts to combat attacks.
026 Intelligent Risk - November 2022
Thuraisingham worries about quantum computing in the hands of future attackers. “I dread to think what’s going to happen to cybersecurity—although it’s going to help with ransomware.” That’s because the brute force computing power promised by quantum computers threatens to smash all existing encryption schemes.
Thuraisingham is encouraged by ongoing work on post-quantum encryption but considers getting more talent into the field, including women and people of color, as vital to success.
“It’s a very monolithic industry,” Scimone agreed. “In five or 10 years, we should look very different and have a lot more horsepower on our side.”
Carl Densem peer reviewer
authors 027 Intelligent Risk - November 2022
Contributor Thought leadership, Dell Technologies
Michael Balfiore Sara Downey
Synopsis
This article explores how potentially complex physical and transition climate risk outcomes regarding obligor creditworthiness can be assessed and predicted via modelling scenarios. The examples provided by the authors regarding resultant probability of default provide a useful and comprehensive guide on how these methodologies can be extended to IFRS 9 accounting reporting, regulatory credit risk measurement, and forecasting.
the climate risk impact on corporate default rates
by Francesca Bell & Gary van Vuuren
The effects of climate risk drivers on financial risks are complex and interrelated. Although current research practices have embraced a wide spectrum of methodologies for how these risks may be examined, much focus has been on the impact of climate change on macroeconomic systems rather than on corporates. Borrowing from bank-focused research by the Basel Committee on Banking Supervision (BCBS, 2021) on the ways in which climate risk drivers foment financial risks, this work synthesises contemporary approaches to create a single, entwined methodology based on several research strands. The framework demonstrates how climate-related changes may be incorporated into corporate financial risks, such as PDs (and potentially both LGDs and EADs as well).
Environmental, social, and governance (ESG) issues are an important contemporary part of corporate evaluations (Ahmad, Mobarek, & Roni, 2021). Climate risk drivers (‘E’ in ESG) are classified as physical or transition risk. Physical risk arises from the physical effects of climate change on corporate operations such as the workforce, infrastructure, raw materials, markets, and assets. Acute physical risks are severe weather-driven events such as floods and fires; chronic physical risks involve longer-term climatic shifts which may result in precipitation/temperature changes or elevated sea levels. Transition risk represents societal changes (such as progress toward affordability of existing technologies and changes in public sector policies) arising from the transition to a low-carbon economy.
We assessed the impact of transition and physical climate risk on obligor creditworthiness using two well-known financial tools: geometric Brownian motion (GBM) to simulate share prices and return volatilities, and the KMV model to estimate probabilities of default (PDs). This evaluation may be translated into a measure of default probability, which may be used in IFRS 9 accounting reporting, regulatory credit risk measurement, and forecasting.
Intelligent Risk - November 2022 028
The recipe is:
1. Simulate share prices using realistic parameter inputs, such as volatility and drift, using GBM
2. Introduce realistic shocks at relevant frequencies and severities
3. Record resulting average asset values (via share prices) and equity volatilities at selected time intervals after the introduction of the shock(s)
4. Input these asset values and equity volatilities into the KMV model to estimate the distance to default (DD)— and hence the change from unshocked DDs.
Simulated data were used as loss data are sensitive and proprietary. The evolution of corporate asset and liability values was processed using a GBM approach with a range of stylistic annual volatility and drift values to simulate ten years of weekly share prices. Shocks were introduced at different times with varying severity as a percentage of the stock price at the time of the shock. Frequency and severity of shocks may be selected by the user.
Outputs from the GBM analysis become inputs for the KMV model (similar to Baarsch & Schaeffer’s [2019] approach), and here again, simulated, realistic parameters for liability levels, risk-free rates, etc., are used.
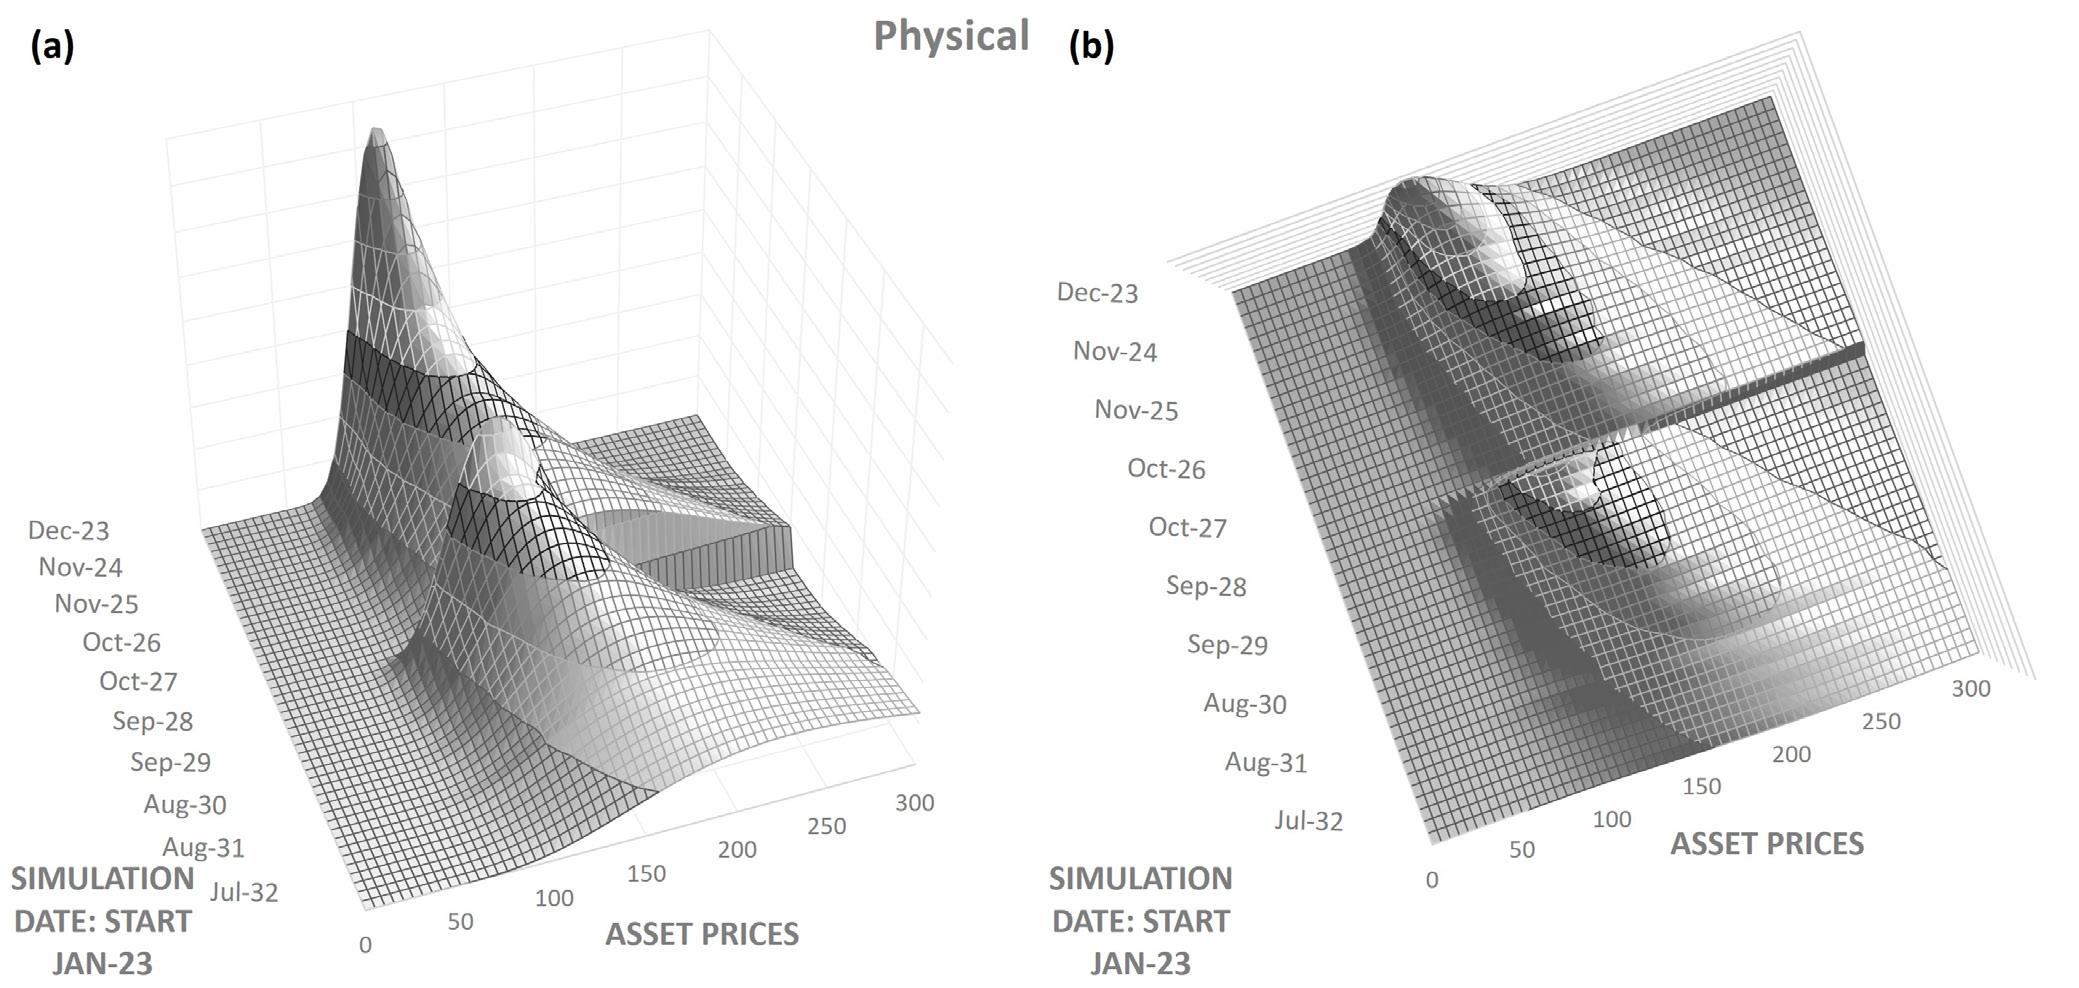
Figure 1 shows a 3D view of the results of our simulations. At each timestep, the mean and standard deviation of the distribution of possible share prices are used to plot the log-normal distribution of outcomes. A shock (in this example a -40% share price shock) is then introduced at time t (in this example halfway through the 10-year simulation). Prices after physical shocks have increased volatilities while those for transition shocks do not.
Figure 1: Simulated log-normal distributions (side and plan view) of share prices for a 40% share price shock occurring halfway through a ten-year simulation cycle, due to (a) a physical climate risk event and (b) a transition climate risk event.
029 Intelligent Risk - November 2022
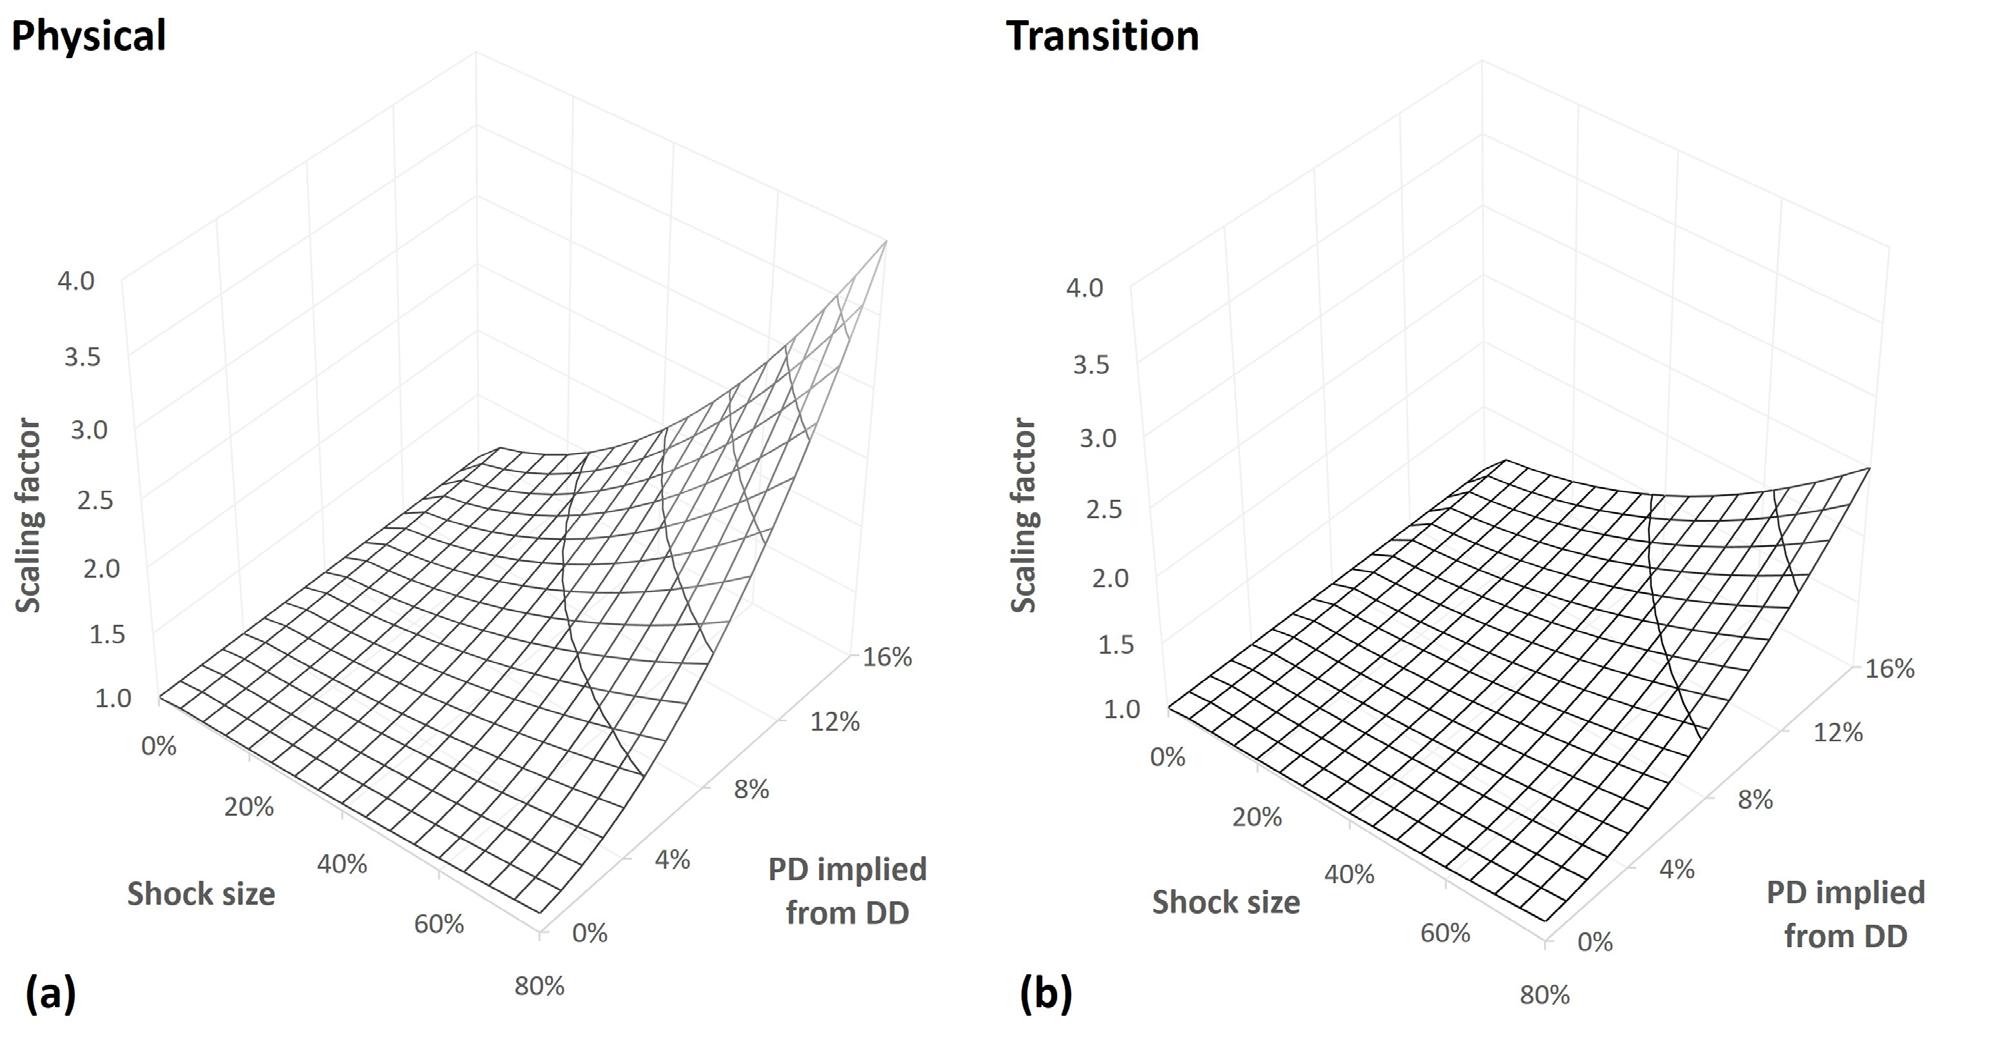
The outcome of the analysis is shown in Figure 2. The scaling factor, applied to unshocked PDs (z-axis) has been plotted as a function of shock size and original PD to which the climate-related shock has been applied. As expected, the scaling factor increases as a function of both parameters (shock severity and original, unshocked PD) for both physical and transition climate events. Such a calibration can be applied to a firm’s obligors to assess forward looking PDs, dependent on climate shocks.
Figure 2: Scaling factor to be applied to unshocked obligor PDs for (a) physical and (b) transition related climate events as a function of shock size and unshocked PD. Again, note the same vertical scale for comparison.
A way to quantify and calibrate climate related impacts on corporate PD levels – whether of physical or transition origin – has been demonstrated. Inputs are subjective and user-determined; obligors have unique price drifts and volatilities, and shock scenarios vary by type, severity, and frequency. However, this provides considerable flexibility. As more climate related events are added to the literature and global databases, specific climate events will eventually be linked to specific shock sizes. These results will benefit IFRS-9 compliant market participants (for forward-looking scenarios of obligor credit quality) but also for loan pricing which uses obligor PDs and regulatory capital calculations (which require knowledge of PDs at multiple maturities, not just one-year).
Bibliography
Ahmad, N., Mobarek, A. and Roni, N. N. 2021. Revisiting the impact of ESG on financial performance of FTSE350 UK firms: Static and dynamic panel data analysis. Cogent Business & Management, 8(1): 1 – 18.
Baarsch, F. and Schaeffer, M. 2019. Climate change impacts on Africa’s economic growth. United Nations Economic
030 Intelligent Risk - November 2022
Commission for Africa report, African Development Bank Group. Available from: https://www.afdb.org/sites/default/files/documents/publications/afdb-economics_of_climate_change_in_africa.pdf, accessed 13 Feb 22.
BCBS, 2021. Climate-related risk drivers and their transmission channels. Available from: https://www.bis.org/bcbs/publ/d517.pdf, accessed 17 Apr 22.
IPCC, 2018. Intergovernmental panel on climate change special report: global warming of 1.5°C. Available from: https://www.ipcc.ch/sr15/, accessed 16 Apr 22.
Mapchart. 2022. Available from https://www.mapchart.net/africa.html, accessed 17 Apr 22.
UNCTAD, 2022. UN list of least developed countries. Available from: https://unctad.org/topic/least-developed-countries/list. accessed 16 Apr 22.
Elisabeth Wilson peer reviewer
authors
Francesca Bell
Francesca Bell is a quantitative financial analyst working at the boutique consultancy RiskWorx in Johannesburg, South Africa. She underwent her undergraduate education at the University of Cape Town. Now a postgraduate student, she is currently about to complete her PhD in finance and economics at the University of the Witwatersrand specializing in the connection between environmental, social, and governance (ESG)-related issues and finance. Her first published article for the degree covered ESG-efficient frontiers: investment strategies which embrace and encourage ethical, socially responsible, climate-friendly asset allocation.
Gary van Vuuren
Although Gary van Vuuren started his career in astro and nuclear physics, he is now a professor of quantitative finance and statistics at the University of the Witwatersrand, South Africa and the Centre for Business Mathematics and Informatics, North-West University in Potchefstroom.
He is a freelance risk management advisor, working for RiskWorx, EY Johannesburg and other niche finance consultancies. He has supervised dozens of postgraduate students’ research. He is Francesca’s Masters supervisor and co-author on the ESG frontier paper.


031 Intelligent Risk - November 2022
Synopsis
While all central banks walk a precarious line in taming inflation, the Fed has an unprecedented chance to tamp down prices and buy itself valuable breathing room to use rate cuts in the future, when necessary. Returning to ‘normal’ rate territory sooner will balance the Fed’s competing priorities and challenges.
normalising US interest rates: the Fed can move beyond taming inflation by
Divyansh Awasthi
The pace of inflation growth has come as a rude shock to monetary policymakers this year. The rise has been sharp enough to have woken them from their slumber.
Central banks around the world, with the exception of those in China and Japan, have adopted a generally hawkish tone on inflation. But among the largest central banks, one finds itself in a situation which can allow it to normalize policy rates and not just tame inflation.
This is not to say that the task of the US Federal Reserve – or specifically the Federal Open Market Committee (FOMC) – is easy. But among advanced economies, it finds itself in a spot where it can think of normal interest rates as a larger aim than just controlling inflation.
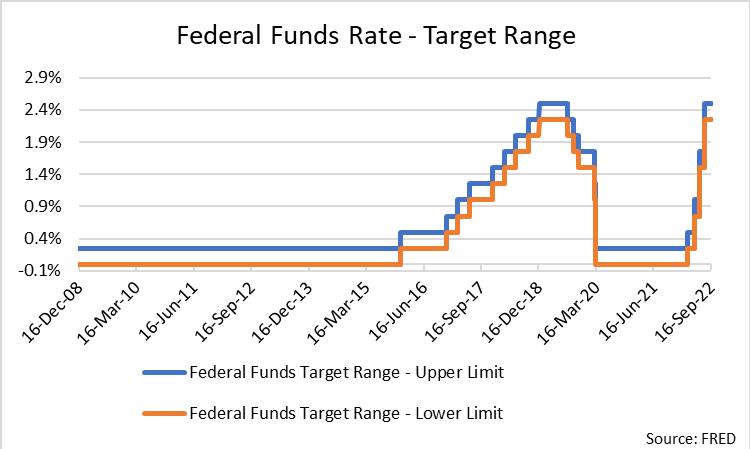
Figure 1: US Fed Funds Rate
Source: https://fred.stlouisfed.org/series/FEDFUNDS
Intelligent
- November
032
Risk
2022
normalized
monetary policy rates
Let us first look at what normalized interest rates mean.
During recessionary times, a central bank of a nation may reduce interest rates as a way to stimulate economic activity. A reduced policy rate induces commercial banks to reduce their lending and deposit rates. This incentivizes consumers to deposit less with banks and spend more, because of cheaper loans, and thus attempts to stoke economic growth.
Once the economy is out of recession and is considered to be on stable ground, the central bank increases its policy rate back to where it was before the downturn to a level which is considered ‘normal.’
This is one of the steps the FOMC took, first to support the economy out of the global financial crisis (GFC) of 2007-08 and then in the aftermath of COVID-19.
Prior to effecting a stimulative monetary policy during GFC, the effective federal fund rate (EFFR) stood at around 5.25%. Then, from December 2008 until the rate hike in December 2015, this rate remained in the 0.07% to 0.23% range.
Though the rate increased thereafter –returning to 2.43% in April 2019–, the FOMC effected stimulative policy again later that year because of stagnating growth, and then decreased it sharply in response to the disruption in economic activity caused by COVID-19. This led the rate to fall down again. Even after several rate hikes in 2022, the EFFR stood at 3.08% in early October.
monetary policy rates and inflation
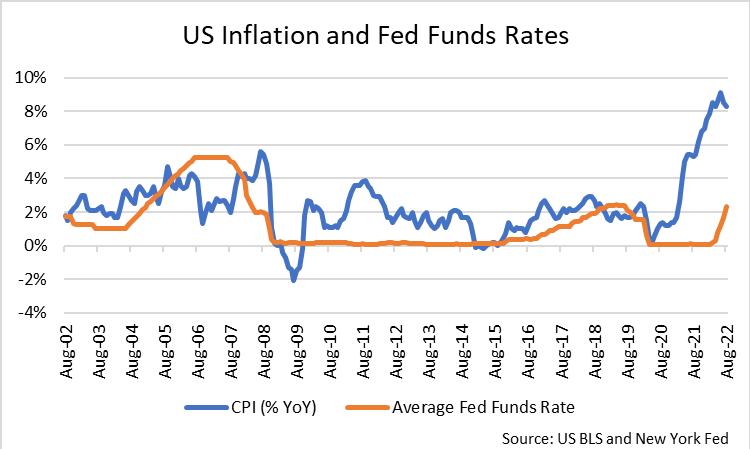
Though it may seem that the EFFR is on the right track, we need to look at the rate in light of prevailing inflation, shown in Figure 2 below:
Figure 2: CPI and the Fed Funds Rate
Source: https://fred.stlouisfed.org
033 Intelligent Risk - November 2022
This graph provides a lens into the aforementioned information on the fed funds rate with the perspective of prevailing sharp increase in prices.
As can be seen, not only is the EFFR nowhere close to its pre-GFC level of 5.25%, it is woefully short of where it should be given decades-high inflation in the US. At the current rate of inflation, the EFFR should be close to the 5.50% mark.
Though this may seem quite high compared to its level at the time of writing, the EFFR had been over the 7% level in June 2000. For reference, during that month in history, CPI inflation had risen at 3.70% yearover-year compared to 8.25% in August 2022. Also, the labor market was not as tight with unemployment at 4% as compared to 3.50% in September 2022.
In an interview on Bloomberg Television in early September 2022, former New York Fed President Bill Dudley observed that the then prevailing EFFR of 2.33% was “well, well below what you would consider to be neutral in this current inflation environment.”1
So, a level of EFFR in the 5%-5.50% range for even a short amount of time does not seem as unthinkable as it may have been at the beginning of 2022, not just because of the level of prevailing inflation but because of the factors which seem to be causing it.
Though the FOMC has tried normalizing the fed funds rate in the past as can be seen in Figure 2, global events like the GFC have prevented it from doing so. At other times, the Fed has been hesitant to raise rates for fear of hurting economic activity.
But the current conditions, as challenging as they are, provide a great opportunity for the FOMC to normalize at least the fed funds rate part of its monetary policy toolkit.
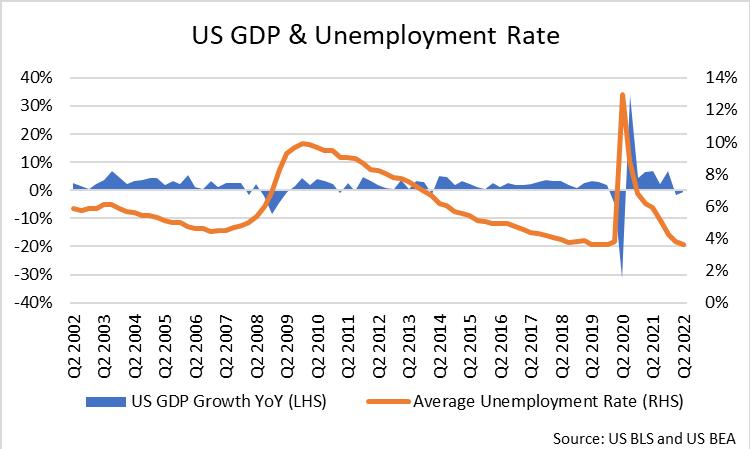
Figure 3: US GDP and average unemployment
Source: https://fred.stlouisfed.org
opportunity to normalise policy rates
/
034 Intelligent Risk - November 2022
1
https://www.bloomberg.com/news/articles/2022-09-09/fed-to-keep-rates-tighter-for-longer-than-expected-dudley-says
The labor market is tight, as seen by the low rate of unemployment in Figure 3 above, and economic growth, though experiencing a slight decline, is in reasonable shape with consumer spending holding up.
Further, unlike most other developed economies, especially those in Europe, the US is not facing a severe energy crisis or conflict. Unlike China, it is not facing a deteriorating property market and military tensions with immediate neighbours.
This allows the Federal Reserve to be more aggressive than any other developed economy central bank in hiking rates. Not only will that help rein in inflation quicker, it will also allow room for the central bank to reduce rates if and when it needs to in the future. This has been a big concern for central bankers in the past: that they have not had substantial room to cut rates were they to face a major recession.
conclusion
Several economists expect the global economy to undergo a recession some time next year. If this happens, the US will find itself in a far stronger condition to tackle a recession, regardless of severity, than if it were to go easy on raising policy rates. If the policy rate, which is in the 3%-3.25% range at present, is raised substantially, it will help tackle inflated prices, increase the rate to more normal levels, and give the Fed enough room to cut rates when required. Raising rates would also loosen up the labor market which is required to decrease inflation. Despite the Fed’s several challenges, it finds itself in a great position to normalise interest rates – something that has not happened in this millennium, and something that has manifold benefits which extend beyond slower price increases.
peer reviewer
Steve Lindo
Divyansh Awasthi
Divyansh Awasthi is a financial/capital markets professional with 16 years of overall experience, during which he has worked on buy-side investment analysis and macroeconomic research on developed, emerging, and frontier economies as well as research on fund vehicles like mutual funds and exchange-traded funds (ETFs). He has been privileged to have worked in world-class corporates and fintech startups and has had his work published and cited across fora. He is currently employed as an Investment Specialist at RocSearch and researches on different investment themes and markets for a UK-based wealth management firm. His focus is on macroeconomic and fund-related research.

author 035 Intelligent Risk - November 2022
Synopsis
The Insurance industry could potentially play a greater constructive role in mitigating climate risk by aligning with entities that scrupulously incorporate environmental, social, and governance (ESG) aspects in their business philosophy.
potential role of insurance sector in mitigating climate risk
by Sonjai Kumar
Climate risk is emerging as the major environmental threat putting the life and livelihood of masses at stake. In particular, reducing carbon emissions is essential to mitigate climate risks. In reaching a zero carbon level by 2050, every sector has a critical role and the insurance sector is active in achieving the ambitious target to decarbonize the environment.
The insurance sector is one of the leading investors in capital markets and in a strategic position to align their investment to reduce carbon emissions. Similarly, underwriting is another area where insurance companies can contribute by not insuring firms that are carbon intensive. They can even provide some concessions in premium to entities that are environmentally friendly or load a higher premium for companies that emit carbon.
In 2021 the United Nations Environment Program created an alliance of 29 leading insurance companies – comprising more than 14% of global premium volume – named “Net-Zero Insurance Alliance” (NZIA). The group has committed to restrict global greenhouse gas emissions by 2050 by setting up independent underwriting criteria, developing insurance and reinsurance products supporting net zero transition, improving claim management in an environmentally sustainable manner, integrating risk criteria into risk management frameworks, transition of investment portfolio, and other objectives.
Identifying the nuances of how insurance companies are trying to make impacts in line with the objectives set by NZIA members towards achieving the net zero position by 2050, as agreed in the Paris Agreement, will have to be institutionalized.
To put it in perspective, according to the United Nations climate action, global temperature needs to be restricted to 1.5 degrees above the pre-industrial level (late 1800s) to make earth sustainable. The earth is already warmer by 1.1 degrees compared to the pre-industrial level. As per the Paris Agreement, carbon emissions need to be reduced by 45% by 2030 to reach net zero position by 2050.
Intelligent Risk - November 2022
036
Insurance companies across the world are committed to support the achievement of net zero position by 2050. Aviva, one of the largest UK insurers, is committing to achieve net zero position by 2040, earlier than targeted. India too is active in pursuing the goal.
Insurance companies are major investors of customers’ money into bonds and equities in different sectors. To achieve the net zero position, they intend to reduce their investment exposure to high carbon producing industries. For example, Aviva is planning to reduce investments in carbon intense sectors by 25% by 2025 and 60% by 2030; another European player Legal and General is committed to reducing investment portfolio greenhouse gas emissions intensity by 50% by 2030.
Different players are using their own targets based on their bottom line by reducing the investment in carbon related footprints. AXA Group is planning to reduce investment to 20% between 2019 and 2025. UK insurer, Legal and General, reduced greenhouse gases associated with their investment portfolio by 17% in 2021 compared to the previous year. Similar reductions of investment in greenhouse gas-emitting industries are taking place on other continents, such as North America where insurance companies have set their own reduction targets.
Similarly, insurance customers can make a choice of associating with companies that have the least investment exposure to carbon-producing entities as part of a better ideology. Such investment emissions can be calculated as described in the PCAF (2022) GHG emissions document addressing insurance and reinsurance underwriting portfolios:
Underwriting is another area through which insurers can try to restrict carbon emissions by not providing insurance to thermal coal industries or companies whose revenue is more than a certain percentage (say 5%) from thermal coal. According to the white paper, insurance companies can set sector-specific underwriting criteria that align with the 1.5°C net zero transition pathway. According to some leading insurance companies, discussions are also underway on net zero underwriting, but it is still early days to develop such a mechanism.
On the governance front, insurance companies are gearing up to take strategic decisions on achieving net zero by their set target dates. Many companies are aligning their remuneration structure in Europe and Canada by the achievement of carbon footprint targets. Aviva has set its long-term incentive plan weighting at 10% for meeting ESG metrics; additionally, they have set the directors’ remuneration weighting at 20% of the long-term incentive plan of 2022-24 baseline on ESG metric.
1 / PCAF Insurance-Associated Emissions Scoping Document. https://carbonaccountingfinancials.com/files/2022-03/pcaf-scoping-doc-insurance-associated-emissions.pdf?031a1633b0
role of insurance companies associating with de-carbonizing entities
037 Intelligent Risk - November 2022
Another UK leading insurer, Prudential UK, has set the target of decarbonisation from 2022 to be included in the long-term incentive plan. Another Canadian life insurance company, Manulife, has planned their executive performance and compensation, by committing to the Science Based Targets initiative.
Insurance players are enhancing the role of Chief Risk Officers (CROs) by adding sustainability, in terms of providing oversight through review and challenge, to their responsibilities. The UK’s Prudential Regulatory Authority, in 2019, assigned responsibilities over climate-related risks to CROs.
One insurance company in Canada, Manulife, is developing a framework to identify the impact of climate risks on mortality and morbidity at a country level to understand the adverse impacts on health care infrastructure. This will help them in coping with the developing scenario. Many insurance companies are performing climate-related stress testing to assess the impact of climate related risks on their portfolio, capital management and resulting bottom line.
Thus, the insurance industry can play a major role in helping to limit carbon emissions through their two key roles - underwriting (restricting insurance) and reducing investment to high carbon emission industries.
peer reviewer
Sonjai Kumar
Sonjai Kumar is a consulting partner in Tata Consultancy Service, India under the BFSI CRO Risk Advisory. He has three decades of experience in the insurance industry and in consulting areas. His expertise is in the areas of actuarial, enterprise risk management, operational risk, insurance and financial, risk culture, corporate governance etc. He is an enthusiastic risk management professional, a certified fellow member of Institute of Risk Management, London, and currently pursuing PhD in Enterprise Risk Management in the insurance sector.
 Dr. Kembai Srinivasa Rao
authors 038 Intelligent Risk - November 2022
Synopsis
UK regulators have set a tight timetable for financial institutions to meet higher standards of operational resilience. These standards cover both the governance and implementation of dynamic processes to protect critical business services.
Operational resilience maturity: How you can reach ‘sophistication’ by 2025
by Gary Lynam
Operational resilience maturity is a pressing matter. The regulators’ deadline for initial submissions has passed; now the focus turns to building sophistication. With a regulatory expectation that organisations will have ‘sophisticated’ operating models by 31 March 2025, most firms have a lot of growing to do. Protecht’s EMEA Director of Customer Success Gary Lynam sums up how.
With firms having submitted their Important Business Services (IBS) playbooks, the final rules of the joint FCA/BoE/PRA op-res policy, PS21/3 (“the policy”) are now in effect. There is a transitional period until 31 March 2025, at which point all firms are required to consistently remain within their impact tolerances. However, firms that do not make reasonable efforts to remain within impact tolerances during this period will be in breach of the new rules.
key considerations to refine operating model
As we go through the steps required to reach op-res maturity, there are five key considerations to keep in mind:
1. Harnessing Insight from IBS: Being operationally resilient is an iterative and evolving process. Impact tolerances and related risks and controls are subject to an ever-changing landscape of threats, so frequent mapping and testing is required to identify emerging IBS vulnerabilities. Organisations might consider a decision tree to validate IBS are current and remain the utmost priority to their customer base.
2. Create High Impact Engagement Through Visualisation: The policy asks that op-res practices, mapping and scenario testing are reviewed and approved by the board or equivalent management body.
Intelligent Risk - November 2022 039
All ERM information therefore has to be readily accessible and understood by senior managers –and, given the previous point, reviews and approvals should optimally be based on real-time data and supported by process automation. With such large complex processes in scope, visualisation will be key to ensuring effective engagement with leadership teams.
3. Embed Efficiently to Avoid Fatigue: Firms are to regularly submit self-assessment documents during the transitional period. Reviewed and approved by senior management, these documents are to show the organisation’s journey toward op-res maturity. To prevent fatigue, organisations should consider the digitisation of these processes to enable fluency of movement between entities, management layers and functional teams and ensure lessons learned and continuous improvement opportunities are being executed upon.
4. Continuous Improvement Culture: Whilst firms could identify their own IBS and set impact tolerances during the policy implementation period, which ended 31 March 2022, regulators are now benchmarking submissions from across the sector. In doing so, they keep an outside-in mindset: no matter the impact on the firm, any service whose failure would cause “intolerable harm” to consumers or market integrity is considered an important business service, and impact tolerances are to be set accordingly.
5. Refresh Overall Resilience Methodology: The regulators note that operational resilience is likely to become a competitive advantage. Against the backdrop of societal disruptions such as the pandemic and the conflict in Ukraine, future customers may well choose the most resilient firms. For many, recent changes are likely to trigger a wider review of the entire organisational resilience landscape. This expands the conversation into approach to leadership, organisational culture, market perception and environmental, social and governance (ESG), which, if objectives have become unclear, have the potential to have detrimental effects to brand and reputation, and subsequently strategic outcomes.
Regulators underline that the very concept of resilience assumes that disruptions are inevitable. Firms need to be able to “continue providing the services most relied upon by consumers and markets (important business services) during severe but plausible scenarios from the perspective that these disruptions have already happened (impact tolerance)”.
What will be required by 31 March 2025, is in effect for firms to have established a self-regulating operational resilience ecosystem that can:
1. Withstand severe but plausible shock events over period of time
2. Quickly ascertain any interconnectivity of shocks to the operational resource asset pool
3. Retain control whilst applying countermeasures effectively
040 Intelligent Risk - November 2022
growing risk maturity organically
4. Adapt to new normal whilst maintaining service integrity
5. Communicate recovery plans, including impact exposure areas, efficiently with Board and Senior Management.
Much like with the science of managing an actual ecosystem, all required knowledge and actions cannot rest with a single expert or team. Everyone and every function tied to an IBS must form an interconnected network with a central repository, where intuitively presented information is organically sourced, disseminated and acted upon, creating a real-time feedback loop that gradually consolidates and strengthens the firm’s operational resilience.
This cycle covers five areas: IBS, Mapping, Impact tolerance, Scenario-testing and Adaptation as shown in Figure 1.

Source: Figure 1: Operational Resilience Cycle
conclusions
Organisations have invested much time to stand up operational resilience capability. Many have stood up new functions and resourced accordingly to support ongoing operational effectiveness. On balance, we assess the market as having basic defined operating models that supported initial regulatory submission.
The challenge for organisations is now to demonstrate learnings, continuously improve and seamlessly embed new/refreshed processes in existing frameworks. Management require distilled insight and views to ensure outcomes of operational resilience processes are understood and provide the necessary objective data points to support decision making and investment in IBS, if required. To move to an integrated/ sophisticated operating model, a digitised solution should be considered which seamlessly integrates existing traditional ERM framework components with IT, Supplier Management and Business Continuity Management (BCM) functions.
041 Intelligent Risk - November 2022
In the absence of tooling, organisations will likely struggle to move to the regulatory-desired end state.
A final point to bear in mind is that your ERM solution itself is subject to the policy rules, and the responsibility for any failures ultimately rests with you. This makes it vitally important to ensure that both the software and the supplier are fit-for-purpose – and that the supplier can demonstrate that they understand the regulatory environment you face and the transition that your business will need to make.
Protecht recently launched the Protecht.ERM Operational Resilience module, whichhelps you identify and manage potential disruption so you can provide the critical services your customers and community rely on.
Find out more about operational resilience and how Protecht.ERM can help:
next steps for your organisation about Protecht Group
• Watch our operational resilience webinar

• Download our operational resilience eBook
• Find out more about our Operational Resilience module
With offices in London, Sydney and Los Angeles, Protecht provides complete risk solutions, including the world-class Protecht.ERM enterprise risk management platform as well as compliance, training and advisory services, to businesses, government organisations and regulators across the world.
Protecht is passionate about solving the challenge customers face in managing risks. Protecht.ERM provides a single, interconnected platform that produces a holistic view of risk while being simple and easy to use. Protecht has helped hundreds of organisations move away from spreadsheets and email to a more efficient and effective way to manage risk.
Gary Lynam
Leading the Protecht Customer Success team in the EMEA Region, Gary has a strong track record delivering large scale and complex engagements across the Financial Services industry, specialising in risk, resilience and compliance solutions. Gary has a wide range of experience consulting and providing advisory services to clients globally. Prior to Protecht, Gary spent time with HSBC, Natwest Group, Commonwealth Bank of Australia and KPMG in strategic and operational risk advisory roles. Gary has been responsible for leading the Protecht Operational Resilience offering in the UK and is also a key member of the Protecht.ERM Design team shaping the Operational Resilience solution.
042 Intelligent Risk - November 2022
author
Synopsis
With high volatility, neither backed by any fundamentals of the issuers nor regulated, cryptocurrencies are akin to landmines that can explode and cause immense risks to holders stretching its domino impact to financial stability. The stakeholders should therefore be conscious about the inherent risks in dealing with cryptocurrencies that cannot be managed with current wherewithal of risk management techniques.
risk dynamics of cryptocurrencies
by Peter Gross
Digital currencies including crypto currency are financial assets with underlying blockchain technologies. They are emerging disruptive forces facing the world today. These technological innovations are being used by many market participants as a substitute for traditional sovereign-backed currencies and, more recently with the advent of non-fungible tokens (NFTs)1, as investable assets themselves.

Currencies should be fungible, durable, portable, recognizable, and stable 2 and are integral with the establishment of a country’s sovereignty. Presently, traditional currencies are created through a sophisticated market of government bond issues having varied maturity dates with central coordination that works in targeting interest rates to limit the amount of currency that is brought into existence. It is the foundation on which economies are built, affecting billions of people, and is a cause of concern if they are not managed correctly to limit volatility and ensure adequate supply when it is needed.
cryptocurrencies are risky
Cryptocurrencies, or cryptos, as digital currencies are known, are set up by collective participants that are not tied to any state and have no central coordination function. While the intrinsic limitation of supply is targeted to address concerns around inflation, the price of a cryptocurrency unit or token has no theoretical limit. This means cryptos can become an instrument of speculation while being touted as a perfectly legitimate substitute for currency and, due to their price volatility, can thus become a liability when taken on as an asset – an unregulated asset, too.
1
/ Robyn Conti and John Schmidt, “What Is An NFT? Non-Fungible Tokens Explained”, https://www.forbes.com/advisor/investing/cryptocurrency/nft-non-fungible-token/, accessed 6 June 2022
2 / Charles Potters et al, “Money”, accessed https://www.investopedia.com/terms/m/money.asp, accessed 6 June 2022 Intelligent Risk -
043
November 2022
Unlike the shares of a company or physical assets like gold or silver, cryptos are devoid of a fundamental value other than what other people are willing to pay. There are no earnings to be had while owning it either, other than a collectively held belief that its value will always go up – which is not the case.
how cryptocurrencies work
Furthermore, the distributed ledger on which cryptos exist targets a problem that does not need solving in a financial transaction sense. At the core of banking systems you have database engines that are sufficiently capable of handling vast volumes of transactions in sub-millisecond response times. These are effectively governed by dual-entry accounting systems and are sufficiently backed up, logged, and vaulted away. Touting the immutable distributed ledger as an innovation is trying to solve a problem that, for all intents and practical purposes, does not exist.
Curiously, the supposed problem cryptos are technologically attempting to solve can be best described using Brewer’s CAP theorem.3 Like the well-known trade-off between cost, quality and time in project management –where a manager can choose two but not all three–, CAP stands for consistency, accessibility, and partition tolerance. If you want data to be consistent and accessible (i.e., your bank balance is correct and available at the click of a button), one needs to sacrifice data partitioning (i.e., no distributed ledger). If you want records to be partitioned across multiple databases (in other words, stored in a publicly accessible distributed ledger across the world), one needs to sacrifice either the consistency or accessibility of data.
In the case of cryptos it is accessibility that falls by the wayside. It is this trade-off that leads the distributed ledger-fueled cryptos to literally attempt to “boil the ocean” in solving this problem.4 Fundamentally, from an engineering standpoint, distributed ledgers will fail the requirement for immediacy over centralized database systems every time.
To use cryptos as a store of value is yet another concern. Here cryptos replace the notion of a physical asset to be regarded as a safe harbor to invest hard-earned cash. This goes to the heart of what “value” means and where speculation enters the fray.
the Dutch experience
The Dutch experienced a phenomenon in the 17th century regarding trade in tulips which is analogous to the current hype surrounding cryptos.5
3
/ CAP Theorem, https://en.wikipedia.org/wiki/CAP_theorem, accessed 1 June 2022.
4 / Nic Carter, “How Much Energy Does Bitcoin Actually Consume?”, https://hbr.org/2021/05/how-much-energy-does-bitcoin-actually-consume, accessed 1 June 2022
5 / Adam Hayes, “Dutch Tulip Bulb Market Bubble”, https://www.investopedia.com/terms/d/dutch_tulip_bulb_market_bubble.asp, accessed 6 June 2022
044 Intelligent Risk - November 2022
Like cryptos, tulips were not regulated by a central government; they freely traded on an open market; they had little intrinsic value other than producing a beautiful flower; and were prone to market exuberance. For many years tulips traded as a store of value until, one day, that came to a stop. It would be curious to consider creating a currency unit called “tulips” on a core banking system – just because it would satisfy the madness of the crowds. I have no doubt there must be a fledgling crypto start-up called “tulips” contemplating an initial coin offering somewhere.
There was a bumper sticker at the end of the dotcom bust of the early 2000s that read “Please God, just one more bubble.” Perhaps this speaks to a real human need for purely speculative assets where the winner takes all. It may be this type of behavior that is a sign the next bubble is ready to burst.
conclusion
Crypto currency markets exceeded 3 trillion US dollars in value in May 2022 and a potential bursting of this bubble would wreak havoc on financial markets. The only sensible hedge against this sort of risk would be to remove oneself from the exchange of traditional currency for the novelty of owning a tokenized distributed ledger entry. Although the market for cryptos will undoubtedly continue for the foreseeable future, it is encouraging to see that there are government-led initiatives underway that seek to protect market participants possibly paving the way for innovations like a digital dollar.viii
Dr. Kembai Srinivasa Rao peer reviewer
author
Peter Gross, Director, Ilion (Pty) Ltd
A data management and certified professional risk manager (PRM) with more than 20 years’ experience having worked in banking, insurance, telecommunications, and manufacturing. His interests include financial risk, systems development, and optimization with experience in the areas of Business Intelligence, Data Warehousing, Master Data Management, Data Science and Auditing. A director and co-founder of Ilion (Pty) Ltd., a financial risk management data analytics consultancy servicing the African financial services market.
6 / Luke McGrath, “Nassim Nicholas Taleb Calls Bitcoin a Tulip Bubble Without the Aesthetics”, Bloomberg, https://www.bloomberg.com/news/ articles/2021-10-21/taleb-calls-bitcoin-a-tulip-bubble-without-the-aesthetics, accessed 6 June 2022
7 / Weston Blasi, MorningStar, “Bitcoin and Ethereum: Here’s how values for crypto changed in May 2022”, https://www.morningstar.com/news/ marketwatch/20220602520/bitcoin-and-ethereum-heres-how-values-for-crypto-changed-in-may-2022, accessed 6 June 2022
8 / Kevin George, “Cryptocurrency Regulations Around the World”, https://www.investopedia.com/cryptocurrency-regulations-around-the-world-5202122, accessed 13 October 2022

045 Intelligent Risk - November 2022
Canadian Risk Forum – Executive Leader Session
One of the participants joining the 10th annual Canadian Risk Forum earlier this month for a muchanticipated Executive Leader session was Daniel Moore, Co-Founder River Run Ventures. He sat down for a Fireside Chat with Katherine Rivington, Head, North American Retail Credit and Chief Risk Officer (CRO), Canadian P&C and Wealth Management, BMO Financial Group, moderated by Yannic BlaisGauthier, Partner, Financial Services Risk Management, EY. The session delved into Innovation and the Future of Risk Management with Risk Executives as they navigate the constant disruption driven by forces such as globalization, environmental change, demographics, and technological and talent expectation shifts. Before the Forum, Daniel was able to spend some time with Intelligent Risk editor, Carl Densem, for a brief interview about the event.
Daniel, which of these forces is picking up and demanding risk managers’ attention right now?
In today’s transformative era, risk managers have more to pay attention to than ever before. They need to heed warnings in imminent areas like technology, talent and macroeconomic concerns, while also paying attention to longer-term risk possibilities on the horizon. You can’t, as a risk manager, do one without the other; it’s a bit like an air traffic controller, you risk having planes backing up in the sky if your only focus is the ones taking off safely.
So, the challenge comes from both the larger number and varied timeline of the issues risk managers face today, but with that challenge comes the opportunity for companies that manage these risks well to really build a competitive business model.
What is the danger of falling behind or waiting for the shifting sands to settle?
At times acting quickly is a competitive advantage, but at other times you need to be a fast follower. That points to a key skill for companies: prioritization. Immediate concerns need action right away, for instance repositioning the bank’s balance sheet given interest rate hikes or reacting to talent needs. Other concerns are long-term and allow more time for thoughtfulness when planning an approach. Regardless of when and how concerns come up, the right time to start thinking about organizational readiness is now.
Intelligent Risk - November 2022
046
PRMIA PRMIA
Daniel Daniel
How can organizations attract (and keep) the right talent, where are companies going wrong?
People risk is near and dear to my heart, it’s something I think about a lot, especially since banking is all about people. The pandemic has been a reminder that people and safety -whether customers or employees- are at the heart of our organizations and they need to be at the centre of our risk frameworks. Now, after a few years, we’re thinking about how to create the right work environment that meets the changing needs of employees and provides them with the flexibility they’re looking for – whether it’s working remote or taking a hybrid approach
We’ve also seen a lot of organizations double-down on their sense of purpose and how they can live their purpose through corporate responsibility initiatives. A recent Harvard Business Review article showed that C-suite job requirements are now more about empathy and communication than hard, technical business skills and research from EY reveals today’s employees want their leaders to be empathetic to both their professional and personal needs. An ability to truly understand employees, customers and communities wins in the long-run; that’s a sustainable business advantage.
 The Executive Leadership Fireside Chat can be viewed as a part of the Canadian Risk Forum recording.
PRMIA
The Executive Leadership Fireside Chat can be viewed as a part of the Canadian Risk Forum recording.
PRMIA
047 Intelligent Risk - November 2022
Daniel
Synopsis
Increased awareness of conduct risk has prompted the emergence of international standards for conduct risk identification and mitigation. Both existing and advanced methods can be effective for measuring and managing conduct risk.
conduct risk
by Shuvajit Chakraborty
The International Association of Insurance Supervisors (“IAIS”) defines conduct risk as “the risk to customers, insurers, the insurance sector or the insurance market that arises from insurers and/or intermediaries conducting their business in a way that does not ensure fair treatment of customers.”
Although defined in the context of the insurance industry, it is not exclusive to the sector and affects other organizations in financial services such as banks.

This risk is faced by all insurance industry stakeholders due to the activities attributed to the service providers rather than the risks associated with service consumers. The latter risk has been subjected to many studies, and companies have built policies to deal with it, but the former risk which may have more far-reaching impacts on the business is usually neglected.
An example of conduct risk is the risk of insider trading where an employee or the director of an organization gains unfairly by using information accessible exclusively to them by virtue of their employment.
components of conduct risk
The fifth annual survey by Thomson Reuters on how firms around the world are managing the challenges presented by the regulatory focus on culture and conduct risk1 identified three key components of conduct risk as: culture, ethics, integrity (54 percent); corporate governance, tone from the top (44 percent), and conflicts of interest (41 percent).
Intelligent Risk - November 2022
048
causes of conduct risk
Australia’s Royal Commission and the Working Group of the FSB, have identified five causes of conduct risk.2 These are:
1. Lack of Leadership – conduct risk in the organization is determined by the leadership style followed by top management. Sometimes the behavior of the top management is misaligned with their expectations from employees or there may be a failure by top management to apply standards uniformly. There may be failures in communication of the standards of conduct expected within the organization and when dealing with outside agencies and clients. The culture of the organization may not encourage consultation and may, in fact, explicitly or implicitly discourage mitigation of potential risks.
2. Poor Management of the Product Lifecycle – the company may have failed to assess the risks associated with various services offered and the processes involved. It may sometimes be aware of the shortcomings after being provided with clues from external sources; other times it may fail to interpret the clues.
3. Inadequate Employee Awareness/Training and Oversight Programs – there are instances when the processes and standards in the organization are not well defined. The organizations may have defined processes and set standards but have failed to make employees aware of the processes and standards.
4. Wrong or Inappropriate Incentives – incentives influence behavior. In many organizations particular ends or goals are incentivized, but there is no importance given to the means adopted. This may increase conduct risk in the organization.
5. Inadequate Management Reporting and Escalation – some organizations have failed to devise management reporting of the risk in the organization and the matrix for escalation of unresolved issues. The processes in the organization may lack transparency.
implications of conduct risk
The implications of poorly managed conduct risk are both reputational and regulatory with potential for financial impacts.3 It can also affect the financial institution’s ability to attract and retain investment, customers, staff, and counterparties. Commentators have noted a direct link between the quality of a firm’s management of conduct and the quality of its risk management framework.
1 / https://www.reuters.com/article/bc-finreg-risk-report-executive-summary-idUSKBN1IA252
2 / https://www.protiviti.com/IN-en/insights/five-reasons-conduct-risk-failures
3 / https://www.marsh.com/ie/industries/financial-institutions/insights/conduct-risk-impacts-implications-for-financial-institutions.html#:~:text=The%20 FCA%20and%20Conduct&text=The%20main%20risks%20to%20a,customers%2C%20staff%2C%20and%20counterparties
049 Intelligent Risk - November 2022
tools for mitigating conduct
risk
To effectively measure and manage behavioral risk, companies should identify critical data points. Data related to culture and behavior are often qualitative, so creating a basis for reporting means applying quantitative measures to inherently qualitative data. Organizations that can capture this risk data and translate it into measurable terms will strengthen their decision-making capabilities and opportunities to intervene before behavior fails.
There are many areas where companies can look for risk management data and reporting –the wheel does not need to be recreated–, companies can leverage existing metrics such as customer reviews and complaints, client communications data, business violations, product design and testing results, incentives and compensation, and marketing and promotions. Metrics on individual behavior and policy violations can also provide management with a clear picture of the company’s risk and compliance culture.
regulatory response to conduct risk
Conduct risk is widespread in the financial sector across jurisdictions. Regulatory bodies are now cognizant of this risk and framing regulation to control and mitigate this risk. Some examples of such legislation include:
1. Ireland - regulatory focus and legislation has been enhanced, resulting in improvements in consumer protection and conduct risk management across the financial services sector. Through the Consumer Protection Risk Assessment (“CPRA”) Framework, the Central Bank of Ireland is setting expectations for firms to become fully compliant with their transparency and suitability obligations while embedding firm-wide practices in a consumer-centric culture.
2. United Kingdom – the Financial Conduct Authority (FCA) expects firms to develop their own conduct risk definition and strategies and put in place a tailored conduct risk framework to address the specific risks that their business is exposed to. The FCA introduced the 5 Conduct Questions program in 2015 and the leading wholesale banking firms operating in the UK, and subsequently published feedback papers in 2018 and 2019.
3. India - the Insurance Regulatory and Development Authority of India (IRDAI) Guidelines on Corporate Governance is to be followed by all registered insurers. The Code provides detailed guidelines on the structure, responsibilities and functions of the Board of Directors and management of the company to recognize the expectations of all stakeholders as well as regulators.
050 Intelligent Risk - November 2022
conclusion
Conduct risk is an ever-present risk in all financial sector organizations and across jurisdictions. This risk has been neglected in the past leading to many a corporate failure. It is high time that organizations recognize this risk and take measures to mitigate it. The use of traditional methods such as risk matrices and the modern methods like artificial intelligence can be used to effectively control the risk. The regulatory authorities must also provide guidelines for more effective control of conduct risk.
peer reviewer
Carl Densem
authors
Shuvajit Chakraborty
Shuvajit Chakraborty has over 18 years of experience in the field of General/ Non-life Insurance. He is postgraduate in Management and Business laws and is a Fellow of the Insurance Institute of India. He presently works for Agriculture Insurance Company of India in Kolkata, India.

051 Intelligent Risk - November 2022
Synopsis
With regulatory guidance for sustainability, ESG, and climate change evolving rapidly for financial institutions, non-financial corporates walk a precarious path if they do not follow suit and begin the long journey that is risk analysis and development of subsequent external reporting. This article explores potential paths forward for these institutions and provides guidance around pivotal first steps.
the climate (ESG) risk management & net-zero wave: the non-financial corporate perspective
by Peter Plochan
Over the last two years, financial institutions around the world have experienced tremendous pressure from governments, regulators, and customers to significantly step up their overall sustainability and Environmental, Social, and Governance (ESG) activities with increased attention on the risk management side of things— and on climate risk in particular. The “E” in ESG, represented by physical and transition climate change risks, is probably the area causing the most headaches to banking executives. As bankers and investors are formalizing their ESG and climate risk processes, they are also cascading respective requirements and expectations down to their customers and investees. To support the transition to a sustainable economy, authorities are now also turning their attention from financial institutions to non-financial corporates where they are introducing a variety of sustainability, ESG, and climate risk requirements and mandatory disclosures. At the same time, a number of corporates are already feeling the first negative impacts on their businesses from both the changing environmental and regulatory climate and/or the related mitigating actions of the leading governments and policy makers.
sustainability, esg, and climate risk reporting
Following up the financial industry regulations and disclosure requirements, the leading global policymakers have introduced a number of reporting regimes also for non-financial corporates with some of them gradually entering into force already in 2022:
• EU-wide Corporate Sustainability Reporting Directive (CSRD) hitting 50,000+ EU firms from 2024 onwards
Intelligent Risk - November 2022 052
• Mandatory climate-related financial disclosures by publicly quoted companies, large private companies and LLPs applicable to 1,300+ of the largest UK corporates as of April 2022 as part of the UK’s broader Sustainability Disclosure Requirements (SDR) framework
• Singapore’s SGX Sustainability Reporting Guide requiring first reports to cover companies’ 2022 fiscal year
• Global International Financial Reporting Standards’ (IFRS) Sustainability Disclosure Standards and the SEC’s Climate-Related Disclosures, the latter likely going into effect fiscal reporting year 2023
While a number of details are yet to be defined, there are several elements that these and other similar frameworks share in common. All in all, companies around the world will have to collect, analyze, process and disclose more sustainability and ESG data. In particular, there will be a lot of attention paid to carbon and net-zero factors and application of double materiality and forward-looking perspectives on reported information. Last but not least, all these activities will have to be performed in a more standardized and auditable fashion:
• Carbon and GHG focus – it is no longer a nice-to-have to report on a company’s carbon and Green House Gas (GHG) emissions. It is becoming mainstream to calculate both direct (Scope 1) emissions and indirect (Scope 2 and 3), which cover the entire value chain of a company with both its upstream (e.g. sale, usage, and disposal of products) and downstream (e.g. supply chain) activities. To accommodate this, companies have to gather new information, establish new processes and assumptions, and perform new calculations according to an established carbon and GHG accounting framework such as the Greenhouse Gas Protocol.
• Double Materiality – the classical Corporate Social Responsibility (CSR) approach of looking at a company’s impact on the environment around it has been around for more than a decade. What is new is the double materiality assessment closing the loop from the environment back to the company. Now, companies have to report on the ESG risks impacting their operations and activities, with particular attention towards climate risk.
• Forward looking perspective and strategy – a number of new reporting areas now include forward-looking elements, i.e. the coverage has expanded from the actual/historical data towards the what-if, future considerations such as providing a view on how the future emissions of the company are likely to evolve, how the deteriorating climate is going to impact the company, and what strategy the company is envisioning going forward to tackle this.
• Net Zero and Paris Alignment – some of the frameworks are pushing forward-looking requirements even a step further, asking companies to disclose their strategy for decarbonization in order to reach a net-zero carbon footprint by 2050 (i.e. the Paris Alignment). According to a study performed by Standard Chartered Bank, for 52% of top corporates, netzero transition will be the most expensive effort they have ever embarked on. In the same study, 61% of institutional investors stated they will not invest in companies that lack a net-zero Parisaligned transition strategy.
053 Intelligent Risk - November 2022
• Standardization – there is an increasing need for investors to look at reports of various companies and efficiently assess their sustainability and ESG exposures. Investors need to be able to compare apples with apples and pears with pears, which is vital for them to efficiently decide which company better suits their sustainability and ESG investment criteria, appetite, and strategy. To facilitate this, new reporting structures and formats are required that will make comparability and transparency of these reports easier compared to the earlier regimes.
• Auditability – a number of the arriving reporting frameworks, such as the CSRD, come with the requirement that all this new information has to be included in the Annual Management report, with a sign-off from the board and an external auditor as well. There are expectations that these new climate disclosures could be akin to SOX Controls for Internal Audit. Firms need to step up the auditability of their activities in this area, ensure the process for data collection, storing, processing, and reporting is governed accordingly, and the supporting infrastructure is sound, transparent, and reliable.
the Task Force on Climate-related Financial Disclosures (TCFD)
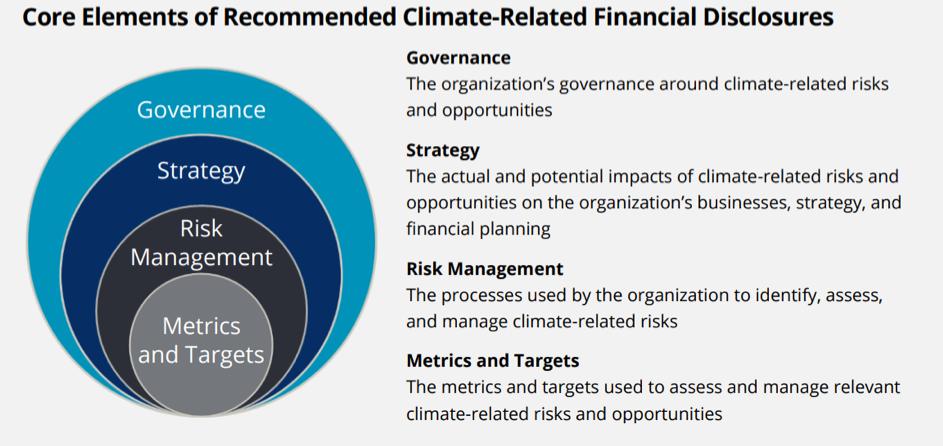
It is fair to say that details of a number of these emerging frameworks are still being finalized as we speak. However, there are already some established industry best practices that can give us a very good hint of what to expect. A great example is the Task Force on Climate-related Financial Disclosures (TCFD) framework.
TCFD launched initially as a voluntary climate reporting framework. With its increasing adoption both by corporates (for their climate reporting) and by policymakers (for designing sustainability, ESG, and climate reporting frameworks), TCFD has become the golden standard for climate reporting and is already mandatory in some jurisdictions. TCFD can allow us to better anticipate what is coming in these new reporting regimes.
Figure 1 shows the four thematic areas core to TCFD.
054 Intelligent Risk - November 2022
Figure 1: : Recommendations structured around four thematic areas
Source: : https://assets.bbhub.io/company/sites/60/2021/07/2021-TCFD-Implementing_Guidance.pdf
climate (ESG) risk management
In order to properly identify their exposures to physical risks (e.g. severe weather) and transition risks (e.g. elimination of gasoline-fueled automobiles in favor of electric vehicles), understand their interdependency, and assess potential future impacts, non-financial corporates will have to ramp up their existing enterprise and operational risk management processes. Figure 2 shows a schematic of these relationships.
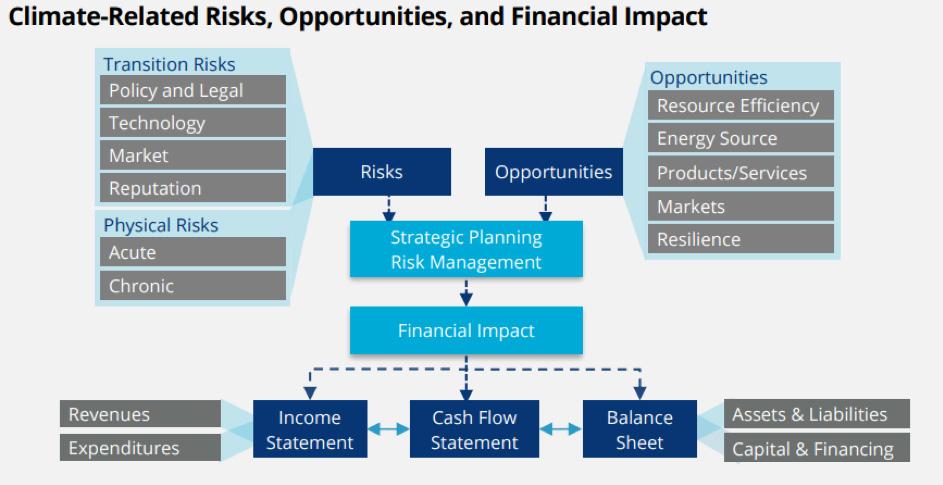
Mapping this unchartered territory will require new data, new skills, and very close cooperation with risk, business, and strategy teams to properly understand the sensitivities of a firm’s business model to physical and transition risks now and going forward 10, 20, 30 years in the future.
As a result of this analysis, each firm should form up a transition plan for addressing transition risks and an adaptation plan to deal with physical risks going forward.
Source: : : https://assets.bbhub.io/company/sites/60/2021/07/2021-Metrics_Targets_Guidance-1.pdf
055 Intelligent Risk - November 2022
Figure 2: : Specific climate-related risks and opportunities to which the organization is exposed
scenario analysis & climate risk
TCFD pays particular attention to the forward-looking metrics and calculations assessing the what-ifs, risks, and impact of alternative scenarios and strategies on a firm’s future performance.
This will cause a notable headache to non-financial institutions and their current business and financial planning processes as they have not been exposed that much to regulatory stress testing and scenario analysis activities like financial institutions have. TCFD has put together dedicated Guidance on Scenario Analysis for Non-Financial Companies, which will help firms to get started, but still this can be an entirely new domain for a number of them. However, there is a positive side— out of this exercise potential new climate opportunities could be identified and assessed by these firms.
Furthermore, scenario analysis is not just about climate risk. It is a well-established and powerful risk management and business planning tool that has been used by financial institutions for a long time. Due to the recent COVID-19 pandemic, geo-political, energy, and inflation crises, it is also becoming much more relevant for non-financial corporates when assessing the future implications of volatile and unstable environments in relation to their operations and revenues. Searching for an optimal transition strategy towards a Paris-aligned business model to reach net zero— while minimizing risk and maximizing returns— is another perfect use case for forward-looking scenario analysis.
Net-Zero planning & transition
There are a number of alternative business model roads that lead to “Net-Zero Rome,” each with a different risk-return and cost profile. The challenge lies in finding the optimal Paris-aligned strategy and product mix that will lead to a firm’s net-zero carbon footprint (scope 1, 2, 3) by 2050— combined with the lowest risks and highest returns along the way under varying macro and climate scenarios.
Figure 3 below shows an example where a firm assesses the impact of the two most commonly applied climate scenarios on its expected future performance till 2050, starting with their existing business as usual (BAU) business model and strategy. In order to avoid a devastating hit on its performance under the Hot House World Scenario (where it faces most of the physical risks), the firm explores the impact of two alternative net-zero business transition strategies, which clearly deliver better performance under both scenarios— each offering a different balance along the way between short/long term risks, returns, and costs. In the end, the firm will choose the optimal strategy based on their strategic objectives, their risk appetite, and their view on future climate developments.
056 Intelligent Risk - November 2022
Figure 3: Assessing impacts of alternative climate scenarios on expected future performance
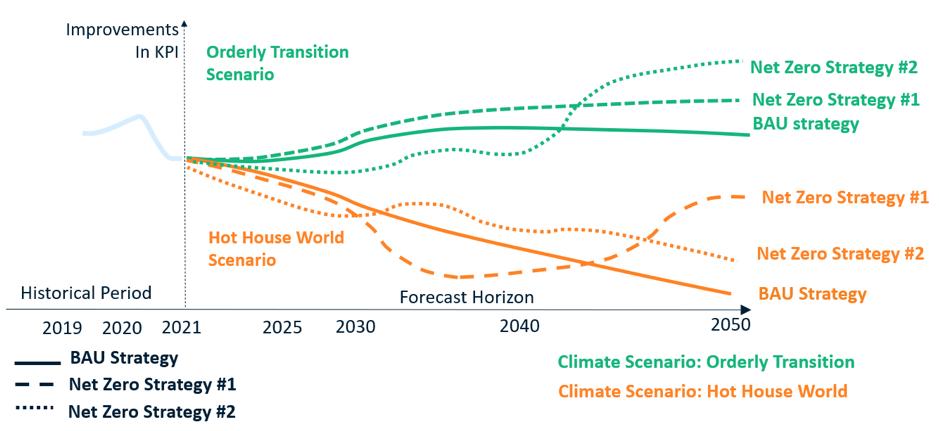
Source: https://www.ngfs.net/ngfs-scenarios-portal/
parting thoughts
Thinking about sustainability, climate risk, and net-zero strategy is no longer a nice-to-have for non-financial corporates. With the arriving wave of sustainability, ESG, and climate risk disclosures, corporates not only have to significantly boost their capabilities to produce newly required information and measures in auditready mode, but they must also scale up their risk management capabilities in order to identify climate change threats as well as mitigation and adaptation strategies going forward. The results better be good, because investors, auditors, and (increasingly so) customers are going to pay much more attention from now on.
On the bright side, as firms invest in new capabilities to address all of the above, they will become better at analyzing the impact of both the expected and unexpected. More importantly, they will be better positioned to make the right choices when navigating the volatile waters of these uncertain days— and of the days to come. Because whether it is a pandemic, geo-political, energy, inflation, or climate crisis, the key to tackling it is the same: to better understand it, to recognize its impact on the business, and to identify the best course of action going forward.
057 Intelligent Risk - November 2022
peer reviewer
Elisabeth Wilson
author
Peter Plochan
Peter Plochan is EMEA Principal Risk & Finance Specialist at SAS Institute assisting institutions in dealing with their challenges around climate risk, finance and risk regulations, enterprise risk management, risk analytics. Peter has a finance background (Master’s degree in Banking) and is a certified Financial Risk Manager (FRM) with 15 years of experience in risk management in the financial sector. Peter also delivers risk management trainings globally (PRMIA, RISK.NET, Bluecourses) covering climate risk, stress testing, ERM and Model Risk Management.

058 Intelligent Risk - November 2022
Synopsis
With digitization progressing in financial assets and transactions, banks’ risk management of existing and new operational risks will need to keep pace. A rethink is needed of traditional scoring systems to arrive at an overall risk assessment, including an understanding of how indicators relate to each other, and make the most of vastly larger data sets on the horizon.
build digital infrastructure for operational risk management
by Peter Ding
Financial assets and transactions have been digitized at unprecedented speed. Facing the significant challenges and great opportunities, banks are adopting new technologies and transforming business models to enhance digital capacities at an accelerated pace. Digitization of financial assets and transactions always involve synchronization of various systems and automation of business processes. These digital transformations may change the interrelations between different operational risks and bring new risks to banks. Therefore, banks need to evolve digitally-enabled risk management to safeguard the fast changing landscape of operational risks.
Operational risk management cannot be digitally-enabled without the infrastructure of digitization of risk indicators, integration of risk indicators, quantification of risks and risk aggregation.
Digitization of risk indicators transforms the traditional color-coding, heatmaps, traffic lights or points scale-based qualitative measures to digital forms of ratings or scores. The transformation will make the risk indicators precisely responsive to changes in risk profiles and easily leveraged in integration and modelling.
risk interrelationships
A risk may be measured with multiple indicators such as KRIs, KPIs, audit observations, and risk control assessments. The risk indicator outcomes need to be integrated to present an overall assessment of the risk. The integration should correctly recognize and reflect the interrelations of the risk attributes underlying the indicators. The basic interrelationships between the risk indicators may be categorized as either a series connection or parallel connection.
Intelligent Risk - November 2022
059
In Figure 1, the strength of Indicator A cannot mitigate the weakness of Indicator B. Hence, the higher risk of Indicator B reflects the overall risk of the connection. In Figure 2, the strength of Indicator C can mitigate the weakness of Indicator D. The overall risk of the connection is an “average” of Indicator C and D. The extent of potential mitigation depends on the nature and associations of the risk attributes that are underlying Indicators C and D.
Based on the mitigation relationship of the risk indicators, different calculation methods, as shown in Table 1, may be leveraged to integrate individual indicators and produce an overall score of the risk.
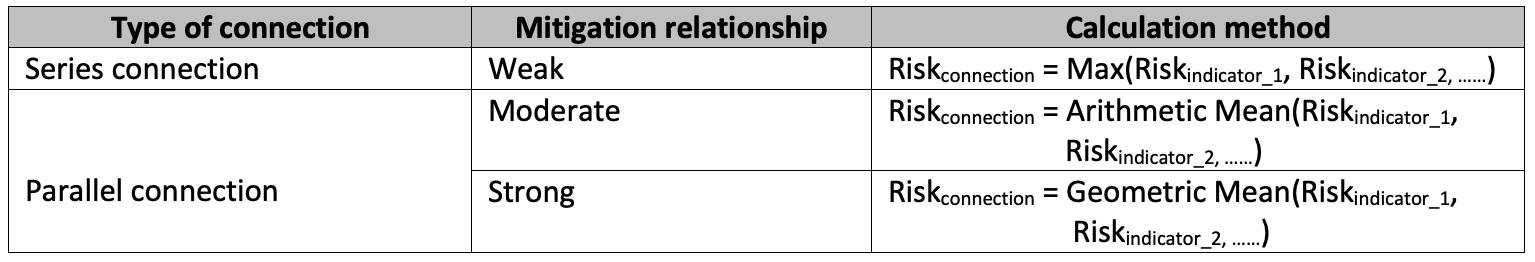
Table 1: Producing an overall risk score
If the internal historical data of risk indicators and risk incidents are available, statistical methods may be leveraged to work out the mathematical relationship between risk scores and risk likelihood. With a generous amount of quality data, the classical analytical approaches such as regression or logistical regression may produce best-fit monotonic functions. Otherwise, an approximation method or estimation method may be leveraged to produce a reasonable distribution of risk likelihood.
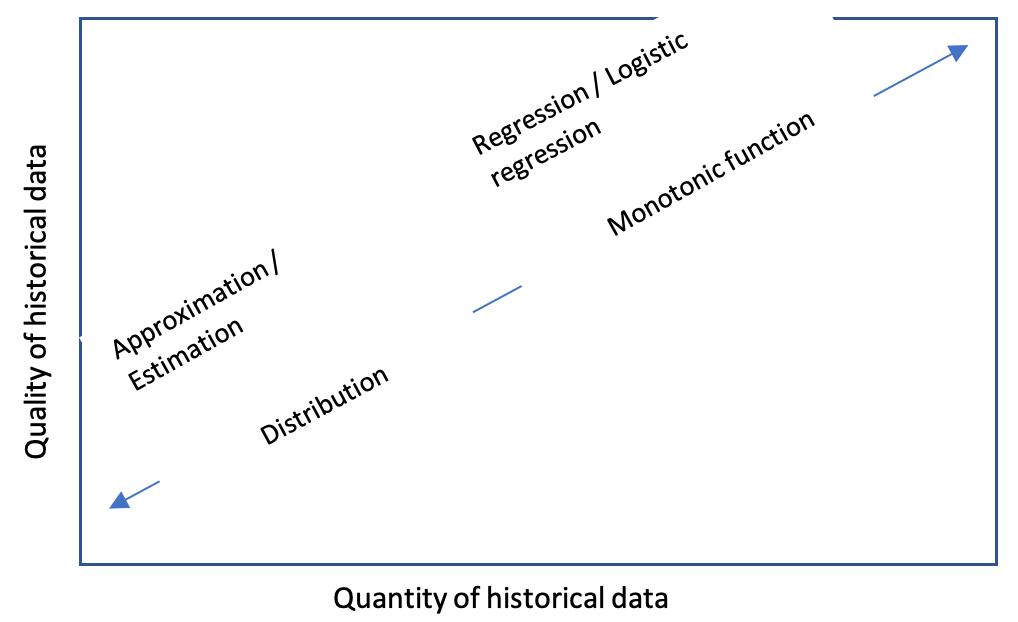
Figure 3: Selection of statistical methods
The internal data-driven risk likelihood functions or distributions should be justified and refined with reference to the external industry benchmarks. Overlays of expert opinions may be applied to enhance suitability and reliability.
If the internal historical data is unavailable or insufficient, the bank might benchmark its risk profile and control practice with the industry references and set an initial distribution of risk likelihood. Over a period of data accumulation, the bank will be able to back test the accumulated internal data and revise the initial distribution appropriately.
060 Intelligent Risk - November 2022
The other critical element for risk quantification is the impact and severity of a given risk occurrence. The potential impacts of risk events are widespread, and the potential severity is influenced by various factors. The actual impacts and severity may vary from one risk event to another. It is impossible to establish deterministic formulas or functions to define the potential impacts and severity of a risk event. The best way to describe the scope of impacts and magnitude of severity should be distributions of bounded domains.
The classical analytical methods are not good at handling random variables and bounded domain distributions of risk occurrence and risk impacts. Stochastic processes, especially random simulations, are robust techniques for this task.
risk impact and severity risk aggregation
Quantification may be performed at the relatively lower level of the risk taxonomy. The quantification results can be rolled up to the higher level of the risk taxonomy through appropriate aggregation. The typical quantification results are distributions of probable losses, and the quantified risks are not always mutually exclusive, so a simple summation is not the theoretically correct approach to aggregate the sub-risks and technically undoable in practice. The optimal aggregation is the joint distribution formed from the marginal distributions of the sub-risks. The joint distribution should be based on the interdependence of the subrisks which is measured with the covariance or the correlation matrix.
With digital infrastructure, banks will be able to implement digitally-enabled risk management programs and find themselves better positioned to keep pace with the digital evolution.
Carl Densem peer reviewer

Peter Ding, Sr. Manager, Non Financial Risk Quantification, BMO Financial Group
Peter has more than 20 years’ experience in the banking industry, including extensive involvement in commercial lending, corporate financial service, Basel implementation and risk management. For the most recent 10 years, he has been focused on risk analysis and modelling and developed various models for risk rating, credit decisioning, capital calculation, liquidity assessment, stress testing and quantification of financial and nonfinancial risks. He holds an MBA degree in Finance from the University of Alberta and the PRM Designation.
authors 061 Intelligent Risk - November 2022
ESG, sustainability and non-financial risks a call for action
PRMIA is pleased to announce its membership of the Joint Initiative on Accounting Reform (JIAR), an ESG & Sustainability program that is researching new methods of quantifying and accounting for nonfinancial risks. PRMIA is partnering with the Association of Chartered Certified Accountants (ACCA) in this initiative which is being coordinated by the Risk Accounting Standards Board (RASB) and the Durham University Business School (DUBS).
background
The universally adopted method of identifying non-financial risks and gauging their likely impact is through risk & control self-assessment (RCSA). RCSAs are the primary source of management information on the status of risk and risk mitigation that is typically reported via an assessment metric comprised of three colors: red, amber and green or “RAG”.
This raises two issues in connection with programs aimed at resolving ongoing ESG & sustainability reporting challenges:

First, color-coding risk exposures in place of their explicit quantification and aggregation inhibits boards and C-suite executives in their exercising of effective risk governance… the “G” in “ESG”. Most significantly, color-coding disenables portfolio views of accepted risks: colors cannot be tied to official accounting records, or aggregated and compared, or used to budget and set operating limits, or provide inputs to quantitative modeling and analysis.
Second, accountants need reliable and auditable aggregations of all forms of exposure to non-financial risk to risk-adjust financial statements, a fundamental requirement of ESG and sustainability reporting. risk and profit taking now… losses later
The absent risk-adjustment of financial statements results in a “risk and profit taking now - losses later” representation of corporate performance. This has undermined confidence in accounting profit and, consequently, the reliability of audited financial statements. Such loss of confidence has escalated to a point where the investor community and other stakeholders are demanding change, the most significant being the replacement of “financial profit” with “corporate sustainability” as the primary accounting measure of corporate performance.
The JIAR’s definition of corporate sustainability is: “An organization’s capacity to provide investors with reliably predictable returns on their investment in financial, environmental and social terms.”
Intelligent
- April
062
Risk
2022
In other words, corporate sustainability is an organization’s accounting profit, which is the backward-looking or ‘historic’ perspective, adjusted for the expected losses associated with accumulating non-financial risks reduced by the positive offsetting effects of ESG attributes which is the forward-looking or ‘future’ perspective. In short, corporate sustainability is the blending of backward- and forward-looking financial performance within a common measurement, accounting and reporting framework.
welcome to risk accounting
JIAR’s research is focused on Risk Accounting, a standardized and integrated non-financial risk management and accounting framework that identifies, quantifies, aggregates, values and reports all forms of nonfinancial risk. Risk Accounting provides a foundation on which expected losses associated with accepted non-financial risk, including the positive offsetting impacts of ESG attributes, can be accounted for.
Risk Accounting incorporates a novel non-financial risk quantification technique first pioneered in the banking sector as a production (operations) risk measurement and management tool. In a research collaboration between RASB and DUBS the technique has been extended and codified as an integrated non-financial risk management and accounting solution that has been proven for application in banks through laboratory testing.
The researchers are now satisfied it is ready for proofs-of-concept and other forms of field-testing.
To progress to the next critical stage of the research program, the JIAR is dependent on CFOs and CROs sponsoring the research and enabling access to their operating environments and risk management and accounting subject matter experts. Hence this Call for Action whose mission is to: “Conclude, based on empirical evidence, whether risk accounting provides a viable accounting-based foundation on which “financial profit” can securely transition to “corporate sustainability” as the primary accounting measure of corporate performance”.
For a detailed description of Risk Accounting there’s a step-by-step walkthrough in the form of a selfstudy guide in Section IV of the book, “Where Next for Operational Risk? – A Guide for Risk Managers and Accountants” written by the RASB chairman and PRMIA Sustaining member, Peter Hughes.
We urge our members to actively support this important research initiative. You can do so by emailing getinvolved@rasb.org with “Call for Action” in the subject header and you’ll be sent a link to our ‘Call for Action Information Pack’ via return email.
063 Intelligent Risk - November 2022
a call for action

INTELLIGENT RISK knowledge for the PRMIA community ©2022 - All Rights Reserved Professional Risk Managers’ International Association
