About the Studio
Metropolitan Studio aims to facilitate exploration of various facets of Metropolitan Planning and Management:
The delineation of Metropolitan Areas, the scope and content of Metropolitan plans, Governance structure and their functional domains vary considerably with in India. Most Metropolitan Plans in India have been largely an extension of Development Plans both in terms of their contents and process. The effectiveness of these Plans is somewhat debatable.
The studio explores these aspects through the case of Bangalore and Chennai, how the Metropolitan areas are planned in these two cities and if the existing planning paradigm has been successful. The studio also aims to look at alternative ways of planning, in order to deal with
the complexities presented by metropolitan areas. For this the studio was divided into 2 groups, each group taking one of the case cities and studying it in detail. I was part of the Group that studied Chennai. The studio is developed in four modules dealing with most pertinent issues related to planning for metropolitan areas:
Module I deals with Understanding the Metropolitan Area and Planning at the Metropolitan Scale. It aims to answer important questions like: How the Metropolitan Area is Demarcated? What is the existing way in which Metropolitan areas are planned in our country? What are the contents of the Metropolitan Plans and how is it implemented?
Module II is about Governance where we
My Role in the Studio
Module I
In this module we studied as a group what Chennai Metropolitan Area comprised of. The districts and talukas are part of the area, all local bodies and parastatal agencies are present in the area and the roles are assigned to them. I also studied past planning efforts made for Chennai Metropolitan Area (CMA), Impact of the Transport Network and possible commuting patterns in the area in relation to the cities economy.
Module II
Second Module is about governance here we studied the MPC Act 2009 and the present governance framework for CMA and tried to
understand the current governing framework in Indian Metropolitan Cities: the Metropolitan Planning Committee (MPC) and compare it with International examples of London and Metro Manila.
Module III : Sectoral Project at Metropolitan Scale
As a group we had to identify the sectors in which intervention is needed and take up those sectoral projects. Module IV is about the Strategic Plan where we have probed at the idea of having a Strategic Plan for Metropolitan area rather than having a comprehensive plan.
As the two modules are related we have combined the two for this Portfolio.
understand why it is not working with the help of International Case studies. My role was studying how Metropolitan Governments and projects get financed. How Greater London Authority and Metro Manila Development Authority finance their plans & projects by going through their budgets and how we can incorporate the same for Chennai?
Module III & IV
In module III Land Potential Analysis was carried out by me along with Aparna Ramesh. As a group we worked out the planning principles to base our plan for the region and I carried out the projection for urban spatial growth using Shomo Angels making room approach. Then, carried out my sectoral project on the water sector.
2
Source: Detailed Course Outline
3 Contents 04 Module I Defining Metropolitan Area Chennai Metropolitan Area (CMA) CMA Expantion 05 Planning History 06 Learnings from Past Planing efforts 07 Impact of Existing Transport Network 08 Delineation of boundary 02 About the Studio 03 Contents 10 Module II Need for Governance Current Governance Framework: MPC 11 Proposed Governance Framework 12 Finance Greater London Authority Metro Manila Development Authority 13 Proposed Financial Model Devolution of Finance Possible Revenue sources? 22 Conclusion 23 References 14 Module III & IV Land Potential Analysis 15 Urbanization Index 16 Suitability Analysis 17 Comprehensive Map 18 Projecting the Urban Spatial Growth 19 Strategic Planning Approach 20 Contents of Structure Plan Transport & Environment Water 21 Waste Water Recycle
Module I:
Understanding the Metropolitan area
Metropolis comes from two Greek words, metro and polis, where metro means mother and polis means city or town. In modern usage the term metropolis is used to describe a large city large city or conurbation which is a significant economic and political center for a country or region, and an important hub for international connections, commerce, and communications.
In India, there are 53 Urban Agglomerations that have a population over 10 lakhs of which the government has declared 7 as metropolitan areas: namely Mumbai, Delhi, Kolkata, Banglore, Hyderabad, Chennai and Pune.
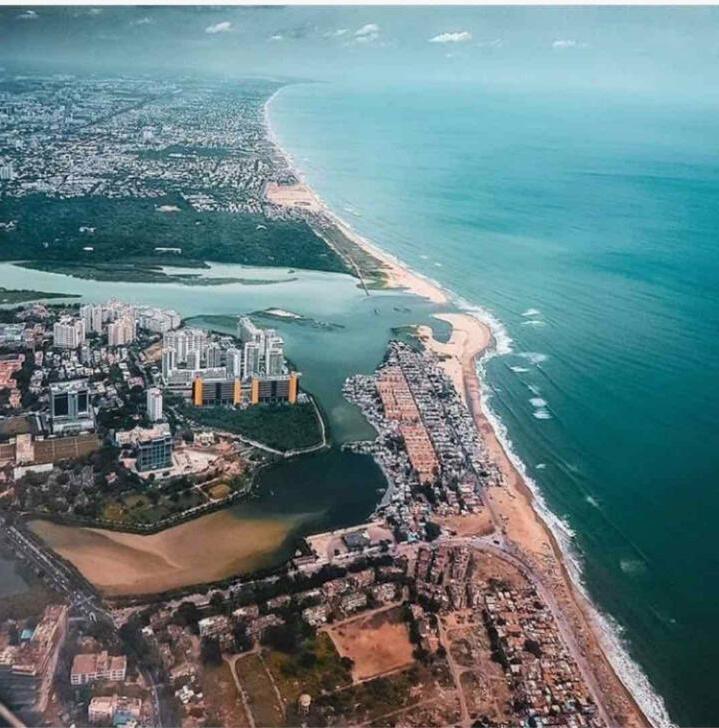
Chennai Metropolitan Area (CMA)
Chennai Metropolitan Area is our study area. It is a city of regional and historic importance. It was one of the important port cities during colonial times along with Mumbai (Bombay) & Kolkata (Calcutta). Now it is known as Detroit of India, due to many automobile manufacturing industries existing in the area.
Chennai (UA) has a population of 8,653,521. The city is the primate city in Tamil Nadu state as it has the highest population in the state and Coimbatore, the city with the next highest population (2,136,916) has only one-fourth the population of Chennai.
Definitions:
“ The metropolitan area, defines its boundaries according to the degree of economic and social interconnectedness of nearby areas, identified by interlinked commerce or commuting patterns.
~ The World’s cities in 2016, Data Booklet
“ An area having a population of ten lakhs or more, comprised in one or more districts and consisting of two or more Municipalities or Panchayats or other contiguous areas, specified by the Governor by public notification to be a Metropolitan area.
~ The Constitution (74th Amendment) Act
patten along major highways, and protection of ecologically sensitive areas.
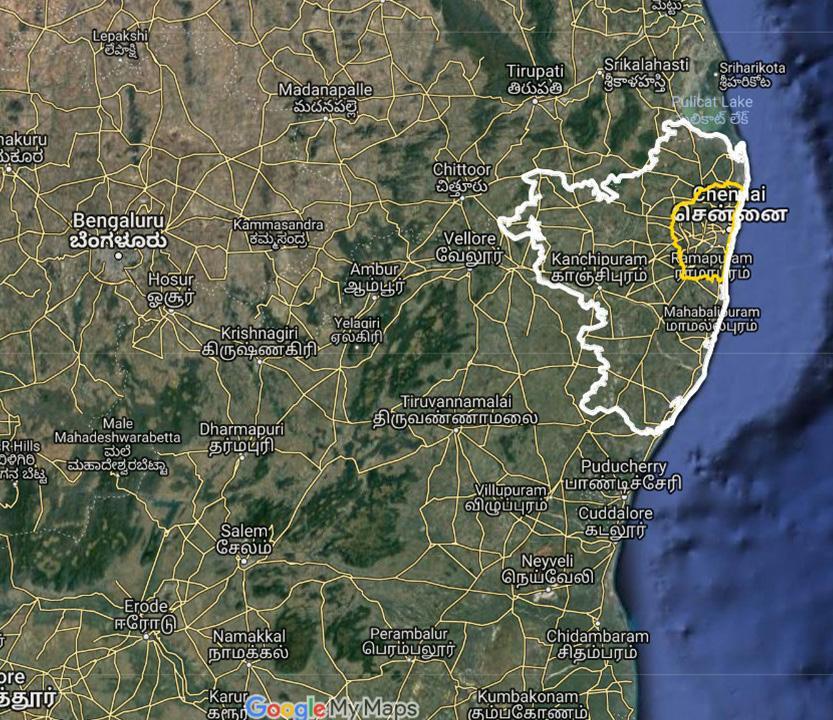
Expansion of CMA
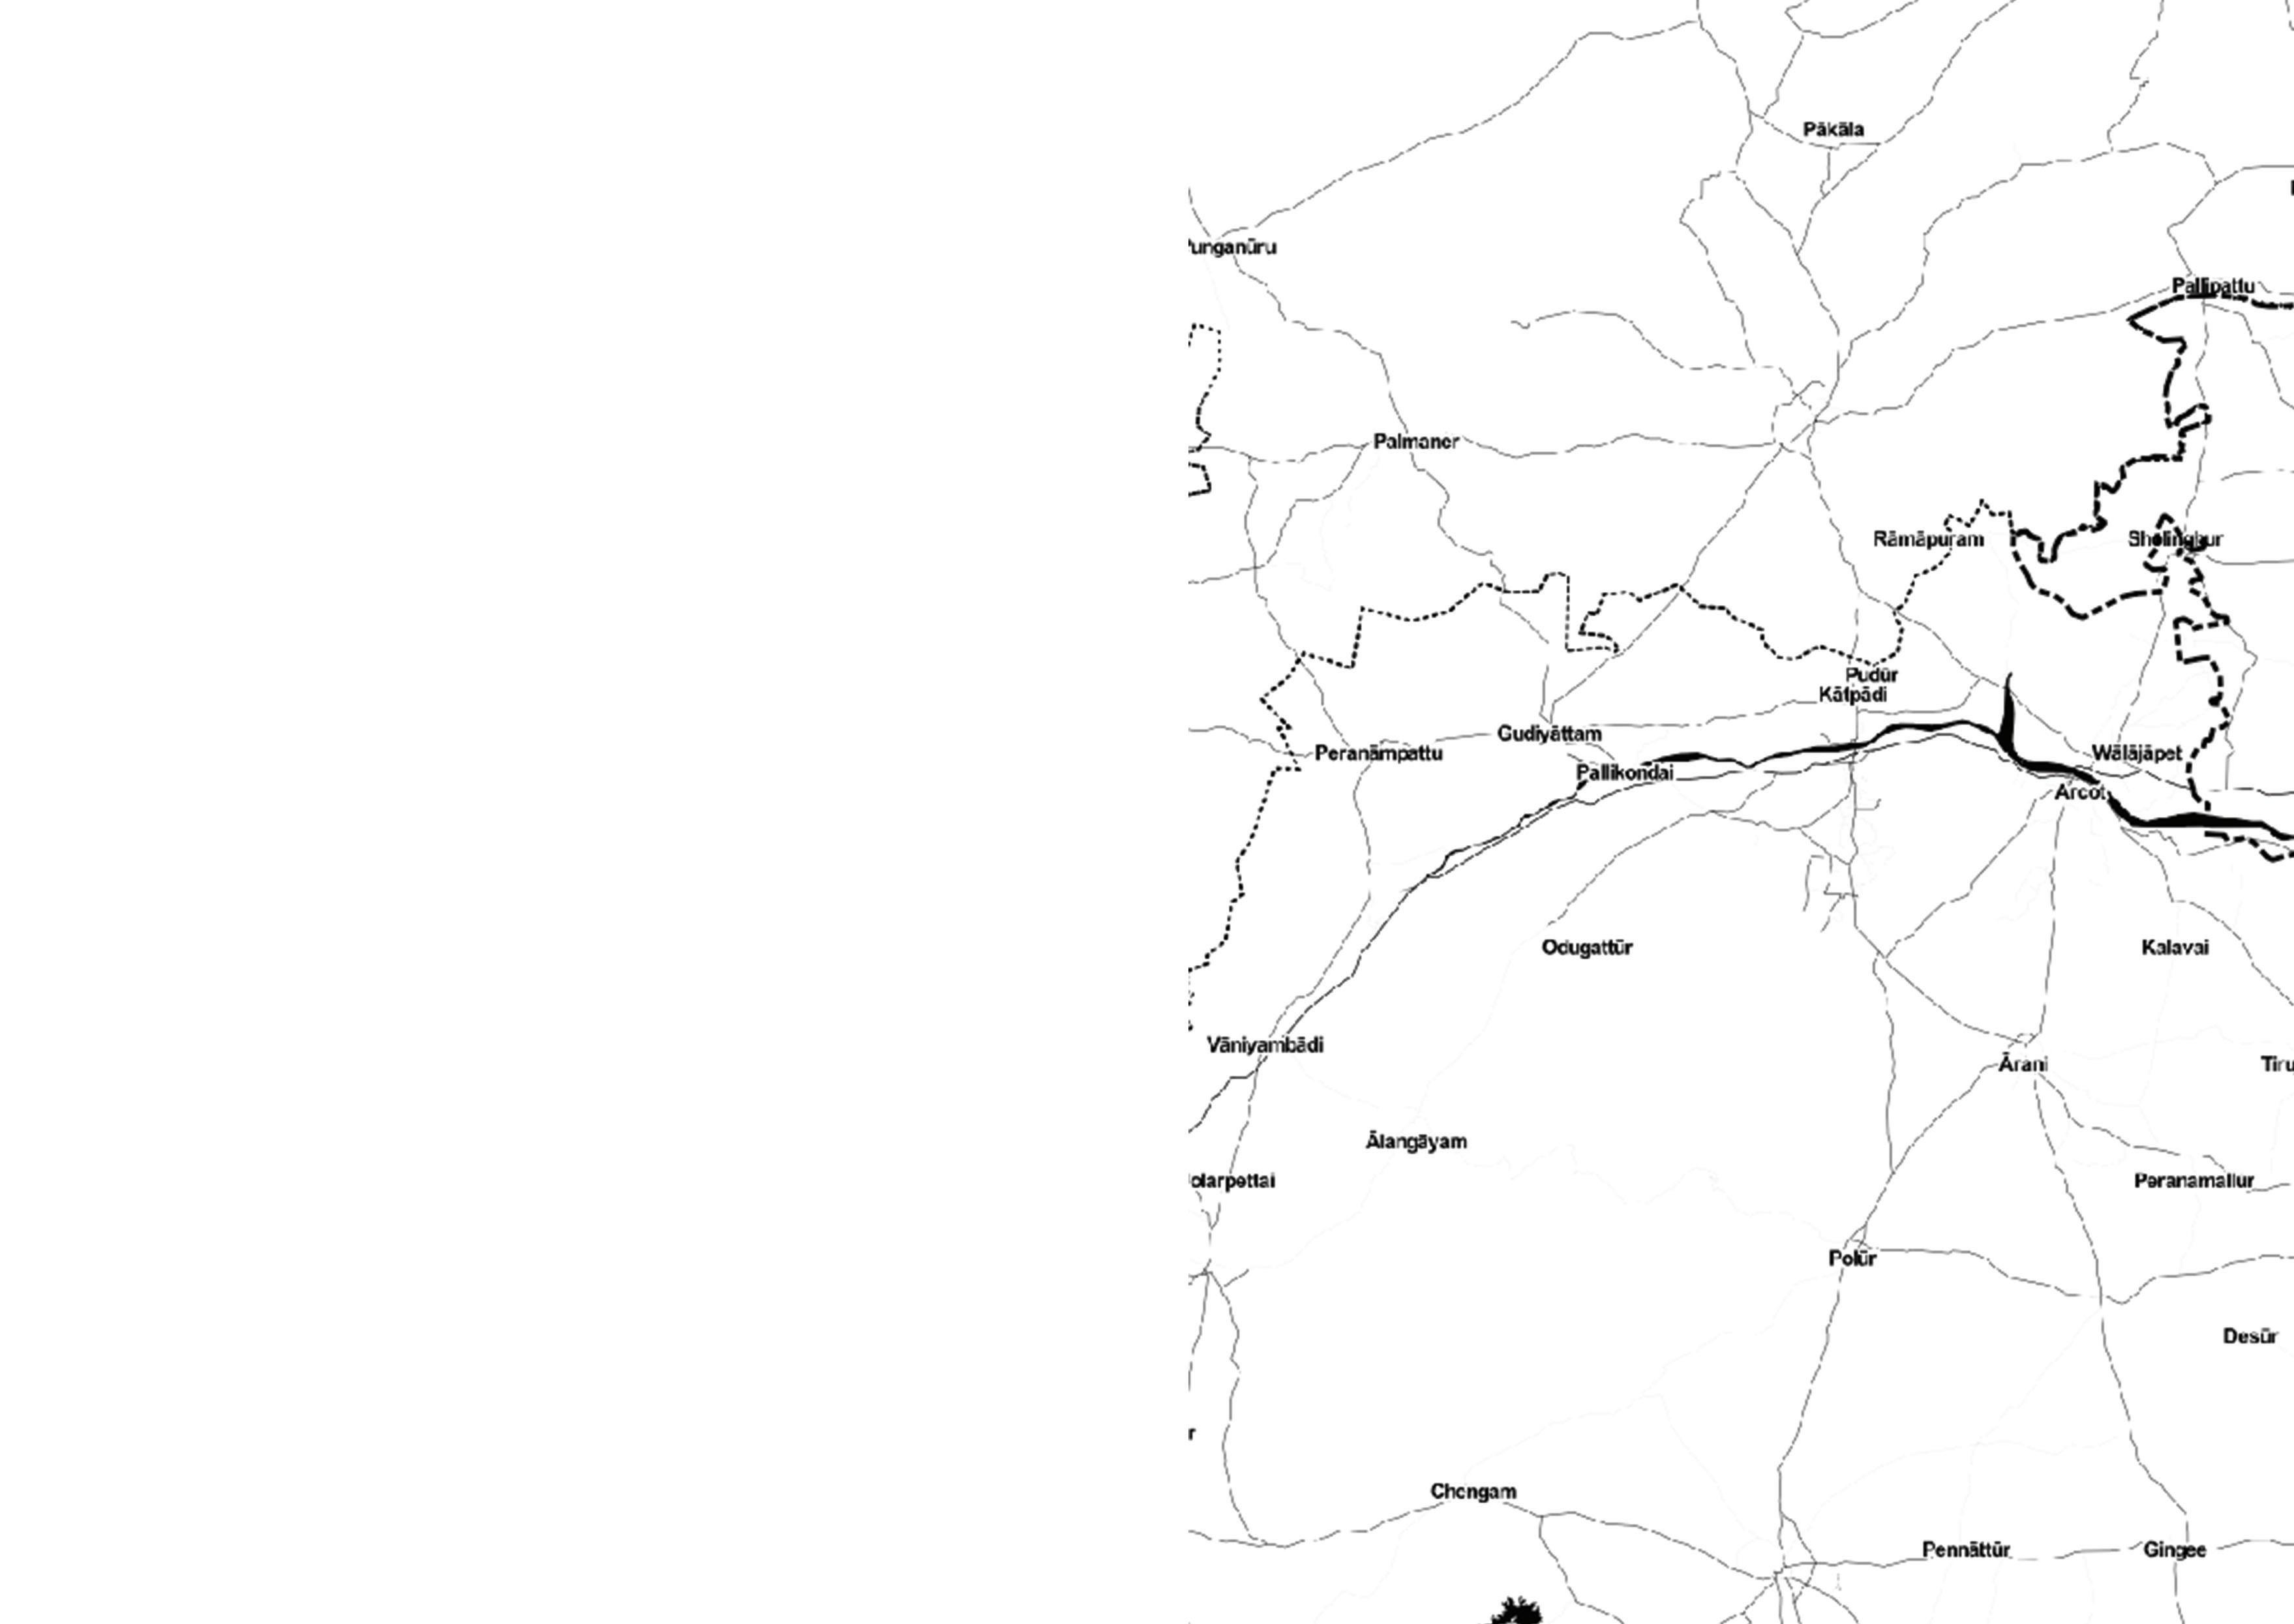
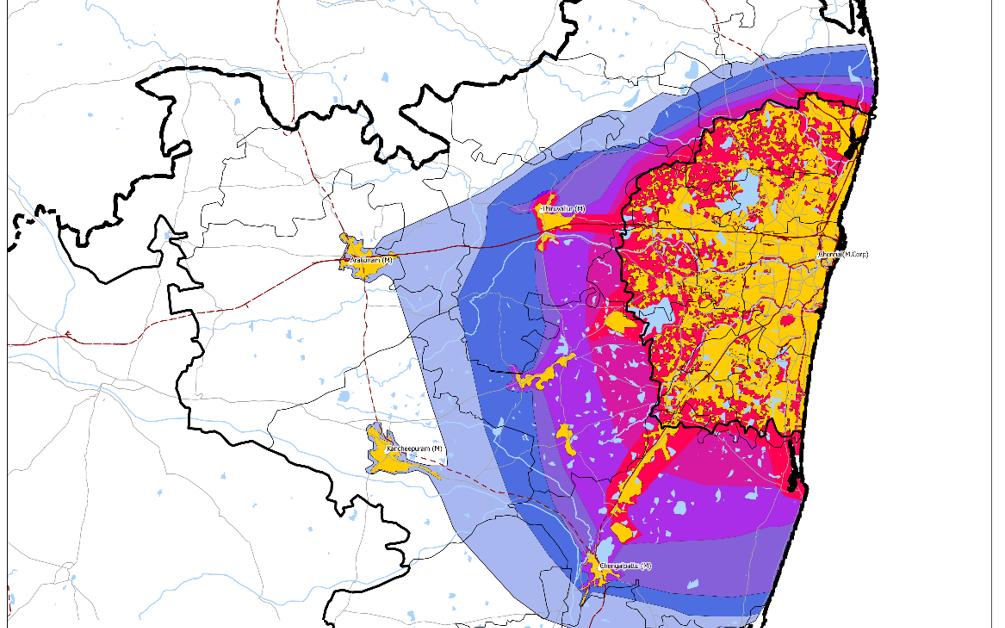
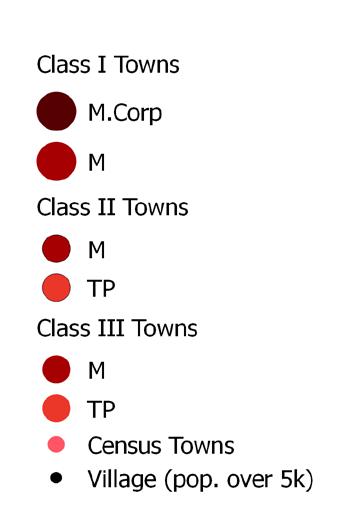
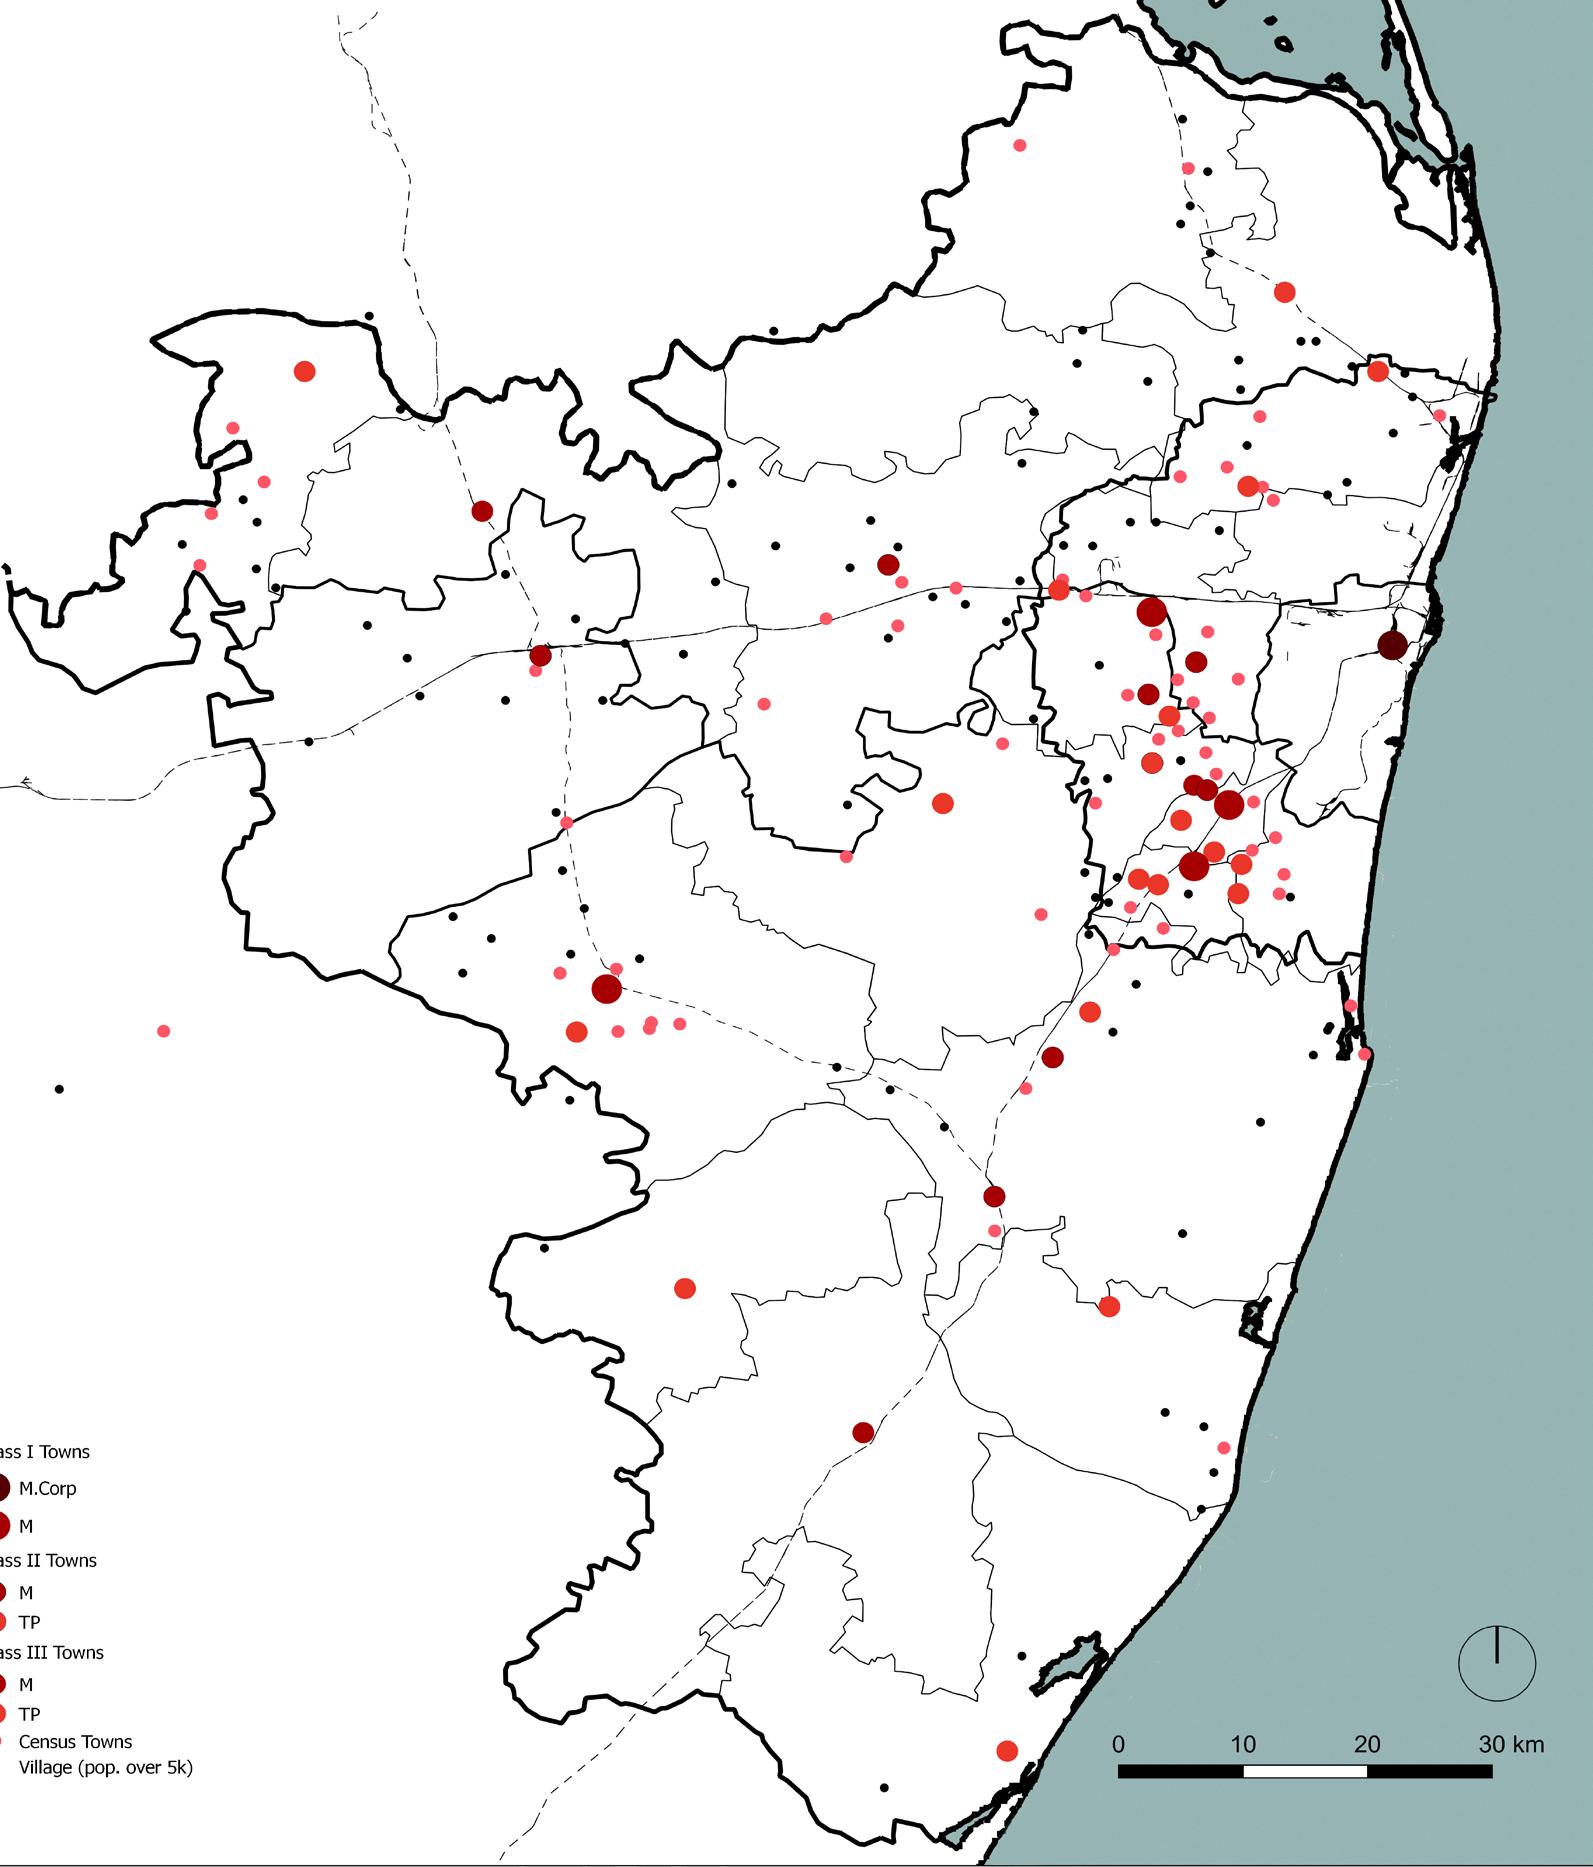
In January 2018, the government of Tamil Nadu brought out a notification announcing the expansion of Chennai Metropolitan Area to 8878 sq. km from 1189 sq. km. It comprises of districts of Chennai, Kancheepuram and Tirulvallur, Arakonam taluka from Vellore district and consists of 1 Municipal Corporation, 14 Municipalities, 20 Town Panchayats and 1888 Villages.
It became a Metropolitan Area in 1971 with an area of 1189 sq. km. Chennai, currently, has many Urban problems, that cannot be solved at a local level like sourcing water for water supply, corridor development
This expansion changes the character of the metropolitan area making it more complex, at the same time it gives us an opportunity to study an area for which no planning has been done yet and propose our own model for metropolitan planning.
4
Part of Group work; map by Gary Naveen
Map 1.1 Expansion of CMDA in 2018
Planning History
1970-80s
1971
Chennai declared Metropolitan Area area; Tamil Nadu Town & Country Planning Act 1971 came into force.
1974
Madras Urban Development Project were urban projects to be implemented within 5 years.
1975
The First Master Plan 1975-95 by Chennai Metropolitan Development Authority (CMDA) came into force.
1980
Non statuary Structure Plan for Chennai by Alan Turner
1990
The 90s saw growth along transport corridors and development of urban nodes.
1995
The Draft Master Plan prepaired by CMDA had to be aborted due protests by citizens demanding public consultation.
1996
Dispersal of certain activities from CBD - Shifting wholesale market from George Town to south-west in Koyambedu.
2000
2002 Bus terminus shifted from George Town (CBD) to Koyambedu
2008
The Second Master Plan 2008-26 came into force.
The Inner Ring Road (IRR) was completed.
Source: Google Maps
2010 onwards
2011
Chennai Municipal Corportation expanded its boundary. The area increased from 172 to 426 sq km.
2017
The Outer Ring Road (ORR) got completed.
2018
Chennai Metropolitan Area expanded to 8878 sq. km from 1189 sq. km
5
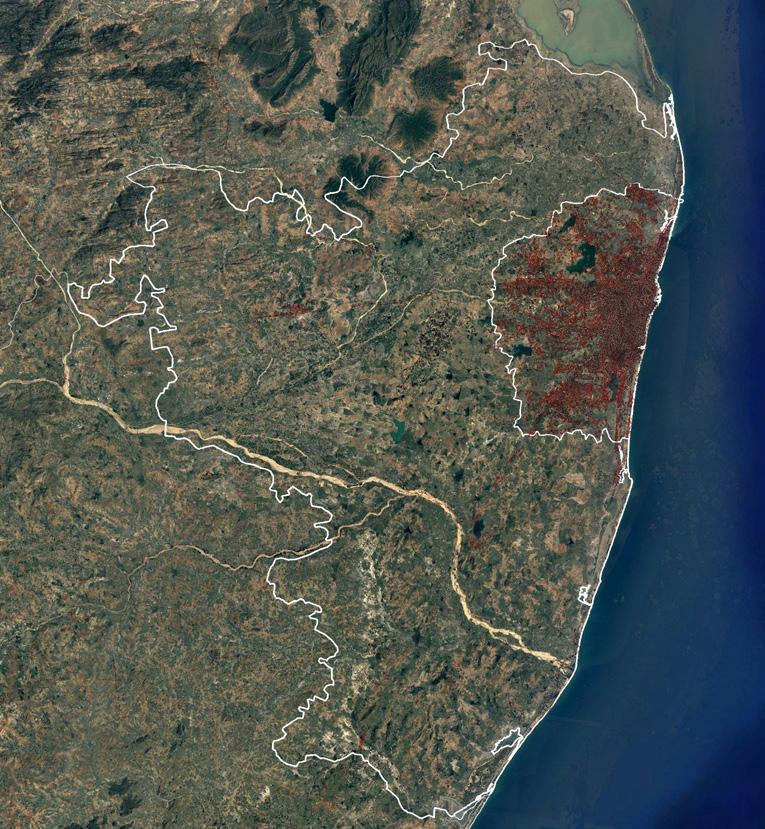
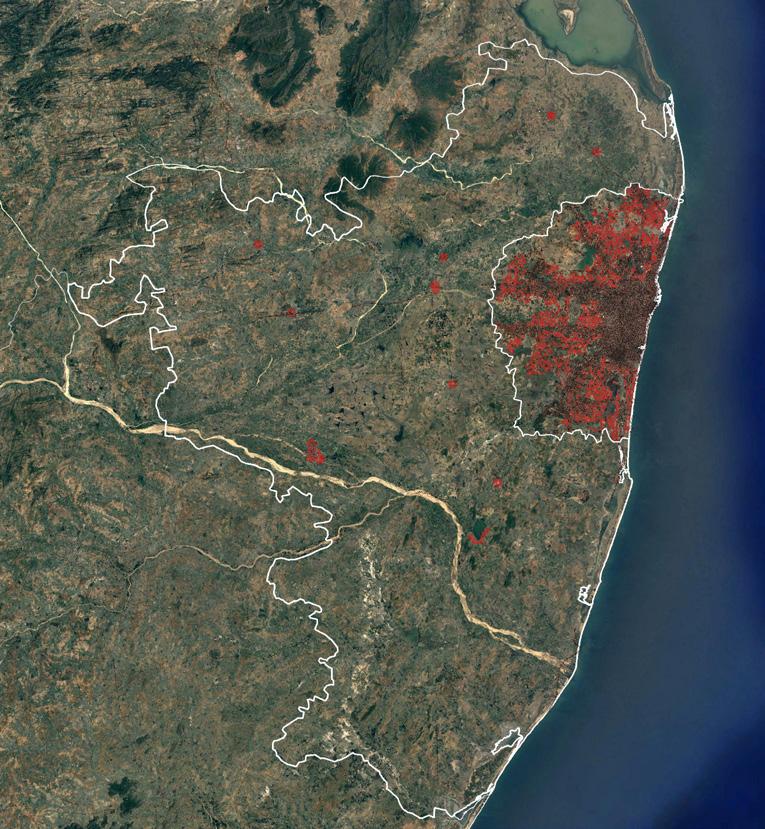
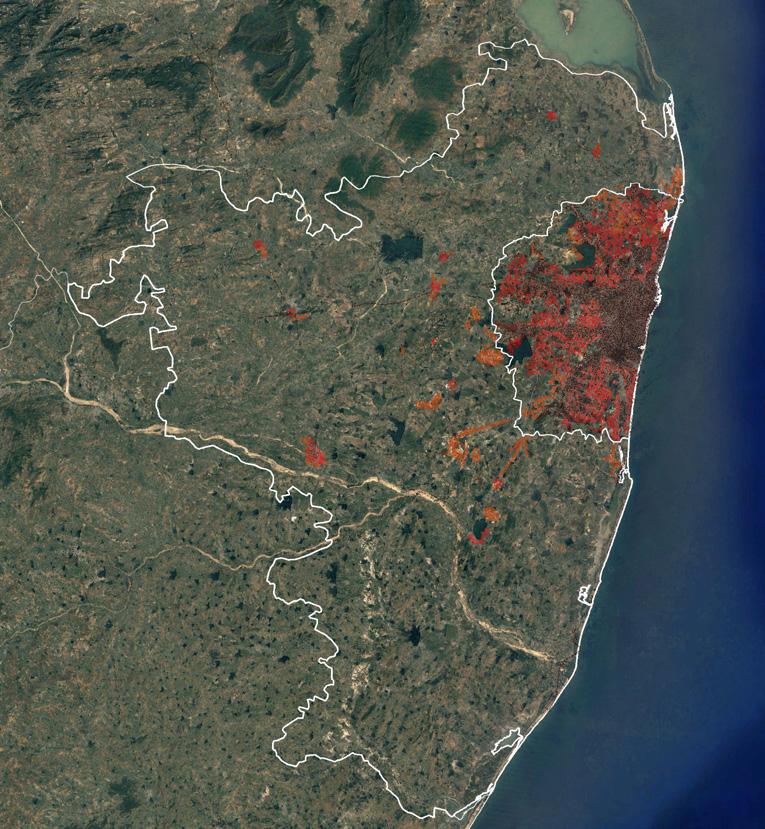
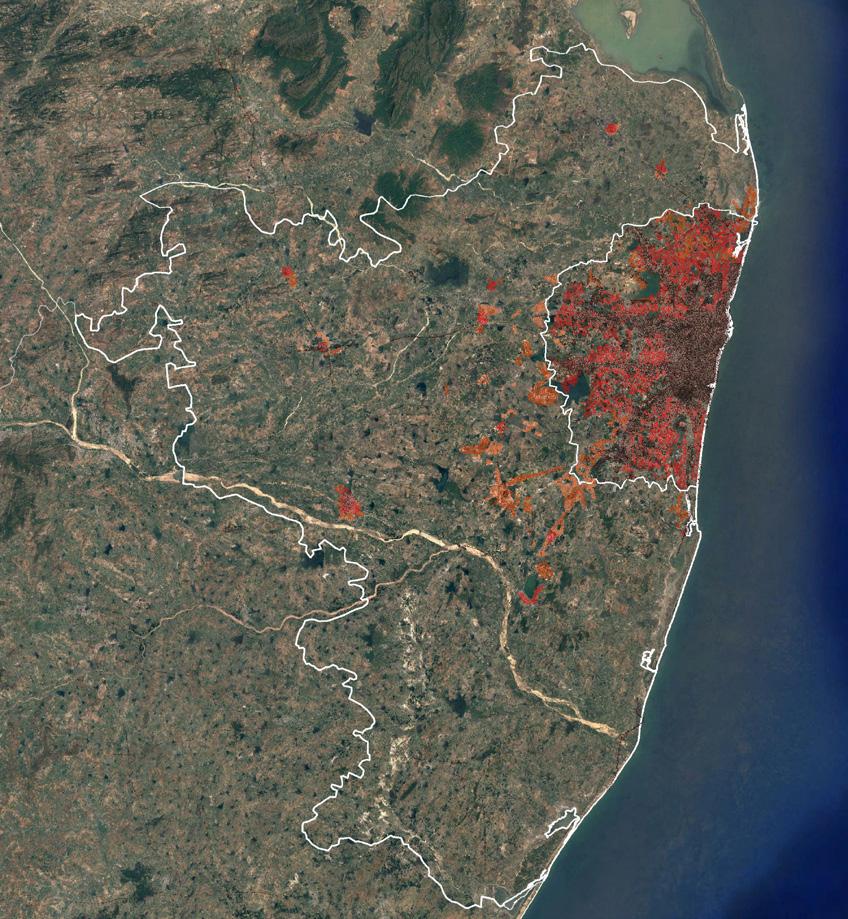
Map 1.2 Built up area 1984
Map 1.3 Built up area 1991
Map 1.4 Built up area 2001
Map 1.5 Built up area 2011
Learnings from Past Planing efforts
Master Plan 1975-95
Land Use Planning was strict as compared to the future plans. There were plans to decongest the Central Business District in George Town. A ring road and express-highways were proposed to relieve congestion in the city along with Rapid Rail system. Mass Housing programs were under taken using World Bank Aid.
This Master Plan tried to aim for things that Planners have no control over like: Restrict the size of the city, recreasing the city population, raise the income level, strengthen large scale industries, Provide educational and health facilities. In order to achieve this Land-use Plan was colored to indicate these uses however on ground it these were not implemented. Only 1 out of 3 satellite towns proposed arrived at its projected population.
Thus, plans became wish lists when such an approach is taken.
Draft Plan of 1995
It was the first plan post economic liberalization. It had flexible zoning with less regulations that encouraged investments. Multistory buildings were allowed outside the city limit. Special Economic Zones were proposed in Sholinganalur, Pallavaram and Taramani.
However there were widespread protests against this plan as there was no public consultation conducted by CMDA and it underwent litigation.
Despite winning the case the plan was scrapped due to the time elapsed while the matter was sub judice.
Data
Structure Plan of 1980
It prepared in CMDA in association with M/s Alan Turner & Associates with the assistance from U.K.
It recommended limited intervention in restricting city growth with an acceptance of for growth. The efficient use of scarce resources, particularly of water supplies. It gave some specific strategies with regards to water management & supply: identifying new source of water, reuse & recycling of waste water & protection of coastal aquifers.
The structure plan also suggested studying RuralUrban interfaces in order to see which areas need to be urbanized. It proposed dense urbanization of the periphery and not creating satellite towns. This plan was non-statutory & was not implemented.
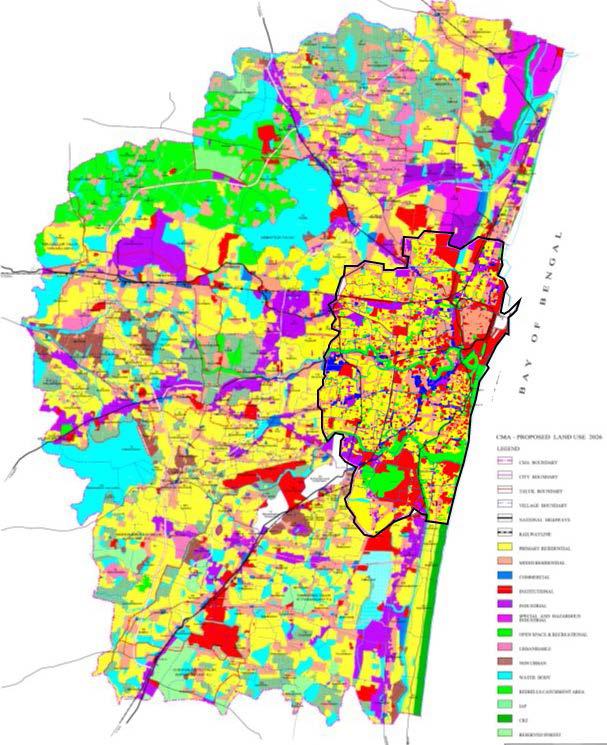
Master Plan 2008-26
Land Use Planing became more flexible. Eco-sensitive areas were marked in the plans and special regulations were created to protect them. But CMDA continued to look at Suburbanization for decongesting the city and a outer ring road was proposed connecting the suburban areas. The other major problem is CMDA does not act as a think tank for the city as it is bogged down with the responsibility of granting land use & building permissions. Housing is not in the scope of CMDA, similarly for transport CMDA only plans the delineation of right of ways and design of major bus terminus’s.
Apart from that, there is no mid-coarse correction mechanism in the master plan, which means this document cannot be revised if required due to any new developments in the area like expansion of the metropolitan region.
6
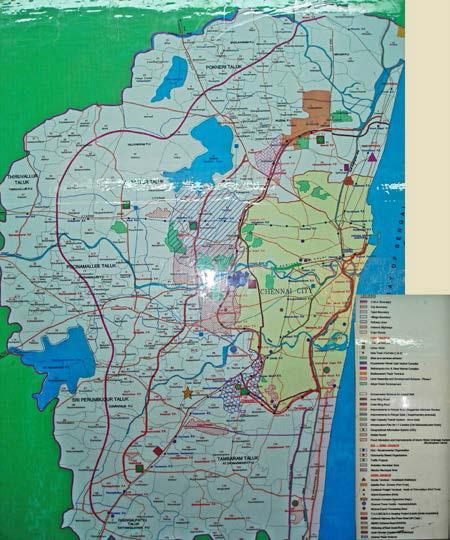
Image 1.1 Madras Master Plan 1995
Image 1.2 Chennai Master Plan 2026
Source: CMDA Master Plan 2026 Vol 3 Chapter 2
Impact of Existing Transport Network
Major Road Network
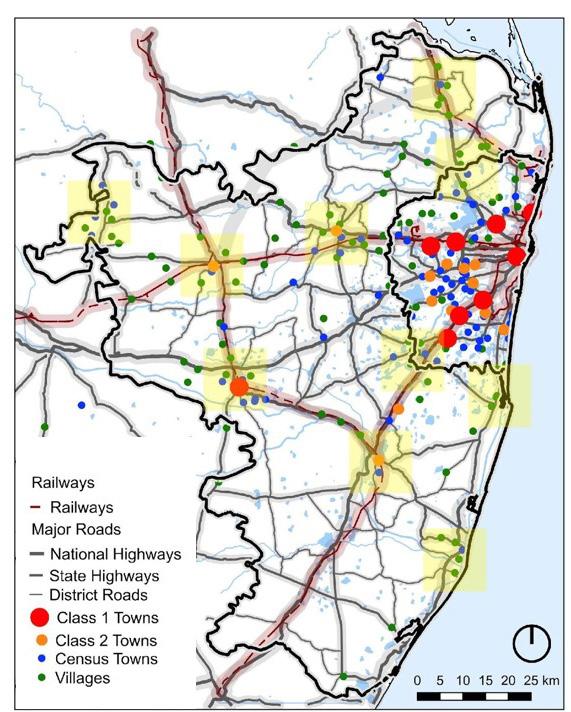
The road network in Chennai consists of five major highways. The city is observing ribbon growth along these highways particularly in the south-west & west. Apart from these highways two ring roads are also part of the road network. The Inner Ring Road (IRR) was completed in 2008, while the Outer Ring Road (ORR) got completed in 2017. These roads have a impeding effect on the ribbon growth of the city.
(See Map 1.6)
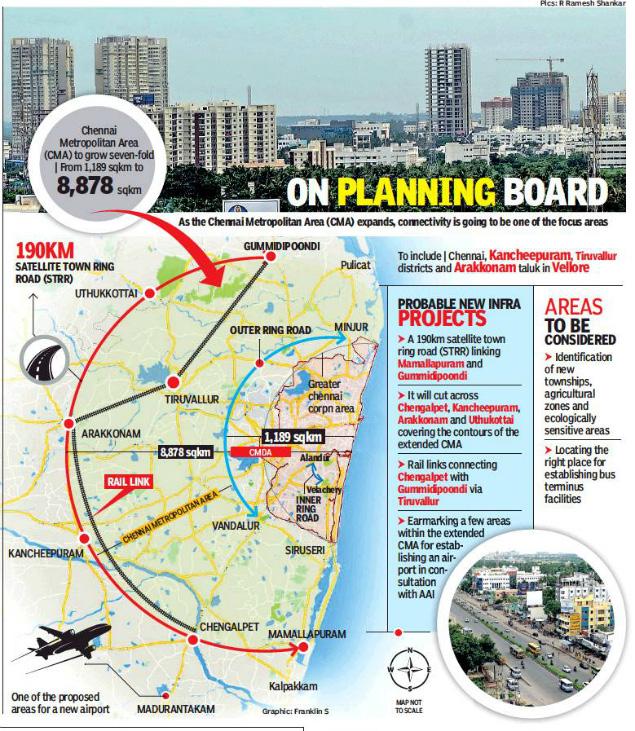
Another ring road under consideration, is the Satellite Town Ring Road (STRR). It will be 190 km long and will be connecting satellite towns like Gummidipoondi, Uthukkottai, Arakkonam, Kancheepuram, Chengalpet & Mamallapuram. [1]
Public Transport- Suburban Rails
Chennai has the Mass Rapid Transit System (MRTS), Metro & the suburban rails under public transport. Out of these public transport systems only suburban rails connect far aways satellite towns like Gummidipoondi, Avdi, Arakknam, Kancheepuram, Tambram & Chengalpet.
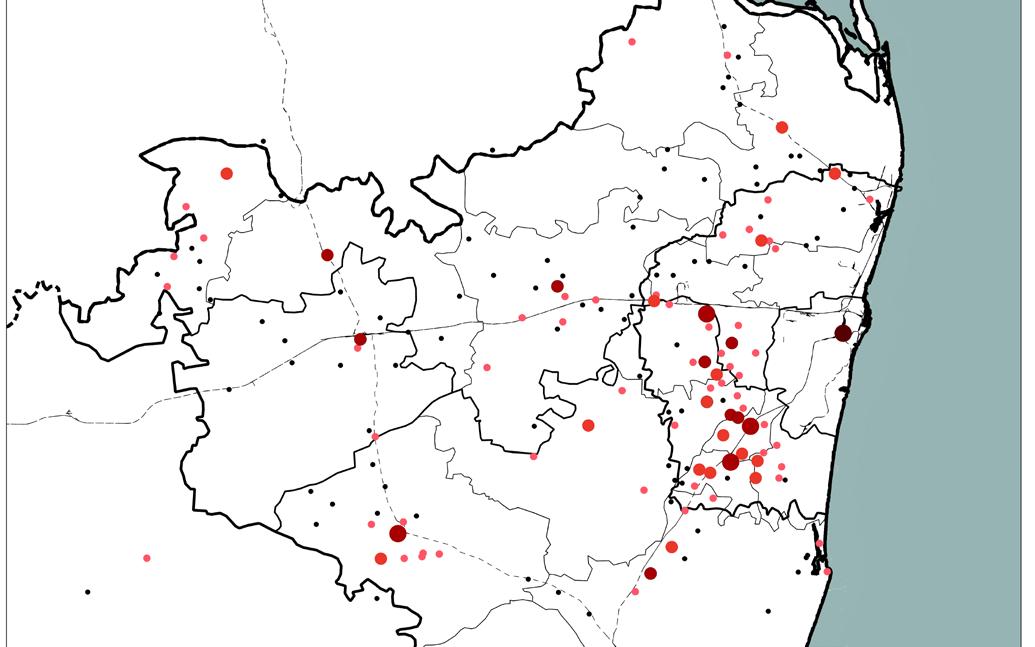
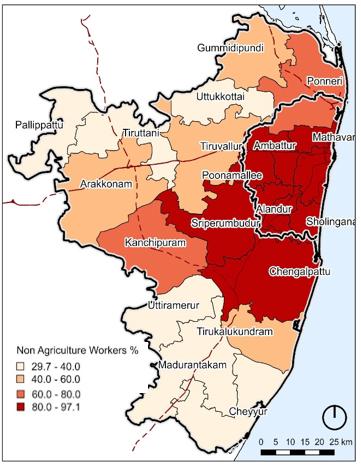
Superimposing the percentage of Non Primary Sector workers in talukas with the suburban rail network (See Map 1.7) we find that talukas with suburban rail connectivity have higher percent of population working in secondary and tertiary sector and less in agriculture sector. This can be treated as a proxy of commuter movement to Chennai in absence of commuter data.
Road
Prop. Road
1
2
7
Map 1.6 Ribbon growth along Road networks
Map 1.7 Non-Primary Sector Workers (%) [2]
News report
Data Source: Census 2011
Delineation of boundary
Theories for delineation of a boundary
Theoretical models have been proposed to delineate the boundary of a metropolitan region:
The Law of Retail Gravity was proposed by W J Reilly in 1929, said that the distance, in itself, is not the sole factor to attract buyers but also the attraction of being located in big centers.
Breaking Point theory by Converse in 1949 explains the there is a point beyond which every market centers has their own exclusive buyers. It was based on Reilly’s Law of Retail Gravitation. The Breaking point defines the predominant flow of goods, services and commodities to the city core. It defines the zone of competition which is the zone around breaking point, the near outer
Delineation of new CMA
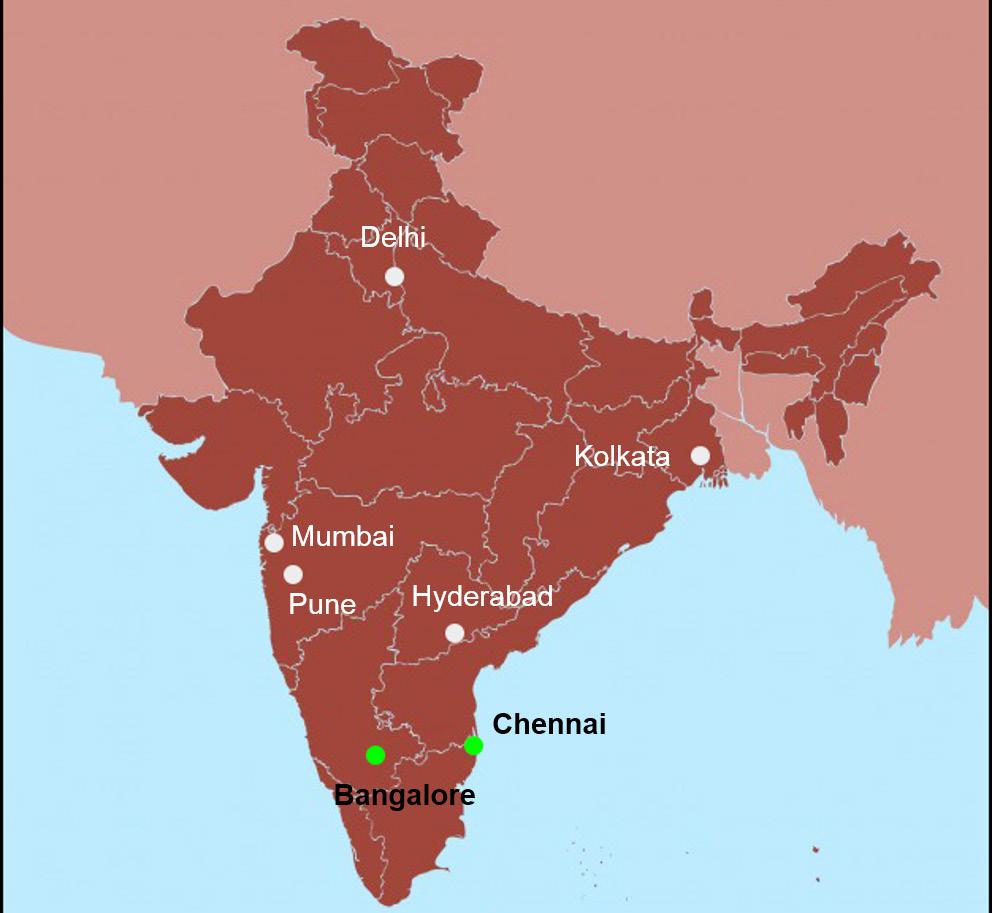
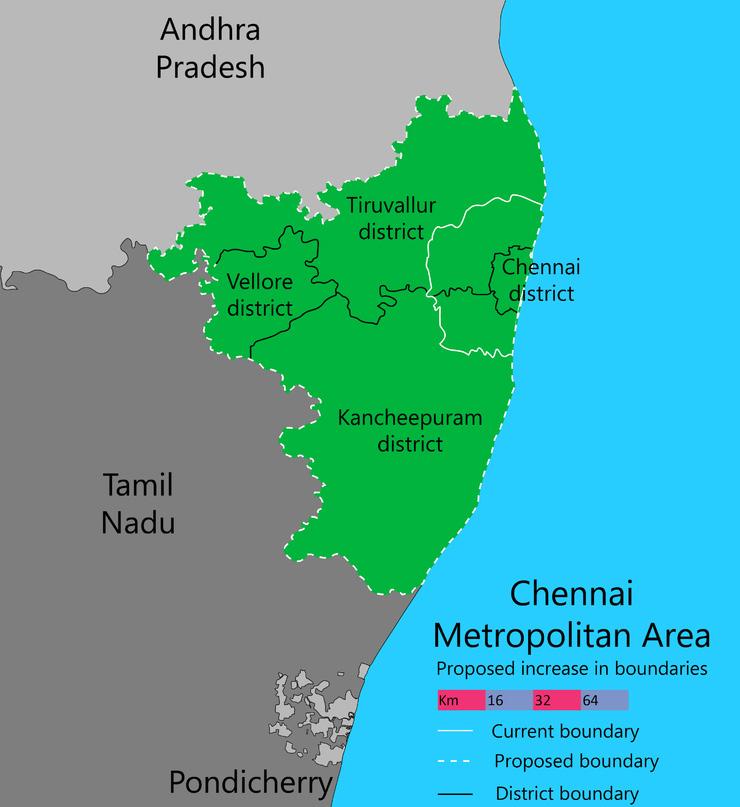
The new CMA comprises of three full districts: Chennai, Thurvalur and Kancheepuram and a taluk from Vellore district: Arakonam. The districts may have been added completely for the ease of administration.
Arakkonam taluka is the only part in the new CMA added from Vellore district. Vellore district is not adjacent to Chennai and hence it is understandable why it has not been completely subsumed under it. Arakkonam has been added to CMA as it is an important railway junction and is the last stop of the suburban rails. It’s location is also important for the proposed Satellite Town Ring Road (STRR.)
boundary of the metropolitan region & the zone of Influence, which is inner part metropolitan region.
Potential model has been applied in demographic, geographic or economic studies to define the interactions between phenomena. In metropolitan planning it gives the relativity of spatial potential of interaction for different locations with in metropolitan region. Potential Model and its temporal analysis on metropolitan area would reflect that whether the development is spreading or not.
As the boundary for Chennai is already delineated we have not applied these models for the city, however we wish to investigate the reasons for Channai’s expansion to its current area.
However further investigation into the mater shows that the reasons for Chennai’s expansion to its current boundary with an area of 8878 sq. km is said to largely politically motivated and is due to the influence of other models of metropolitan planning in the country.
Before the expansion another option was being considered: this option had Gummidipoondi and Uthukottai taluks in the north, Sriperumbudur in the west and Chengalpattu in the south and area of 4,400 sq.km. However, this option was rejected.
Government sources said they proposed the idea of a larger Chennai region after studying cities such as Mumbai, Hyderabad and Bangalore.[1]
8
Metropolitan Region Area (sq. km) Year of declaration/ expansion Chennai 8860 2018 Bangaluru 8005 2007 Hyderabad 7257 2008 Pune 7257 2015 Mumbai 4355 1975
Nadu
Table 1.1 Areas of Metropolitan Regions studied by Tamil
Government [2]
Srivathsan,
Data Source CMDA, BDA, HMDA, PMRDA & MMRDA websites
Map 1.8 Regional Context of Chennai 1.
2012 2.
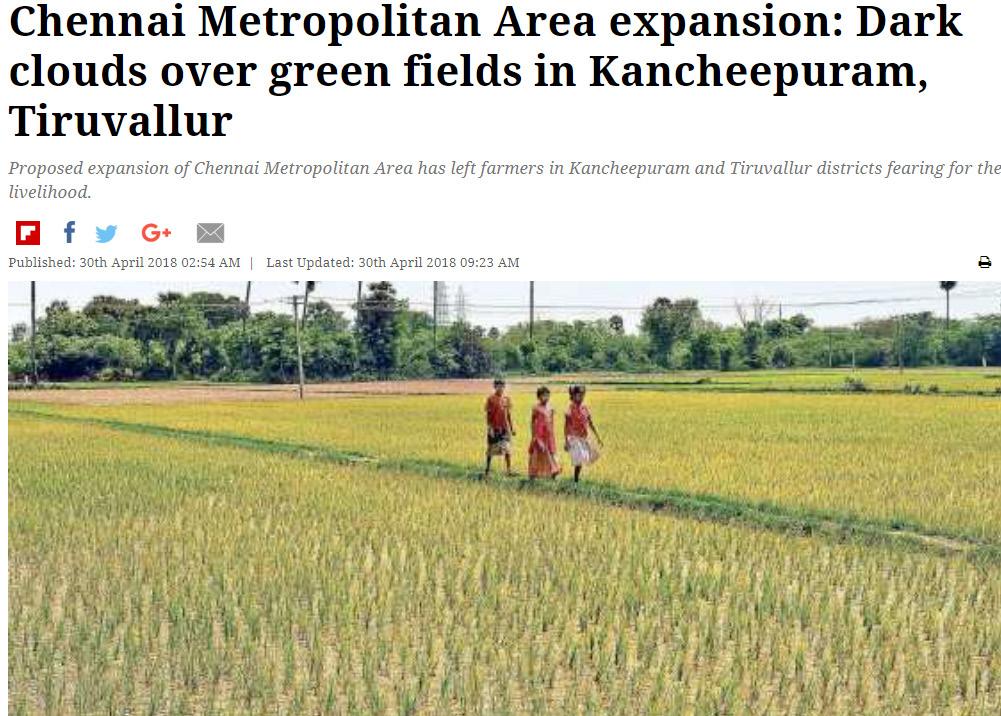
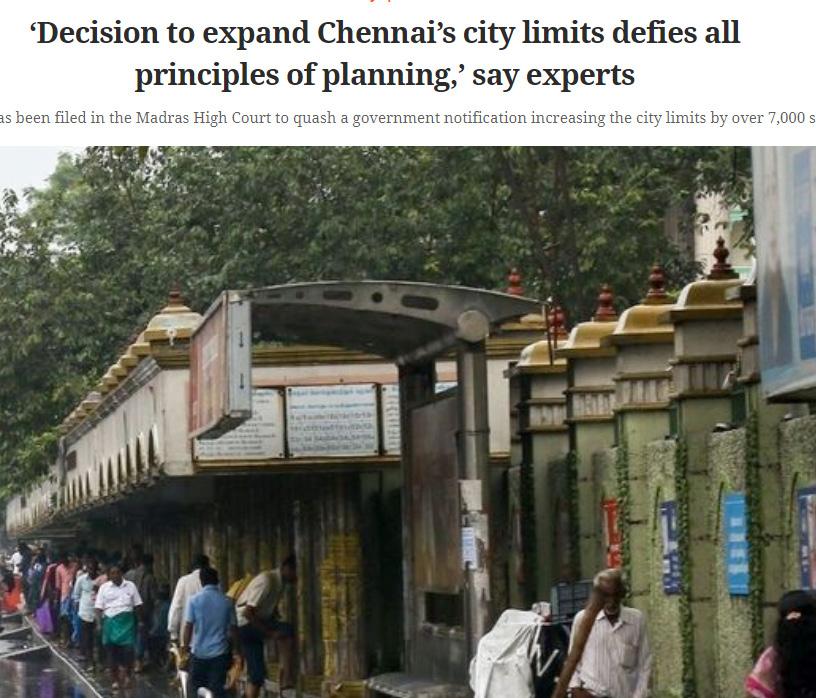
Newspaper Reports on the expansion of Chennai Metropolitan Area. In absence of primary survey these reports serve as a proxy for people’s voice.
Following are few newspaper clippings we refereed:
A petition has been filed in Proposed expansion of Chennai Metropolitan Area has left farmers in Kancheepuram and Tiruvallur districts fearing for their livelihood.
Source
1 Kabirdoss Y, Jan 2018, Govt set to dust out old plan as metropolis maps new contour, Times of India
2 Vishwanathan N, April 2018, Indian Express
3 Govindrajan V, May 2018, scroll
4 BS Reporter, Nov. 2018, Business Standaard
9
A petition has been filed in the Madras High Court to quash a government notification increasing the city limits by over 7,000 sq km.
“We have identified governance as an important factor in the effective functioning of large cities,” said Shiv Kumar, president of MIPR
1 2 4 3
Module II
Need for Governance
There is a need for an entity to look at governance at a Regional level with the expansion of CMA, as there are many local bodies with different jurisdiction and functions within the metropolitan boundary. CMA has the following bodies: a Municipal corporation, 14 Municipalities, 20 Town Panchayats and 1888 Villages Panchayats. There are about 76 census towns, which may become statutory towns soon and have their own urban local governments. All these bodies, alone, will not have the resources nor the political will to develop the entire region
These local bodies with in the metropolitan area are not all at an
equal footing. The Greater Chennai Corporation (GCC), by the virtue of being a Municipal Corporation is more powerful than the Municipalities which in turn are more powerful than Town Panchayats and Block Panchayats. Therefore, if left to local bodies we may see inequitable development.
Some Metropolitan area wide projects need to be carried out for efficient functioning of the entire area. This requires, coordination with a lot of departments at centre and state (parastatals) level. The local government do not have the powers to direct these departments, nor do they hold the purse strings to fiscally control them.
Current Governance framework: MPC
In India Metropolitan Regions are governed by Metropolitan Planning Committee. The Constitution of India makes it mandatory for the States to set up Metropolitan Planning Committees (MPCs) in the metropolitan areas of the Country. Tamil Nadu has an Metropolitan Planning Committees Act since 2009 but no MPC was formed for Chennai till date. This is because states don’t want to let go of Metropolitan Areas.
The MPCs are committees formed by indirectly elected members of the ULBs of the metropolitan region, who themself have limited political power. The MPC in Tamil Nadu as per act has a of functions which are not clearly defined but have no financial powers nor is their level in the government defined. They are expected to coordinate with a lot of State level agencies, yet they have no power over them.
10
74th Constitution Amendment Act
Tamil Nadu’s Metropolitan Planning Committee Act 2009
Map
2.1 Statutory Towns & Census Towns 1.
2.
DTCP
CMDA
Proposed Governance Framework
The metropolitan area should have a separate governing body. We as a group have proposed the structure of this body referred to as Metropolitan Planning Entity. (MPE) The MPE is not radically different from the MPC, we have tried to incorporate as much as we could from the existing framework.
The MPE will have two arms - the legislative arm and the executive arm:
The legislative arm would be made up of indirectly elected representatives & nominated members. Every member local body must send there members to the MPE with in 3 months of the elections.
The executive arm will consist of all the departments, working in the Metropolitan Area. They will provide the body with their technical expertise whenever required. The CMDA can remain under this arm as the planning agency along with planners from DTCP.
For the body to be able to function in multijurisdictional capacity, it has to function at the state level hence we have placed this entity under the direct supervision of the CM of the state. It will also empower it to undertake functions that may/may not lie within the jurisdiction of other local bodies
State Cabinet Ministry
Legislative Arm
Members of ULBs
District Panchayats
MPs & MLAs
Nominated by CM based on projects
Chief Minister
Chennai Metropolitan Planning Entity
Executive Arm
State Cabinet Ministry
Various Sector wise Committees
Advisory Role
Department of: Water Finance Planning Transport Environment
11
of
&
Part
Group work; Governance Framework proposed by Gary
Pratiksha
Metropolitan Finance
In Metropolitan Region there are some overlapping political jurisdictions but the population that lives and works there requires some common services like public transport, which may lead to demands of elevated financial resources. Most cities that make up a metropolitan region are in no condition to come up with such large sums alone. Execution of the actions also goes beyond the cities’ local leaders’ political mandates, which ends up generating a lack of interest on the part of the elected authorities. Thus, there is a need to empower the
Governing body of the Metropolis with financial powers.
We should not hand this power to the center or state because finance like the functions should follow the subsidiary principle. This will have a twofold benefit: we shall have accountability: with their own revenue and income the entity can engage parastatal agencies or even private sectors and the metropolitan level entity shall also take responsibility of not overspending the finances.
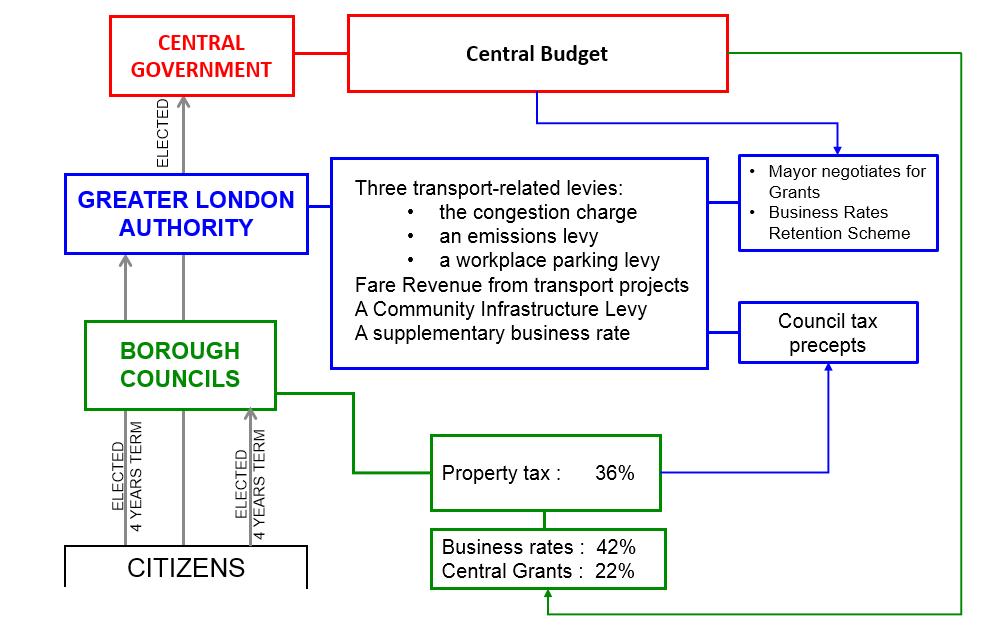
In London, 52% of the Greater London Authority’s budget comes from its own incomes, 38% from Central Grants & 10% from the Local Borough. This budget funds Transport: 59%, Police: 27%, Mayor’s projects get 9%, fire
One of the major reasons why MPC does not work is because according to the Act, they don’t have money even for their own administrative purpose. They are dependent on local bodies for the money, who themselves are dependent on the State for it.
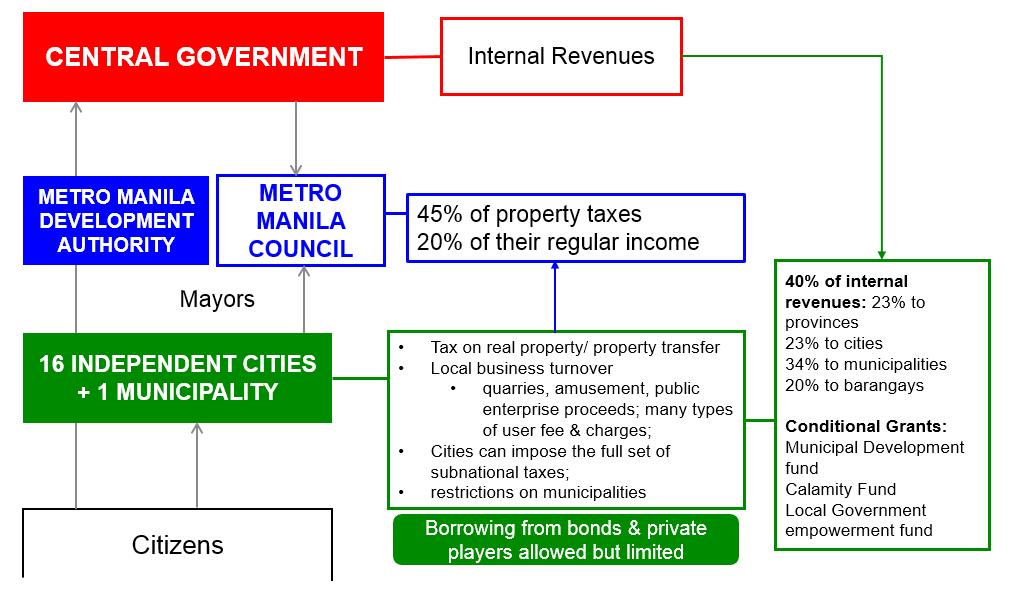
International good practices in London & Metro Manila show that good metropolitan governance requires financial powers.
department gets 4% and rest of the departments get less than 1%. [1]
In Metro-Manila, 42% of the budget goes into Flood control, transport & solid waste management get 27% each. [2]
12
Image 2.1 Finance in London [1]
LSE London, GLA Budget 2017-18
Metro Manila Budget 2018
Financing Metropolitan Governments in Developing Countries
Image 2.2 Finance in Metro-Manila [3]
1
2
3
Proposed Financial Model for CMA
Devolution of Finance
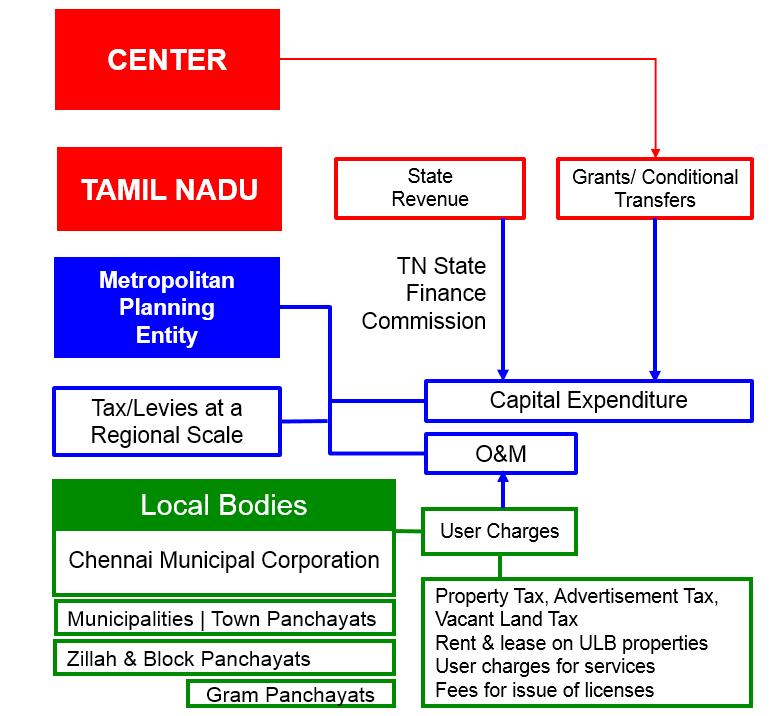
Currently Tamil Nadu state devolves taxes like Property Tax, Advertisement Tax, Vacant Land Tax collected by it to the local bodies. The local bodies also get money from rent & lease on their properties and user charges for providing services and fees collected for issue of license. This isn’t sufficient revenue base for them, especially for the municipalities & town panchayats. The State devolves its own revenue through Tamil Nadu State Finance Commission. Further, parastatals collect their own user charges.[1]
When the Metropolitan Entity is in place the capital expenditures of all projects/programs dealing with regional scale infrastructure will be met through State Government transfers or Central Government Grants.
Possible Revenue sources ?
Operation costs will routed through the Local Governments. This will make the entity more accountable to the local bodies. The Metropolitan Entity may levy some direct tax or levies at a regional scale for facilities it is directly providing to the users.
Example: In the case of Transport, road tax collected in CMA may be devolved to meet the capital expenditure of creating new roads & Vehicle coming inside the region may pay toll tax, both these measures can be used to finance road network expansion.
In the case of Water Supply, grants and devolved funds may help set up the trunk infrastructure & meet the capital expenditure. But ULBs should be tasked with collection of user charges & then they should pay the metropolitan body for the service rendered.
With Goods and Service Tax (GST) in place, taxation has become more centralised. States and local bodies have lost a part of their income sources like octroi. The current trend in India is more towards conditional grants from center which is worrying as local bodies will only get funding if they meet the conditions. For the financial model to work, dependence on Center & State funding is inevitable in the current scenario.
We reflect none the less: What can be done by the local government to increase their revenue? Should they levy betterment charges, should they look at land value capture? [2]
13
1 Tamil Nadu Fifth State Finance Commission Report 2 Financing Metropolitan Governments in Developing Countries
Image 2.3 Financial Model for CMA [1]
Module III & IV
Need for Land Potential & Suitability Analysis
CMA was expanded to an area of 8,877 sq. km in January 2018. There in a lack of clarity, currently on how to deal with this seven fold expansion of CMA. We as a group had a telephonic conversation with Thiru M. Shivashanmugam, Cheif Planner CMDA and he told us that while CMDA is going to be the planning body for the Metropolitan Area, it is still undecided how will they plan the region.
There is also a lack of studies or analyses made for this new region as on date, due to the expansion being a recent development. Therefore we as a group carried out the Land Potential & land suitability analysis. This was done in order identify the areas where sectoral projects are required and to help us make the Strategic Plan.
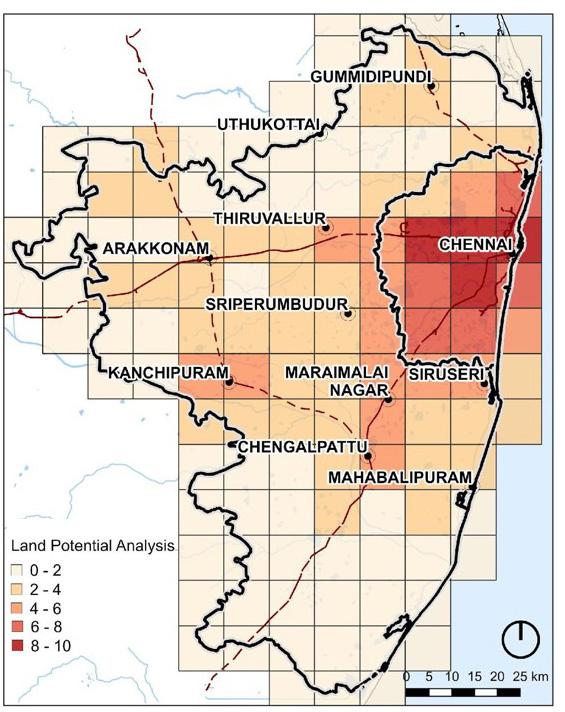
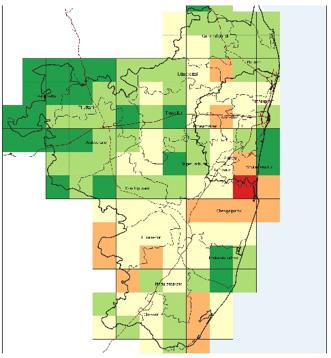
Land Potential Analysis
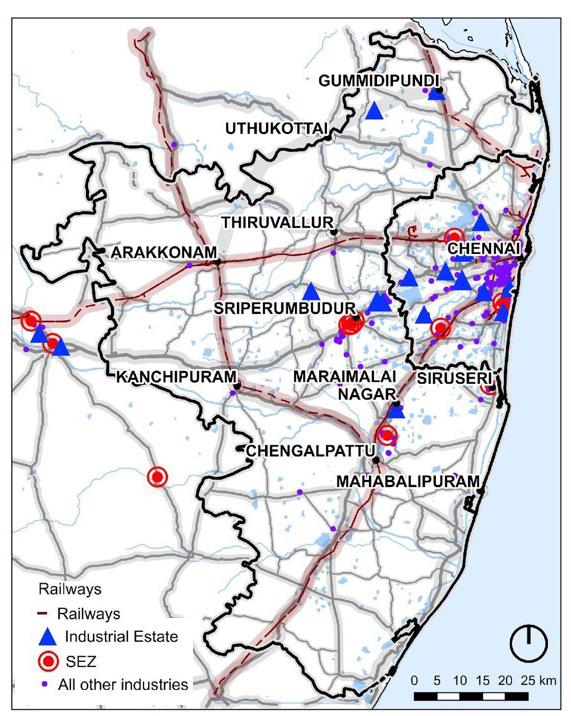
Land Potential Analysis is concerned with the potential growth of the city based on past urbanization trends. For this analysis we have mapped the Roads, Railways, Urban Settlements, Industrial Areas and a taluka wise Urbanization Index to find out the areas with the highest potential for development.
A grid of 10 sq km was taken as a unit for analysis, to combine taluka wise data with point source & linear data.
14
Map 3.1 Urban Settlement Density
Map 3.2 Road, Rail & Industries
Map 3.3 Land Potential Analysis
Part of Group work, Maps compiled & generated by Aparna Ramesh
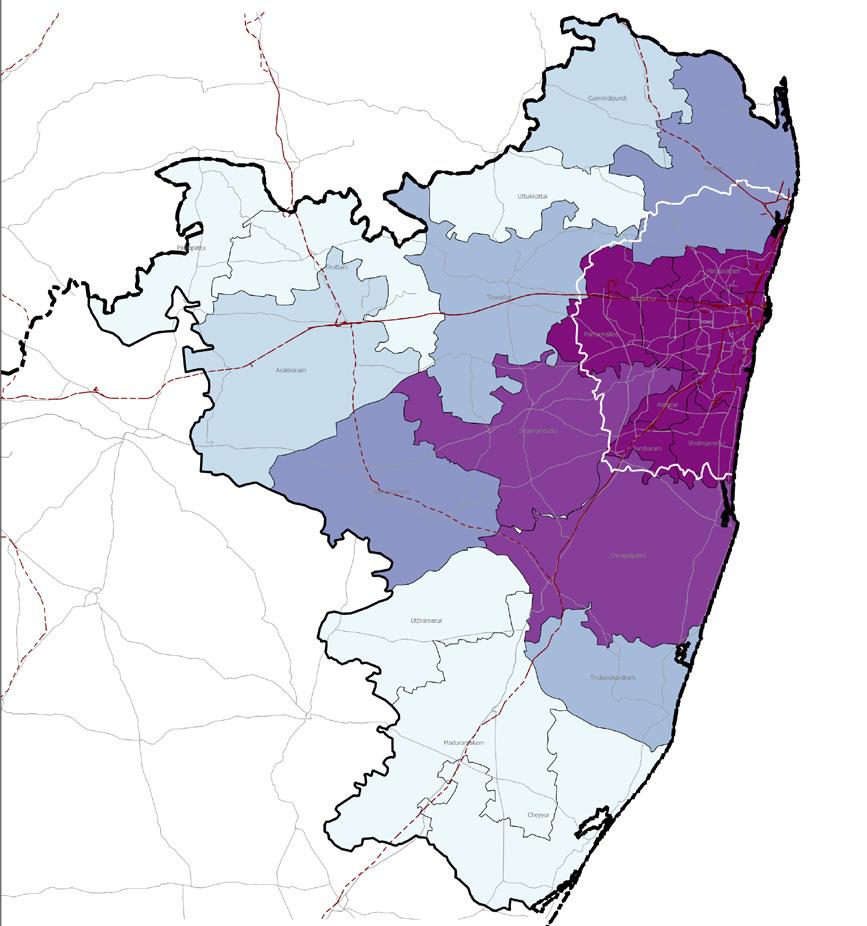
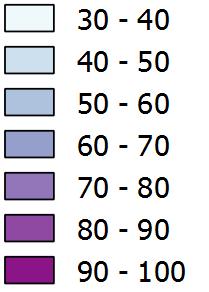
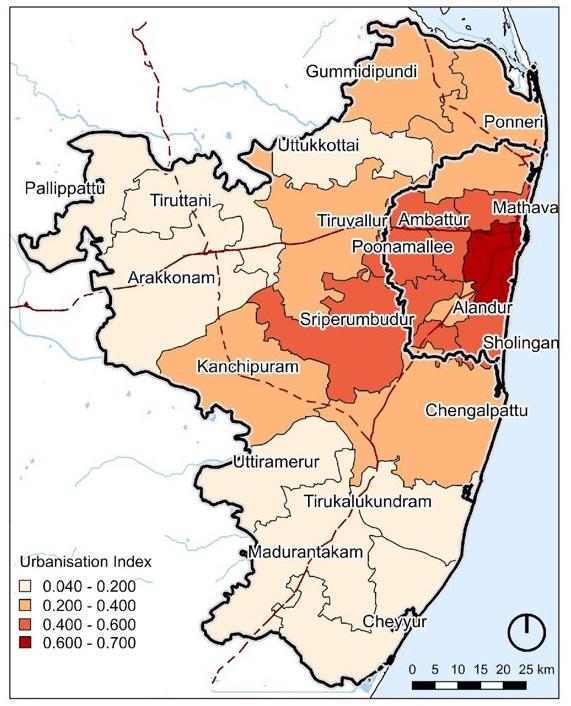
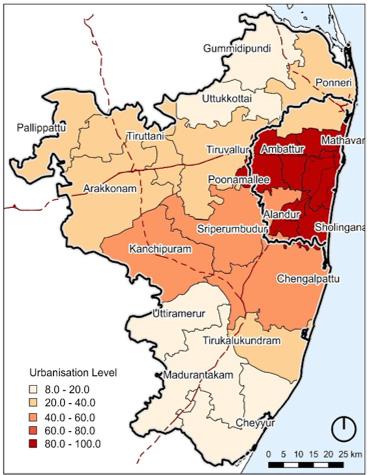
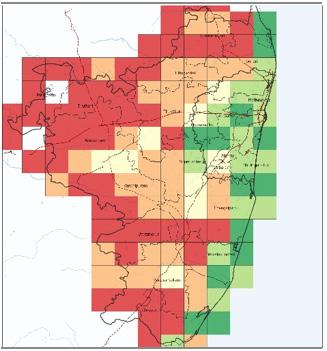
Urbanization Index
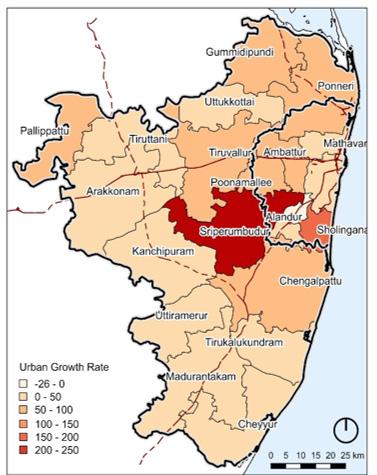
The Urbanization index has 3 times the weight in Land potential as it considers Urbanization Rate, Urban Growth Rate, Population Density and percentage of population working in sector other than agriculture. All these factors were normalized and then averaged to present the taluka wise urbanization index. It shows that the areas surrounding Chennai are the most urbanized followed by the regions to the south and the west.
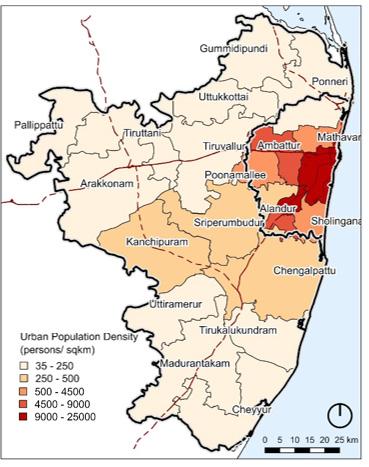
3.7 Population Density (U)
Maps compiled by author
Data Source: Census 2011
15
Map 3.4 Urbanization Index
Map 3.5 Urbanization Levels
Map 3.6 Urban Growth Rate
Map
Map 3.8 Non-Agriculture Workers
Land Suitability Analysis
Land Suitability refers to the ability of a types of land to support a specific use, and the process of land suitability classification involves the evaluation and grouping of particular land areas in terms of their suitability for a defined use.[1] We carried out this analysis to determine which areas were the most desirable for future development. After mapping the water bodies, forest areas, catchment areas, ground water levels and agriculture index, giving them appropriate weight, we arrive at the land suitability map for urbanization.
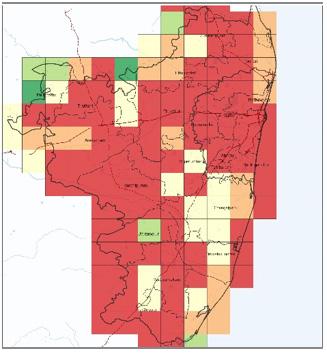
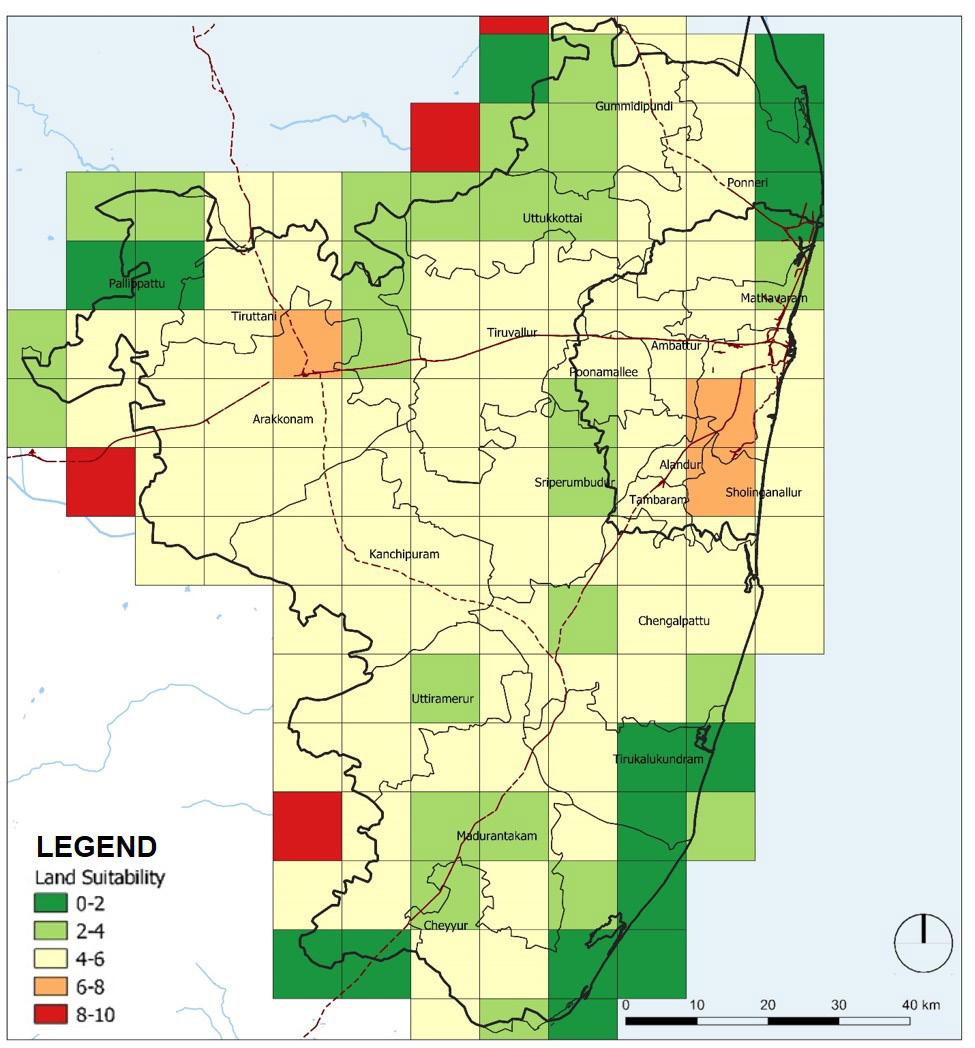
The same grid of 10 km by 10 km has been taken for Land Suitability Analysis as Land Potential Analysis in order to compare and combine. The gird with a higher score is more suitable for urbanization.
We have combined these two analysis’s to get the Comprehensive Map
16
Map 3.11 Agriculture Suitability Weight x 1
Map 3.12 Basin Suitability Weight x 1
Map 3.13 Water Potential Weight x 1
Map 3.14 Land Suitability Analysis
Map 3.9 Water Bodies Weight x 2
Map 3.10 Reserve Forests Weight x 2
Part of Group work, Maps compiled & generated by Gary & Shivangi
1
Prakash, 2003
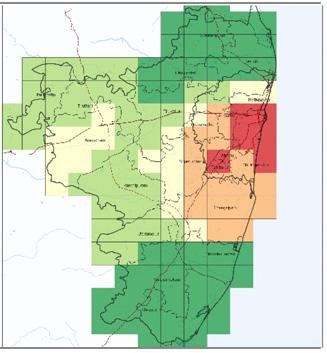
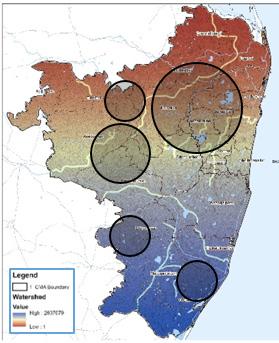
Comprehensive Analysis
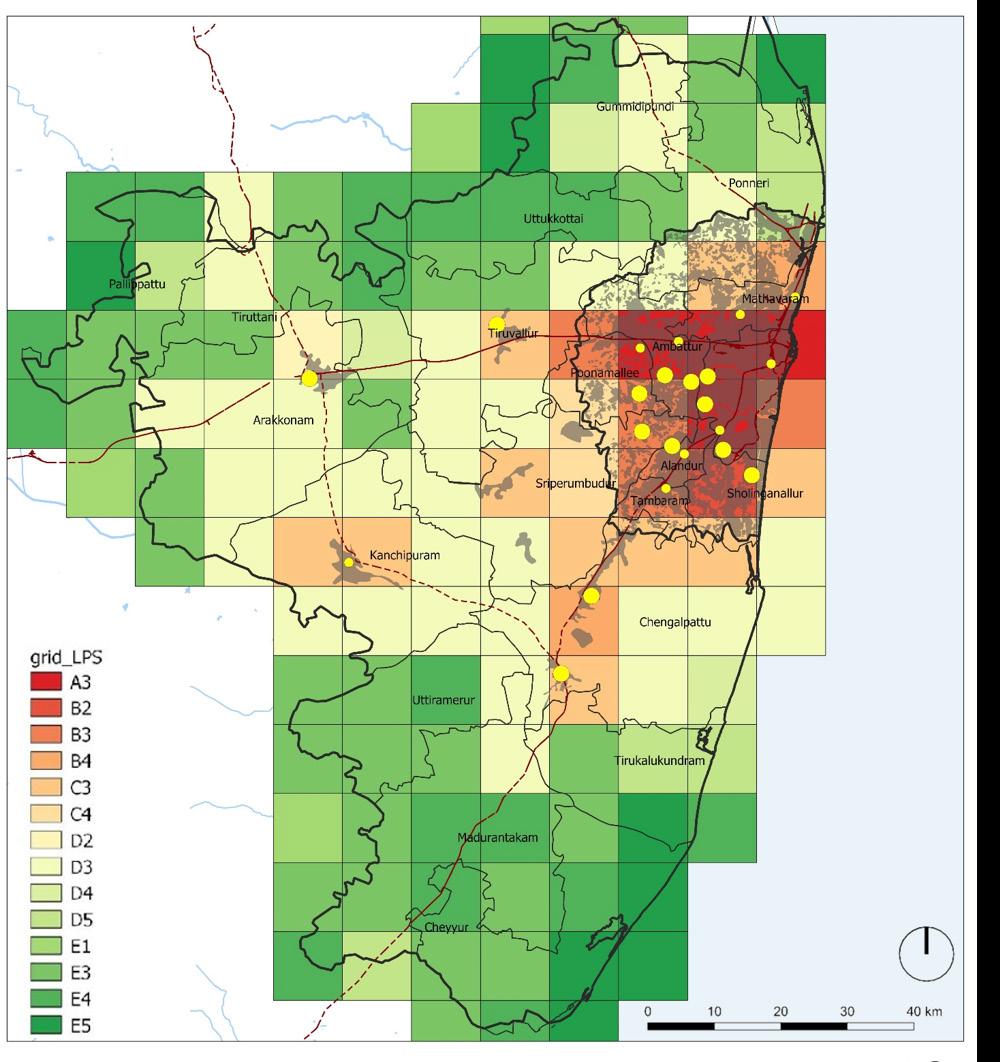
Inferences
From both Land Potential & land Suitability Analyses we find that expansion in the south-west and west have the highest potential as well as suitability.
The northern and extreme southern areas have lesser development potential than the rest of the regions. Also, as these regions are prime agricultural areas and hence, development ideally should be phased later in these regions.
The areas marked in Map 3.15 indicate area that are good for urbanization as per both land potential and land suitability.
We realize that planners in India, in the current situation, cannot protect these areas by controlling the market as they don’t have that power. The controlling approach may lead to haphazard growth, illegal developments and in the worst case creates more distortion in the market, escalating the very problems that the plan was trying to solve.
Therefore, our approach in this module while taking up sectoral projects has been to control rather than regulate
17
Map 3.15 Comprehensive map
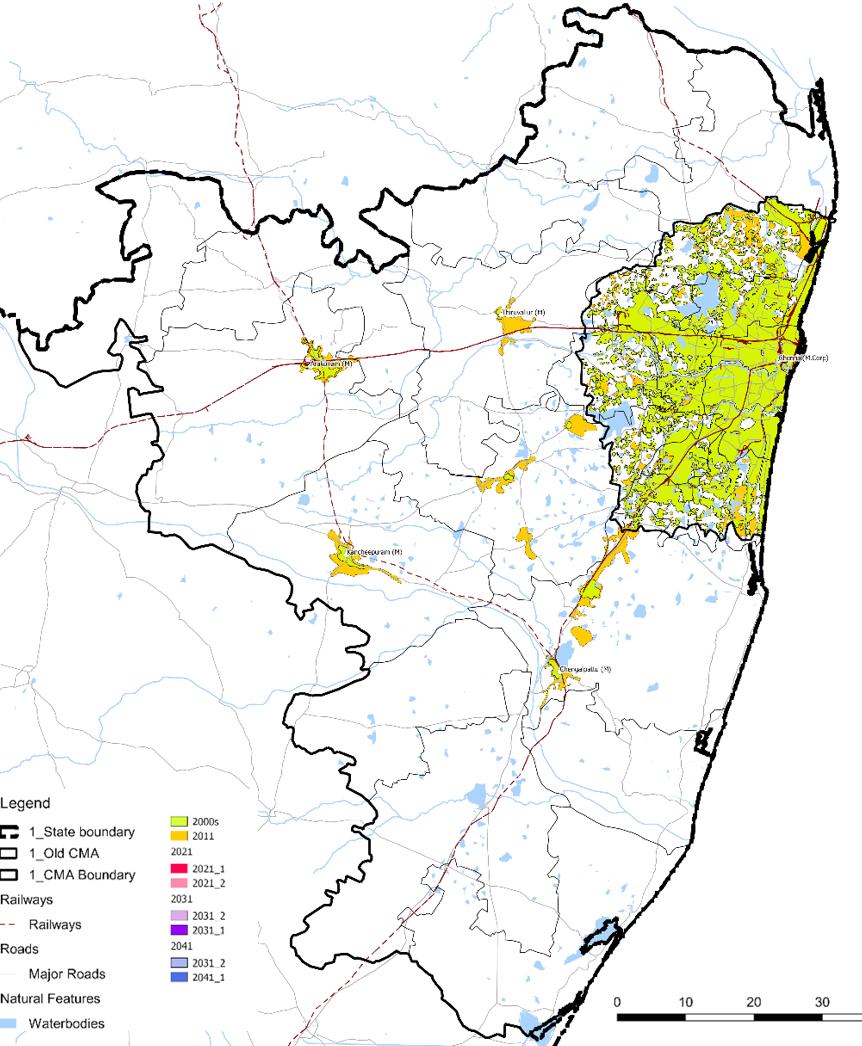
Projecting the Urban Spatial Growth
After the land suitability and land potential analysis we have focused on our proposal for which we projected the future urban spatial growth of the city using Solly Angel’s Making Room Approach. This gave us a spatial idea as to where should we focus our strategies as well as a justification for giving a strategic plan in the area.
According to Angel, urban land cover in cities is projected, countries, and regions the world over will take place under three densities change scenarios, as per his observations globally, which are:
In case of high projection of urban sprawl, a 2 percent annual rate of density decline is assumed, corresponding to the average rate of decline in the global sample of 120
cities, 1990–2000. In the case of medium projection of urban sprawl, a 1 percent annual rate of density decline, is assumed, corresponding to the short-term rate of density decline by the end of the twentieth century, as observed in the representative sample of 30 cities.
In the case of low projection of urban sprawl constant densities, are assumed, corresponding to the observed rate of urban tract density decline in the 1990s in U.S. cities.[1]
In Chennai (UA), between 2000-11, the population density declined annually at the rate of 1%. Therefore, there are two spatial growth projection scenarios 1 % annual decline in density (as per trends) and 2% annual decline in density (extreme case.)

18
2001 2011 2021 2031 2041 Population 6,686,140 8,653,521 11,141,890 14,345,804 18,471,021 2% density decline Area (Ha) 74,824 105,137 165,676 261,075 411,407 Density (ppl/ha) 89.4 82.3 67.3 54.9 44.9 1% density decline Area (Ha) 149,682 213,100 303,388 Density (ppl/ha) 74.4 67.3 60.9
1 Angel, Parent, Civco, & Blei, 2011
Map 3.16 Spatial Growth 2001-11
Table 3.1 Spatial Growth
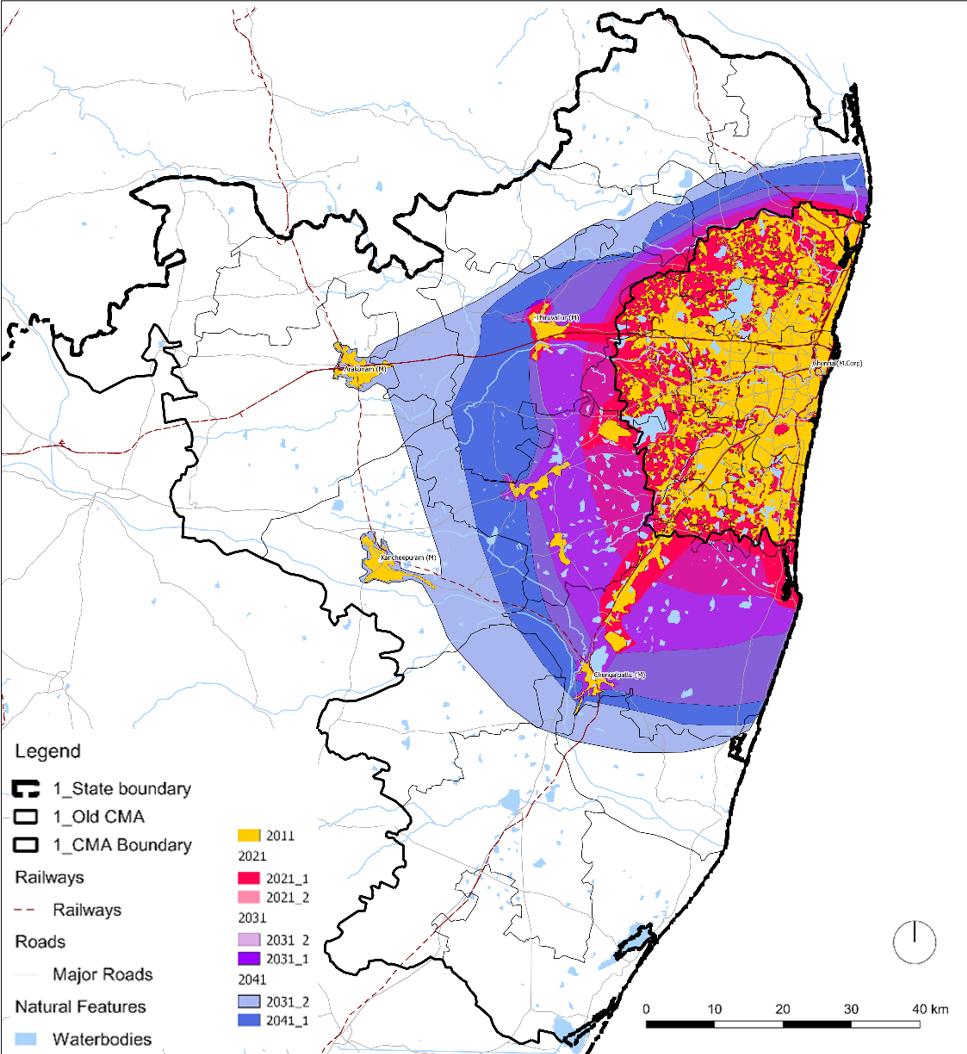
Inferences:
The entire 8800 sq. km expanse of CMA will not get occupied by 2041 even with 2% of annual density decline. Only 4114 sq. km out of 8800 sq. km will get occupied.
The growth pattern in the diagram is representative, it was made based on the current growth trends. The trends in the satellite town of Tiruvallur, Arakonam, Kancheepuram, Chengalpattu etc. show in rate of density decline is great: 20%, 13%, 11%, and 7% respectively, between the years of 2001-11. This is due to the declining population of these cities vis a vis urban growth as more people are moving towards Chennai agglomeration. But the region may still see hotspots of isolated development depending on future investments by the government.
Thus, Land Use Plan for the entire region not viable and we need to look at Strategic Planning.
Strategic Planning Approach
They key principles for our plan will be to regulate the development rather than controlling it. As controlling development leads to market distortion which do more harm than good. Instead our planning framework flexible will be responsive to market needs at the same time manage the negative externalities.
The plan would not be a simple wish-list nor will the planning body be overloaded by functions, instead will focus on specific sectors which need attention for the proper functioning of the city: namely Transport, Environment and Water.
The strategic plan will not have a set horizon year. This is due to the varying election cycles of various local bodies with in the metropolitan area. The plan will undergo mid-course correction based on the monitoring mechanism that would feed back into the plan.
19
Map 3.17 Spatial Projection 2041
Contents of Strategic Plan
The Strategic Plan will only focus on three sectors: Transport, Environment and Water Resource Management. These sectors were selected as there is a need for strategies in this direction for the Metropolitan area to function properly.
Transport Sector
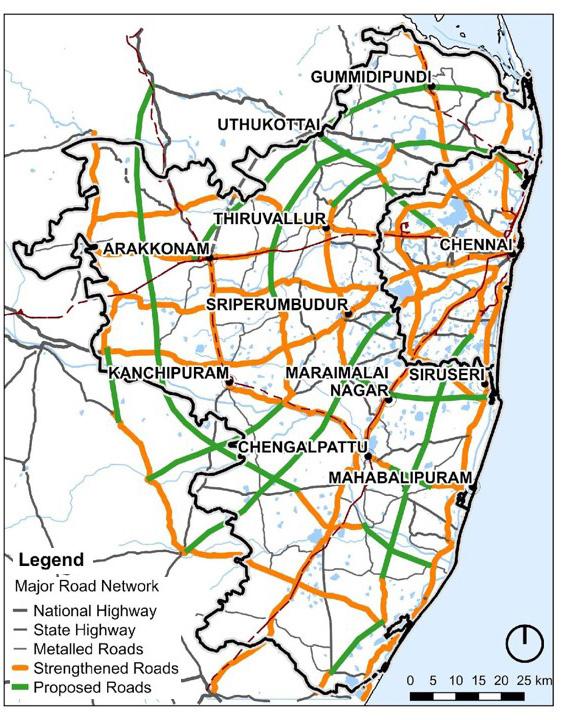
As the planning boundary has been extended recently, the first strategy is to improve the connectivity of the region by focusing on road networks. We aim to do this by strengthening the existing network and increasing the density in areas that lack a proper road network. A spatial plan will be prepared delineating the right of way.
The Metropolitan Planning body may further look at regional connectivity on these road by plying
Water Sector
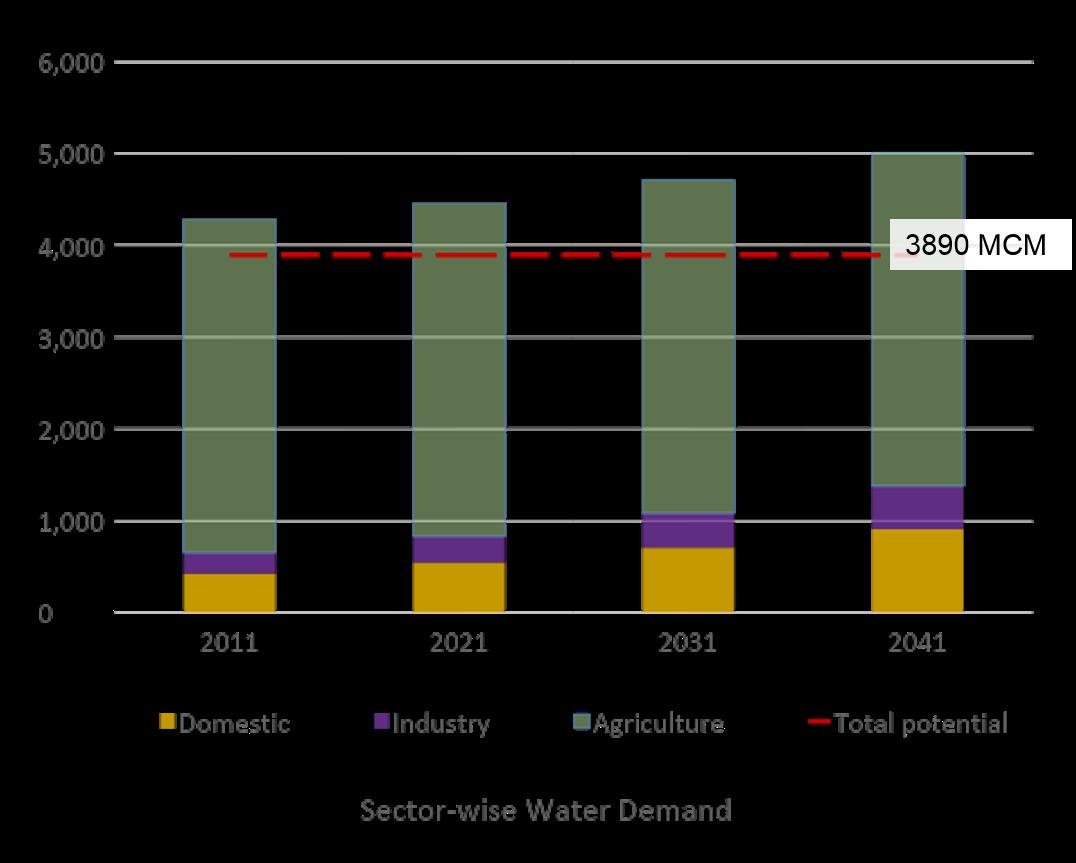
Water is important for life and thus for the functioning of cities. It not just required for drinking or domestic purposes but as a resource is important for industrial and agriculture sector. Cities in India and world over are facing water deficit. This means the demand for water by Chennai exceeds the water potential, i.e. water available for the city’s use (without degrading the environment.) According to projections by 2041 the demand for water will exceed the water potential by 22%. [1] Thus, there is a need for strategies that will reduce the water deficit. [2]
public transport on these dedicated right of ways.
Environment Sector
The metropolitan body will look at protecting the environmentally sensitive areas. We have, through our Land Suitability Analysis already identified the Eco-sensitive zones that require protection, however our approach is not to control but to regulate. Therefore, regulations will be made such that water bodies and forests are protected, incompatible land uses will be prohibited but urbanization won’t be stopped completely.
20
CPP, 2008
Natarajan & Kalloikar, 2017 3. Newpaper: Gautham K, Nov 2018 Times of India
1
2
Image 3.1 Sector-wise Water Demand
Map 3.18 Road Network
Waste Water Recycling
Chennai city already practices Waste water recycle, for both grey and black water. Only water from toilets (black water) goes through the sewerage network and gets treated in STP. The bio gas generated due to this get utilized in powering the STPs. Currently electricity drawn from the public grid used for this purpose by Chennai city is reduced by 77%. Chennai city has achieved around 15% of the city’s water demand through water recycling. Around 8% of the treated wastewater is sold to industries. [1]
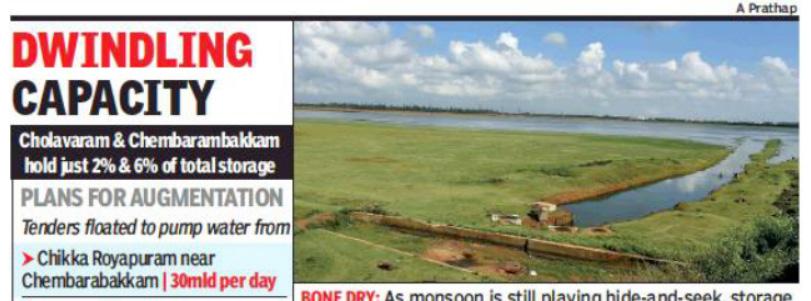
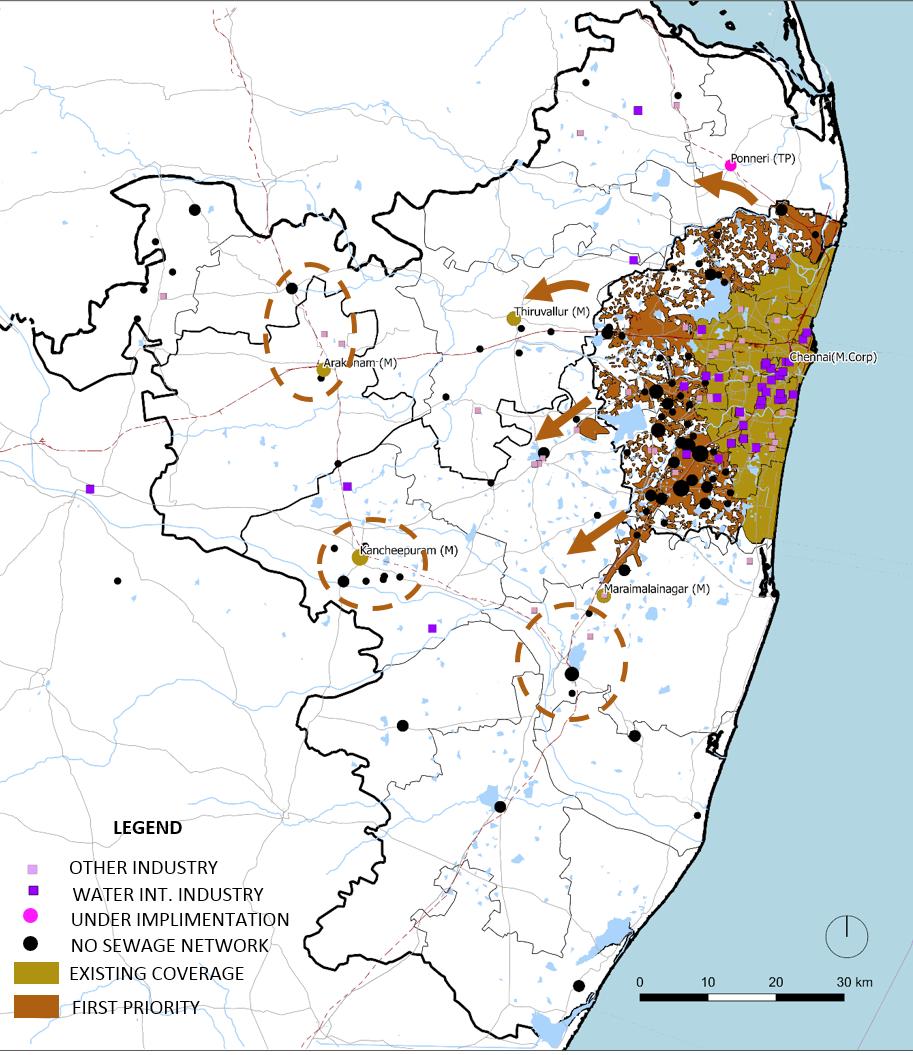
The major challenges faced in order to scale up this same model for the rest of the metropolitan area are that the network is incomplete, currently only area under Chennai Municipal Corporation (Chennai District) has full sewer network coverage. Outside this area only 4 cities: Tiruvallur, Arakonam, Kancheepuram & Miraimalainagar have sewerage network. Even the area under the old CMA outside of Chennai does not have network. The other major challenge is connections are not provided being provided in areas where network exists. People living in areas near Adyar river and Coovam river and Ambatur lake are discharging sewerage into waterbodies directly. [2] [3] There are currently two bodies CMWSSB & TWAD responsible for water supply and sewerage. In areas under TWAD, there isn’t any Waste Water Recycling policy.
The priority area should be the Chennai agglomeration areas outside the district which don’t have sewerage network and other urban agglomerations near Industrial area. A Regional body is required which will expand the network as well as manage the recycled water, selling it to
industries. The ULBs of these cities will take care of the management at the city level: providing connections and taking charges.
Chennai also has a policy for grey water recycling since 2002. It mandates the use of grey water to be used for groundwater recharge after a simple organic filtration. In case of multi-storied apartments i.e. apartments over 4 floors (15.25 m) height, the rules say that the recycled water should be used for toilet flushing. The major challenge for grey water recycling is compliance, because of which in 2017 water recycling was made mandatory for all New water connections.
In order to promote grey water recycling in older buildings, incentives can be provided like discount in water bill or ULB supporting retrofitting efforts by the people. Using these carrots and stick incentives, the domestic water demand will come down by 40%. Currently the demand is assumed to be 135 lpcd. The break-up for 135 lpcd: [4]
Adding up the water demand of flushing and gardening which will be met by gray water recycling we get about 40%. This will also reduce 60% load on sewage system.
A total of 15% of the water demand will be met by recycling. Comparing with 22% water deficit in 2041, this will reduce it to 7%.
This strategy can be considered as an alternative to desalination plants.
21
1 IWA, 2018 2 Thirumurthy, 2017 3 TNN, 2018 4 Venugopalan, 1999
Recycling Strategy
Map
3.19 Waste Water
Use Liter/person % Drinking 3 2% Cooking 4 3% Bathing 20 15% Toilet 40 30% Washing Clothes 25 18% Washing Utensils 20 15% Gardening 23 17%
Table 3.1 Break up of water supply norm
Conclusion
This portfolio is part of the deliverables for Metropolitan Studio which is exploratory in nature. We have explored the topics mentioned in the previous sections. This has been a desk study, as we did not visit the site. The research has been done through on reviewing available literature and secondary data on the area and through looking at newspaper reports to understand the issues currently faced by the people in the metropolitan area.
Therefore our strategies are not detailed, they are conceptual -even the strategic plan itself is not concretely presented instead we have abstracted ideas that intend to establish priority. Further detailed studies can be made on all the sectoral interventions
22
Image credits: Md. Suleman
Module I
Adlakha, N. (2017). Chennai no longer a realty hotspot? The Hindu. Chennai.
Census 2011, 2001
Chennai Master Plan 2026
Kennedy, L., et al. (2014). “Engaging with sustainability issues in Metropolitan Chennai.”
Ramakrishnan, S. (2018). Chennai’s Rail Services: The Planned Yet Underused Transit Network That Needs An Overhaul. Swarajya.
Srivathsan, A. (2012). Chennai to push its boundaries, but how far? The Hindu. Chennai.
Module II
Bahl, R. W., Linn, J. F., & Wetzel, D. L. (Eds.). (2013). Financing metropolitan governments in developing countries. Cambridge, MA: Lincoln Institute of Land Policy.
Sivaramakrishnan, K., & Maiti, A. (2009). Metropolitan Governance in India: An overview of selected cities. Centre for Policy Research: Delhi.
Tamil Nadu Fifth State Finance Commission Report
Module III & IV
Angel, S., Parent, J., Civco, D. L., & Blei, A. M. (2011). Making room for a planet of cities.
CPP. (2008). Role of Tanks in Ground Water management Policy Brief (Vol. 3). Chennai: Dhan Foundation.
IWA. (2018). The Reuse Opportunity Wastewater Report - International Water Association (pp. 10). London: International Water Association.
Natarajan, P., & Kalloikar, S. (2017). Urban resilient integrated water management pathways, to achieve sustainable water resources development in Chennai metropolitan city, Tamil Nadu, India. Water Practice and Technology, 12(3), 564-575.
Prakash, T. (2003). Land suitability analysis for agricultural crops: a fuzzy multicriteria decision making approach.
Thirumuthy, P. (2017). Where does Chennai’s Poop go? The stinking Truth, The News Minute. Retrieved from https://www.thenewsminute.com/ article/where-does-chennai-s-poop-go-stinkingtruth-61425
TNN. (2018, May 20th 2018). Denied sewer system, Ambattur lets out waste into Puzhal lake, The Times of India. Retrieved from http://timesofindia. indiatimes.com/articleshow/64240101. cms?utm_source=contentofinterest&utm_ medium=text&utm_campaign=cppst
Venugopalan. (1999). Manual on Water Supply and Treatment. New Delhi: Ministry of Urban Development Retrieved from https://mdws.gov. in/sites/default/files/Manual_on_Water_Supply_ and_Treatment_CPHEEO_MoUD_1999.pdf.
Acknowledgments
This is a brief note of gratitude to those who have been of help in no specific order:
Thiru M. Shivashanmugam, Cheif Planner CMDA - who provided us with CMDA’s perspective into the planning of CMA and was forever available to answered our many questions about Chennai.
Professor A. Srivathsan - who were present in all our juries, providing us with relevant critique and his writings as a journalist also shed light on many issues faced by the city
Our Studio Faculties Vidyadhar Phatak , Vishal Dubey and Anurima Mukherjee Basu under whose guidance, we were able to produce this work.
Finally my fellow students - as this studio gave us the opportunity for peer learning.
23
Reference