ISSN: 2456-7817
[Vol-7, Issue-3, May-Jun, 2023]
Issue DOI: https://dx.doi.org/10.22161/ijebm.7.3

Article DOI: https://dx.doi.org/10.22161/ijebm.7.3.10

ISSN: 2456-7817
[Vol-7, Issue-3, May-Jun, 2023]
Issue DOI: https://dx.doi.org/10.22161/ijebm.7.3
Article DOI: https://dx.doi.org/10.22161/ijebm.7.3.10
Assistant Professor III, College of Business Education, Nueva Vizcaya State University, Philippines
Received: 08 May 2023; Received in revised form: 04 Jun 2023; Accepted: 12 Jun 2023; Available online: 21 Jun 2023
©2023 The Author(s). Published by AI Publications. This is an open access article under the CC BY license (https://creativecommons.org/licenses/by/4.0/)
Abstract This qualitative study explored the value chain of commercial rice in Nueva Vizcaya, Philippines. It presented the value chain map of commercial rice highlighting the profitability of each actor involved in the value chain, namely paddy rice farmers, primary traders, millers, retailers, and final traders (wholesalers and retailers). The findings revealed that the miller contributes the highest value-added cost to commercial rice production, accounting for approximately 40.39% of the total, followed closely by the farmers at 39.22%. The primary trader represented 10.93%, while the wholesaler and retailer contributed 6.72% and 2.07% respectively. Analysis of the percentage of profit to cost showed that farmers earned the highest percentage at 32.36%, followed by the retailer at 8.48%, the primary trader at 5.11%, the miller at 2.32%, and the wholesaler at 1.68%. However, when considering the operating cycle of each actor, it became apparent that the primary trader emerged as the highest-earning actor due to their shorter operating cycle compared to other actors in the value chain. Hence, venturing into paddy rice production, trading, milling, and wholesaling of commercial rice in Nueva Vizcaya is profitable, given the wide market demand for rice as a staple food. There is a viable opportunity to enhance profitability among the various actors in the value chain, particularly for farmers, by leveraging appropriate government support programs, specifically by maximizing the utilization of initiatives provided under the Rice Tariffication Law.
Keywords Nueva Vizcaya, operating cycle, price and cost structure, rice farming, rice trading
Profitability assumes a significant role in the decision-making process of farmers and serves as a crucial factor in achieving economic efficiency. The profitability of a farm, like any other organization, serves as a reflection of economic efficiency encompassing several critical economic and financial aspects. It serves as a pertinent indicator for informed decision-making (Bumbescu, 2015).
Crop cultivation and animal rearing are integral components of agriculture, serving as primary sources of income and livelihood for many individuals. Those who are not directly involved in farming depend on the products cultivated by farmers, creating a market for their produce. Rice, being one of the most widely produced crops globally, is grown insignificantquantities. China stands as the largest rice producer globally, followed by India, Indonesia, Bangladesh, Vietnam, Thailand, Myanmar, the Philippines, Pakistan, and Brazil (Shahbandeh, 2021). Additionally, China is recognized as the leading rice importer worldwide
(Worldatlas, 2022). Rice, an edible starchy cereal grain and annual grass (Oryza sativa) is consumed by approximately half of the world’s population as its staple food. It was first cultivated in India more than 4,000 years ago grown in a widely flooded fields (paddies) and river deltas of tropical, semitropical, and temperate regions (Britannica, 2009).
Paddy rice is converted into table rice or white rice through a series of activities or in a multi-stage milling process. The process of rice milling has the effect of losing vitamin B and minerals usually found in the outer germ and bran layers. Rice, which is already low in vitamins and minerals, becomes further depleted in nutrients during the milling process. As a result, it can be said that populations that primarily consume rice as more susceptible to deficiencies in essential vitamins and minerals (Muthayya, et al, 2014).
The consumption of rice as a staple food in numerous countries creates a substantial market demand
and lucrative opportunities for profitability in paddy rice production. Kulyakwave et al. (2020) conducted research to assess the profitability of rice production, focusing on key factors and household consumption patterns. Through the application of farm budgeting techniques, the analysis revealed favorable profitability indicators for paddy rice producers. The profitability index, return on investment, capital turnover, and benefit-cost ratio were found to be 9.5%, 160, 2.6, and 3.1, respectively. The study area demonstrated that rice production is a lucrative enterprise with potential for further enhancement in terms of yield.
Similarly, a study conducted in Bida Agricultural Zone of Niger State highlighted the profitability of rice production in the region. The analysis utilized farm budgeting techniques to evaluate the cost and returns of rice production. The calculated gross profit amounted to 45%, indicating that farmers earn a relatively high return.Among the variable costs, labor accounted for the highest proportion, followed by expenses related to seed, fertilizer, transportation, herbicide, pesticide, and bagging (Bwala et al., 2018). Moreover, research on the value chain of rice has been conducted, such as Pavithra et al.'s (2017) study analyzing the rice value chain in India. They identified six major players in the chain: paddy growers, paddy wholesalers, millers, rice wholesalers, rice retailers, and consumers. Similarly, a study on the profitability of actors in the rice value chain in Ebonyi State, Nigeria, revealed that rice farmers, rice processors, and rice traders had a value-added percentage of 49%, 2%, and 36%, respectively. Additionally, the benefit-cost ratio was recorded at 2.02, 1.89, and 1.43, with return on investment (ROI) figures of 102%, 89%, and 43%, respectively (Ewuzie et al., 2020).
In thePhilippinesetting,a ricevalue chain analysis conducted by Mataia, et. al (2020) using the value chain analysis (VCA) framework, the country’s rice value chain (RVC) starts with the input provision and ends with consumers. Price and cost structure of the key actors were presented and the highest value adding player is the miller followed by the farmer. Of the total profit earned by all players in the chain, the farmer earned the highest, approximately54%.Boththefarmerandthemillerrecorded a 40% gross profit rate. Value chain analysis of other commodities like mandarin, (Sarmiento, 2018) and pineapple, (LAcaden, 2016) was conducted in Nueva Vizcaya and the latter noted that the trader segment was recorded as thehighestprofit earningamong thechainactor.
In Rice production, an average of 4.80 million hectares, approximately two thirds of all the Pilipino farmlands, is available for palay production with a total
production of 19.76 million tons in 2022, 19.96 million tons in 2021 and 19.29 million tons in 2020 (PhilRice, 2022).
The Rice Tariffication Law fully known as Republic Act 11203, “An Act Liberalizing the Importation, Exportation, and Trading of Rice, Lifting for the Purpose the Quantitative Import Restriction on Rice and for Other Purpose” was passed in 2019 with the aim to liberalize the importation of rice in the country allowing local farmers to compete in the global market. Under the said law, the Rice Competitiveness Enhancement Fund (RCEF) was created purposely to provide key interventions to support farmers and enhance their competitiveness and profitability, including farm machinery and equipment to improve farm productions, rice seed development, propagation, and promotion, expanded rice credit, and extension services (Tobias, 2019). The Rice Tariffication Law has led to a reorientation of the National FoodAuthority (NFA) towards the procurement, storage, and distribution of rice buffer stock. It mandates the NFA to maintain an optimal level of domestic rice inventory sourced exclusively from local farmers. Additionally, the NFA is responsible for distributing rice during emergency and calamity situations, thereby supporting the government's disaster relief efforts (PSA, 2022).
The Department of Agriculture (DA) has implemented several measures to boost rice production utilizing the programs under the Rice Competitiveness Enhancement Fund (RCEF), National Rice Program (NRP), andtheRiceResiliencyProject(PRP).Amongtheprograms implemented is the RCEF-Seed Program, distribution of seeds to farmers. DA-PhilRice also established 231 techno demo sites dubbed as PalaySikatan, where the use of farm machines and certified inbred seeds of nationally and regionally recommended rice varieties are showcased. Seed grower associations were also strengthened to ensure adequate supply of high-quality seeds in deficit areas. As a result, income from rice farming by farmers increased with the additional subsidy from the government. DA-PhilRice also contributes to the implementation of the RCEF-Rice Extension Services Program by capacitating rice specialist and trainers across the country. Technical assistance was alsoprovidedtocontinuedeveloptechnologiesthatincrease yield and reduce cost to make farmers more competitive. However, this seems not enough to satisfy the supply availability requirement of rice in the country. Hence, the Philippines is forced to import from neighboring countries with a recorded import dependency rate of 19%, mostly from Vietnam (PhilRice, 2022).
Philippine Statistics Authority (PSA) reported a percentage of rice imports to total supply of 20%, 15% and 19% for the years 2019, 2020 and 2021, respectively With
the rice import percentage, the Philippine Government has placed an importance in reviving the agriculture sector to achieve rice self-sufficiency in the next few years (PSA, 2022) On the other hand, the average age of farmers has a notable influence on agricultural output, as changes in the composition of working-age households can significantly impact the farming sector (Guo et al., 2015). In this aging scenario,TheSoutheastAsian RegionalCenterforGraduate Study and Research in Agriculture (SEARCA) stated that Filipino rice farmers’ age ranging from 55 years old to 59 years old. This threatens the plans for achieving rice sufficiency as well as the food security (SEARCA, 2023).
Among the regions in the country, Central Luzon stands as the primary rice (palay) production region in the country, while Cagayan Valley follows closely as the second-highest producer. Moreover, Cagayan Valley maintains its position as the leading corn producer in the Philippines, contributing 22.98 percent to the total national corn production. Additionally, the region also contributes 12.85 percent to the overall rice production in the country (Rice DataAnalytics, 2022)
Nueva Vizcaya is a province situated in Cagayan Valley occupying the Northeastern of Luzon Island. The province has basically an agricultural economy with commerce, trade, and industry contributing to its growth and development. In Nueva Vizcaya, one of its crops is the paddy rice (palay) production, which has 284,877 metric tons produced in 2022, out of 19.76 million metric tons aggregate produced in the Philippines (PhilRice). Manila Times (2014) reported that Nueva Vizcaya is 340 percent rice sufficient thereby filled the rice insufficiency in the country during that time. Despite this fact, the Philippines is still paving its way to become a rice sufficient country (SEARCA, 2022).
To promote rice farming and support the national government's objective of achieving rice sufficiency, it is crucial to conduct a comprehensive study and present the profitability of farming, specifically focusing on rice farming. This initiative aims to attract the younger generation and encourage them to engage in rice farming as a viable andprofitable livelihood option. By showcasing the potential profitability and benefits of rice farming, it can serve as an incentive for the younger generation to participate in agricultural activities, ultimately contributing to the country's overall rice production and self-sufficiency goals.
The primary objective of this study is to analyze and present theprofitability ofthe key actors involved in the value chain of commercial rice in Nueva Vizcaya, Philippines. The specific aims of the study are as follows:
1. Identify the actors of the value chain of commercial rice in Nueva Vizcaya, Philippines.
2. Examine and present the value-added cost and return on cost of each actor in the chain
3. Present the profitability of each key actor in the value chain of commercial rice considering the operating cycle of each actor
This research primarily focused on the identification of the actors in the value chain map of commercial rice in Nueva Vizcaya, Philippines. It explored thevalueaddedbyeachactorandassessedtheirprofitability for the year 2021-2022. The operating cycle of each actor's business venture was considered when evaluating the profitability of their respective ventures. By considering these factors, a comprehensive analysis of the value chain and profitability of commercial rice production in the province was conducted.
The significance of this study for research lies in its contribution to the understanding of the value chain of commercial rice in Nueva Vizcaya, Philippines. By offering insights into the price and cost structure, profitability, and value-added contributions of key actors in the value chain, the study provides valuable knowledge for stakeholders, private and public agencies, and younger generations venturing into agribusiness, particularly rice farming.
The findings of this study enable stakeholders to identify opportunities for enhanced profitability and make informed investment decisions within the rice value chain. Private and public agencies can utilize this information to develop targeted interventions and support programs to promote sustainable and profitable rice production and trade.
Moreover, the study serves as a valuable point of reference for future researchers interested in studying the dynamics of the rice value chain. It provides a foundation for further research and analysis in areas such as supply chain management, value-added strategies, and policy development related to rice production and trade.
The qualitative approach was used to excerpt, analyze, and present the value chain management of commercial rice in Nueva Vizcaya. Primary data were utilized by the researcher through key informant interviews usingthedevelopedcustomized questionnaireforeachactor identified, with proper observance of the COVID 19 safety
protocols. To ensure a comprehensive understanding and validate the findings, a focus group discussion was conducted, involving the active participation of all actors in the value chain. Representatives from key organizations such as the Municipal Agricultural Office (MAO), Provincial Agricultural Office (PAO), the National Food Authority (NFA), Rice Farmers Association/Cooperatives, and the National Irrigation Administration (NIA) were also present during the discussion. Secondary data were also utilized from books, journals, and relevant websites.
The actors in the value chain are the respondents of the study, which was identified as the rice farmers, service providers, rice traders, rice millers, retailers, institutional buyers, and consumers.
Thevaluechainanalysisframeworkwasemployed to present and identify the major actors in the commercial rice value chain This approach was also applied to examine the value chain of other commodities in the province, such as banana, onion, peanut, and pineapple, as observed in previous studies conducted by Sansano (2010, 2011), Sarmiento (2014), and Lacaden (2016).
Furthermore, the farm budget analysis was utilized in determining the relative financial position of each actor in the chain, while the concept of operating cycle was employed to conduct further analysis on profitability.
1. Key actors in the value chain of commercial rice in Nueva Vizcaya
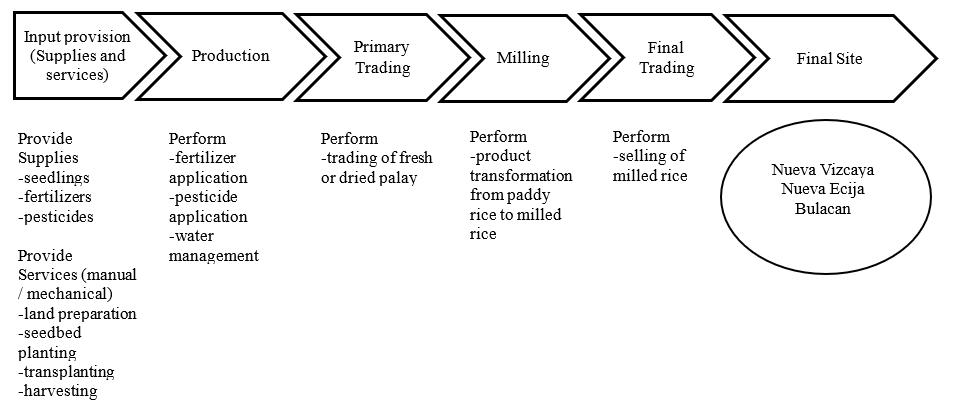
Fig 1 illustrates the GIZ Value Chain Map of Commercial Rice in Nueva Vizcaya, which aligns with the rice value chain map in the Philippines as presented by Mataia et al. (2020). The value chain begins with the provision of inputs such as seedlings, fertilizers, and pesticides, which farmers purchase or receive from the Municipal Agriculture office with the support of the Department of Agriculture. Additionally, service providers offer services like land preparation, seedbed planting, transplanting, and harvesting.


Rice farmers play crucial roles in the production process, undertaking tasks such as fertilizer and pesticide application, as well as water management, to enhance crop yield. Primary trading involves the participation of farmers,
agents, and palay buying stations, who engage in the trade of fresh or dried palay.Agents purchase palay from farmers and subsequently sell it to palay buying stations. In certain instances, the National Food Authority (NFA) purchases
agricultural products from farmers at higher prices compared to private agents. However, the NFA's capacity to accommodate a larger volume of produce is limited, particularly during the rainy season, due to the lack of necessary facilities such as drying machinery and storage warehouses. Consequently, some farmers may experience a deterioration in the quality of their paddy rice, leading to potential losses, especially when harvested during the rainy season. Millers are responsible for transforming paddy rice (palay) into rice through the milling process. Finally, in the stage of final trading, wholesalers, palay buying stations, and warehouse dealers engage in the sale of rice to retailers in the provinces of Nueva Vizcaya, Nueva Ecija, and Bulacan.
Profitability of each actor
In an average land production area of one hectare, the farmer can achieve a profit of P4.16 per kilogram of paddy rice, resulting in a 32.36% return, considering a unit sale price of P17.00 and unit cost of P12.84. This profit is obtained over an average period of four to five months. The value-added cost calculated at 39.22% is slightly different from that of the study of Mataia et.a. (2020) which is 35%. The change is attributed to the increasing price of farm inputs. Despite the increasing farm inputs, it is apparent that the rice production is a profitable venture as it was also claimed by other researchers in different regions/state/ country (Kulyakwave, et.al., 2020; Bwala, et.al, 2018; Pavithra, et. al, 2017; Ewuzie, et al. 2020 and Mataia, et. el. 2020).
The primary trader purchased paddy rice from the farmers at a cost of P17.00 per kilogram and incurred an additional trading cost of P3.58 before selling it to the
miller.OutoftheP3.58costaddedinprimary trading,P1.67 can be attributed to the paddy rice equivalent price, which accounts for the shrinkage loss due to drying. With a unit sale price of P21.63 and unit cost of P20.58, the primary trader earned a profit of P1.05 per kilogram, resulting in a 5.11% return.
The miller’s activity incurred a total cost of P34.85, which is the sum of the purchase price of P21.63 from the trader and the additional unit cost of P13.20 involved in the conversion of paddy rice into milled rice. With a unit sale price of P35.66 and unit cost of P34.85, the milling process generated a profit of P0.81 per kilogram of milled rice, resulting in a return of 2.32%. Miller’s valueadded percentage is lower than what is reported in Mataia, et.al report in 2020 from which they considered the whole region in the country. The lower value-added cost of the miller isattributed to the betterquality of rice produce in the province and increase in yieldproduction perhectare during the evaluation period.
In the final trading stage, two distinct activities take place: wholesaling and retailing. The wholesaler purchased milled rice from the miller, while the retailer purchased milled rice from the wholesaler. The unit cost of the wholesaler, totaling P37.86, is comprised of the purchase price of milled rice from the wholesaler (P35.66) and the additional cost incurred in wholesaling activities (P2.20). With an average unit sales price of P38.50 and a unit cost of P37.86, the wholesaler achieved a profit of P0.64, resulting to an average return of 1.68%. As to the retailer, they earned a net profit of P3.32 and a return of 8.48%. The unit cost of the retailer, amounting to P39.18, is derived from the purchase price of the retailer from the wholesaler (P38.50) and the additional cost incurred in the retailing activities (P0.68).
The sales price of the retailer, valued at P42.50, encompassed the accumulated costs and profits incurred by each actor throughout the chain, from paddy production to retailing. The unit selling price represented the total added unit cost of P32.74 and a profit of P9.98 collectively earned and incurred by all actors involved. In other words, the incurred unit costs and profit accounted for 76.52% (32.74/42.50) and 23.48% (9.98/42.50) of the unit selling price (P42.50), respectively.
Of the total profit per kilogram amounting to P9.25, the farmer emerged as the highest-earning actor along the chain, with a profit of P4.16 or 41.66% of the total profit. This finding is consistent with the studies conducted by Mataia et al. (2020) and Ewuzie et al. (2018), which also indicated that the farmer had the highest earnings per kilogram of rice. Following the farmer, the retailer claimed aprofitshareofP3.32or33.32%.Theprimarytraderranked as the third highest earner, with a profit per kilogram of P1.05 and a profit share of 10.53%. The miller earned a profit share of 8.12% with a profit of P0.81 per kilogram, while the wholesaler obtained a profit share of 6.38% with a profit of P0.64 per unit
The generation of profit along the chain could not have been realized without thecostsincurred by each player
and transferred to other players as part of the selling price. Therefore, the total unit cost amounting to P32.52, is the aggregate amount from each player based on their activities at every stage. Among the chain actors, the miller had the highest cost contribution at P13.22 (40.39%), followed by the farmer as the second-highest cost contributor at P12.84 (39.22%). The primary trader added a cost of P3.58 (10.93%), the wholesaler contributed P1.60 (4.89%), and the retailer recorded the lowest cost contribution at P1.50 (4.58%).
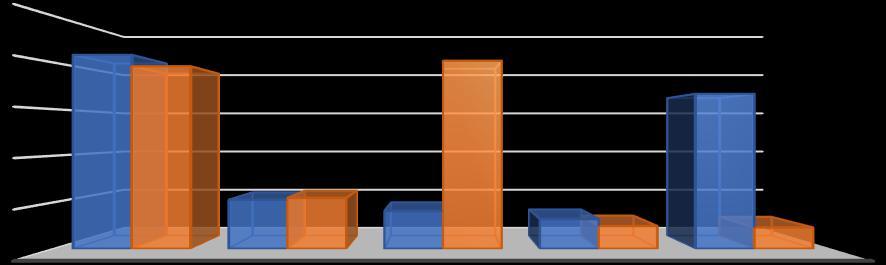
InFigure2,acomprehensiveoverviewofthevalue added and profit distribution in each stage of the chain was provided. The farmer stood out as the recipient of the highest profit share at 42%, accompanied by a 39% contribution to the added cost. Following closely, the retailer claimed a 19% profit share, with a total added cost of 5%. The primary trader secured an 11% profit share, aligned with the same rate of value added. In terms of value added (cost), the miller took the lead, contributing 40% while receiving an 8% profit share. Finally, the wholesaler obtained the lowest profit share at 6%, corresponding to a 5% contribution to the value added.
The milling stage incurred high costs as expected, primarily due to the labor-intensive process of drying. Similarly, the farmer's relatively high cost was attributed to the labor-intensive nature of paddy rice production, along with the expenses associated with material inputs such as seedlings, fertilizers, and pesticides.
For a primary trader to operate, investments in delivery trucks are necessary, as they are expected to be in
place prior to venturing into the paddy rice trading business. The cost added by the trader includes expenses for delivery equipment maintenance, depreciation, hired labor, commission, and the inclusion of the dry paddy equivalent price. On the other hand, the wholesaler incurs costs related to handling, maintenance, storage, marketing, and management of milled rice.
As observed in Table 1, the costs incurred and added by a trader are higher than those of a wholesaler, regardless of the nature and capital requirements of being a wholesaler. This is due to the incorporation of price volatility risk caused by various factors. The price of paddy rice is susceptible to fluctuations, which can result in the trader either gaining or losing a significant amount of money. Therefore, having a wide range of connections within the industry and possessing knowledge or skills in predicting the most probable price of paddy rice that the
miller-buyer could offer are crucial for the survival of the business.
3. Operating Cycle and Profitability of Actors
Table 2 provides information on the average monthly and daily income of each actor, considering the normal operating cycle within each stage. The normal operating cycle represents the average duration required for a business to incur initial cash outflows to produce goods, sell those goods, and subsequently collect cash from customers because of the sales.
Upon closer examination and considering a broader perspective, it was discovered that the primary trader emerges as the highest-earning participant in the chain, contrary to the initial observation from Table 1. The findings from the interview revealed that the primary trader operates within a relatively short timeframe of three to five days, during which they collect paddy rice from various farmers, subject it to one day of sun drying, and then sell it to the miller-buyer. Utilizing ten-wheeler trucks capable of transporting an average of 600sacksof paddy rice weighing 50kg each, the trader capitalizes on the inherent risks and capital-intensive requirements of trading activities. As a result, the primary trader can accumulate a total income of P32,500 within the aforementioned timeframe, translating toadailyprofitofP6,825.00.Thisrepresentsapproximately 72.58% of the total earnings generated by all actors within the chain. In the study of Lacaden (2016) in the value chain of pineapple in the same province, it was disclosed that the trader also earned the highest profit among the chain actors. Thus, the involvement of agents in marketing commodities in the province is a common practice.
The miller has the potential to earn substantial income, reaching up to P50,625 per month or P1,687.50 per day. This significant earning corresponds to 17.94% of the total profit generated along the chain, primarily driven by the average production of 62,500 kg of milled rice per
month. It is probable that the miller can further increase their profit by operating the milling machine at its optimal capacity. Similar to the trader, the miller requires a substantial amount of capital investment to meet the machinery requirements for milling activities. Moreover, the milling activities involve lower business risks compared to other stages in the chain.
On the other hand, the wholesaler emerges as the third highest-earning participant in the chain. They deliver an average of 1,100 sacks of rice, weighing 25kg each, to the retailersmonthly.Thisallowsthe wholesaler to generate a profit of P17,513.01 per month or P583.77 per day.
Even though farmers earned the highest profit per kilogram, their overall profitability is quite lower when considering the time and effort invested during the operating cycle. After accounting for the average duration of 115 days required for farming activities and harvesting, the farmer's monthly profit translates to P5,080 or P169.33 per day, constituting only 1.80% of the total profit. On the other hand, the retailer, who earns the second highest profit per unit, emerges as the lowest profit earner, generating an average monthly profit of P4,152.45 or P138.41 per day, contributing to 1.47% of the total income.
Engaging in rice production proved to be a lucrative endeavor, providing a valuable service by meeting the needs of non-farming individuals. Each stage of the commercial rice value chain in Nueva Vizcaya province contributed to the overall value of rice available to consumers, with varying levels of profitability. Among the identifiedactorsinthevaluechain,namelyfarmers,primary traders, millers, wholesalers, and retailers, the miller holds the largest share in terms of percentage contribution. Conversely, the farmer enjoys the highest profitability rate, with the percentage of profit relative to cost being the greatest.
The incorporation of time and the operating cycle into the analysis of costs and returns for each participant has provided a more comprehensive assessment of their financial performance and position. Surprisingly, it was revealed that the primary trader emerged as the highest earner in the chain, benefiting from the advantage of a shorter operating cycle. A shorter operating cycle offers the advantage of engaging in multiple operations within a limited timeframe. It is crucial to note that a player with a lower return per unit does not necessarily earn less than a player with a higher profit per unit. Based on the facts gathered, the following recommendations are provided:
• Awareness Campaign. There is a need to address the lack of awareness among certain farmers regarding the programs and support available to them. Initiating an awareness campaign is crucial to ensure that farmers are well-informed about these opportunities. The responsibility for disseminating this information lies with important institutions such as the Department of Agriculture, Provincial Agriculture Office, and Municipal Agriculture Office. These organizations can collaborate with the Municipal Agricultural and Fishery Council, as well as officers from Cooperatives and Irrigators Associations, to actively promote and raise awareness about the available programs. Furthermore, providing assistance to farmers' associations in meeting the necessary requirements to access farm machinery and equipment can be highly beneficial. By supporting these associations, farmers will have the means to enhance their farming practices and increase their productivity. Ultimately, increasing farmers' awareness and facilitating their access to these programs and resources will contribute to their profitability and overall success in the agricultural sector.
• Capacity Building/Trainings. Through financial literacy training, farmers can develop a better understanding of financial management,
budgeting, and investment strategies. This knowledge can empower them to make informed decisionsregardingtheirfarmoperations,optimize resource allocation, and improve overall profitability.
• Avail Agricultural Crop Insurance. It is essential to promote the regular utilization of agricultural crop insurance among farmers. Aspart of the awareness campaign conducted by the Departmen1t of Agriculture (DA), Provincial Agriculture Office (PAO), and Municipal Agriculture Office (MAO), farmers should be reminded to avail themselves of agricultural crop insurance to protect their crops. Emphasizing the importance of agricultural crop insurance during the awareness campaign can help farmers understand the benefits and significance of this coverage. By availing crop insurance, farmers can safeguard their crops against various risks such as naturaldisasters,pestinfestations,andyieldlosses. This provides them with financial security and a safety net in case of unforeseen circumstances that could negatively impact their agricultural production. The DA, PAO, and MAO can play a crucial role in reminding farmers about the availability and advantages of agricultural crop insurance. They can provide information about the insurance options, eligibility criteria, application procedures, and the coverage provided. Additionally, they can assist farmers in understanding the terms and conditions of the insurance policies to ensure that they make informed decisions and select the most suitable coverage for their specific needs. By actively encouraging farmers to regularly utilize agricultural crop insurance, the farming community can enhance their resilience, mitigate risks, and protect their livelihoods.
• Widen Service of National Food Authority. The existing warehouse capacity of the National Food Authority (NFA) in the province is limited, with only 70,000 cavans in Bayombong Municipal and 30,000 cavans in Bagabag Municipal. However, considering that the province produces approximately 3,733,789 cavans of paddy rice per cropping, the current warehouse capacity falls short in accommodating 10 percent of the farmers' harvest. To address this issue, it is recommended to establish an additional warehouse with sufficient capacitytostore atleast10percentofthe farmers' produce. This would provide the necessary storage space to safeguard the harvested
paddy rice and prevent losses due to insufficient storage facilities. Furthermore, the NFA can explore the option of directly purchasing paddy rice from different farms. By going directly to the farms, the NFA can help reduce the post-harvest expenses incurred by farmers. This approach can be more cost-effective, especially if a consolidation system is implemented, where the NFA combines the produce from various farmers into larger quantities for more efficient procurement and transportation. Implementing these measures would contribute to the efficient management of rice storage and procurement, ensuring that farmers have adequate storage facilities and minimizing their post-harvest costs. It would also support the NFA in fulfilling its role in maintaining the stability of the rice supply and ensuring food security in the province.
The researcher extends her gratitude to Hon. Carlos M. Padilla, the Governor of the Province of Nueva Vizcaya, for collaborating with Nueva Vizcaya State University in this study. Appreciation is also due to Engr. Maria Jonem P. Gacad, Assistant Provincial Planning and Development Officer, for her invaluable assistance in coordinating the research activities, including the key informant interviews and focus group discussions. Dr. Dolores B. Galvez, Dean of the College of Business Education, is also appreciated for her unwavering guidance and support during the conduct of the study.
[1] Bumbescu, S. (2015). Analysis Models Of Profitability In Agriculture. Bulletin of Taras Shevchenko National University of Kyiv Economics
https://www.researchgate.net/publication/305197118_ANA
LYSIS_MODELS_OF_PROFITABILITY_IN_AGRICULT URE
[2] Bwala, M.A., & John,A. U. (2018). Profitabilityanalysis of paddy production:Acase ofagricultural zone 1, Niger State Nigeria. Journal of the Bangladesh Agricultural University, 16(1),88–92.
https://doi.org/10.3329/jbau.v16i1.36486I. S. Jacobs and C. P.Bean,“Fineparticles,thinfilmsandexchangeanisotropy,” in Magnetism, vol. III, G. T. Rado and H. Suhl, Eds. New York:Academic, 1963, pp.271–350.
[3] CongressofthePhilippines,(2019). RepublicAct11203.The Official Gazette
https://www.officialgazette.gov.ph/2019/02/14/republic-actno-11203/
[4] Department of Agriculture, Philippine Rice Research Institute,(2022). PHreachesnewrecord-highpalayoutput.
https://www.philrice.gov.ph/ph-reaches-new-record-highpalay-output/
[5] Ewuzie, et. al. (2020). Profitability Of Actors In Rice Value Chain In Nigeria: A Comparative Analysis. International Journalof InnovativeResearch andAdvancedStudies
https://www.researchgate.net/publication/343361174_Profita bility_Of_Actors_In_Rice_Value_Chain_In_Nigeria_A_Co mparative_Analysis
[6] Guo, et.al (2015). The Impact of Aging Agricultural Labor Population on Farmland Output: From the Perspective of Farmer Preferences.
https://www.researchgate.net/publication/283955046_The_I mpact_of_Aging_Agricultural_Labor_Population_on_Farml and_Output_From_the_Perspective_of_Farmer_Preferences
[7] Kulyakwave, et.al, (2020). Profitability Analysis of Rice Production, Constraints and Consumption Shares by Smallscale Producers in Tanzania. Asian Journal of Agricultural Extension, Economics & Sociology, 37(4), 1–12. https://doi.org/10.9734/ajaees/2019/v37i430280
[8] Lacaden, C. (2016). Price and Cost Structure of Pineapple Industry in Nueva Vizcaya: 2015 Value Chain Study. NVSU Research Journal,Volum3
https://www.nvsu.edu.ph/public/assets/downloads/journal/vo l3-1/NVSURJ_Vol.3_01_2016_1.pdf
[9] Mataia, A. et. Al. (2020). "Rice Value Chain Analysis in the Philippines: Value Addition, Constraints, and Upgrading Strategies." Asian Journal of Agriculture and Development 17(2): 19-42.https://doi.org/10.37801/ajad2020.17.2.2
[10] Pavithra, et.al. (2017, October 24). Analysis of Rice Value Chains - A Study of Bihar and Karnataka States in India SSRN Electronic Journal https://ssrn.com/abstract=3058145 or http://dx.doi.org/10.2139/ssrn.3058145R
[11] Philippine Rice Research Institute, (2022). The Rice Data Analytics https://www.philrice.gov.ph/ricelytics/
[12] Philippine Statistics Authority, (2021). Palay Production in thePhilippines.
https://psa.gov.ph/content/palay-production-philippines
[13] Prasad, et.al. (2017). Current Status, Challenges, and Opportunities in Rice Production. Rice Production Worldwide. Springer, Cham. https://doi.org/10.1007/978-3319-47516-5_1
[14] Shahbandeh, M. (2021,April 23). Leading Countries Based ontheProductionofMilledRice
https://www.statista.com/statistics/255945/top-countries-ofdestination-for-us-rice-exports-2011/
[15] Southeast Asian Regional Center for Graduate Study and Research inAgriculture, (2022).Aging farmers could add to food insecurity.
https://www.searca.org/ Aging farmers could add to food insecurity -SEARCA
[16] Zakaria, A. et. Al. (2021), "Profitability analysis of rice production: a microeconomic perspective from northern Ghana", AgriculturalFinanceReview,Vol.81No.4,pp.535553.https://doi.org/10.1108/AFR-07-2020-0108