Behavioral Insights to Reduce Sludge in Digital Services in Finland
Acknowledgements
The authors thank the Government of Finland, and the Organisation for Economic Cooperation and Development (OECD) for their assistance during the research and drafting of this report. The authors also thank the Princeton School of Public and International Affairs for the assistance provided to produce this report.
The authors extend their gratitude to Professor Varun Gauri for his guidance, patience, and leadership during the research and drafting of the report.
The information in this report reflects only the views and opinions of the authors, and should not be considered the positions of the Government of Finland, the OECD, or the Princeton University School of Public and International Affairs.
Introduction
The integration of behavioral science into public policy is transforming how governments deliver services and engage with citizens. Sludge – a term used in behavioral science literature to refer to administrative burdens, unnecessary procedures, complex forms, and redundant requirements – affects citizens worldwide and can deter access to essential public services. Behavioral science provides a framework for understanding the cognitive impact of sludge and for systematically identifying and eliminating sludge, reducing barriers to accessing services. Finland, with its advanced digital public service ecosystem, is well-positioned to integrate these methods to improve its flagship service delivery platform – Suomi.fi.
This report examines the scope of application of sludge audits in Finland’s digital ecosystem. It investigates how sludge audits can play a role in streamlining the user experience of accessing digital public services in Finland, which can improve access for vulnerable groups, foster innovation in service delivery, and engender greater trust in government. Suomi.fi serves as a focal point for this discussion, given its central role in streamlining access to public services in Finland.
The first section of the report – the Literature Review – contextualizes Finland’s opportunity by exploring the theoretical foundations of sludge, its measurable impact on service delivery, and global best practices for conducting sludge audits.
The second section – Streamlining Digital Service Delivery in Finland – provides a tailored analysis of Finland’s context, focused on: [A] the historical context of Finland’s digital services; [B] current behavioral science capacity in the government; [C] the stakeholder ecosystem of digital service delivery via Suomi.fi; [D] Suomi.fi’s role in the government’s digital strategy; and [E] the enablers of, and obstacles to, embedding a behavioral science orientation in Suomi.fi’s design.
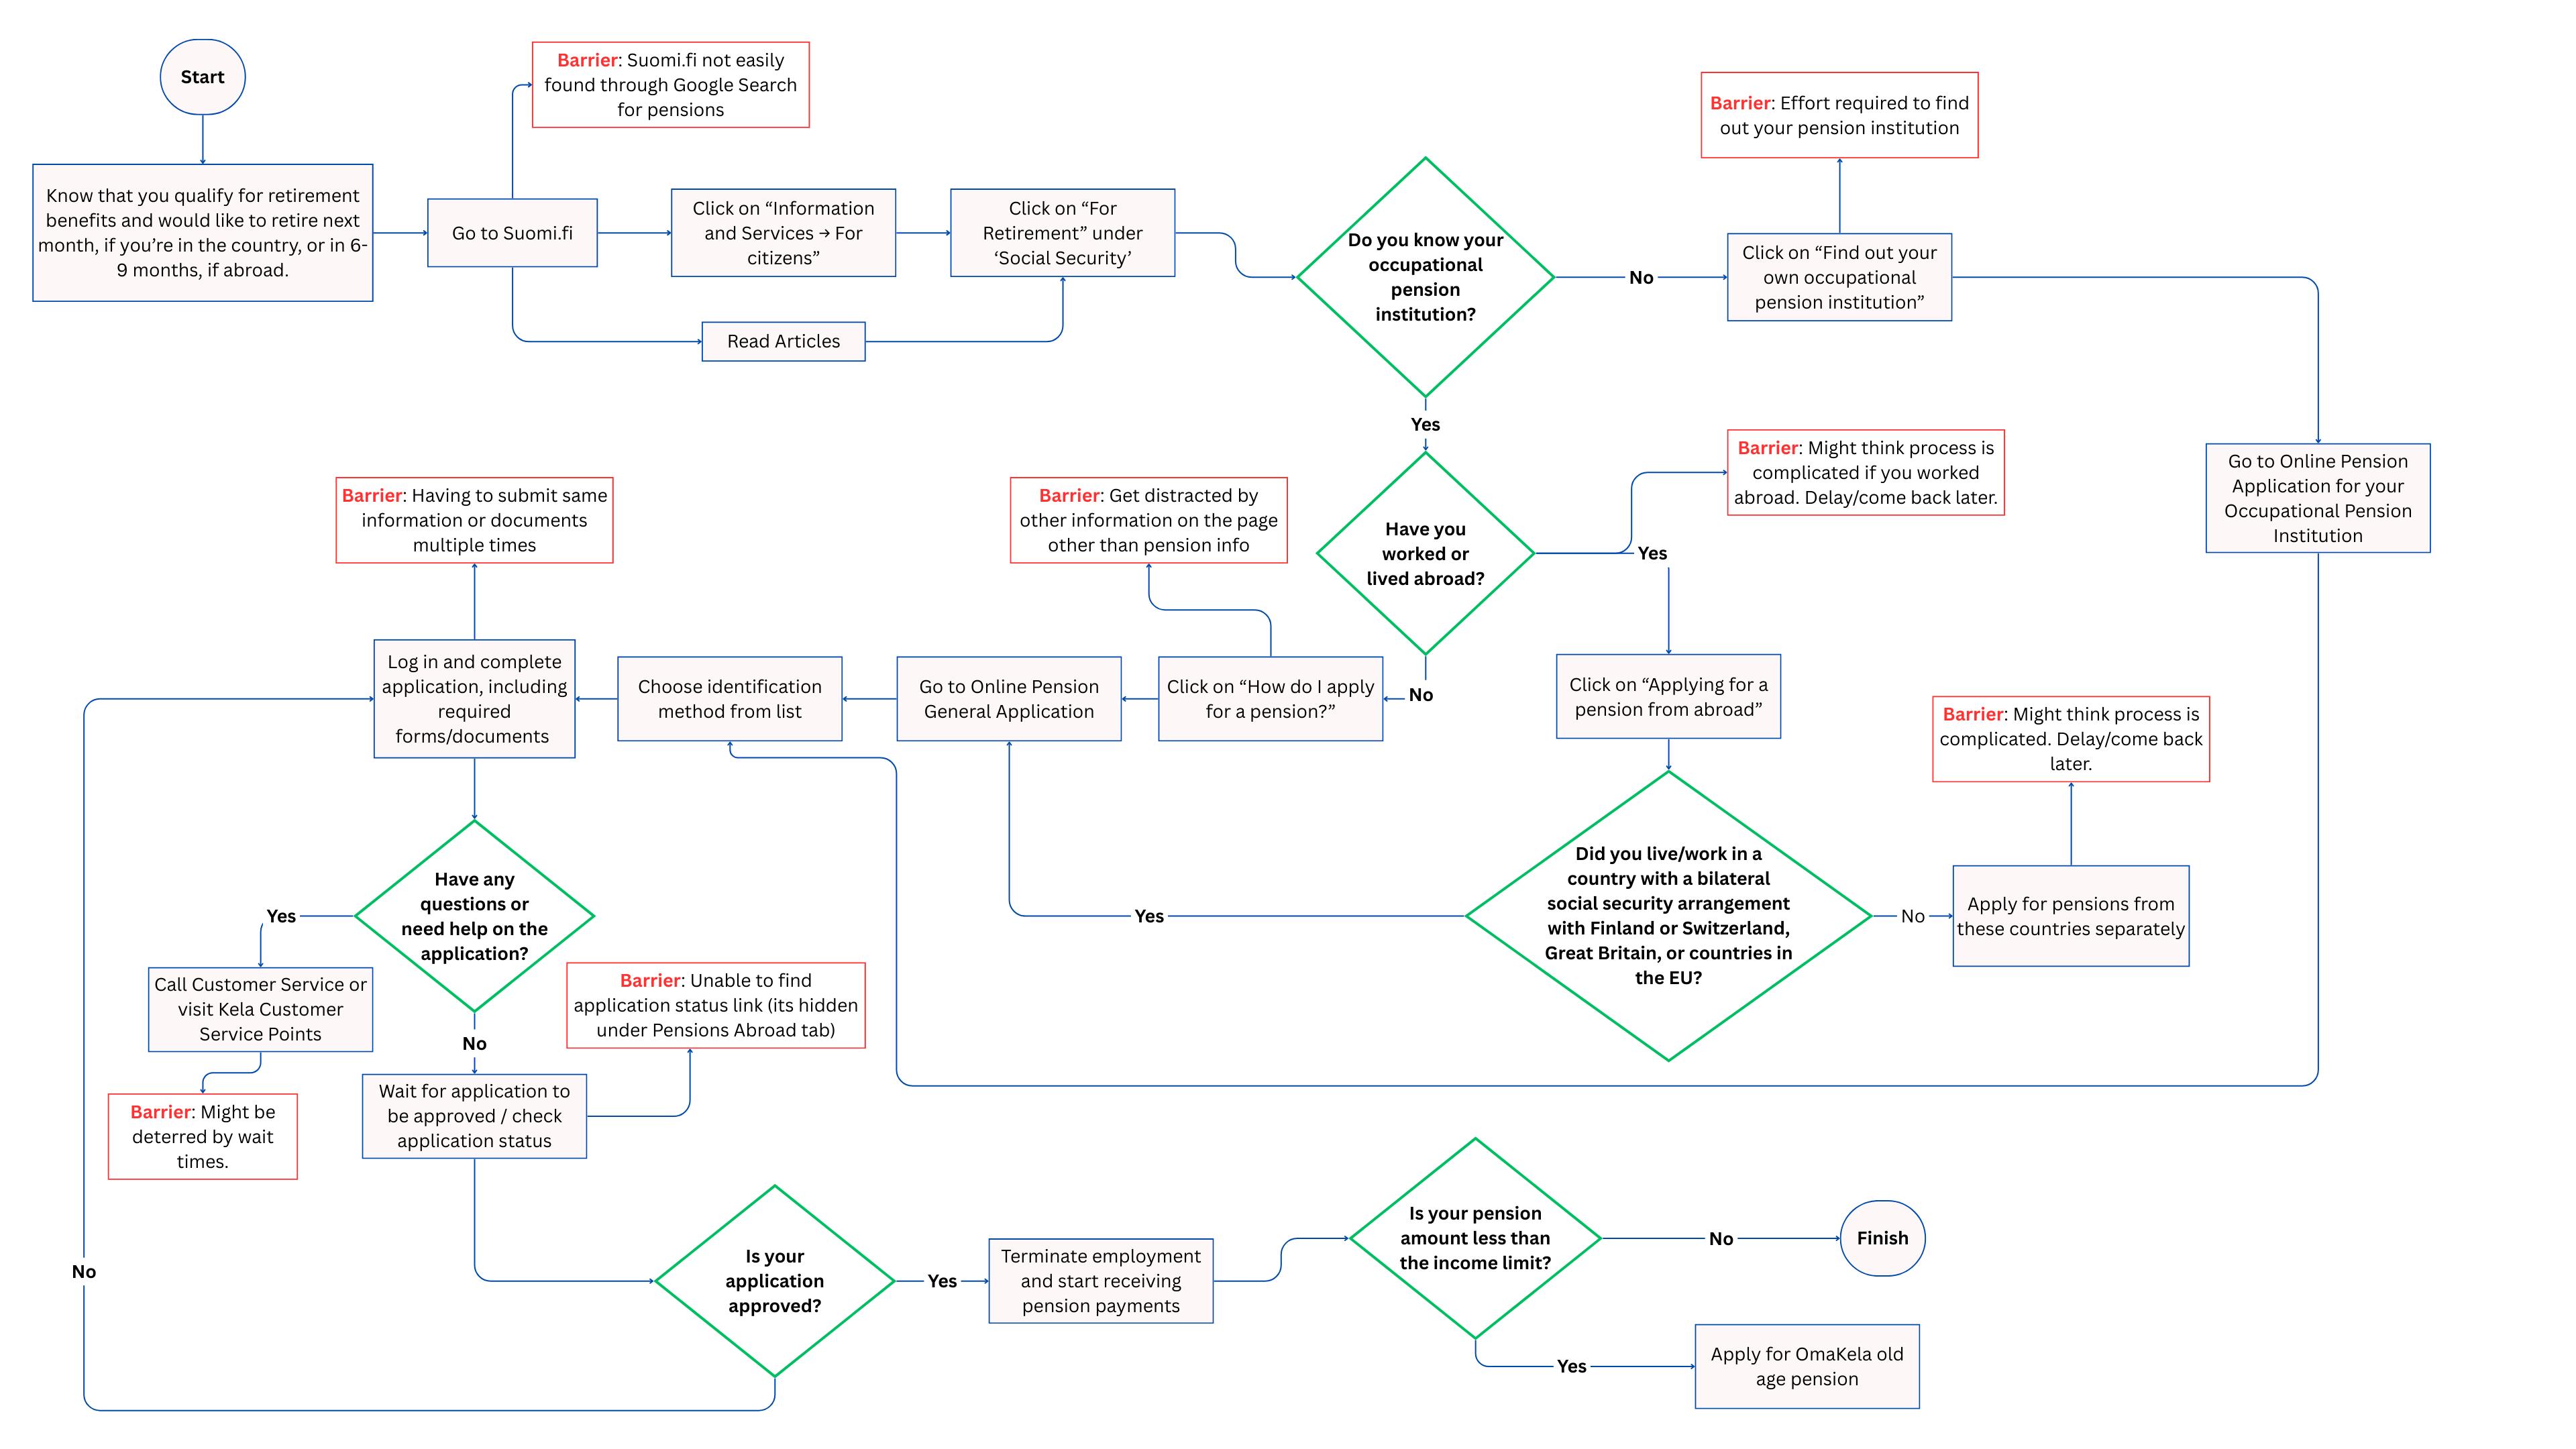
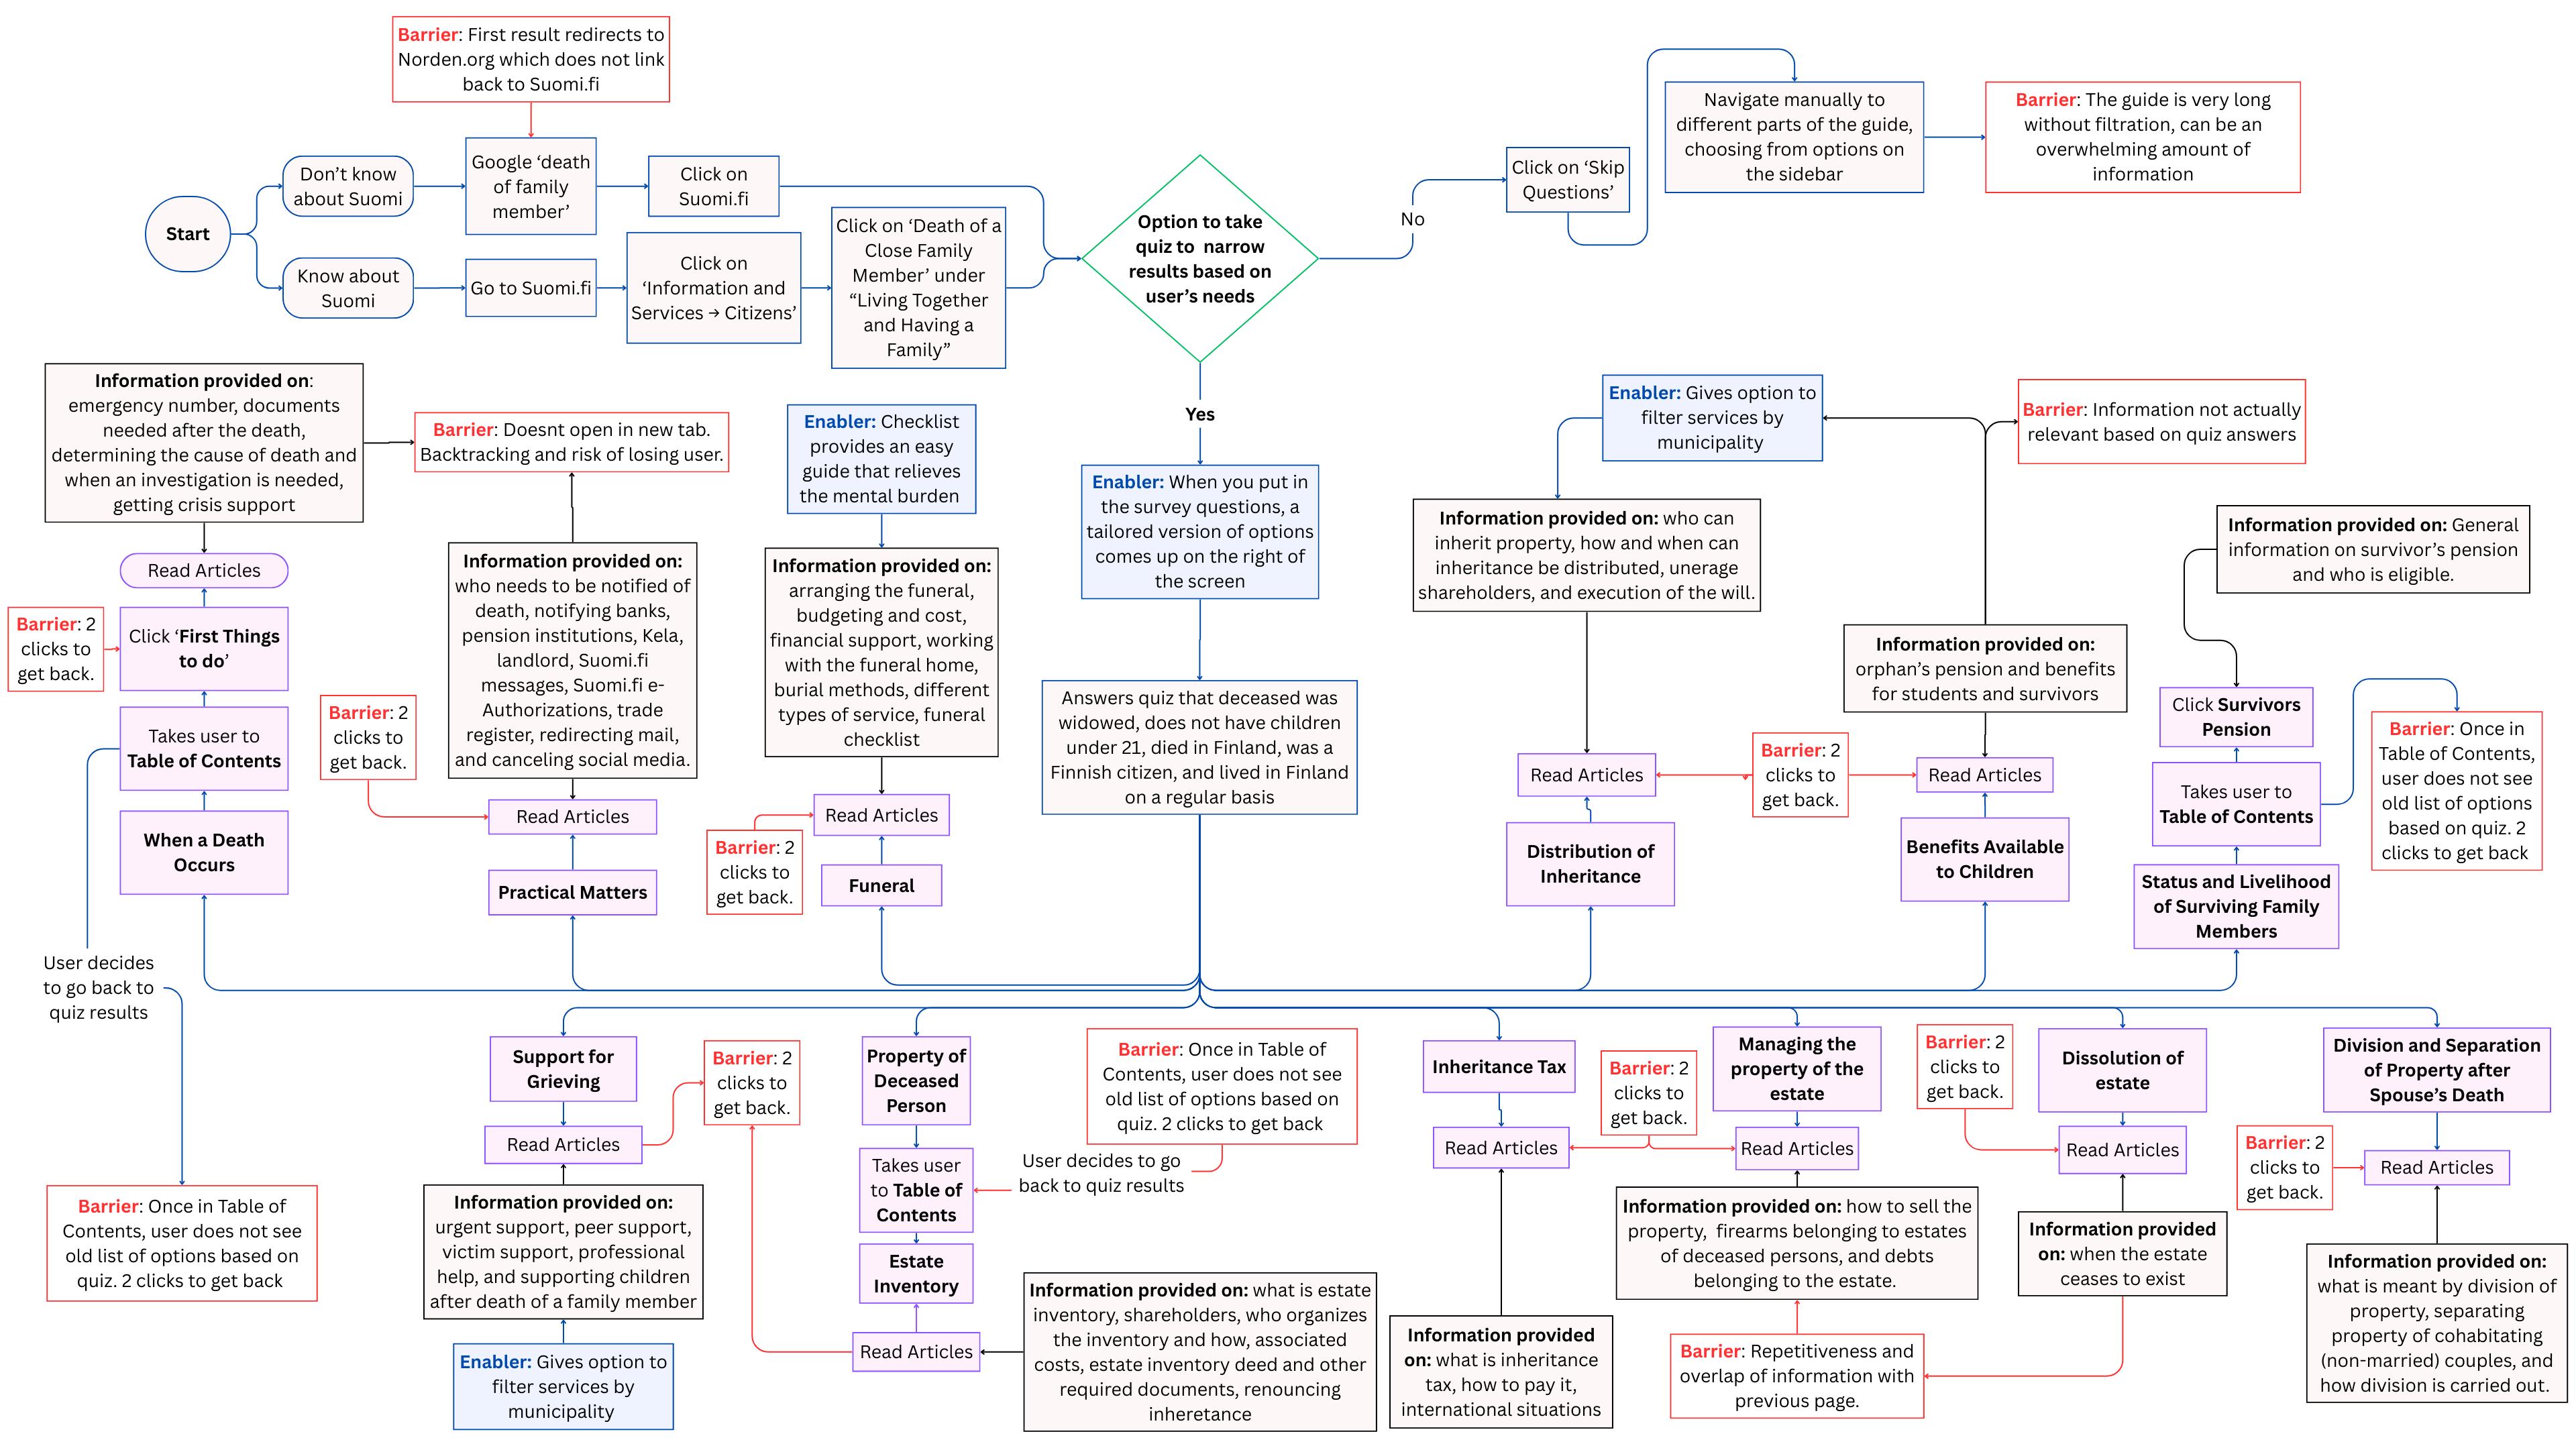
The third section– Towards Sludge Audits – contains three cognitive walkthroughs setting out insights from preliminary research and stakeholder discussions on the administrative framework and user journey of accessing unemployment insurance, pensions, and bereavement services on Suomi.fi, with the goal of informing the application of sludge auditing methods. It highlights how sludge auditing initiatives can use tools such as cognitive walkthroughs to identify specific pain points and optimize user experience through a behaviorally informed lens.
The fourth section – Analyzing Service Quality with Suomi.fi Quality Tools – highlights how existing tools to gather user data available on Suomi.fi can help foster a user-centric approach by gathering user data and feedback on services at scale.
Finally, the report offers its Conclusions and Recommendations.
I. Literature Review and Conceptual Framework
A growing international movement seeks to leverage behavioral insights to improve government service provision, thereby building public trust in government and improving citizen wellbeing. A review of the literature concludes: first, that the sludge in government service provision is real and measurably impactful; second, that behavioral science efforts to reduce sludge have been successful in increasing efficiency and effectiveness in a variety of countries and policy areas; and third, that there are several policy areas within Finland that could greatly benefit from these efforts.
This section: [A] reviews the literature on conceptual foundations of sludge, including the underlying mechanisms through which sludge and administrative burdens create negative impacts on citizens as well as sludge measurement methodology; [B] identifies successful efforts across countries and policy areas to reduce sludge that have led to improved citizen outcomes, including best practices of sludge auditing methods; [C] identifies how desludging efforts are important because they connect to advancements on key OECD public governance workstreams; and [D] explores literature on key policy areas for the government of Finland to show how targeted sludge reduction efforts could generate improvements.
A. Sludge is real and measurable
Administrative burdens are procedural obstacles that individuals or companies must navigate to participate in programs, access licenses, or otherwise benefit from public services. This can include both learning costs (the effort to understand eligibility and application processes) as well as compliance costs (the time and resources required to fulfill requirements).1 These burdens can deter eligible individuals from accessing the services, leading to unmet needs and increased costs to society: In one egregious example, “60% of recipients of a child support grant in South Africa experienced an interruption or disconnection in grant receipt that appears to be associated with administrative burden, with 80% of those stoppages in error”.2 Sludge in administrative processes subtly discourages or impedes individuals from taking action to apply or to fully make use of benefits or services.3 Sludge can manifest through excessive paperwork, convoluted instructions, or intrusive data requirements, which not only frustrate users but also contribute to inefficiencies within public service delivery. For instance, Sunstein references that nearly 40% of those eligible for SNAP (a US food assistance program) do not apply or do not apply successfully because of these exact issues – this represents a significant loss of welfare for families across America.4
Recent advances in behavioral science have deepened our psychological understanding of how sludge and administrative burdens harm users. For instance, the concept of "decision fatigue" has highlighted how small, repetitive barriers—like additional forms—drain cognitive resources, making people less likely to complete necessary tasks. Bhargava and Manoli show how reducing the mental load through clearer messaging can counteract this fatigue: They find that over 35,000 filers left $26 million of tax rebates unclaimed due to this exact issue.5 Similarly, the concept of "scarcity mindset" in Mullainathan and Shafir, shows that when individuals are mentally preoccupied with limited resources (such as time or money), even minor administrative frictions become psychologically amplified.6 Research on “friction costs,” as studied by behavioral economists, has further shown that the cognitive drain from sludge disproportionately impacts those under stress, such as low-income individuals.7 Behavioral science provides tools to understand how each additional step or complexity in a process
can psychologically deter engagement, especially among vulnerable populations; it is all the more important to mitigate these barriers with respect to public services.
Many academic studies have explored the negative effects of administrative burdens and sludge on both public trust and outcomes. For example, Fox et al highlight how high administrative burdens can cause lower participation rates in social welfare programs.8 Keiser & Miller discuss the political and social ramifications of excessive bureaucratic hurdles, emphasizing their impact on public support for government programs: Experiencing barriers in public service access, or even hearing about barriers that others face, can reduce public support by 6-20 percentage points.9 These studies usually take mixed-methods approaches, combining quantitative analyses (of program participation rates, for instance) with qualitative assessments of user experiences to provide a comprehensive understanding of the barriers that citizens or companies face.10 Ultimately, the impact of sludge on citizens is undeniable across domains and policy areas.11
Sludge and its negative impact are not merely abstract or qualitative but can be measured. Major US federal government reports have engaged in efforts to quantify the amount of sludge that exists and its economic impact. One first approximation at this task is calculating the amount of time lost due to sludge and then assigning an opportunity cost to that time. This opportunity cost varies but it typically aligns with an estimated hourly wage, in alignment with classical economic concepts. According to the Office of Management and Budget (OMB), the value of an individual’s time is around $20 to $25 per hour for general administrative contexts. For higher-impact sectors or professional tasks, this can range up to $50 per hour or more. If Americans spend an approximately 11.4 billion hours annually on paperwork, this costs $228 billion (at $20 per hour) to $285 billion (at $25 per hour).12 These enormous costs underscore the seriousness of administrative burdens and the need for sludge reduction initiatives to save both time and money for citizens and the government.
B. Desludging works
Teams working with governments throughout the world have found ways to leverage behavioral insights to ameliorate the problems caused by sludge and administrative burdens. For example, the United Kingdom’s Behavioral Insights Team (BIT) led a sludge audit of its welfare system to identify and remove unnecessary steps in benefit applications. This helped reduce the complexity and time required to apply for benefits, raising completion rates and increasing the speed of service delivery for eligible recipients.13 In the US, one study found that text message reminders increased on-time SNAP recertification by 5%, ensuring that households were more able to access important benefits for which they are eligible.14 In New South Wales, desludging by streamlining the application process increased the percentage of participants who found the death certificate process easy to 74%.15
Desludging efforts typically employ two key methodological steps based on best practices. First, mapping the user journey is key. This involves documenting each step that users take to complete a process, such as applying for benefits or accessing healthcare, to identify unnecessary steps or confusing requirements.16 A major emphasis here is the user’s psychological state at each point in the journey, and how this state may cause deviations from choices and behaviors in their own best interest. The BIT successfully applied this method to streamline the application process for various public services.17 Second, quantitative and qualitative analysis of user behavior is key. For example, observing data on dropout rates at different application stages helps reveal points of friction, while interviewing users provides insights into their frustrations and needs. This combined approach was employed in the United States' SNAP sludge audit, where both data on form completion and user feedback informed the effort. Effective sludge reduction requires comprehensive stakeholder engagement to ensure that service design meets user needs while minimizing unnecessary burdens. Mills et al emphasizes the importance of collaborative
governance, where input from diverse stakeholders—including service users, administrators, and policymakers— guides the development of more user-friendly processes. Mills et al also advocate for participatory design approaches. These approaches foster a deeper understanding of user experiences and identify specific pain points within administrative processes.18
The evolution of digital service provision has significantly transformed how public services are delivered and accessed. Bouguettaya et al chart the development of e-government initiatives from simple online information portals to “sophisticated, user-centric service platforms”.19 Digitalized services are more accessible, reduce administrative burdens, and have better efficiency. However, Kollmer warns that without careful implementation, digital services can introduce new forms of sludge.20 Increased reliance on digital literacy and access to technology are key concerns.
In Finland, Suomi.fi is a key platform for digital service provision. Established as a centralized digital platform, Suomi.fi integrates various public services, allowing citizens to access multiple services through a single interface. It is not a one-stop shop for the delivery of all digital services, but it provides information about those services, resource guides on different themes and life-events, and a centralized authentication and messaging service. Through this report, we refer to this bundle of functions as the gateway function performed by Suomi.fi. Streamlining of these functions can reduce administrative burdens and sludge by creating a unified access point for many services, which would otherwise require a citizen to navigate to different websites. The website is also useful as a central repository of information about the types of services available, who is eligible, what they provide, and how to access them.
C. Desludging connects to key OECD workstreams
An OECD workstream is dedicated to the importance of desludging. After conducting a sludge academy with the government of New South Wales and in collaborating with 16 other governments, the OECD published “Fixing Frictions: ‘Sludge Audits’ Around the World”, which identifies sludge audit best practices, ranging from “accommodating non-linear and diverse behavioral journeys” to “deploy an equity lens.”21 The OECD emphasizes that sludge audits are key to user accessibility, ease of use, and fairness, and have been deployed successfully throughout the world to improve the relationship between citizens and governments. The report notes that 4 out of 10 survey respondents do not have confidence in their government to improve inefficient processes within public service provision, evidencing the high unmet need among citizens for desludging efforts.
Our efforts to improve public service provision are made all the more urgent given declines in public trust throughout OECD countries. The OECD's “2024 Survey on Drivers of Trust in Public Institutions” found a steep decline in public trust in governments across OECD countries, attributed largely to failures in the accessibility and adequacy of public service provision. Trust in public institutions averages only 41% across nations surveyed, the culmination of steady declines over the course of preceding years. In Italy and Greece, trust levels are especially low, at 25% and 23%, respectively. Many citizens believe that government service provision is inadequate; quality and accessibility are key issues. In several countries, 40% or more of respondents indicated that they face barriers to accessing various services.22 In a time of rising illiberalism and declining public trust, using all tools available, especially the tools of behavioral science, to increase the efficacy of public service provision to citizens is all the more important.
Desludging also dovetails with the OECD digital government workstream. OECD maintains a digital government index and a group of regular digital government reports that track governments’ adoption of digitalization,
including digitalization of public services. In particular, the report “Enabling Digital Innovation in Government: The OECD GovTech Policy Framework” describes an OECD-led initiative between the public and private sector to advance “innovative digital government solutions”.23 In many cases, desludging and digitalization go hand in hand, as efforts to streamline and improve access to public service often involve e-communications as well as improving online options for previously brick and mortar processes. One example of this is, of course, Finland’s Suomi.fi website.
D. Desludging is relevant to Finland
Extensive consultations with members of the Finnish government and users have identified a set of priority services which have the potential to be more effective through desludging. In line with national policy priorities to maximize positive impact, three key services with potential for desludging are access to unemployment benefits, bereavement services, and pension benefits. Accessing unemployment benefits is a critical support mechanism for individuals facing job loss. However, studies indicate that various administrative burdens hinder effective access to these services. Immervol and Knotz found that complex applications and strict eligibility criteria significantly reduce the likelihood of unemployed individuals claiming benefits.24 Kalucza & Sievert provide an example of how low digitalization of unemployment services can exacerbate administrative burdens, especially for vulnerable populations.25
Undergoing necessary formalities following the death of a close family member often involves significant emotional and administrative challenges. Green and Green explain that the lack of streamlined procedures for processing death certificates and accessing survivor benefits can lead to delays and increased stress for bereaved families.26 Also, Morgan et al claim that inconsistent information dissemination and bureaucratic inefficiencies further complicate the process, discouraging individuals from seeking the support they need during difficult times.27 Accessing pension benefits is another area where behavioral principles, including the design of choice architecture can structure outcomes. Finseraas and Jacobsson emphasize that inadequate guidance and support services reduce uptake, particularly among older adults who may face additional challenges.28 Bielawska and Turner analyze how the default of auto-enrollment can affect pension scheme participation outcomes and discuss international applications to different contexts.29
The literature underscores the significant impact of administrative burdens and sludge on the accessibility and efficiency of public services, as well as potential paths to address them through a sludge audit and the imperative of restoring trust in public service provision and institutions.
II. Streamlining Digital Service Delivery in Finland
A. Digital Service Delivery in Finland
Reducing friction in digital service delivery positions Finland as a global leader in digital government and aligns with Finland’s economic goals and digital strategy.
Digital services in Finland have expanded gradually over several decades and are now a major part of the Finnish Government’s strategy to improve service delivery. Finland has devised a strategy, "Digital Compass" - its roadmap for digitalization scheduled for completion in 2030 - to position the country as a global leader in accessibility and service delivery. Key areas of focus include significant life events and access to medical records. Suomi.fi plays a central role in this strategy.
The Finnish Socio-Economic Context
Finland is a developed country with an average GDP per capita of $54,770. However, Finland’s GDP has stagnated over the past five years, culminating in a –1.0 percentage point recession in 2023. The Finnish economy did not grow in 2024, and independent experts only expect minimal growth in 2025.30 Therefore, there are fiscal constraints governing the extent to which the government can financially invest in improving digital delivery. A low cost-solution to this problem is the Finnish Government can reduce sludge to improve digital services.
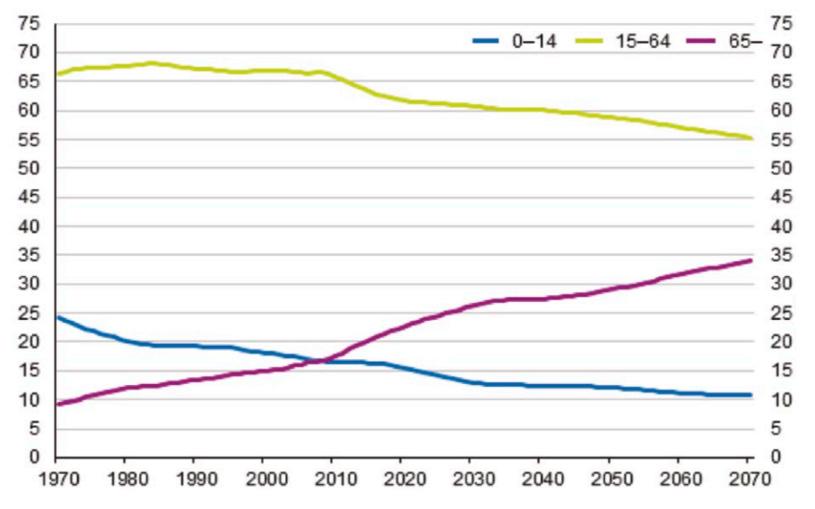
Finland has a small population-- about 5.6 million people- and has one of the highest literacy and education rates globally.31 Younger and digitally savvy workers are concentrated in its major cities—Helsinki, Espoo, and Tampere— while the rural areas consist of a larger pencentage of older citizens. As of 2020, Finland had the third highest percentage of people above the age of 65 in the world at 21.9%.32 Finland has one of the lowest population densities in Europe, which can introduce challenges in service delivery. The average number of people per square kilometer is 18, although this varies widely, with the northern regions of Finland sometimes being as low as 0.2 per square kilometer.33 Subsequently, it is vital for the government to find a way to effectively deliver services to both urban and rural areas. Better digital service delivery through reduced sludge is a solution to this challenge.
Finland’s digital services are wide, encompassing government sectors such as taxation, social benefits, and business services. The government has made it a priority to shift more services to a digital option that helps simplify the processes for citizens and businesses. Finland draws inspiration from Estonia, a global leader in digital government services.34 Estonia has been able to do this by making the digital option the first option. It has been able to provide services like marriage certificates, voting, and residency permits available through online portals.35 Estonia’s model of a unified digital services infrastructure reduces the friction or ‘sludge’ citizens encounter while using government services. Finland’s end-goal is the same – to make accessing services easier. Finland currently offers a wide range of online services through its national and municipal e-platforms. As of 2023, Finland had a digital penetration rate of 97.7%, so better digital service delivery affects nearly all Finnish residents.36
History of Digital Government in Finland
Finland’s journey in digital service delivery began in the 1970s, when government branches developed their own internal computer systems. These early efforts, known as Government 1.0, marked the beginning of Finland’s digital transformation.37 A notable example of Finland’s early attempt to digitalize was the Finnish Computer Project, or FICO. The FICO project was a government-sponsored research project aimed at producing a Finnishbased minicomputer for international markets. FICO failed because of intense international private-sector competition focused on the same market.38
In the 1990s, Finland emerged as a world leader in digitalization when the world wide web started to be adopted. Various government ministries created websites to interact with Finnish citizens. Some basic services provided during this period were related to health, social service, security, integration, and citizen participation.39 This was the era when the common Finnish citizen truly started accessing online government services. It is known as Government 2.0.
The third and current era is Government 3.0. This era embraces the development of next generation infrastructure, organizational structures, and process and services for the public sector.40 The change from Government 2.0 is that instead of data only going from the government to the citizens, both governments and citizens can exchange information with each other through digital services. To accomplish this, Finland launched the KaPa (Public Administration Digitalization Program) program in 2014, which aimed at centralizing digital services, increasing efficiency, and prioritizing data privacy.41
Adoption of Digital Services in Finland
Finland’s current state of digital services is advanced and widely used by its citizens. Suomi.fi is one of the government’s focus areas for this effort. Suomi.fi provides many services but below are three of the larger ones. First, it provides information about various national and municipal services. Suomi.fi provides information about more than 25,000 national and municipal services, a number growing every year. This is impressive because each municipality, of which there are 309,42 provides its services through slightly different processes. Second, it serves as an e-authenticator service, where citizens access to numerous government services is authenticated through the website. In fact, more than 4 million users use the Suomi.fi e-Authenticator service, which accounts for about 70% of Finland’s population. Third, Suomi.fi serves as a messaging interface between the government and citizens. Finnish people can opt to see a consolidated inbox that provides notifications, transaction updates, and secure document sharing with the government. Currently, 1.6 million Finnish citizens make use of the Suomi.fi messaging system, and the Finnish Government’s goal is to increase this number rapidly.
At the same time, Suomi.fi is only one digital service in the broader landscape of Finnish digital services. Ministries steer services created by implementing agencies and municipalities, and the broader strategy envisions the coexistence of these multiple services and systems.43 Suomi.fi is not currently a one-stop shop for the delivery of services and there is no intention by the government to make it one. In fact, Suomi.fi often redirects users to other services to do certain things, such as apply for licenses, fill specific forms, or file complaints with the relevant department. This vision of Suomi.fi envisages its coexistence with other Finnish digital platforms.
B. Behavioral Science Capacity in Finland
Sludge auditing approaches are aligned with FINBEPOL and DVV's mission, capacity, institutional structure, and methodological focus.
The behavioral science capacity in Finland is concentrated within the Prime Minister’s Office, which houses the Finnish Behavioral Policy Unit (FINBEPOL). In addition, the Digital and Population Data Services Agency (DVV), whose work is steered by the Ministry of Finance, works on service design and digital innovation. This section presents a brief overview of the FINBEPOL and DVV.
I. FINBEPOL
(a) Agency Overview
History
FINBEPOL, the Finnish Behavioral Policy Unit, originated from an experimental program called “Experimental Finland” (2015–2019). This pilot paved the way for an interim initiative in October 2020 that ran for six months. This was motivated by the COVID-19 pandemic, which demonstrated the urgency for behaviorally informed policies. By 2022, FINBEPOL was institutionalized within the Prime Minister’s Office to integrate behavioral science insights into public policy.
Following a best-in-class global trend: FINBEPOL is one of many examples of governmental behavioral science units; several governments worldwide have adopted behavioral science to inform policy.44 The UK’s Behavioral Insights Team (BIT), founded in 2010, is one of the first governmental units of its kind. BIT demonstrated the value of randomized controlled trials (RCTs) for evaluating behavioral interventions, popularizing their use to test policy efficacy on issues ranging from tax compliance to public health. BIT’s success catalyzed similar units across the globe, including the World Bank’s Mind, Behavior, and Development Unit (eMBeD), which was established in 2015 and provides behavioral insights for projects in low- and middle-income countries. Both BIT and eMBeD emphasize program evaluation methods—especially Randomized Control Trials (RCTs) —to determine the impact of behavioral interventions and identify approaches that yield measurable outcomes. Other examples include the Behavioral Economics Team of the Australian Government (BETA) within the Prime Minister’s office, the Netherlands behavioral science team within the Ministry of Justice and Security, and the German Chancellery Behavioral Insights Team which now operates within the broader Policy Lab Digital, Work & Society.
Staffing
The FINBEPOL team is a small unit with four team members.
Main Projects
FINBEPOL has had 10+ projects since its establishment. During 2022-2024, FINBEPOL has developed behavioral science expertise in central government by organizing training for civil servants, producing research reports and implementing projects in the government across different policy areas. During the follow-up project, behavioral science activities have expanded significantly and today the team collaborates with different ministries and agencies on different policy areas. The past and ongoing projects are outlined in the annual report and cover topics such as psychological resilience, sustainable development, regional development and over-indebtedness.45
(b) Capabilities and Limitations
Expertise in applying behavioral science in public policy, with an emphasis on co-design and collaboration.
Utilizes an established methodology (TESTS) for data collection, pilot testing, and evaluation.
Strategic partnerships with domestic and international partners, including universities, consultancies, and neighboring countries like Estonia.
(c) Implications for institutionalization of sludge audits
1. Cross-Ministry Collaboration:
Reliance on external, project-specific funding streams constrains long-term planning.
II. DVV
(a) Agency Overview
History
The DVV has a mandate set by the Ministry of Finance. It has evolved over time as Finland’s digital backbone, providing critical support for data-sharing and digital services across government, and becoming the operational backbone of Suomi.fi.
Staffing
DVV employs over 900 people, with offices in 30 towns throughout Finland. It has its own human-centered design team, which works to ensure that digital solutions serve both employees (back-end usability) and citizens (frontend accessibility).
Main
Projects
a. Because FINBEPOL relies on partnering with various ministries to secure funding and implement projects, sludge audits should naturally fit into the existing cross-sector model. This promotes shared ownership of sludge reduction and helps embed the practice across government.
b. FINBEPOL’s approach encourages ministries to co-design interventions and train their own employees, fostering internalized capacity for conducting audits over time.
2. Embedding Audits in Long-Term Policy Architecture:
a. The Sludge Audit Initiative aims to build a culture of continuous assessment, where government agencies regularly evaluate the psychological, operational, and other costs of sludge.
b. As FINBEPOL remains embedded in the Prime Minister’s Office, opportunities exist for sludge audits to become a permanent fixture in strategic policy planning and budgeting cycles.
3. Resource Considerations:
a. Training government employees to conduct audits themselves increases sustainability and lessens the dependency on external consultants or project-specific funding.
1. Data-Sharing and Digital Ecosystem Coordination: DVV leads in creating frameworks that link various government services around significant “life events,” such as marriage, parenthood, or bereavement.
2. Collaborations with FINBEPOL: DVV seeks to reduce redundancies and administrative burdens, with an eye to providing a streamlined user experience for citizens, particularly through its human centered design team which represents dedicated capacity oriented towards this end goal.
3. Unified Data Architecture Goals: DVV has drawn inspiration from Estonia’s approach to unified data architecture, aspiring to standardize how different ministries collect, manage, and share data, and creating a unified technical architecture for the design and delivery of services.
(b) Capabilities and Limitations
A large, dispersed workforce enables DVV to engage directly with multiple municipalities and nationally.
Established ties to the Ministry of Finance position DVV to shape strategic decisions on digital policy, budgeting, and procurement.
Lack of a fully unified data architecture across Finland. Many agencies still operate legacy systems, creating technological silos.
According to interviews, DVV often joins government projects too late, limiting its ability to shape designs and reduce friction at early stages (e.g. procurement). Proven ability to coordinate cross-agency digital services, supported by robust technical expertise.
(c) Implications for institutionalization of sludge audits
1. Early Integration into Digital Service Design: By involving DVV from the start of digital service projects, sludge audits can proactively identify potential administrative burdens. This helps shape procurement requirements and user-centric design considerations from the onset.
2. Data-Sharing as a Catalyst for Audits: DVV’s push for a unified data architecture will amplify the impact of
services like school-parent communication, health communication, building zoning and permits, and other platforms. Both large and small municipalities have the opportunity to play a direct role in engaging citizens, adapting national policies to fit local contexts, and providing valuable feedback to national authorities on the challenges and successes of implementation. It would be informative to the sludge audit process to speak with municipal stakeholders to learn about the reasons behind the relatively slow uptake of centrally created services.
• In-house organizations also play a significant role in Finland’s digital transformation. Many cities, municipalities, and wellbeing counties own non-profit organizations that develop IT solutions specifically designed for public sector needs, including creating platforms for services that are administered at the local level like those that provide childcare information or building and zoning permits. These firms work closely with local governments to create user-centric platforms.
• Third-sector organizations, including nonprofits and advocacy groups, serve as mechanisms to elevate the voices of citizens. They represent the interests of specific population groups, such as the elderly or individuals with disabilities, ensuring that digital services are inclusive and accessible to all. Beyond advocacy, these organizations can partner with government agencies to co-create services. Their involvement could bring realworld perspectives to the table, helping shape policies and platforms that address the actual challenges faced by citizens. We did not have the opportunity to speak to third-sector organizations and recommend that they are consulted as a means to gather more information for the sludge audit process.
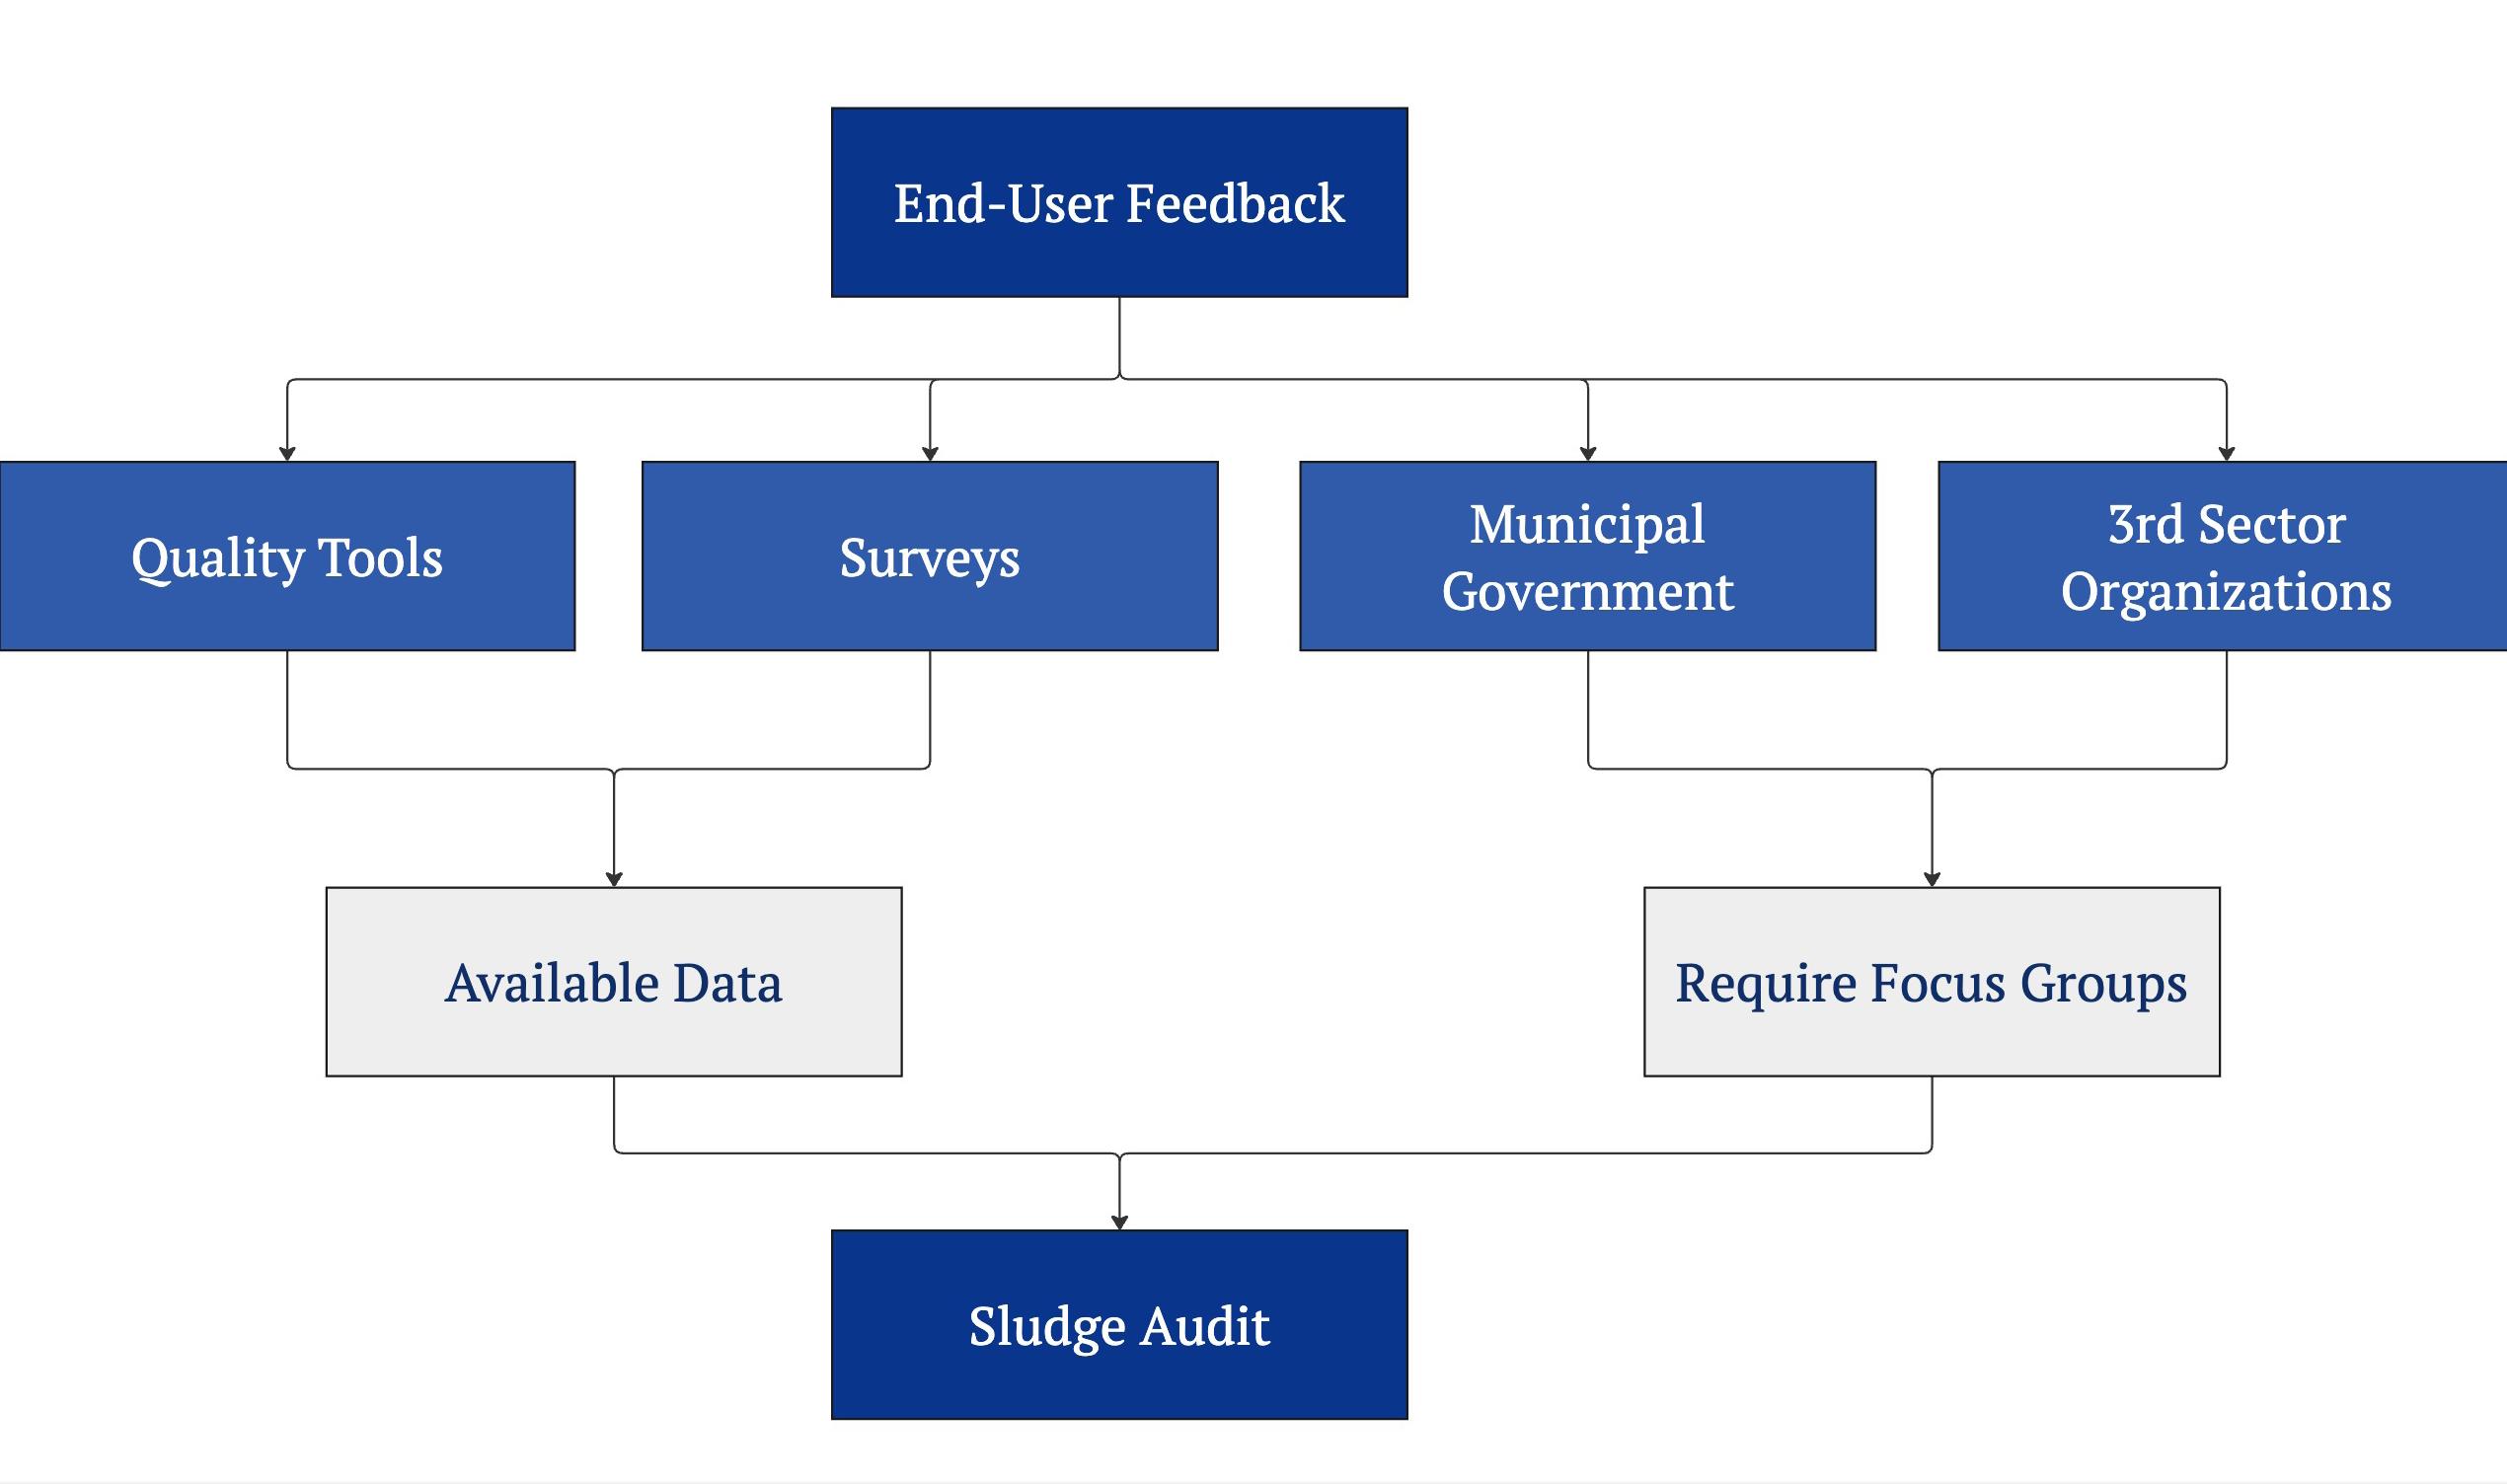
• Finally, citizens themselves are at the heart of efforts to reduce sludge in digital services. As the primary users of these services, their experience and feedback are invaluable. Citizens may contribute to the improvement of digital platforms by participating in user testing, reporting inefficiencies, and responding to requests for feedback from municipalities and other stakeholders. Their input can not only inform the development of more intuitive systems but also ensure that these systems meet the needs of Finland’s population. Figure 1a shows potential data sources that can be used to understand user feedback. DVV can utilize citizen feedback through quality tools, focus groups, surveys, or other direct feedback as well as through communication with municipalities about the digital service needs of their local populations. DVV can analyze data for common complaints and work to improve user experience, asking for feedback on updates if relevant. For the purposes of a sludge audit, all of the above modalities of user experience feedback could be utilized to gather information about common sticking points or reasons for low take-up of services. (See Figure 1a overleaf).
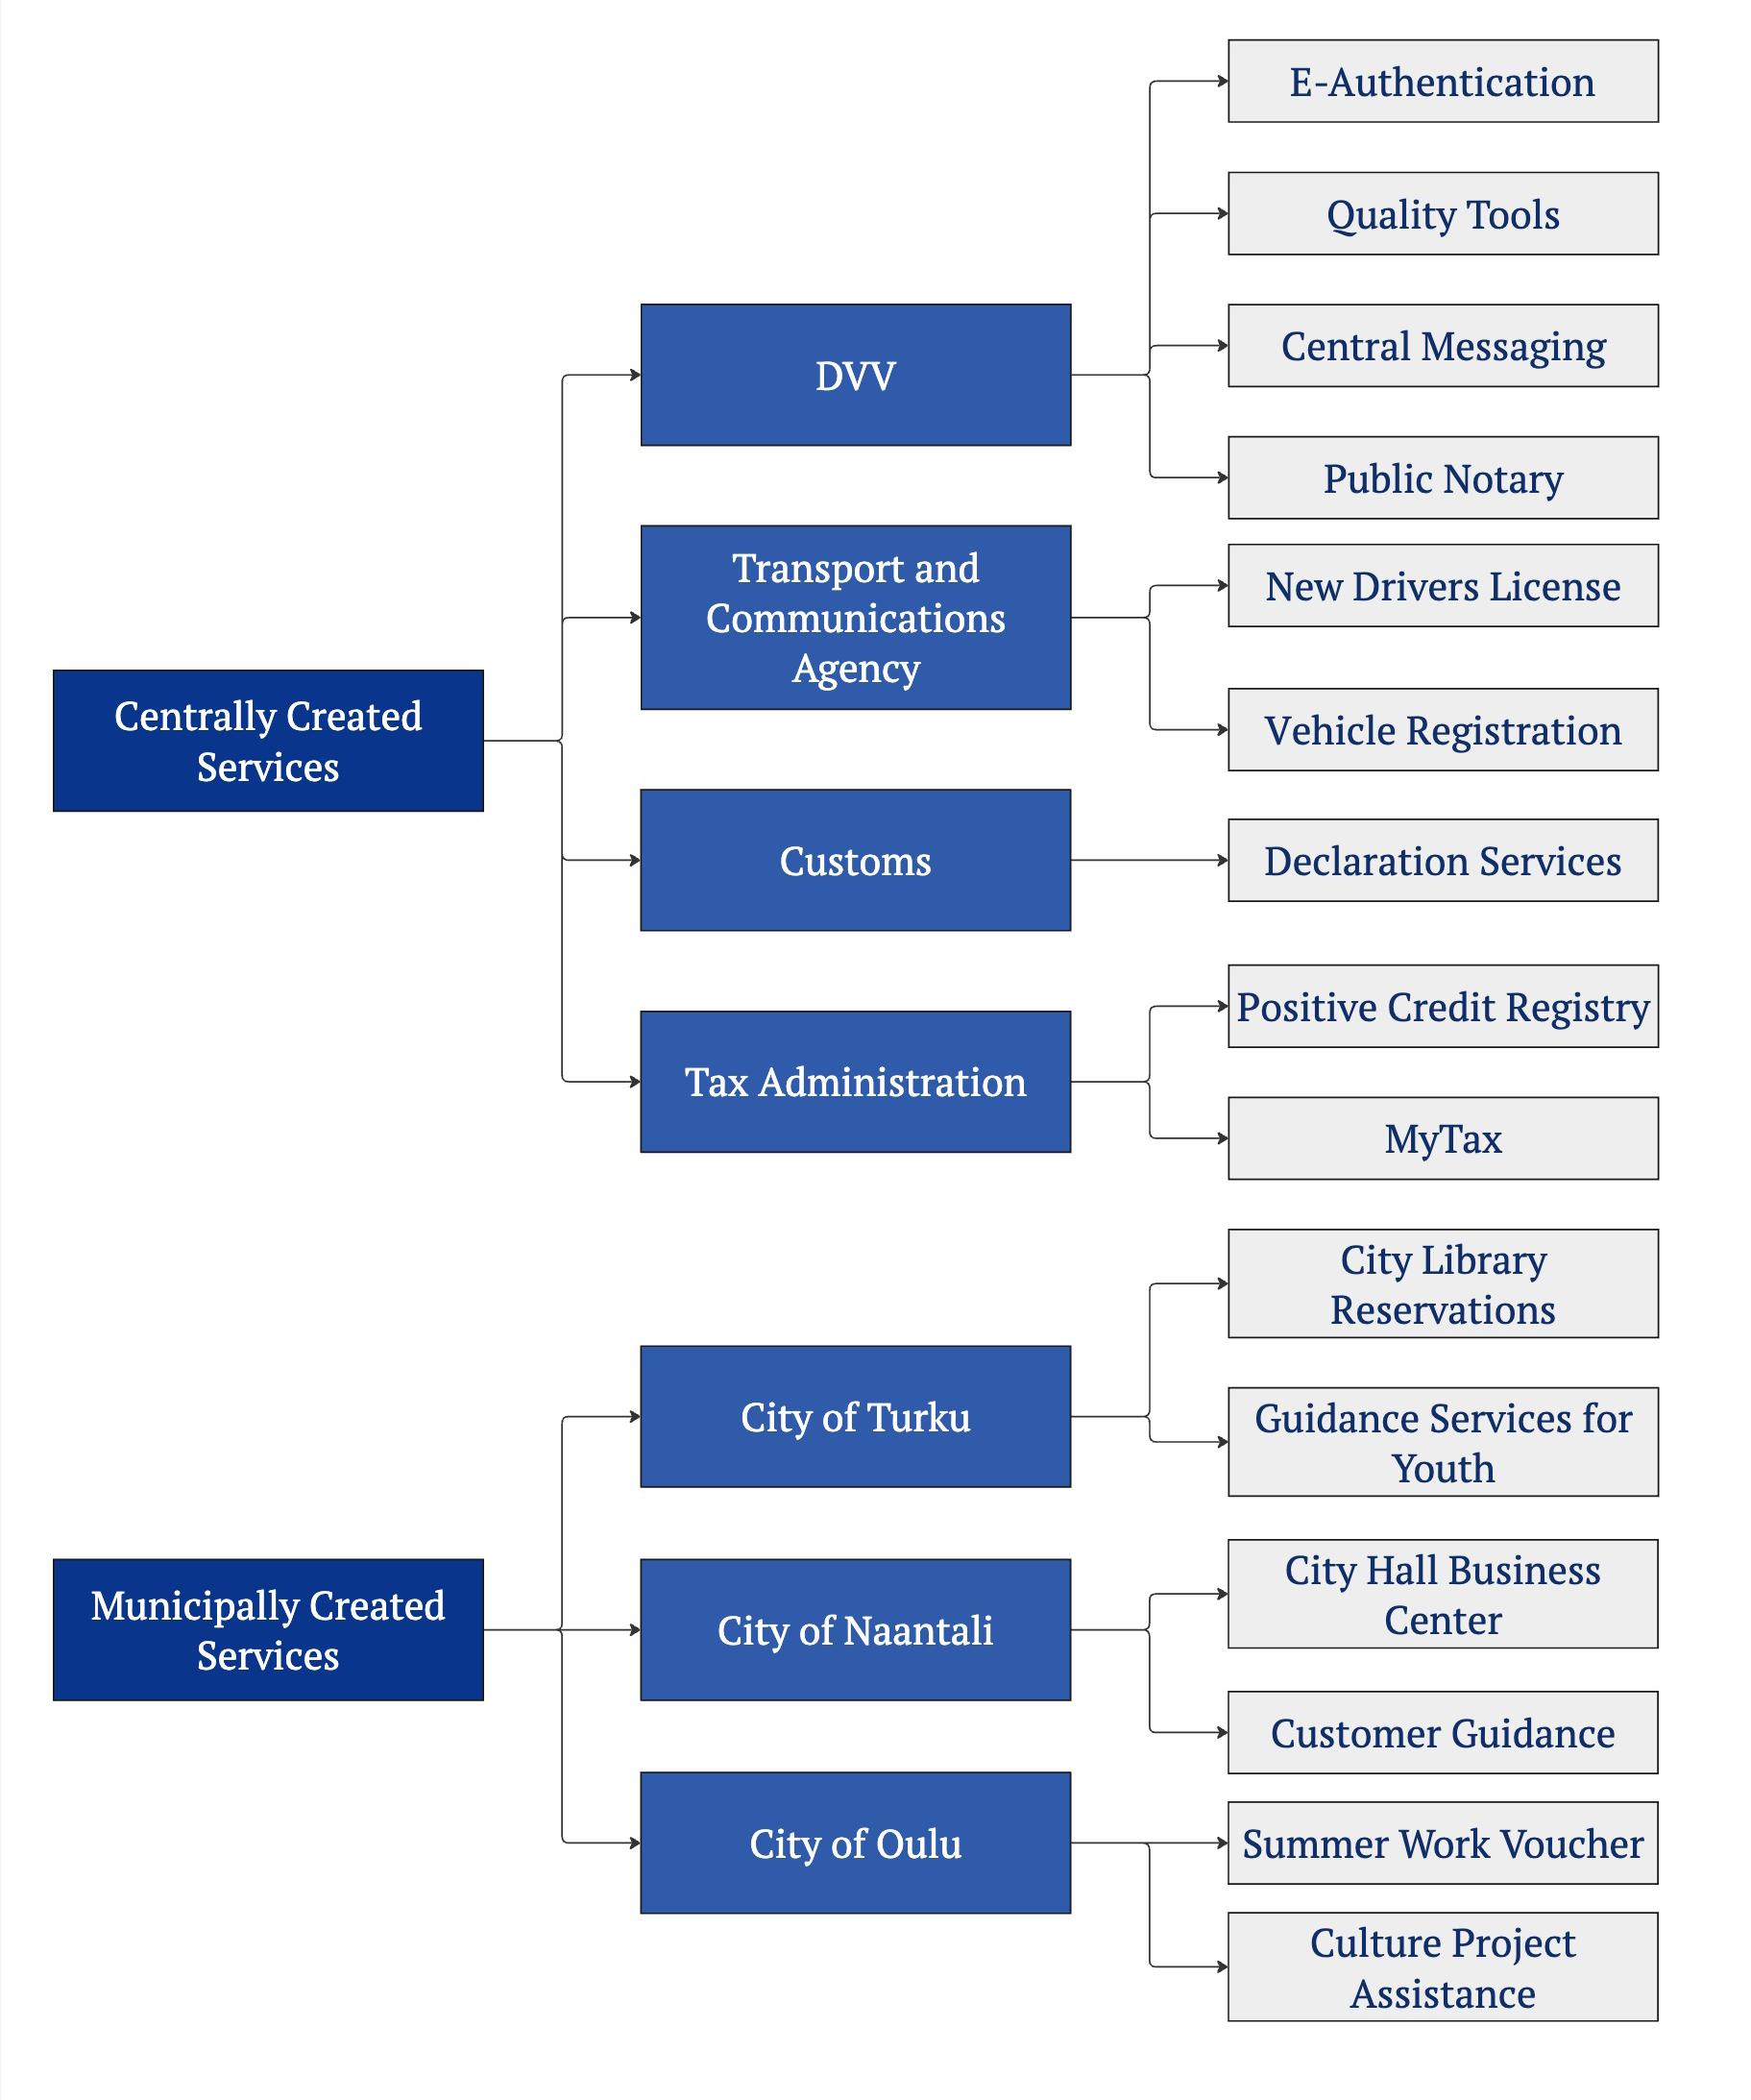
The creators of digital services include nodal ministries, which design services for their domains, agencies like Kela (the Finnish Social Insurance Institution) which administer the social insurance program, municipal governments which provide a range of localized services, and wellbeing services counties which are responsible for organizing health, social, and emergency services in Finland. These entities are responsible for creating the actual digital services that citizens use. Once developed, these digital services may be integrated into Suomi.fi or provided separately. Examples of these services can be found below in Figure 1b.
Figure 1a: Map of user feedback for use in a sludge audit
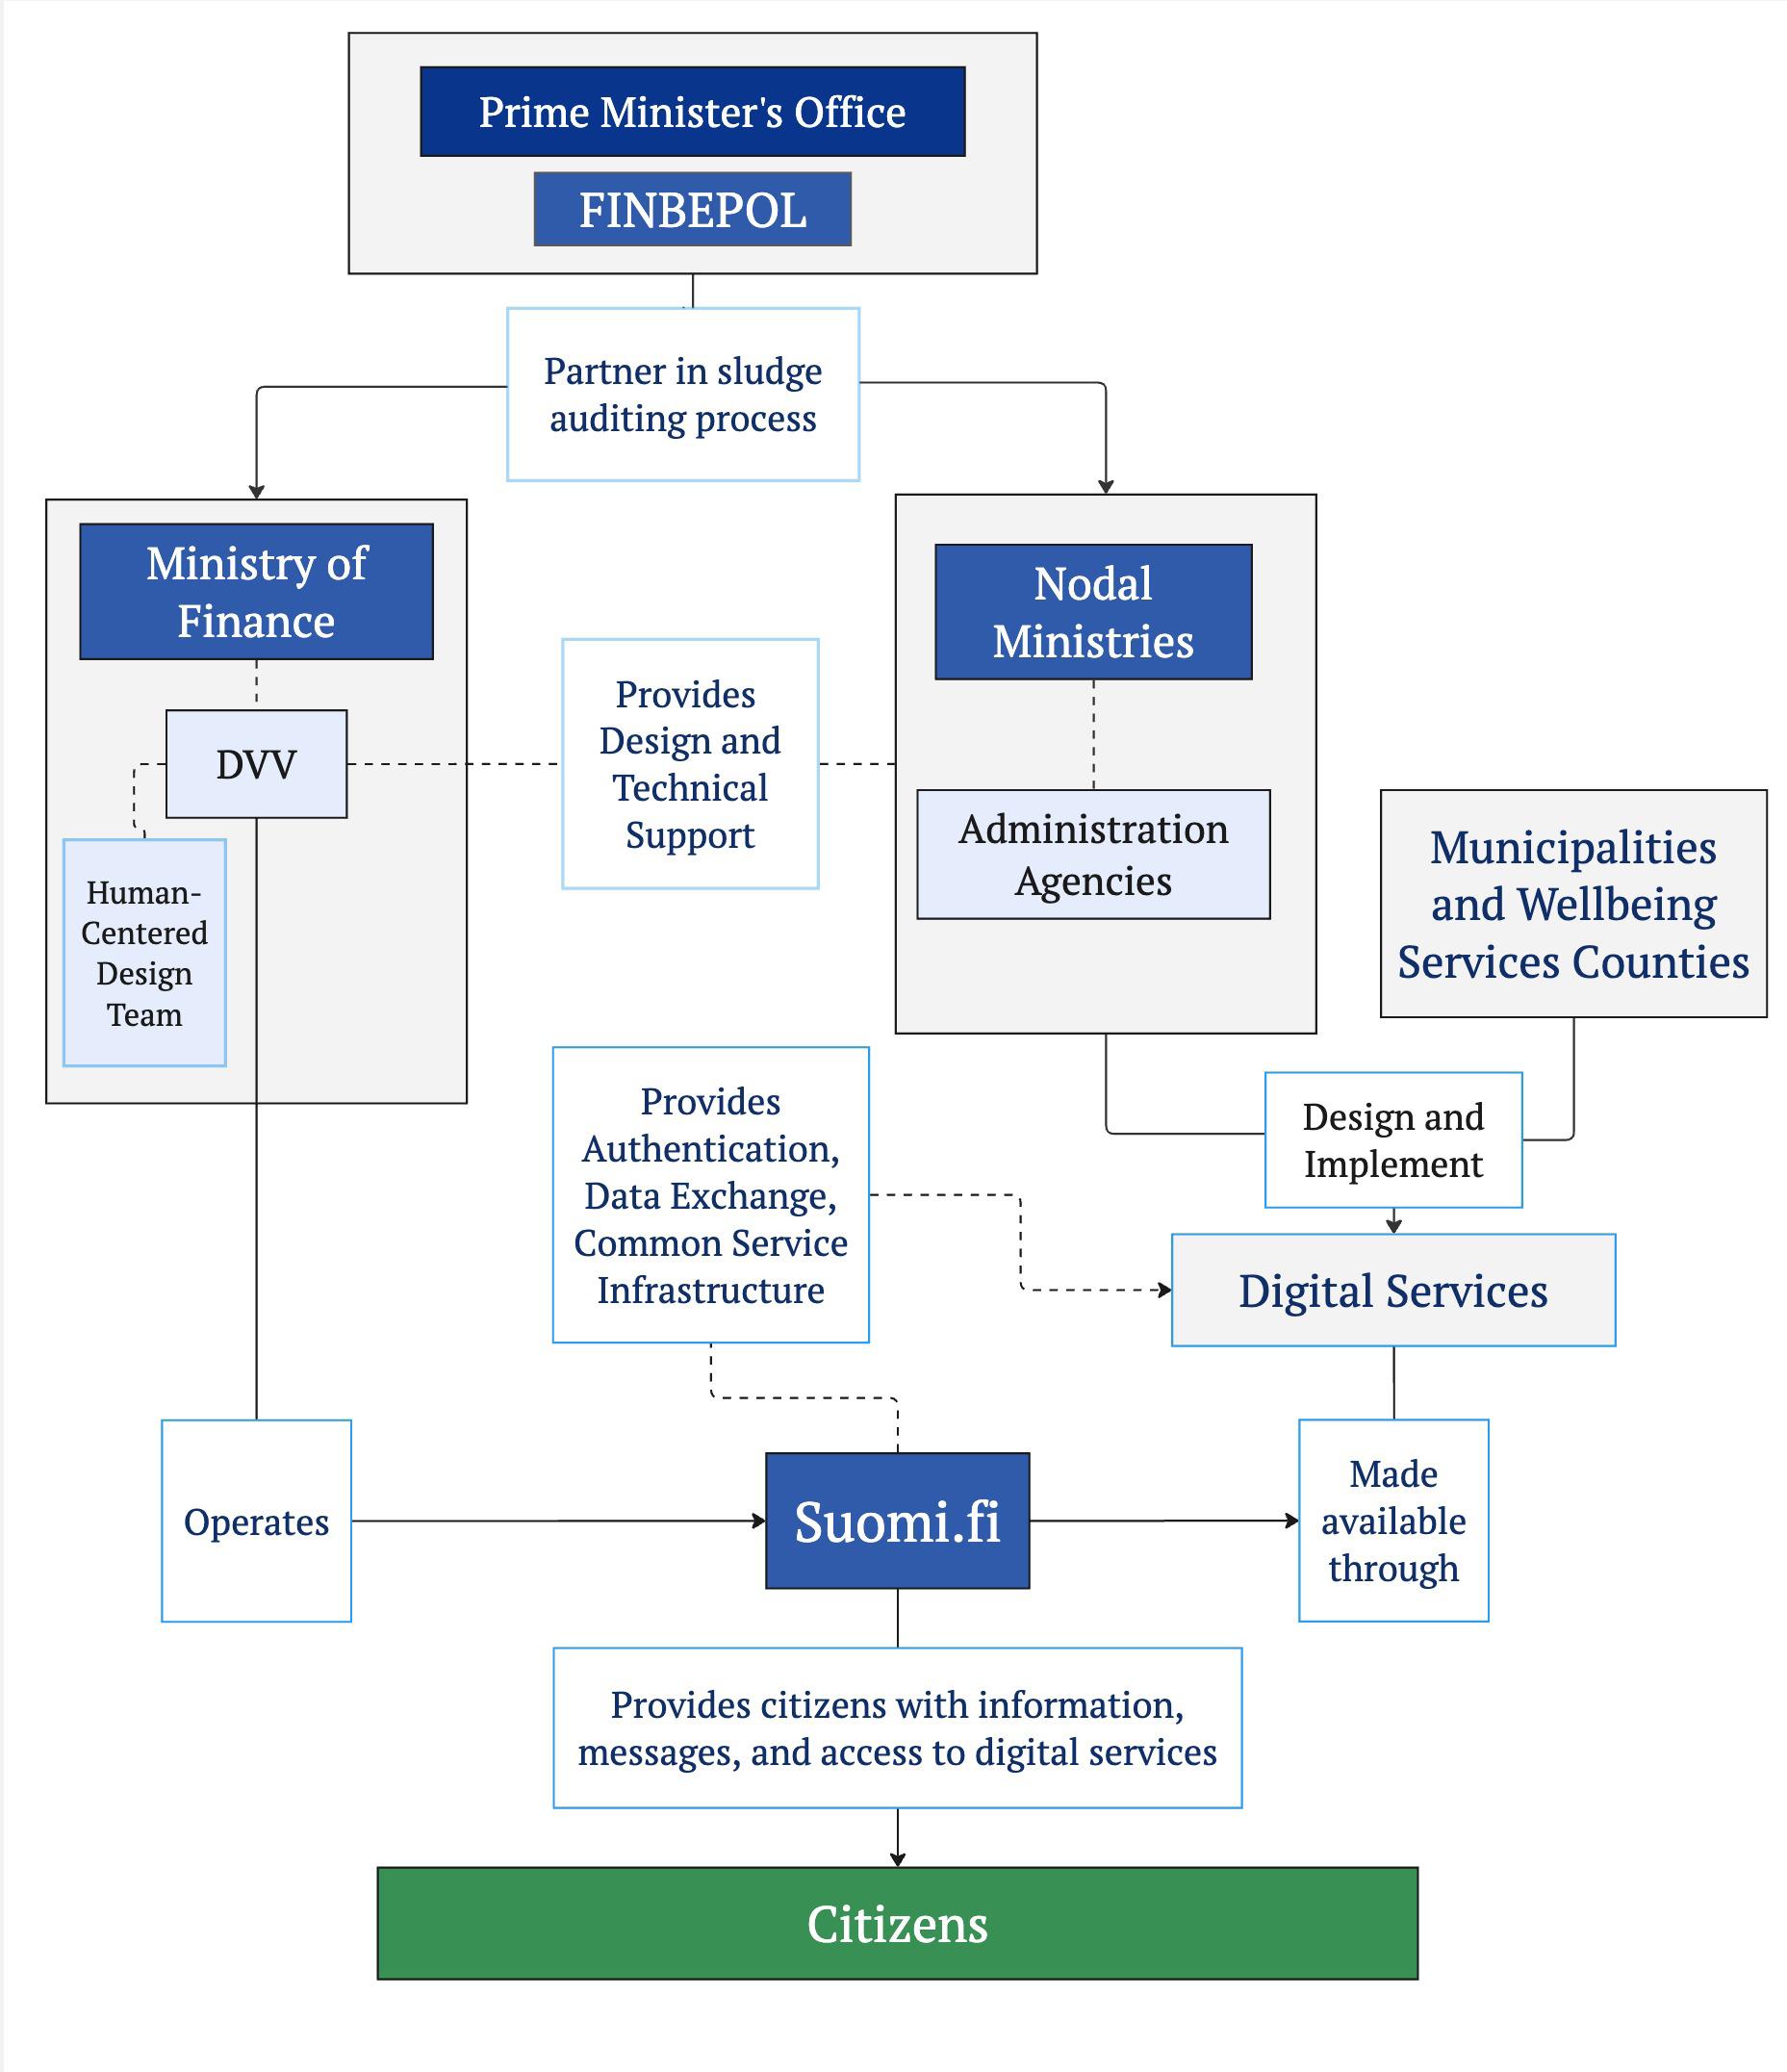
Together, these stakeholders form a dynamic and interconnected ecosystem, coming together to deliver services (see figure 2). Each actor, from national policymakers to individual users, plays a vital role in advancing Finland’s mission to create digital services that are efficient, inclusive, and responsive to the needs of its people. Services created at the national level by different ministries are coordinated by DVV to limit overlap and encourage knowledge sharing. However there does not seem to be a similar system of digital service coordination between services created at the national and municipal levels. There are many services available to users at any given time, both those available at a national level and those created by their local government for those living within their municipality. Some of these services may be duplicative, while others may fill unique local needs. It is worth noting that the services a person has access to will change as they move to a new location in Finland and as they move through different stages of their life.
Suomi.fi’s role in Finland’s service delivery architecture involves coordination across these stakeholders. Figure 2 is a broad schematic outlining the way in which some relevant stakeholders interact to deliver digital services through Suomi.fi.
Stakeholder Engagement Strategies
Engaging stakeholders effectively is critical for reducing sludge and administrative burden in Finland’s digital service delivery. A range of engagement strategies ensures that stakeholders are not only informed but also active participants in the process. However, a recurring challenge lies in addressing the concerns of municipalities, many of which feel left out of the creation process and seek greater inclusion in decision-making and design efforts, according to our conversation with representatives from the association for municipalities.
Figure 1b: Map of digital services (selected examples)
Figure 2: Schematic of service delivery through Suomi
• Communication and Consultation: Open and transparent communication is the cornerstone of stakeholder engagement. Yet, municipalities have expressed frustration with the top-down nature of current digital service initiatives, where decisions and designs are often finalized before meaningful consultation occurs. This leads to a lack of interest in municipalities to integrate centrally controlled systems, especially if they already have built their own versions of the digital service. To address this, tailored communication channels, such as dedicated municipal workshops or feedback sessions, can ensure that municipalities' voices are heard. By creating opportunities for two-way dialogue, national agencies can better understand local challenges and incorporate municipal perspectives into the design process.
• Co-Creation and Collaboration: It is important that municipalities play a more active role in co-creating digital solutions. They reported being sidelined during the design phase, despite being the primary implementers of digital services at the local level. Co-creation strategies can address this by bringing municipalities into the process early, allowing them to contribute their on-the-ground expertise. Collaborative platforms that include representatives from large and small municipalities, along with national agencies and private sector partners, can help bridge the gap. This approach ensures that solutions are not only aligned with national standards but also practical and tailored to diverse local needs.
• Change Management: Resistance to new digital systems is often exacerbated when municipalities feel excluded from decision-making. A change management approach that includes municipalities from the outset could help mitigate this. This might include co-developing phased implementation plans with municipal representatives, providing clear timelines, and offering incentives for early adopters. Engaging municipalities as equal partners in the transition process can build trust and foster a sense of shared ownership, increasing the likelihood of successful implementation.
• Cost-Benefit Calculations: Efficiency gains from transitioning to a centralized system for digital service delivery can be transformative for municipalities. Centralized systems reduce redundancies, streamline processes, and cut costs by leveraging shared infrastructure and resources. This approach improves the user experience by providing consistent, accessible, and user-friendly digital services across municipalities, saving residents and businesses time and effort when they move between systems. Centralized systems may also allow municipalities to share expertise, enhance cybersecurity, and accelerate innovation, leading to higherquality public services. Communicating these benefits clearly is essential to build support among stakeholders. Demonstrating how centralized systems can save taxpayer money, simplify government interactions, and drive better outcomes for both end users and administrators of platforms.
Reducing sludge and administrative burden in Finland’s digital service delivery requires active and inclusive stakeholder engagement. While national agencies, such as DVV, have provided strong leadership, municipalities have often felt excluded from key decision-making processes. This fragmentation risks undermining the effectiveness of sludge-reduction efforts, as municipalities are critical implementers and closest to the citizens who rely on these services. The result is redundant digital services that make it harder for sludge reduction to have a widespread effect and harder to realize the monetary benefits of shared centrally controlled systems. For example, the central government created and advocates for the uptake of a central messaging platform through which citizens will receive messages from government agencies, much many municipalities have already created messaging platforms for communication at the local level. To address this challenge, Finland should prioritize more inclusive engagement strategies. This includes involving municipalities earlier in the design process through co-creation initiatives with DVV or ministries creating digital services to ensure that their perspectives are reflected in digital products.
D. Suomi.fi: Current State and Priorities
Suomi.fi's central role in service delivery and its relevance to Finland's digital strategy creates a valuable role for sludge reduction efforts.
Suomi.fi serves several roles as part of Finland’s digital services landscape.46 In each of these areas there is the potential for sludge to create friction that reduces the effectiveness of Suomi.fi. The various roles of Suomi.fi and potential sludge are identified below.
Service Description
E-Authorization
The Suomi.fi website allows users to authorize another party to act on their, their companies, or their organizations’ behalf on various official matters (e.g., the collection of prescriptions).
Potential Sludge
Complex forms or instructions can increase cognitive burdens; verification delays can increase wait times; and lack of clarity about the boundaries of e-authorization can increase errors.
Data
Identification
to access government services
Users can check what information is recorded on them in different registers of authorities. They are also able to correct incorrect personal data.
A shared identification service that allows users to securely access multiple e-services across different authorities with a single login.
Complicated processes to correct or update data can deter users; difficult navigation to find user data can increase wait times.
Requiring excessive re-authentication can increase wait times; difficult authentication methods (e.g., digital tokens or mobile apps) can be difficult for less-digitally literate users.
Electronic Messaging
Information on Service
Provision
Users can opt-in to receiving electronic messages from authorities which can speed up communication processes and replace the need for paper mail. These messages can include notifications about benefits, tax information or other government services.
Suomi.fi consolidates and provides information about services from government agencies and municipalities. It forms a service catalogue for users and provides instructions for accessing services in each Finnish locality. Information on Suomi.fi also includes guides to navigate life events and administrative processes.
Quality Tools
Suomi.fi provides diagnostic tools that enable organizations to collect and collate user feedback, which can then be used to evaluate, monitor, and compare the quality of digital services within and between organizations and on a national level.
Notification overload can increase cognitive burdens and result in users not heeding notifications; difficulties in opting-in or accessing messages (e.g., through burdensome log-in processes) can reduce user accessibility.
Difficulties navigating large service catalogues can disincentivize users from using the service; too much information on websites can also overwhelm users and increase cognitive burdens.
Complexities in collating and accessing user feedback can reduce the effectiveness of tools for organizations.
E. Desludging Suomi.fi: Enablers and Challenges
Institutionalizing sludge auditing in key implementing agencies like DVV leverages Finland’s prior successes and creates a pathway to address challenges.
Suomi.fi’s role in service delivery as a central hub or gateway for citizens to access information and services provided by different agencies makes Suomi.fi a critical vector at which behavioral efforts can be targeted. This section: first, reviews the structure of service delivery through Suomi.fi to identify institutions which can implement these efforts; second, reviews enablers and challenges to the adoption of sludge auditing in the context of Suomi.fi; and third, analyzes why behavioral efforts targeted at Suomi.fi have a strong likelihood to be institutionalized and advance broader change in service design.
Structure of Service Delivery through Suomi.fi
As outlined previously in Figure 2, Suomi.fi performs two functions: (1) it is a unified gateway for Finnish citizens to access information, messaging, and a broad range of digital services; (2) it is a common digital infrastructure, enabling the integration and delivery of services created by different agencies and providing key backend services.
The backbone of Suomi.fi’s operations lies within the Ministry of Finance, which oversees the DVV. The DVV directly operates Suomi.fi and plays a central role in ensuring its functionality as a digital platform. The DVV –through its Human Centered Design Team – also provides design and technical support to nodal ministries and their respective administration agencies on a range of projects, fostering a deep understanding of constraints faced by nodal ministries within the DVV.61 The creators of digital services include nodal ministries, Kela, municipal governments and wellbeing services counties. These entities are responsible for creating the actual digital services that, once developed, are integrated into Suomi.fi.62 Suomi.fi acts as a public-facing platform allowing citizens to find and access the service. Suomi.fi also provides the essential backend infrastructure for the service, such as authentication systems, data exchange layers and other common services – ensuring that agencies do not have to develop the common services separately. This allows a diverse range of services to be offered through a unified interface; citizens, in turn, use Suomi.fi to find specific services and use features like e-authorization and e-authentication to access services offered by other service providers.
An interesting aspect of this architecture is the possibility for a dual role of the DVV. On one hand, it operates Suomi.fi and is responsible for making changes to the platform. Simultaneously, DVV, through collaboration with other ministries and provision of design support, has the institutional capacity and experience of influencing the design and implementation of digital services. This positioning allows DVV to impact both the design of the service and the gateway. This dual role suggests that DVV would be well-positioned to oversee the lifecycle of digital services, from designing with nodal ministries to delivery through Suomi.fi. Particularly, the Human Centered Design team within the DVV represents existing capacity which can be leveraged for this end. The team’s mission to incorporate the user experience in the design of services aligns with this role, and it benefits from stable and longstanding staff, as communicated during interviews, with experience working across ministries, providing an understanding of varied institutional contexts. The team’s experience and expertise in tasks involving evaluating service design to ensure usability, streamlining user experience, gathering user feedback, and integrating these insights in the service design process is directly relevant to sludge reduction efforts.
Enablers and Challenges
Some of the enablers and challenges to the implementation of sludge audits are mapped in the below table and described in this sub-section:
Category Enablers
• Culture of experimentation
Governance
• Designated institutional capacity for human-centered design.
• Focus on life-event based data sharing.
• Mature digital service ecosystem
• Alignment with EU-initiatives
Technological
Economic
Social
Enablers:
• Incentives for cost reduction
• Favorable demographics reduce cost to scale interventions.
• High digital literacy and internet access
• Fewer linguistic and access barriers
Culture of Experimentation
Challenges
• Federal structure and municipal autonomy
• Reliance on legacy systems and paperbased processes
• Variance in municipal resources
• Commitment to omnichannel service delivery (maintaining access through all channels - physical and digital)
• Variance in municipal resources
• Limited funding for legacy system upgrades
• Reliance on legacy and paper-based processes
Finland’s public sector is distinguished by its willingness to experiment – reflected in the programs of institutional support for experimentation such as the ‘Experimental Finland’ initiative introduced in 2015.63 This culture of innovation – which is open to conducting pilot projects and experiments to inform policy – fosters an administrative environment conducive to testing and refining digital services like Suomi.fi. By embracing and institutionalizing trial and error, the Finnish context offers a public sector that responds well to approaches that require iterative improvements. Suomi.fi – as a key digital platform – benefits from this mindset, allowing it to develop a feedback-driven approach to service delivery. This foundation supports the adoption of sludge audits, by making them part of an established system of refinement and adaptation.
Designated institutional capacity for human-centered design.
Finnish government agencies, such as the DVV, have demonstrated a continuous focus on human-centered design and creating user-focused public services. For instance, the DVV has a dedicated team focused on human-centered design that has now assisted several different ministries and agencies in the design of digital services. As noted in our interviews, the stability of personnel in this team has led to the development of institutional memory and enabled a high degree of capacity that can be leveraged across the government.64 The adoption of human-centered design lends naturally to the integration of behavioral insights. The existence of prior capacity as well as experience of government ministries with these design processes in the Finnish government is, consequently, an important element that can be leveraged to build greater acceptability for behavioral methods.
Favorable Demographics: Small Population, Few Languages, High Internet Access
Finland’s demographic profile – comprising a small, primarily Finnish-speaking population with a high-rate
of internet access – creates an ideal setting for scaling and implementing digital solutions like Suomi.fi. The demographic stability reduces complexity in service localization, while high internet connectivity and digital literacy ensures that digital services can be accessed by the majority of citizens. The relatively straightforward linguistic landscape also minimizes barriers to usage. With fewer linguistic and access barriers, Suomi.fi can apply standardized behavioral interventions without needing extensive customization, allowing for easier rollout, and scaling of sludge reduction strategies across the platform.
Mature Digital Service Ecosystem
Finland’s high state capacity in digital service delivery and AI provides a robust foundation and support for the implementation of sludge audits on Suomi.fi. The development of an interoperable data exchange layer and the existence of foundational digital architecture ensures that behavioral approaches can be concentrated and targeted at one platform. The technological foundation of the Finnish public sector simplifies the process of institutionalizing behavioral science methods by ensuring that these interventions can be implemented and refined at scale easily.
Focus on life-event based data sharing
The Finnish government’s emphasis on life-event based data sharing is a crucial enabler for sludge audits on Suomi.fi, as it allows for a clustering of interventions around key moments in citizen’s lives. By organizing services around life events – such as births, deaths, retirements – Suomi.fi provides a highly context-specific choice architecture within which citizens' choices can be understood from a behavioral lens.
Alignment with EU-wide digital initiatives
Finland’s alignment with EU digital initiatives, such as interoperable digital wallets and identification systems, gives a sustainable character to the objectives of the Digital Compass. EU-wide developments on these issues will sustain their relevance in Finland.
Fiscal incentives for cost reduction
Fiscal constraints in Finland create strong incentives to streamline public services, aligning with the goals of sludge reduction on Suomi.fi. Budgetary limitations encourage the government to seek cost-effective ways of reducing frictions in service delivery, such as the use of behavioral insights to eliminate unnecessary administrative burdens. Fiscal motivations support sludge reduction efforts and provide a clear outcome against which behavioral approaches can be measured to demonstrate their value. Sludge audits can position themselves as a cost-effective way of designing efficient public services, which can help build broader support for such approaches.
Challenges
Federal structure and Municipal Autonomy
Finland’s decentralized federal structure, which grants substantial autonomy to municipalities over delivery of services, presents a challenge for implementing sludge audits consistently on Suomi.fi. With municipalities often managing their own services, and there being constitutional limits to the issues that can be enforced by the central government through legislation, there are some limitations on the implementation of behavioral interventions at the municipal level. This autonomy can lead to inconsistencies across the platform, not just in terms of service design, but also in the implementation of sludge audits. In the long-term, sludge auditing may have to be institutionalized not just at the central government level, but also at the level of municipalities, where different municipalities may lack the resources or inclination to adopt these methods.
Reliance on Legacy Systems and Paper-Based Processes
Despite high levels of digitalization, Finland continues to have legacy systems and processes which are incompatible with a centralized platform. The simultaneous and parallel existence of traditional methods of service delivery – such as through physical locations or service kiosks – which the government intends to retain also complicates efforts to streamline service delivery. As a result, sludge auditing on Suomi.fi and innovations on the Suomi.fi platform will be limited in their ability to influence overall service delivery in Finland more broadly, which will require parallel interventions in other channels and legacy processes of service delivery and legacy systems.
Limited Funding for Legacy System Upgrades
The prior existence of legacy systems for service delivery creates challenges both for integration of digital services, as well as for the maintenance and upgrade costs of the service infrastructure. A multitude of legacy systems can be integrated into a unified system – which is the motivation behind Suomi.fi being a gateway for all services –however, this is a costly and time-intensive process. Upgrading legacy systems requires significant investments and technical staff for the implementation and maintenance of the upgrades.
Commitment to omnichannel service delivery
Due to citizen’s reliance, and in some cases, preference for traditional methods of service delivery, the Finnish government maintains a broad commitment to omnichannel service delivery, ensuring that alternatives to digital systems are in place for disadvantaged populations like the elderly. This can secure the supply of services if digital infrastructures are not available or functioning. The commitment to a hybrid method of service delivery places greater constraints on service design to ensure that it can be delivered across both physical and conventional channels, and also to ensure that these channels are not silos but are well-integrated in the overall architecture of service design.
Variance across Municipalities
Resource disparities and differing priorities across Finnish municipalities create variability in service delivery, challenging the implementation of sludge audits on Suomi.fi. Variability means that sludge reduction strategies that work in one municipality may not be feasible or effective in another, complicating efforts to provide consistent user experiences. For Suomi.fi, this lack of uniformity can lead to fragmented service quality, as behavioral interventions may be applied inconsistently.
Institutionalization of Sludge Auditing through Suomi.fi
Given its role as a comprehensive digital gateway, Suomi.fi serves as a natural home for innovation in service delivery. This positions it as a prime candidate for institutionalizing practices like sludge auditing. By centralizing access to public services, Suomi.fi effectively becomes the Finnish public’s primary interface with a range of government functions, creating an ideal setting for embedding behavioral insights. If sludge audits and other behavioral approaches are successfully implemented on Suomi.fi, they stand a high chance of becoming sustainable and recurring processes attached to the ongoing iteration of Suomi.fi, and consequently, this makes behavioral approaches likely to be integrated into the processes of service design across government ministries.
The Finnish Digital Compass also reinforces Suomi.fi’s strategic importance as a locus of innovation.65 With explicit goals to digitize public services, shift to digital-first communication, and create interoperable digital systems, the Digital Compass signals a strong commitment to deepening Suomi.fi’s functionality, capabilities, and reach. Each of these goals aligns with the potential outcomes of effective sludge reduction, suggesting a high
degree of compatibility between the ambitions of the Digital Compass and the practical benefits of improving user experience on Suomi.fi. Due to this compatibility, the implementation of behavioral interventions on Suomi.fi is likely to be sustained and expanded in the natural course of making progress on the Digital Compass; ultimately, offering a pathway for embedding a behavioral science orientation within Finland’s service delivery model on a broader scale.
The DVV – as previously discussed – plays a key, dual role in digital service design and delivery in Finland. It is also a key stakeholder in relation to Suomi.fi. Arguably, the adoption of sludge auditing efforts by the DVV – with technical support from FINBEPOL – would align with the enablers in the Finland context: it would focus on an already established digital service with high take-up, be located in an organization with prior experience and institutional capacity for human-centered design and align with a focus on EU-wide digital initiatives and lifeevent based services. The institutionalization of this process in a repeatable framework also provides a pathway to address challenges: most of the identified challenges stem from divergence in approaches to service design or resource gaps between administrative units. The creation of a repeatable process organized by FINBEPOL and the DVV, which frequently collaborates with other ministries and municipalities, can lead to an iterative harmonization of approaches and sharing of knowledge across administrative units – which can engender a broader shift to behaviorally informed design.
The institutionalization of a repeatable process requires a consideration of several elements: first, the creation of broad, general-purpose guidelines for conducting sludge audits can serve as a foundation for harmonizing efforts across administrative units, ensuring that all stakeholders operate within a shared, defined framework while allowing for localized adaptation; second, consistency in staffing is important as stable and experienced personnel provide institutional memory and ensure the continuity of best practices; third, the creation of standardized tools such as templates, methodologies, evaluation frameworks, diagnostic surveys can streamline processes and reduce variability in practice; fourth, iterative feedback mechanisms are essential to refine the framework over time based on practical insights and learned experience; and fifth, a forum for inter-agency collaboration can facilitate knowledge transfer and build collective expertise. Together, these elements can ensure that any administrative unit undertaking a sludge audit is not starting from scratch, but instead, can rely on already developed expertise, tools, and frameworks to accelerate its efforts – leading to consistency and repeatability in sludge audit processes.
III. Towards Sludge Audits
Overview of the Sludge Audit Method
The sludge audit method being conducted jointly by the OECD and FINBEPOL to improve digital public service delivery in Finland is based on the New South Wales (NSW) Government’s Sludge Audit Method.66 This method was the basis for the OECD’s International Sludge Academy where the Finnish Government piloted its first audit. The NSW method uses multiple metrics to measure sludge including time, cost, ease/experience and inclusion. There are seven key steps in this method:
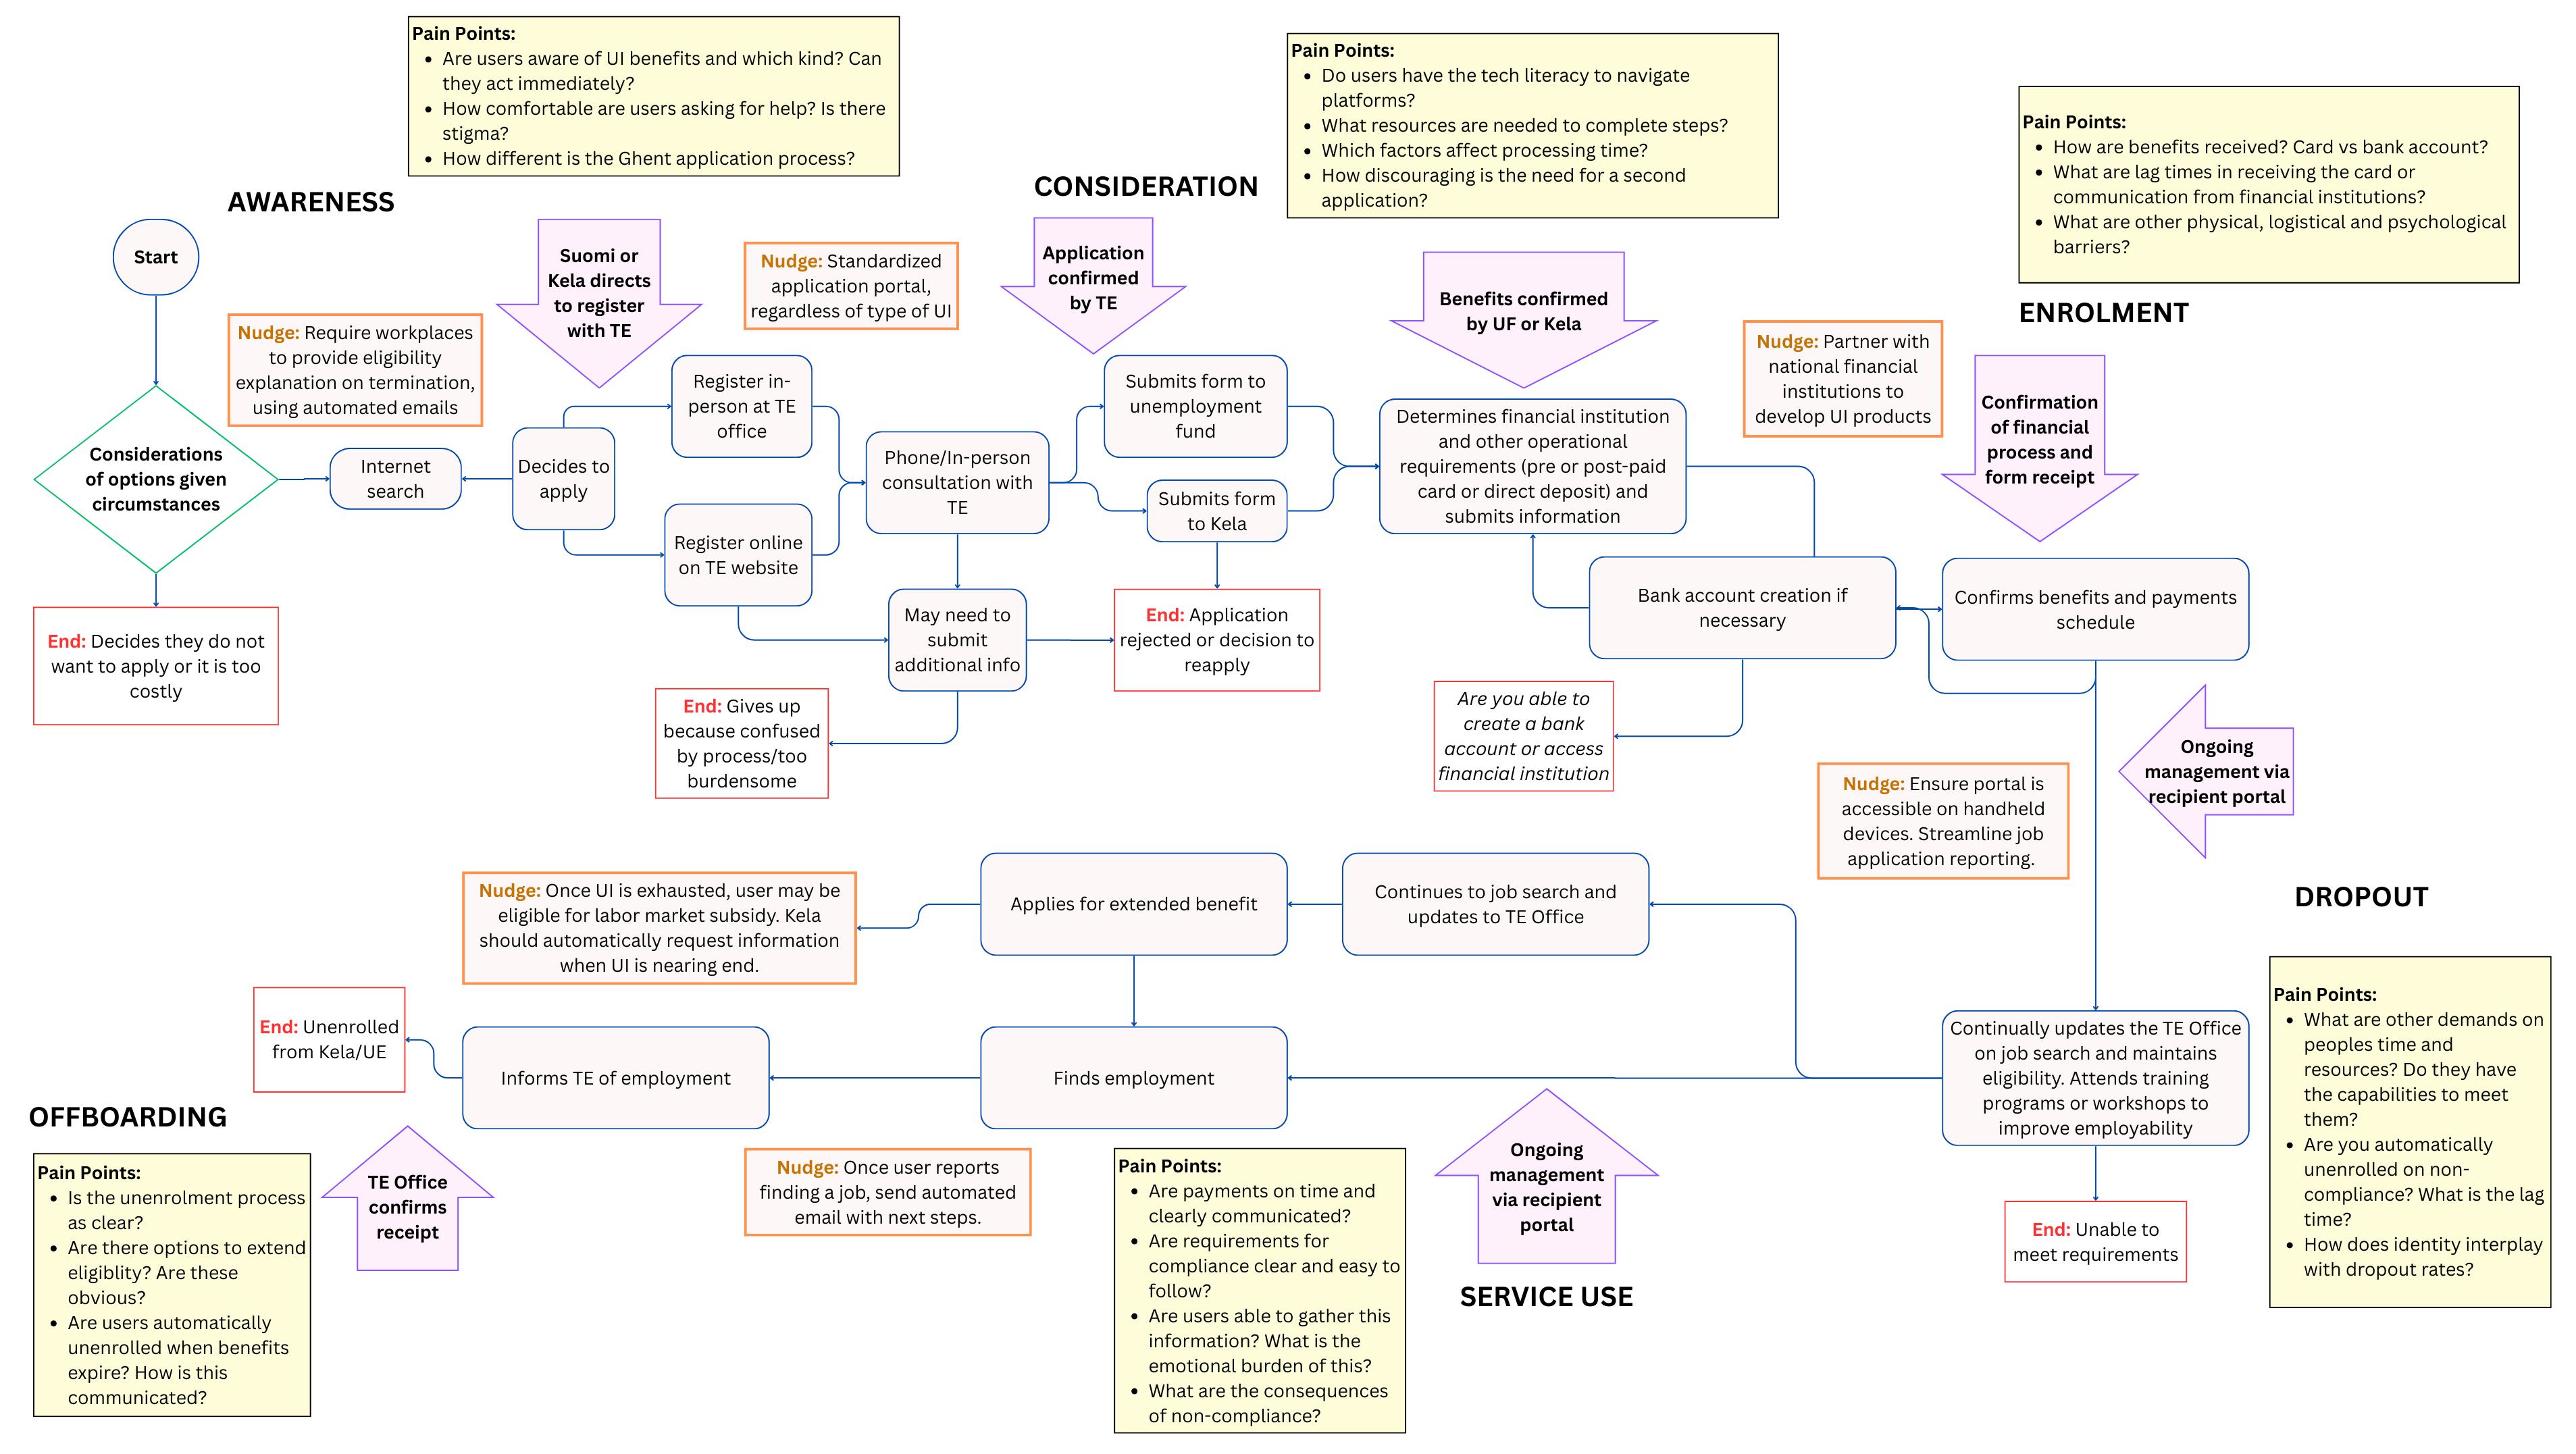
1. Behavioral journey map
2. Collect inputs
3. Estimate time and cost
4. Assess ease and experience
5. Access and equity checks
6. Analyze results
7. Design solutions
As a first step, the behavioral journey map provides an overview of a process by including each small behavior in a step, including behaviors that might not be visible touch points. It is important to map the journeys of different users, as different groups might experience sludge differently. The journey map serves as a data collection guide that informs which inputs are needed to answer key questions for each step on the map, such as how long the step takes, how many customers do it, and what it looks like. The next step is to estimate the time and cost it takes customers and staff to perform a behavior. Next, additional information is used to assess ease and experience, since time alone may not fully capture the ease and qualitative experience of a task. To do this, the method uses ‘Sludge Scales’ which are assessment criteria that define what “good” should look like for a given government interaction based on behavioral science and customer experience best practice.67 Access and equity checks assess areas such as process transparency and customer support and engagement. Results are analyzed by identifying behaviors with poor results and identifying which behaviors can and cannot be changed. The last step is to design solutions to remove the sludge that has been identified. After completing these seven steps, the last step is to conduct a followup audit to measure impact.
The remainder of this section provides suggestions for adapting and implementing this sludge audit method in the Finnish context, as well as initial findings from a behavioral journey map exercise.
National Service Delivery Priorities: Centering Services Around Life Events
In 2024, the OECD passed the Recommendation of the Council on Human-Centered Public Administrative Services. In an effort to create “seamless and accessible services,” the OECD recommends that countries prioritize “design and delivery of services on interaction points which are frequent and complex,” such as life events, business events, and critical experiences.68
By centering service delivery around major life events, governments can ensure easy to use service design and information access when citizens need it most. Often, major life events such as marriage, having a baby, or enrolling a child in school require interaction with stakeholders at multiple levels of government, which can be complex for those who do not typically interact with government. In addition, major life events, such as death of a close family member or unemployment, can be very psychologically taxing so it is important that governments are proactive and focusing on user experience when designing access to these services. Especially for psychologically taxing life events, reducing redundant steps and duplicate paperwork can significantly improve a user’s experience when accessing these necessary services.
Why we chose these services
Below we provide suggestions for applying behavioral insights to three service areas: unemployment insurance, pensions, and death of a family member. We selected these services as potential candidates for conducting a sludge audit based on their importance in terms of Finnish national policy priorities as well as our initial understanding of the presence of sludge in these services due to the involvement of multiple digital platforms.
In terms of Finnish national policy priorities, pensions and death certificates are prominent policy areas given the demographics of Finland. Since the country has an aging population, more people are expected to use both of these services. During our meetings with various stakeholders in Helsinki, several people from different parts of the government brought up the processes that surround death of a loved one as an example of services they are working on making easier and thus was highlighted as a key focus area By simplifying and streamlining pension services and end of life processes, Finland can better support retirees and other pension recipients, enhancing their quality of life, as well as people who lose loved ones.
In terms of potential for sludge audits, all three of these services involve some additional digital platform in addition to Suomi.fi, meaning there is potential to reduce sludge stemming from duplicate information or duplicate processes across platforms. A sludge audit is valuable in identifying friction points in service access, as Suomi.fi interacts with other key platforms, like Kela, that users rely on for comprehensive support. This audit could provide insights into user cognitive processes, helping optimize interfaces and information flows between Suomi.fi and Kela to reduce cognitive burdens on end-users.
The importance of journey maps and cognitive walkthroughs
To shed light on system processes, before embarking on a sludge audit it can be helpful to create a cognitive walkthrough of the user and administrative experience, using a journey map to represent that process. As the goal of the sludge audit is to reduce friction for the user, understanding how the user experiences the service is essential. A cognitive walkthrough informs the journey map creation when the auditor puts themselves in the shoes of a user and can help identify hidden behaviors that may not initially come to mind, time constraints, and psychological burdens that a user might experience while trying to access a service.69
By creating a journey map at the beginning of the sludge audit process, auditors also have a framework that can be used to gather data, an understanding of important stakeholders, and a validation mechanism for any data that is gathered throughout the process. Additional information can be gathered by asking someone new to do the walkthrough or trying it from a different perspective. For example, someone who is pregnant for the first time and living in a rural area is going to have a very different journey than someone who is pregnant for the third time in a city. For that reason, several journey maps may need to be created in order to fully understand the user experience of a particular service.70
I. Understanding Unemployment Insurance in Finland
A. Background on Unemployment Insurance in Finland
Like many countries around the world with a robust welfare system, Finland's unemployment insurance (UI) system is designed to provide financial support to individuals who are unemployed and actively seeking work. It consists of three main types of unemployment benefits:
• Basic unemployment allowance
• Earnings-related unemployment allowance
• Mean-tested labor market subsidy.
The differences between these benefits are analyzed below:
Basic Unemployment Insurance
Administered by Kela, the Finnish Social Insurance Institution, this benefit is available to individuals who do not qualify for the earnings-related allowance but meet work history and job-seeking requirements. It provides a flatrate payment and is intended as a safety net for those without unemployment insurance fund coverage.71
To be eligible for unemployment benefits in Finland, recipients need to be between 18 and 64 years old, be registered as an unemployed jobseeker with the TE Office (Employment and Economic Development Office), seeking full-time work, be able to work and prepared to accept a job, and meet specific work history requirements (for earnings-related and basic allowances). For both earnings-related and basic unemployment allowances, you need to have worked for at least 12 months in the 28 months before becoming unemployed, up from 26 weeks in September of 2024. Unemployment allowances are typically paid for up to 300-500 days, depending on your work history and age, but the basic allowance lasts for 400.72 Benefits can be adjusted for part-time or occasional work during unemployment.
Earnings-related unemployment allowance
This benefit is available to individuals who have been members of an unemployment fund and have worked for a sufficient period (usually 26 weeks in the previous 28 months). The amount of the allowance is based on the individual's prior salary and is higher than the basic allowance. It is funded through contributions from employers, employees, and the government.73
Finland operates under the "Ghent system" for unemployment insurance, where workers can voluntarily join unemployment funds, often managed by trade unions. The Ghent system represents a unique approach to unemployment insurance that blends union involvement with state support, though it has faced challenges and modifications in recent years.74
Unemployment insurance funds are typically managed by trade unions or union-affiliated organizations, so not all occupations qualify. While union members pay dues, most of the funding (often over 90%) comes from government subsidies.
Labor Market Subsidy
This type of UI is intended for individuals who do not qualify for allowances or basic UI, either because they are new to the workforce, are unemployed and their unemployment allowance period has ended, or have not met the previous employment requirement for other unemployment benefits. To receive benefits, individuals must be registered with the TE Office and fulfill job-seeking and reporting obligations. The labor market subsidy is also administered by Kela.
Unemployment and UI Uptake
As of September 2024, Finland's unemployment rate was 8.6% for people aged 15–74. A total of 300,596 persons, 9.1% of the population received unemployment benefits at year-end 2022. The percentage of recipients in the population varied by municipality between 3.0 and 17.4. The highest rates of benefit receipt were seen in Eastern Finland.75 Unemployment is higher for the aged 15-24 (16.1%).76 Finland’s unemployment tends to be slightly below the EU average.
Approximately 36% of UI recipients are enrolled in earnings-related allowances. Basic unemployment and labor market subsidies account for the other 64%.77 These figures fluctuate over time due to economic conditions and policy changes. Recent changes in April 2024 have reduced the labor market subsidy, hitting women particularly hard.78
Finland has a long history of valuing social benefits, including unemployment insurance, dating back to the late 19th century. Still, like many other countries, there is concern over system abuse and that generous employment benefits might discourage people from seeking employment. There's recognition of "incentive traps" where lowincome jobs may pay only slightly more than unemployment benefits, potentially discouraging people from taking certain jobs.79
There is also growing awareness of the challenges faced by precarious workers and recognition that, as working life has become more fragmented in today’s economy, unemployment periods will be longer and more common. The increase of fixed-term employment and gig jobs also has an impact on the number of unemployment periods. TE office publications also note that unemployment can be an opportunity to change direction and find something new and interesting, indicating an interest in using UI to invest in Finnish citizens for more rewarding and lucrative work long-term.80
Comparison of User Experience under UBI in Finland
From 2017 to 2018, Finland conducted a Universal Basic Income (UBI) experiment to explore its impact on work and trust in government. The study found UBI improved financial security, mental health, life satisfaction, and trust in institutions, with benefits for families with children, rural residents, and non-native Finnish speakers.81 Unlike standard unemployment benefits, UBI reduced bureaucratic stress, simplified processes, and offered greater autonomy. While selective benefits like unemployment insurance did not significantly undermine trust, their complexity increased administrative burdens, created inconsistent user experiences, and introduced informational challenges. UBI’s unconditional nature proved effective in enhancing well-being and reducing strain, though tradeoffs remain between simplicity and system heterogeneity.
B. Administrative Architecture and Primary Stakeholders
As outlined above, different offices govern different types of unemployment insurance in Finland and work
together to communicate benefits, field applications, determine status, and distribute benefits to recipients. This system represents a collaborative approach between government agencies, semi-public institutions, and private organizations (unemployment funds) to administer unemployment benefits in Finland. The TE Office acts as the initial gatekeeper, while Kela and unemployment funds serve as the benefit providers, with oversight from relevant ministries. Recent TE services reforms, operational from 2025, have transferred the responsibility of organizing TE services to municipalities and establishing 45 employment areas in Finland, to strengthen the responsibility of municipalities in employment.82
While this kind of separation allows the specialization of each office, it also introduces sludge in the form of information and data sharing, multiple application stages and customer experience touchpoints, and increased time and cognitive burden for end-users. If users must go through the TE office to register before their application is handed off to the appropriate insurance type, there is more opportunity for administrative delays or hurdles and more paperwork that could be completed incorrectly. Once the insurance is allotted through Kela or an unemployment fund, payment is likely administered via direct deposit, which requires engagement with financial institutions to receive payments. Below are various offices involved in the process and their roles:
TE Office:
• Serves as the initial point of contact for unemployed individuals.
• Registers job seekers and assesses their eligibility for unemployment benefits.
• Issues labor policy statements regarding the job seeker's right to unemployment benefits.
• Submits these statements directly to the paying party (unemployment fund or Kela).
Unemployment Funds:
• Typically managed by trade unions or union-affiliated organizations.
• Handle earnings-related unemployment allowances for their members.
• Receive labor policy statements from TE Offices.
• Make payment decisions and transfer benefits to recipients.
• Process appeals for their decisions.
Kela:
• Manages basic unemployment allowance and labor market subsidy.
• Receives labor policy statements from TE Offices.
• Makes payment decisions and transfers benefits to recipients.
• Processes appeals for their decisions.
Ministry of Economic Affairs and Employment:
• Responsible for management, steering, and development of labor-policy aspects of unemployment security.
Ministry of Social Affairs and Health:
• Responsible for management, steering, and development of matters concerning labor market subsidy.
Suomi.fi:
• Serves as an information and authentication portal for citizens.
• Provides guides and instructions on how to apply for unemployment benefits and other related services.
C. Cognitive Walk-through
Figure 3: Cognitive walkthrough of applying for unemployment benefits using Suomi
D. Pain Points, Behavioral Principles and Enablers
In any administrative process, there will be friction. The section below explores the most salient pain points prevalent in accessing basic unemployment insurance in Finland, considers the barriers created by such friction, the behavioral principles involved in the friction, and potential enablers that could enable individuals to overcome behavioral biases and access insurance.
i. Job Loss and the decision to apply:
What are the emotions associated with job loss? How precarious does this make an individual? Is there a lot of general awareness of benefits systems? How easy is this information to find and how easy is it to understand?
• Cognitive overload due to stress, potentially impairing action, and decision-making
• Complexity of the system with multiple benefit types (earnings-related, basic allowance, labor market subsidy) might lead to information overload.
• Shame or stigma could result in secrecy and reluctance to ask for help.
ii. Application Process:
How complicated are the digital platforms and forms applicants are navigating? How often are applications rejected because they are not correctly filled out or submitted?
• Providing personal information may feel invasive.
• Multiple stages of the application process require you to provide the same information multiple times, creating unnecessary burdens and presenting multiple opportunities for administrative errors.
• Digital literacy requirements for online applications and information parsing might mean that applications are unclear leading to mistakes and rejections.
• Access to necessary documents can vary and could introduce additional lag time.
iii. Award Process and Benefit Utilization:
How long are the wait times for appointments and processing? What is the economic burden faced by applications because of these lag times? Are reporting requirements clear?
• The waiting periods cause financial stress and could result in someone accepting an unstable or unideal job in the interim.
• Benefits deposits may require a bank account or other interface with a financial institution.
• Regular reporting requirements may feel burdensome.
iv. Job Search and Employment Services:
How burdensome are job search requirements? What are the social, emotional, and practical costs of long-term unemployment?
• Mandatory participation may not be equally accessible for all recipients.
• Reporting might place an additional burden on job seekers and delay employment.
• Amount and duration of benefits for basic unemployment may lead people to accept jobs that are more unstable and pay less.
• The requirement to accept full-time work offers without a reason for rejections might not suit someone’s needs.
Barriers
• Present bias: The immediate hassle of applying may outweigh the perceived future benefits for some individuals.83
• Cognitive load: The complexity of the system and ongoing requirements may overwhelm some users, particularly those under financial stress.84
• Heterogeneity of benefits: Multiple benefits streams and processes add confusion and increase the cognitive burden, with implications for equity and accessibility.85
Enablers
• Choice architecture: A system design that nudges people towards certain actions, such as registering as a jobseeker immediately to avoid delays in payment. With the TE office as the initial touchpoint for both Kela and Unemployment funds, it prevents users from pursuing the wrong type and thinking they do not qualify for benefits.86
• Default bias: Automatic enrollment in unemployment funds for some workers could reduce the effort required to access benefits.87
• Optionality: Option to apply online through OmaKela e-service or using paper forms could ease stress around digital literacy.88
• Social norms: High enrollment rates in unemployment funds (84%) could be used to encourage participation.89
• Trust in institutions: Finland's well-established social security system may increase willingness to engage with the process. Status and timeline updates can also increase trust from users.90
E. Takeaways
The Finnish UI system is complex, involving multiple benefit types, agencies, and user touchpoints. It is designed to balance support with accountability by requiring beneficiaries to demonstrate active job-seeking efforts. However, the system's complexity and lack of universalism leads to administrative "sludge" and burdens both applicants and administrators, potentially impacting accessibility, and perceptions of fairness. While Finland has a strong culture of trust in government, the intricate UI process may strain that trust, especially as applicants navigate redundant steps, information overload, and the bifurcation of public and private insurance.
We know that an evaluation of UBI and basic UI indicated greater levels of trust and reduced strain from the former. It remains to be seen how varying perceptions and trust of government impact UI engagement and outcomes across different demographic groups, as well as the impact of simplifying and universalizing UI.
II. Understanding Pension Services in Finland
A. Background on Pensions
The Finnish pension system provides social security to support individuals as they age, become unable to work, or in some cases, when a family member passes away. It covers three key areas:
• Retirement/Old Age Pension: Aimed at ensuring financial security for retirees, providing a steady income based on employment history.
• Disability Pension: Available to individuals who are unable to work due to health conditions, providing them with income to support basic living expenses.
• Family Pension: Provides financial support to family members after the death of a wage-earner, reducing the financial burden on dependents.
For the purposes of this section, we focus on retirement/old age pension, which falls into one of three categories:
• Earnings-Related Pension: Earnings-related pensions are accrued through paid employment or entrepreneurial activities. Employers are required to provide pension insurance for employees, while self-employed individuals must arrange their own contributions. This system is managed by various private pension insurance institutions, which calculate pensions based on an individual's total earnings and work history. These pensions are also taxable and vary depending on how long an individual has worked and the salary earned during their career.
• National Pension: For individuals with limited or no earnings-related pension, the national pension acts as a safety net. It is administered by Kela, and eligibility depends on residency in Finland for at least three years after age 16. For public sector employees, it is administered by Keva.
• Guarantee Pension: Guarantee pensions provide additional support to ensure a minimum standard of living for pensioners whose other pension income falls below a certain threshold.
The national retirement age for pensions is 65, but if you are born before 1962, you can claim your national pension at the age of 64.91 According to Suomi.fi on how to apply for pensions, you should fill out an application about a month before retirement for basic pensions and about 6-9 months before retirement if you lived or worked abroad.92 Partial early old-age pensions are also an option, allowing people to withdraw a portion of their pension before reaching full retirement age.
Pension recipients can generally continue working without it affecting their pension amount under certain circumstances. For old age pensions, there is no limit to how much you can earn while working, and your earnings do not reduce your pension benefits. However, new employment must start after you officially retire from your previous job. Earnings from work done during retirement may still accrue additional pension rights at a rate of 1.5% per year until the age when the obligation to contribute to pension insurance ends (68–70 years, depending on your birth year). Beyond this age, contributions are no longer required, and additional pension benefits are not accrued. Disability pensions have stricter limits on earnings. Exceeding these limits may result in a suspension or reduction in pension benefits.
Administrative Architecture and Primary Stakeholders
The administration of pensions in Finland involves several public and private stakeholders. The Finnish social security system is centralized through Kela, Finland’s social insurance institution, which oversees pensions and other essential benefits. Within Kela’s system, OmaKela offers an additional benefit to individuals whose pension income falls below a certain threshold, ensuring a baseline standard of living. In addition, Keva manages the pensions system for public sector employees. Suomi.fi functions as a digital service portal, providing information on pensions and directing applicants to Kela and other services. The platform also hosts articles, guides, and support resources for those navigating the application process, serving as a user-friendly point of access to broader pension services.
Below are the key stakeholders and their respective responsibilities:93
Kela
• Administers the national pension system, which provides a basic income for individuals with little or no earnings-related pension.
• Handles applications and payments for national pensions, including old-age pensions, disability pensions, and survivors’ pensions.
• Oversees the OmaKela service, a platform where pension recipients can manage their benefits and apply for additional allowances if their income falls below certain thresholds.
Finnish Centre for Pensions (ETK)
• Serves as an expert body for the earnings-related pension system.
• Manages coordination, research, and guidance across private and public pension schemes.
• Ensures compliance with legislation.
• Provides data for system financing, and advises on pension policies, though it does not directly administer pension benefits.
Earnings-Related Pension Providers
• Composed of private pension insurance companies (e.g., Elo, Ilmarinen, Varma, and Veritas), industry-specific providers like the Seafarers’ Pension Fund, and the Farmers’ Social Insurance Institution (Mela).
• These organizations manage earnings-related pensions, which are tied to the salaries of workers and funded by contributions from employers and employees.
• Providers ensure compliance with the earnings-related pension legislation and invest collected funds to secure long-term sustainability.
Keva
• Responsible for managing the pension system for public-sector employees, including municipal, state, and church workers.
• Handles the administration and partial funding of pensions for these sectors.
Ministry of Social Affairs and Health
• Oversees the strategic development and regulation of the pension system to ensure fairness and sustainability.
• Collaborates with other governmental bodies to implement pension policies effectively.
Suomi.fi Portal
• Provides centralized information for citizens on pensions, application processes, and related social services.
• Acts as an authentication and navigation hub, directing users to relevant platforms like Kela or private pension providers.
The collaborative nature of Finland’s pension system enables specialization and comprehensive service delivery but introduces complexity for end-users. Issues such as navigating multiple platforms, understanding eligibility criteria, and coordinating between private and public entities can create cognitive and administrative burdens. These challenges make pensions a great candidate for a sludge audit, allowing the OECD to collaborate with the Finnish government to identify inefficiencies and simplify the user experience.
This page is intentionally left blank.
C. Cognitive Walk-through Focusing on Interaction with Suomi.fi
Figure 4: Cognitive walkthrough of applying to receive pensions using Suomi.fi
III. Understanding Process Following Death of a Close Family
Member in Finland
A. Background on Aging in Finland
The government of Finland has been working on investing time and resources to make sure that Finland’s aging population and their family members will be supported as they enter the later stages of life. Finland has one of the largest aging populations in Europe, currently 23% of the population is over the age of 65, a number which is expected to grow to 26% by 2030 and 29% by 2060.96 As Finland has public social welfare and health care systems, the current funding structures will not always be enough to support the aging population; there is a valid concern in government that the systems will be overwhelmed and ill-fitted to meet the needs of the larger aging population.97 Therefore, the 2020 government created the National Programme on Aging 2030: For an agecomplete Finland.98
The key objectives of the National Programme on Aging are to direct older people and risk groups to preventative measures that improve their functional abilities; extend the functional ability and working careers of older working-age people; increase and enable voluntary work; improve efficiency of coordination and economic sustainability of services for older people; increase the age-friendliness of housing and residential environments; and to highlight the development and utilization of technology for aging.99 Figure 7 below shows the share of different age groups in the Finnish population, from 1970 to 2018, and projections for these shares in the years 2020 to 2070.
B. Additional psychological considerations for the death of a close family member
The information provided on Suomi.fi is designed to help Finns understand how to navigate major life events while directing them to the appropriate government services. Due to Finland's rapidly aging population, the government is aware that many Finns may require support working through the key processes after a family member’s death. In addition, organizing the affairs of a loved one who has passed can be administratively complicated, emotionally taxing, and involve many touch points with the government. The literature highlights that sludge and administrative burden can be emotionally and psychologically taxing and lead to decision fatigue and lack of engagement with services. In addition, those who are already psychologically burdened as a result of difficult individual situations, time constraints, and financial constraints may have an even more limited capacity to complete complex processes.101
Limited capacity to operate under administrative frictions and burdens is especially relevant in the case of death of a close family member. While circumstances of death may affect a family member’s psychological state, no matter if the death was expected or not, governments should expect that citizens accessing services after the death of a close family member have additional psychological burden. For this reason, it may be even more important in this case to offer adequate but succinct information on required processes in addition to streamlined service deliver in the case of death of a close family member.
The relevance of this life event to the Finnish context, in addition to the involvement of several different agencies and the potential for complications due to the varying circumstances of death and family structures, makes a Sludge Audit of the processes around the death of a close family member in Finland very timely and high impact.
C. Administrative Architecture and Primary Stakeholders
Based on a preliminary review of the administrative tasks that need to be done after the death of a close family member, the complex nature of the processes is clear. One of the primary challenges is the number of stakeholders involved in the process. The below list was gathered through a cognitive walkthrough of the Death of a Close Family Member section on Suomi.fi.102 There are numerous government and non-governmental stakeholders that people must engage with at different points after a family member dies. The below list includes 26 stakeholders that the family member may have to engage with to take care of the affairs of the deceased.
At the beginning of the process, the vital stakeholders are the loved ones of the deceased in addition to:
• Local authorities (depending on the circumstances of death).
• Medical professionals: provide death certificate and in some cases a burial permit.
• Employer of deceased: if currently employed.
• Agency that stores the report on family relationships (needed for banking, insurance, housing, and social media matters).
• Regional Central Register of the Evangelical Lutheran Church of Finland.
Figure 5: The share of different age groups in the population in 1970 to 2018, and projections for years 2020 to 2070 (Source: Finland National Programme on Ageing 2030)100
D. Cognitive Walk-through
Figure 6: Cognitive walkthrough of receiving services following the death of a family member
E. Key Enablers and Barriers
The process for organizing the affairs of a family member that has passed in Finland can be very lengthy and involve many stakeholders, as has been shown in the previous sections. There are several design features on the Suomi.fi website that may enable or prevent a user from following through with services as they walk through it. The above walk-through focuses on Suomi.fi and does not address the additional barriers that may be present on linked websites and their respective processes.
The key barriers encountered through the cognitive walkthrough were:
• Direct links, lack of links, and popouts: The Suomi.fi webpages include many helpful hyperlinks that can lead users to other government or non-government websites, specific forms, or additional information. These links are extremely helpful and reduce the time that a user may have to spend searching for other information or forms. However, some of the hyperlinks presented throughout the death of a family webpage on Suomi.fi navigate you away from the page without opening a new tab, while others open a new tab. When a new tab is not open, it may force users to have to lose their place on the Suomi.fi webpage while exploring information on the new website. To then have to navigate back to the Suomi.fi webpage could be a barrier that not all users may be able to overcome and choose not to return to Suomi.fi. In addition, the checklist, which gives a more succinct version of all of the information, does not include any hyperlinks. Adding hyperlinks to this webpage could prevent someone from going through the entire guide or re-doing a google search to find a specific form or piece of information.
• Information overload and repetitive information: The guide on Suomi.fi to navigate death of a family member is extremely lengthy. While the webpage tries to minimize information overload through optional dropdowns with further information, it would realistically take someone a very long time to get through the entire guide. The length of the guide may lead to fatigue and a user not being able to get all of the information that they were looking for. In addition, the time they are willing to spend on the webpage may be shorter due to the fact that they may be psychologically strained from the death of their family member and have a lower capacity to navigate the guide and absorb information. In addition, when a user is navigating through the entire guide, some information can be repetitive which could lead to further drop-off.
• Questionnaire and guide navigation: The questionnaire at the beginning of the guide offers the opportunity for users to narrow down the information they need to look through by basing it on their specific scenario. This is a great tool to reduce the amount of information one has to absorb during such a stressful period. However, once the user has entered the guide, they have to navigate back to the quiz page to get their personalized results. This could result in repetitiveness that could cause fatigue and inability to access necessary information for the user.
• Language barriers: Suomi.fi is available in Finnish, Swedish, and English. However, some of the services and information are only available in Finnish, while others have both Swedish and English options available. At one point during the cognitive walkthrough, there was a link to a page that stated, “Webpage not available in English.” In addition, when looking up services available for those who have been affected by death of a close family member, there were 69 services available in Finnish, with only 7 and 2 in Swedish and English specifically. This presents a challenge to minority populations, such as immigrants or Swedish speakers, who are hoping to access services and information through Suomi.fi.
• Not all municipalities have uploaded service information: One part of the death of a close family member guide allows users to put in their municipality of residence and see the available services near them. However,
not all of the municipalities have services listed. As previously discussed, the national government and the municipalities have not yet been able to sync their digital service delivery perfectly, and varying capacity of municipalities to adopt Suomi.fi services such as information provision contribute to the information asymmetry in cases such as these. Improving the availability of information across Suomi.fi will promote the inclusivity of residents of all municipalities, making sure that there is equal access to information no matter where you live.
The key enablers encountered through the cognitive walkthrough were:
• Information provided that outlines the stakeholder's responsibilities versus the family member’s: In the section that provides information about funeral planning, the webpage outlines what the funeral home typically takes care of versus what the family member’s responsibility is. At a time when psychological stress is high, it could be very meaningful and easy to have tasks laid out in that way and understand what is reasonable to ask of government or non-government stakeholders.
• Visual presentation and navigation: the Suomi.fi website has many helpful design features that make it easier for users to navigate the available services and information:
• Questionnaire: when a user navigates to the Death of a Close Family Member page through Suomi.fi, they are presented with a questionnaire about the situation that allows them to get information more specific to their situation. A user can also skip the questionnaire and go directly into the guide without finding the results again.
• Sidebar: the sidebar helps users easily navigate from one page to the next and jump around if needed.
• Navigate to checklist: at the bottom of each page of information, there is an option to jump directly to the checklist, which typically comes at the end of the guide. This way, if a user gets tired of reading the information and wants more succinct directions and answers, they can just to the checklist at any time without having to dig through information to find it.
F. Takeaways
Death of a close family member can be an extremely difficult time in one’s life, and with the aging population in Finland, there is very high impact potential from ensuring that the processes for family members after death of a close family member are easily accessible and understandable across all populations in Finland.
The Suomi.fi website provides a great starting point for users looking for more information. However, the amount of information may be overwhelming, especially to those suffering more from the psychological effects of losing a family member, who may have limited capacity to read, digest and act on the information. In addition, challenges navigating the links provided throughout the guide could deter users from getting everything they need from Suomi.fi.
Finally, it is important to note again the complexity of the processes that take place after someone dies. While Suomi.fi provides all of the information in one place, the creation of this journey map revealed that the information is challenging to digest through this medium, and there are improvements to be made. Going forward, it will be imperative for the Suomi.fi designers to narrow down what the most important information is. This may lead to disagreements between agencies, but it will be key to ensure the process is smooth for the user, so information is easily accessible and not confusing or burdensome to navigate.
Ongoing Monitoring, Evaluation, and Iteration:
Establish an ongoing feedback loop to continuously monitor the process and adapt based on applicant feedback and performance data. Re-implement sludge evaluations regularly to ensure no new barriers emerge and that ongoing changes continue to enhance the user experience.
Potential Barriers for Conducting Sludge Audits
The preliminary inquiry demonstrates the high potential for impact in conducting sludge audits in the context of Finland’s digital public service delivery. However, there could also be potential barriers or challenges to the sludge audit process, including the following:
• Lack of data availability: If the website or administrative data required for key metrics is not readily available or easily accessible, this may pose a challenge or slow down the sludge audit process.
• Stakeholder fragmentation: As explained in the stakeholder mapping, there are many siloed stakeholders involved in the delivery of social services, which might make it more challenging to identify sources of sludge, especially from the administrative side of service delivery.
• Limited user feedback mechanisms: Although the Suomi.fi platform has a quality tools feature (explained in the next section) which provides users with the opportunity to give feedback, there is currently limited scope for administering surveys and running user focus groups. Establishing these mechanisms is a crucial step in conducting the sludge audit.
Overview of Knowledge Gaps and Areas for Further Research
Our research and conversations with relevant stakeholders in Finland reveal that the structure of Finland’s benefit systems for the three services presents cognitive challenges due to segmented benefits and varied administrative processes. Evidence shows that choice overload and compliance requirements can deter action. Specifically for unemployment insurance, studies indicate that universal basic income (UBI) recipients in Finland reported greater trust and well-being compared to those receiving traditional UI, suggesting that streamlined processes and reduced conditionality enhance user satisfaction. For unemployment, pensions, and bereavement, the processes involve multiple entities, which can lead to redundant paperwork, multiple verifications, and siloed workflows that create bottlenecks and administrative inefficiencies.
However, there are still knowledge gaps and areas for further research which would be important for conducting a sludge audit and successfully implementing solutions that reduce cognitive burdens and increase efficiency. Below are a few examples:
• Behavioral impact of sludge reduction: While simplification has benefits, it is unclear how different sludge reduction strategies would impact user behavior and engagement.
• Role of digital tools in reducing friction: It remains to be seen if digital solutions like virtual assistants or realtime updates could effectively minimize sludge without compromising data privacy or accessibility.
• Extent of user interaction with local vs. federal agencies: The federal government manages platforms like Suomi.fi and is responsible for service delivery at the federal level, while municipalities are involved in delivery of local services. This means that applicants may be interacting with both federal agencies and municipalities, and it is important to understand the user experience with both in order to identify sludge areas.
IV. Analyzing service quality with Suomi.fi Quality Tools
The quality tools, a Suomi.fi service, are a useful mechanism for gathering data for sludge audits and designing customer-oriented digital public services
Overview of Quality Tools
Suomi.fi provides a set of tools referred to as ‘quality tools’, which are used by different ministries to evaluate the quality of digital service delivery. Suomi.fi quality tools are intended to enable government organizations to collect and collate real-time user feedback, which can then be used to evaluate, monitor, and compare the quality of digital services within and between organizations and on a national level. These tools provide “ready-made, interoperable indicators” for quality measurement and shed light on the strengths and development areas of digital services. Like other Suomi.fi services, they are free for government units to include on their websites. They are linked to the Finnish Service Catalogue, the centralized data repository; once the organization adds its services to the catalogue, the quality tools can be immediately used. Instructions for service providers to start using quality tools are available online.103 Despite their potential, our research suggests that uptake by government units and organizations has been limited.104
The relatively low adoption rates highlight a missed opportunity to integrate these tools into broader efforts to audit and reduce sludge, elevate client-centered services, and improve journey mapping across Finland’s digital public services.
Suomi.fi’s quality tools include four specific options. The first is a set of self-assessment tools for government units and organizations to evaluate their own digital services based on a national set of criteria. Self-assessments are intended to be conducted by those responsible for service delivery one to two times per year, or when significant changes to services are made or planned. The self-assessment includes 55 statements under six themes (instructions, service use, usability, use of electronic support services, data security and protection, and engaging the customer), answered with yes, partially, or no. Overall results and category-specific results can be used to identify strengths and development points, though there do not yet seem to be clear examples of service actions and changes based on this information.
Next is the customer feedback tool, as mentioned, which asks users two questions immediately after using a service: a five-star satisfaction rating and an open feedback response. Responses can be collected via website, email, or SMS to elucidate channel-specific differences. The feedback form is available in nine languages, and can be translated into Finnish, Swedish, English. Personal information is anonymized, and thus not trackable over time. Organizations’ own user interfaces can be used to process this feedback.
Third is the utilization rate measurement tool, which monitors how many different services are used and their distribution across delivery channels. And last is data monitoring, which includes some of the above data and results, with dashboard views at the national, organizational, and service level enabling comparison and benchmarks between services and organizations.
Leveraging Quality Tools
While the quality tools are a promising input to these efforts, they are not yet fully set up to facilitate the
V. Conclusions and Recommendations
The findings of this report emphasize the need for systematic sludge audits to enhance digital service delivery in Finland. By adopting a structured, evidence-based approach to optimizing the user experience of digital services – particularly through Suomi.fi – Finland can enhance the accessibility, efficiency, and inclusivity of its public services while aligning with national and European digital strategies.
One key takeaway from our research is that Suomi.fi is just one of many digital platforms which are relevant for social service delivery in Finland. A sludge audit which focuses on the end user’s experience accessing a service will need to not just focus on Suomi.fi but also include an assessment of the processes on other platforms such as Kela. Therefore, even if Suomi.fi is the main focus on the project, an effective sludge audit will need to incorporate other platforms and relevant stakeholders which are part of the user journey.
There is an opportunity to invest in creating a greater culture of behavioral science across the Finnish government by ensuring that sludge audit processes are recurring. For instance, the sludge audit process can be used to create a focus group pool and regular feedback loops which can be leveraged in the future.
Below, we present a roadmap which can guide this effort:
A. Institutionalize Sludge Audits as a Core Function:
Sludge audits must transition from isolated initiatives to a recurring, institutionalized process within Finland’s governance framework. This requires:
• Dedicated Units: Establish sludge auditing teams within the DVV, with support from FINBEPOL, with clear mandates to evaluate and reduce sludge.
• Legal Mandates: Legislative and policy measures can embed sludge auditing as part of Finland’s public administration framework, ensuring accountability and subsequent resource allocation, building an incremental and enabling framework for audits.
• Capacity Building: Training public servants in behavioral science methods, with an emphasis on user-centric design and data-driven decision making, can embed an orientation for behavioral approaches within the government.
B. Inclusive Stakeholder Engagement
The fragmented stakeholder ecosystem must be aligned in order to achieve persistent and long-term benefits of sludge reduction initiatives.
• Municipal cooperation and change management approaches: Actively involving municipalities in the cocreation of sludge reduction initiatives can account for local variations, resource disparities, and generate a greater buy-in from municipalities.
• Citizen-centered design: Engaging users through participatory workshops, focus groups and other feedback mechanisms can ensure services meet real-world needs and expectations.
C. Enhancing User-Centric Design by Leveraging User Data
A data-driven approach to sludge reduction and service design can benefit from leveraging user data collected at scale to inform interventions.
• Use of quality tools: Suomi.fi’s quality tools provide an existing mechanism through which user feedback and data can be collected to assist with sludge audits.
• Integrated feedback loops: Integrating feedback mechanisms with service provision can ensure that gathering user data is not a parallel cost-intensive exercise, but instead, user data is automatically generated in the course of accessing services.
1 Herd, P., & Moynihan, D. P. (2019). Administrative burden: Policymaking by other means. Russell Sage Foundation.
2 Heinrich, C. J. (2016). The bite of administrative burden: A theoretical and empirical investigation. Journal of Public Administration Research and Theory, 26(3), 403-420.
3 Sunstein, C. R. (2022). Sludge audits. Behavioral Public Policy, 6(4), 654-673.
4 Sunstein, C. R. (2018). Sludge and ordeals. Duke LJ, 68, 1843-1883.
5 Bhargava, S., & Manoli, D. (2015). Psychological frictions and the incomplete take-up of social benefits: Evidence from an IRS field experiment. American Economic Review, 105(11), 3489–3529. https://doi.org/10.1257/ aer.20121493.
6 Mullainathan, S., & Shafir, E. (2013). Scarcity: Why having too little means so much. Times Books.
7 Shahab S, Lades LK. (2024). Sludge and transaction costs. Behavioral Public Policy, 8(2), 327-348. doi:10.1017/bpp.2021.12
8 Fox, A., Feng, W., & Reynolds, M. (2023). The effect of administrative burden on state safety‐net participation: evidence from food assistance, cash assistance, and Medicaid. Public Administration Review, 83(2), 367-384.
9 Keiser, L. R., & Miller, S. M. (2020). Does administrative burden influence public support for government programs? Evidence from a survey experiment. Public Administration Review, 80(1), 137-150.
10 Halling, A., & Baekgaard, M. (2024). Administrative Burden in Citizen–State Interactions: A Systematic Literature Review. Journal of Public Administration Research and Theory, 34(2), 180-195.
11 Nielsen, M. M., Carvalho, N. R., Veiga, L. G., & Barbosa, L. S. (2017, March). Administrative burden reduction over time: Literature review, trends, and gap analysis. In Proceedings of the 10th International Conference on Theory and Practice of Electronic Governance (pp. 140-148).
12 Office of Management and Budget. (2023). Reducing time taxes and administrative burdens. The White House. Retrieved from https://www.whitehouse.gov/wp-content/uploads/2023/07/OIRA-2023-Burden-ReductionReport.pdf.
13 Simon, H. A. (2014). Administrative behavior: A study of decision-making processes in administrative organizations. International Journal of Agricultural and Biological Engineering, 4(2), 1-18.
14 Lopoo, L. M., Heflin, C., & Boskovski, J. (2020). Testing behavioral interventions designed to improve ontime SNAP recertification. Journal of Behavioral Public Administration, 3(2), 1-8.
15 OECD (2024), “Fixing frictions: ‘sludge audits’ around the world: How governments are using behavioural science to reduce psychological burdens in public services”, OECD Public Governance Policy Papers, No. 48, OECD Publishing, Paris, https://doi.org/10.1787/5e9bb35c-en
16 OECD (2024), “Fixing frictions: ‘sludge audits’ around the world: How governments are using behavioural science to reduce psychological burdens in public services”, OECD Public Governance Policy Papers, No. 48, OECD Publishing, Paris, https://doi.org/10.1787/5e9bb35c-en
17 James, S. (2015). The contribution of the UK's Behavioural Insights Team. International Journal of Applied Behavioral Economics, 4(2), 53–70. https://doi.org/10.4018/ijabe.2015040104.
18 Mills S, Whittle R, Ahmed R, Walsh T, Wessel M. Dark patterns, and sludge audits: an integrated approach. Behavioural Public Policy. Published online 2023:1-27. doi:10.1017/bpp.2023.24.
19 Bouguettaya, A., Yu, Q., Liu, X., & Malik, Z. (2010). Service-centric framework for a digital government application. IEEE Transactions on Services Computing, 4(1), 3-16.
20 Kollmer, Tim, "Digital Sludging in the Privacy Context: Evidence of a Multigroup Analysis" (2022). AMCIS 2022 Proceedings. 4. https://aisel.aisnet.org/amcis2022/sig_hci/sig_hci/4.
21 OECD (2024), “Fixing frictions: ‘sludge audits’ around the world: How governments are using behavioural
science to reduce psychological burdens in public services”, OECD Public Governance Policy Papers, No. 48, OECD Publishing, Paris, https://doi.org/10.1787/5e9bb35c-en.
22 OECD (2024), OECD Survey on Drivers of Trust in Public Institutions – 2024 Results: Building Trust in a Complex Policy Environment, OECD Publishing, Paris, https://doi.org/10.1787/9a20554b-en.
23 OECD (2024), Enabling Digital Innovation in Government: The OECD GovTech Policy Framework, OECD Digital Government Studies, OECD Publishing, Paris, https://doi.org/10.1787/a51eb9b2-en.
24 Immervoll, H. and C. Knotz (2018), "How demanding are activation requirements for jobseekers", OECD Social, Employment and Migration Working Papers, No. 215, OECD Publishing, Paris, https://doi. org/10.1787/2bdfecca-en
25 Kalucza, J., & Sievert, M. (2024). Alleviating administrative burden through digitalization and redesign: A laboratory experiment on student financial aid in Germany. International Journal of Social Welfare, 33(4), 786-805.
26 Green, J., & Green, M. (2006). Dealing with death: A handbook of practices, procedures, and law. Jessica Kingsley Publishers.
27 Morgan, A., Andrew, T., Guerra, S. M., Luna, V., Davies, L., & Rees, J. R. (2022). Provider reported challenges with completing death certificates: A focus group study demonstrating potential sources of error. Plos one, 17(5), e0268566
28 Finseraas H Jakobsson. (2014). Does information about the pension system affect knowledge and retirement plans? Evidence from a survey experiment. Journal of Pension Economics and Finance, 13(3), 250-271. doi:10.1017/S1474747213000310.
29 Bielawska, K., & Turner, J. A. (2023). Trust and the behavioral economics of automatic enrollment in pensions: a comparison of the UK and Poland. Journal of Economic Policy Reform, 26(2), 216-237.
30 IMF DataMapper, Finland, available at https://www.imf.org/external/datamapper/profile/FIN.
31 Literacy rate by country 2024, World Population Review. (n.d.). https://worldpopulationreview.com/ country-rankings/literacy-rate-by-country
32 Countries with the oldest populations in the world. PRB. (n.d.-b). https://www.prb.org/resources/ countries-with-the-oldest-populations-in-the-world/.
33 Population density (people per sq. km of land area) - finland. World Bank Open Data. (n.d.-b). https:// data.worldbank.org/indicator/EN.POP.DNST?locations=FI.
34 Yli-Huumo, J., Päivärinta, T., Rinne, J., & Smolander, K. (2018, August 2). Suomi.fi – Towards Government 3.0 with a National Service Platform
35 Story - e-estonia. e. (2024, May 3). https://e-estonia.com/story/.
36 Kemp, S. (2023, February 13). Digital 2023: Finland - DataReportal – global digital insights. DataReportal. https://datareportal.com/reports/digital-2023-finland
37 Yli-Huumo, J., Päivärinta, T., Rinne, J., & Smolander, K. (1970, January 1). Suomi. fi – Towards Government 3.0 with a national service platform. SpringerLink. https://link.springer.com/ chapter/10.1007/978-3-319-98690-6_1
38 Paju, P. (2009). Computer Industry as a National Task. In: Impagliazzo, J., Järvi, T., Paju, P. (eds) History of Nordic Computing 2. HiNC 2007. IFIP Advances in Information and Communication Technology, vol 303. Springer, Berlin, Heidelberg. https://doi.org/10.1007/978-3-642-03757-3_18
39 Farooq, A., Warkentin, M., & Virtanen, S. (2023). Role of shared identity and agency trust in online voting among Finnish citizens. Technology in Society, 76.
40 Yli-Huumo, J., Päivärinta, T., Rinne, J., & Smolander, K. (2018, August 2). Suomi.fi – Towards Government 3.0 with a National Service Platform.
41 Yli-Huumo, J., Päivärinta, T., Rinne, J., & Smolander, K. (2018, August 2). Suomi.fi – Towards Government 3.0 with a National Service Platform
42 Finnish municipalities and Regions. Localfinland.fi. (n.d.). https://www.localfinland.fi/finnishmunicipalities-and-regions.
43 In-person interviews conducted 14 October 2024-18 October 2024 in Helsinki, Finland, and Paris, France.
44 Guay, J., ‘These 10 governments are leading the world in Behavioral Science’, Apolitical, available at <https://apolitical.co/solution-articles/en/these-10-governments-are-leading-the-world-in-behavioural-science>.
46 Digital and Population Data Services Agency. (n.d.). What is Suomi.fi? Suomi.fi. Retrieved November 10, 2025, from https://www.suomi.fi/instructions-and-support/general-information/what-is-suomifi
47 In-person interviews conducted 14 October 2024-18 October 2024 in Helsinki, Finland, and Paris, France.
48 Valtiontalouden tarkastusvirasto. (2022). Suomi.fi-palvelujen tilanne ja kehitys (Tarkastuskertomus 10/2022). https://www.vtv.fi/julkaisut/suomi-fi-palvelujen-tilanne-ja-kehitys/
49 National Audit Office of Finland. (2022). Conclusions and recommendations: Current status and development of the Suomi.fi services (Report No. 10/2022). https://www.vtv.fi/app/uploads/2022/10/NAOFrecommendations-10-2022-Current-status-and-development-of-the-Suomi.fi-services.pdf. National Audit Office of Finland. (2022). Statements on the draft report 10/2022: Suomi.fi services' current status and development. https://www.vtv.fi/app/uploads/2022/10/VTV-Lausunnot-10-2022-Suomi.fi-palvelujen-tilanne-ja-kehitys.pdf.
50 Id.
51 Id.
52 In-person interviews conducted 14 October 2024-18 October 2024 in Helsinki, Finland, and Paris, France.
53 Digital and Population Data Services Agency. (2024, June 17). Digital First project seeks solutions for reducing paper post sent by authorities. https://dvv.fi/en/-/digital-first-project-seeks-solutions-for-reducing-paperpost-sent-by-authorities.
54 Id.
55 Id.
56 Ministry of Economic Affairs and Employment, Ministry of Finance, & Ministry of Transport and Communications. (2022, October 20). Government report on the digital compass sets the course for Finland’s digital transformation. Finnish Government. https://valtioneuvosto.fi/en/-/10623/government-report-on-thedigital-compass-sets-the-course-for-finland-s-digital-transformation.
57 Id.
58 In-person interviews conducted 14 October 2024-18 October 2024 in Helsinki, Finland, and Paris, France.
59 Ministry of Finance. (2024, April 29). Digital identity wallet to be launched in 2026. Finnish Government. https://valtioneuvosto.fi/en/-/10623/digital-identity-wallet-to-be-launched-in-2026.
60 In-person interviews conducted 14 October 2024-18 October 2024 in Helsinki, Finland, and Paris, France.
61 Id.
62 Id.
63 Leino, H., & Åkerman, M. (2021). The politics of making Finland an experimenting nation. Critical Policy Studies, 16(4), 441–459. https://doi.org/10.1080/19460171.2021.1985549.
64 In-person interviews conducted 14 October 2024-18 October 2024 in Helsinki, Finland, and Paris, France.
65 Ministry of Transport and Communications. (2022). Government Report: Digital Compass. Finnish Government. https://julkaisut.valtioneuvosto.fi/handle/10024/164472.
66 NSW Behavioural Insights Unit. (n.d.). Sludge Toolkit. NSW Government. Retrieved April 7, 2025, from https://www.nsw.gov.au/departments-and-agencies/behavioural-insights-unit/sludge-toolkit.
67 NSW Behavioural Insights Unit. (n.d.). Sludge Scales. NSW Government. Retrieved April 7, 2025, from https://www.nsw.gov.au/departments-and-agencies/behavioural-insights-unit/sludge-toolkit/download-sludgescales.
68 Organisation for Economic Co-operation and Development. (2024). Recommendation of the Council on Human-Centred Public Administrative Services (OECD Legal Instrument No. OECD/LEGAL/0503). https:// legalinstruments.oecd.org/en/instruments/OECD-LEGAL-0503.
69 NSW Behavioural Insights Unit. (2024). The NSW Government sludge audit method guide: A behavioural approach to improving customer experience and supporting inclusive government service delivery. NSW Government Department of Customer Service.
70 Id.
71 InfoFinland. (n.d.). Unemployment benefit. Retrieved November 10, 2024, from https://www.infofinland. fi/en/work-and-enterprise/if-you-become-unemployed/unemployment-benefit.
72 European Commission. (n.d.). Finland: Unemployment benefits. Retrieved November 10, 2024, from https://ec.europa.eu/social/main.jsp?catId=1109&intPageId=4528&langId=en.
73 Employment Fund Finland. (n.d.). Unemployment insurance contribution. Retrieved November 10, 2024, from https://www.employmentfund.fi/Unemploymentinsurancecontribution/.
74 Nordics.info. (n.d.). Trade-union administered unemployment benefit and precarious workers in Finland. Retrieved November 10, 2024, from https://nordics.info/show/artikel/trade-union-administered-unemploymentbenefit-and-precarious-workers-in-finland.
75 YCharts. (n.d.). Finland unemployment rate. Retrieved November 10, 2024, from https://ycharts.com/ indicators/finland_unemployment_rate.
76 Trading Economics. (n.d.). Finland unemployment rate. Retrieved November 10, 2024, from https:// tradingeconomics.com/finland/unemployment-rate.
77 Kela. (n.d.). Statistics on unemployment protection in Finland. Retrieved November 10, 2024, from https://tietotarjotin.fi/en/statistic/2857605/statistics-on-unemployment-protection-in-finland.
78 YLE. (2024, March 31). Unemployment benefits cuts take effect on Monday: Monthly support may drop by nearly €400. Retrieved November 10, 2024, from https://yle.fi/a/74-20081480
79 Kela. (n.d.). Unemployment benefits. The Social Insurance Institution of Finland. Retrieved November 10, 2024, from https://www.kela.fi/unemployment-benefits.
80 Tyoelamaan.fi. (n.d.). When employment ends: Unemployment. Retrieved November 10, 2024, from https://tyoelamaan.fi/en/when-employment-ends/unemployment/.
81 Lu, D. (2020, May 11). Universal basic income seems to improve employment and well-being. New Scientist. Retrieved November 10, 2024, from https://www.newscientist.com/article/2242937-universal-basicincome-seems-to-improve-employment-and-well-being/; Wellbeing Economy Alliance. (n.d.). Case studies: Finland – Universal Basic Income Pilot. Retrieved November 10, 2024, from https://weall.org/resource/finlanduniversal-basic-income-pilot
82 Ministry of Economic Affairs and Employment of Finland. (n.d.). TE Services Reform 2024. Retrieved November 10, 2024, from https://tem.fi/en/te-services-reform-2024.
83 Learning Loop. (n.d.). Present bias. Retrieved November 10, 2024, from https://learningloop.io/plays/ psychology/present-bias.
84 The Decision Lab. (n.d.). Cognitive load theory. Retrieved November 10, 2024, from https:// thedecisionlab.com/reference-guide/psychology/cognitive-load-theory
85 Psychologist World. (n.d.). Cognitive load theory. Retrieved November 10, 2024, from https://www. psychologistworld.com/memory/cognitive-load-theory ; Tully, K. (2021). Odd bedfellows: How choice architecture can enhance autonomy and mitigate inequality. Behavioral Public Policy, 5(4), 527–552. doi:10.1017/bpp.2019.36.
86 McCubbins, M. D., & Schwartz, T. (1984). Congressional oversight overlooked: Police patrols versus fire alarms. American Journal of Political Science, 28(1), 165–179.
87 The Decision Lab. (n.d.). Defaults. Retrieved November 10, 2024, from https://thedecisionlab.com/ reference-guide/psychology/defaults.
88 Hallsworth, M. (2023, April 10). The real opportunities for empowering people through behavioral science. Behavioral Scientist. Retrieved November 10, 2024, from https://behavioralscientist.org/the-realopportunities-for-empowering-people-through-behavioral-science/.