

The Master Agreement for Preschool Expansion Services calls for Cincinnati Preschool Promise (the Preschool Expansion Organization, or “PEO”), to annually report data related to students served, community providers supported, and costs expended. This report is due to the Cincinnati Public School District and the United Way of Greater Cincinnati in July of each year. The data included herein have been compiled to fulfill this requirement. The Master Agreement calls for:
On July 15 of each year commencing July 15, 2017, the PEO shall provide an annual report on the services to be provided pursuant to this contract to the United Way and the School District. At a minimum, the annual report shall include:
A summary profile of the students who benefitted from Tuition Assistance, including data reflecting income level, race, and geographic participation
A summary profile of the Community Providers that have received Quality Improvement funding and the progress such Providers have achieved in increasing the Provider’s Star rating.
Breakdown of the costs expended by the PEO, including the amounts spent on Tuition Assistance, Quality Improvement, administrative costs, and other costs.
Financial results for the fiscal year ending on June 30, 2022, are expected in August 2022. When final results are available, they will be shared with the CPS Budget, Finance, and Growth Committees in order to meet our reporting requirements.
The data reported here will also inform Cincinnati Preschool Promise’s comprehensive 2021 2022 Annual Report to the Community, which will be released in the fall of 2022.

How
What

African
Other
Unknown
American
Total
Number
Students
Percent of Students
1%
1%
1%
What
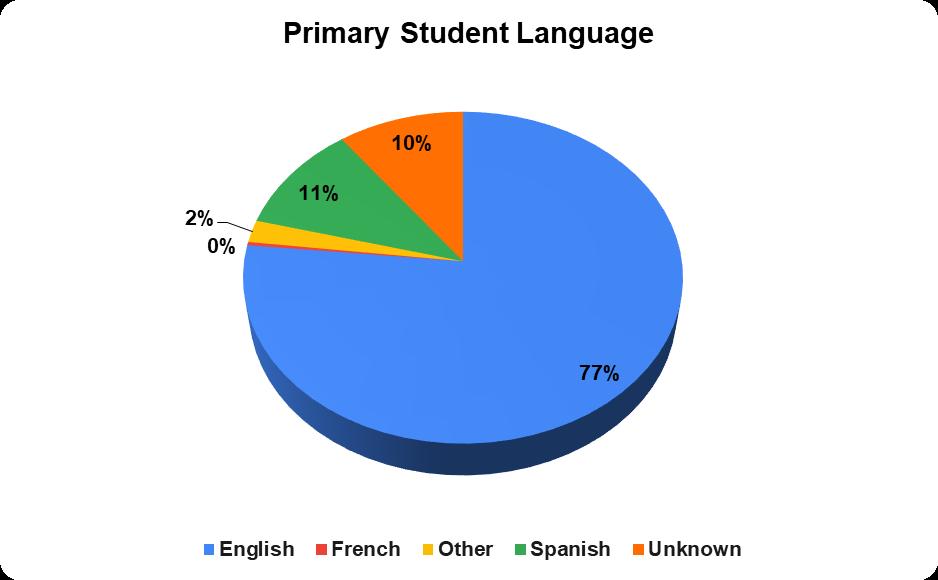
What is the breakdown of student enrollment by
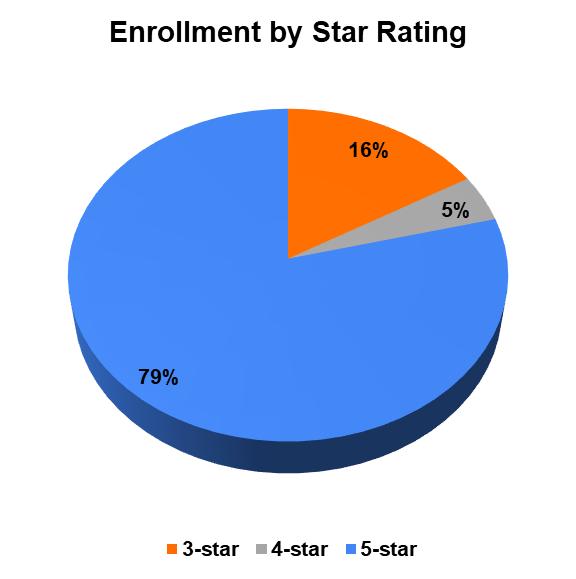

in 2021 22?
Site
Single
What is the breakdown of
Site
by
Students
in 2021 22?
In what neighborhoods did 2021 22 students live?
Neighborhood Number of Students
Quality Gap Neighborhood? % Per Neighborhood
Avondale 55 Yes 6%
Bond Hill 35 No 4%
Camp Washington 1 No 0%
Carthage 5 No 1%
Cheviot 13 No 1%
Clifton 12 Yes 1%
College Hill 17 No 2%
Columbia Tusculum 1 No 0%
Columbia Twp. 1 No 0%
Corryville 5 No 1%
Downtown 29 No 3%
East Price Hill 48 Yes 5%
East Walnut Hills 7 Yes 1%
East Westwood 15 Yes 2%
English Woods 7 No 1%
Evanston 28 Yes 3%
Golf Manor 11 No 1%
Hartwell 9 Yes 1%
Hyde Park 7 No 1%
Kennedy Heights 7 No 1%
Lower Price Hill 64 No 7%
Madisonville 13 No 1%
Millvale 7 No 1%
Mt. Airy 27 Yes 3%
Mt. Auburn 8 No 1%
Mt. Washington 14 Yes 2%
North Avondale 13 Yes 1%
North Fairmount 10 No 1%
Northside 10 No 1%
Oakley 6 No 1%
Other 5 No 1%
Over the Rhine 20 No 2%
Paddock Hills 5 No 1%
Pendleton 10 No 1%
Pleasant Ridge 21 No 2%
Roselawn 17 No 2%
Sayler Park 5 No 1%
Sedamsville 1 No 0%
Silverton 7 No 1%
South Cumminsville 2 No 0%
South Fairmount 12 No 1%
Villages at Roll Hill 18 No 2%
Walnut Hills 19 Yes 2%
West End 26 No 3%
West Price Hill 78 Yes 8%
Westwood 174 Yes 19%
Winton Hills 17 Yes 2%
Total 922 100%
*Values showing
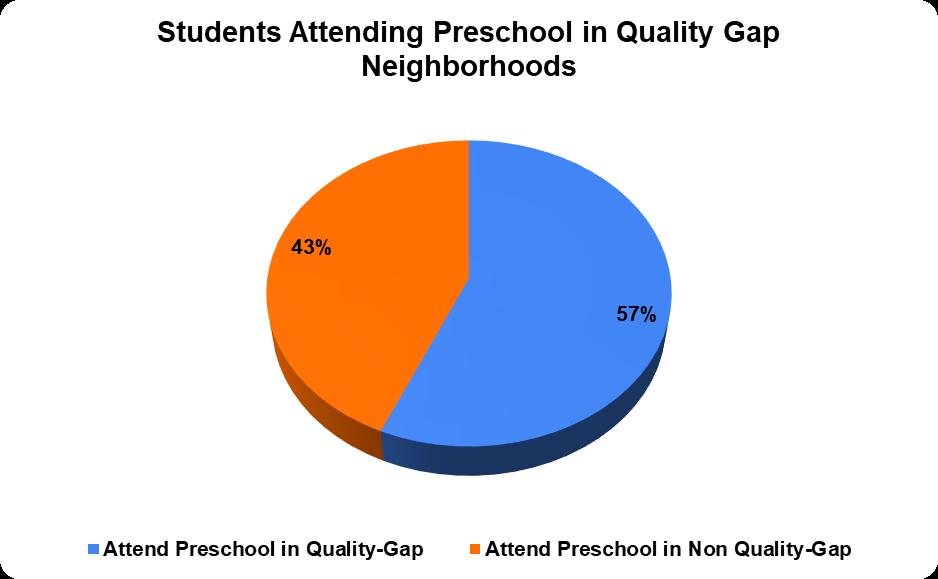
What is the Quality Gap 2 breakdown of students in 2021 22, by student residence?
Quality Gap Status
Number of Students
Percent of Total
Reside in Quality Gap Neighborhood 516 56% Reside in Non Gap Neighborhood 406 44% Total 922 100%
2 Areas identified in the Rand Report to have a limited amount of high quality preschool seats, defined as those with 3 to 5 stars on Ohio’s Step Up to Quality Rating and Improvement System. This data will be updated in CPP’s Year 6 Evaluation to compare high quality seat capacity to the number of preschool eligible children in a neighborhood based upon U.S. Census Bureau data.

In what neighborhoods did students attend preschool?

Avondale 68 7.38%
Bond Hill 66 7.16%
Cheviot 5 0.54%
Clifton 7 0.76%
College Hill 11 1.19% Coryville 42 4.56% Downtown 10 1.08%
East Price Hill 110 11.93%
East Walnut Hills 10 1.08%
East Westwood 6 0.65% Evanston 19 2.06% Golf Manor 7 0.76%
Kennedy Heights 11 1.19%
Lower Price Hill 36 3.90%
Madisonville 22 2.39% Millvale 12 1.30%
Mt. Airy 5 0.54%
Mt. Auburn 37 4.01%
Mt. Washington 3 0.33%
North Avondale 8 0.87% Northside 6 0.65%
Over the Rhine 17 1.84%
Pleasant Ridge 22 2.39% Roselawn 20 2.17%
Walnut Hills 35 3.80%
West End 77 8.35%
West Price Hill 102 11.06% Westwood 145 15.73%
Winton Hills 2 0.22%
Total 922 100%
How
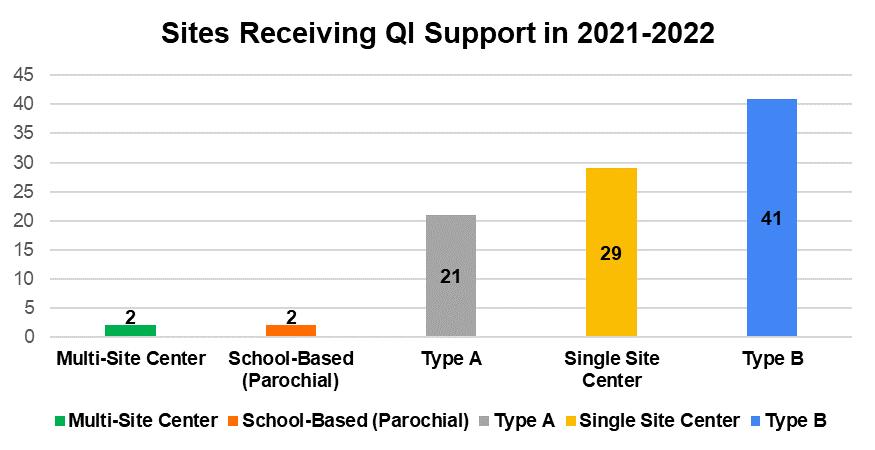
How many Providers
In total,
Providers
Providers
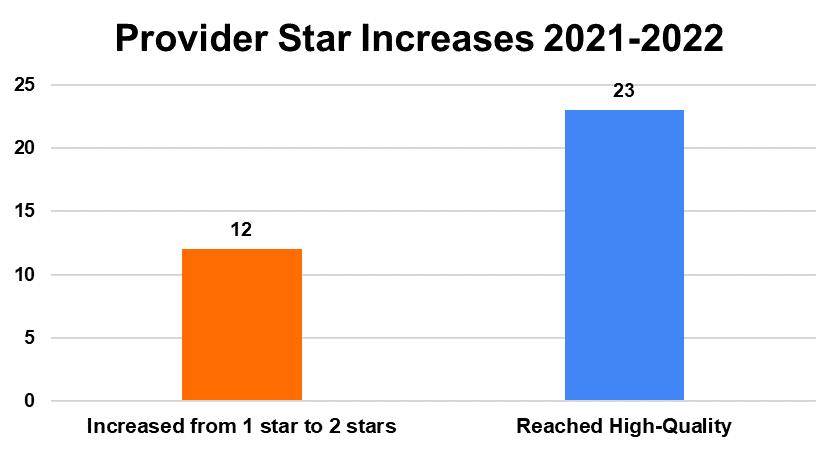
How many Providers
their
How
their
in 2021-22
An additional 23 Providers increased their

2021

In which neighborhoods were the 2021 22 Quality Improvement Providers located, and how many seats were located in each neighborhood?
Neighborhood Number of Providers
Total Preschool Seats (including seats converted to High Quality)
Seats Converted to High Quality Quality Gap Neighborhood?
Avondale 6 124 20 Yes
Bond Hill 11 188 31 No
Carthage 2 36 No Cheviot 2 36 24 No
Clifton 4 91 6 Yes
College Hill 6 70 6 No
East Price Hill 1 6 Yes
East Walnut Hills 1 21 Yes
English Woods 1 12 No
Evanston 3 18 6 Yes
Golf Manor 1 18 18 No
Hartwell 2 18 6 Yes
Lower Price Hill 3 24 No
Madisonville 5 94 6 No Millvale 2 94 No
Mt. Airy 3 24 Yes
Mt. Auburn 2 18 No North Fairmount 2 18 No Northside 3 54 No
Pleasant Ridge 3 30 12 No Roselawn 1 18 18 No Silverton 3 24 No Spring Grove Village 2 27 12 No
Springfield Twp. 1 6 No
Walnut Hills 4 70 32 Yes
West End 4 46 12 No
West Price Hill 4 46 20 Yes
Westwood 21 260 103 Yes
Winton Hills 1 6 Yes
Total 104 1,497 332
*Total includes 9 Quality Improvement Providers who converted to Tuition Assistance in 2021- 2022 but reached high quality in prior fiscal years.
How
Preschool Seats at


Seats at
Located
Seats*
How many Teachers received Teacher Promise Grants in 2021 22?
In the 2021-22 school year, 62 new Lead Preschool Teachers from 38 Tuition Assistance Sites received Teacher Promise Grants (TPG) in the amount of up to $4,000/year. Additionally, 50 Teacher Promise Grant recipients continued to receive support through 2021-2022.
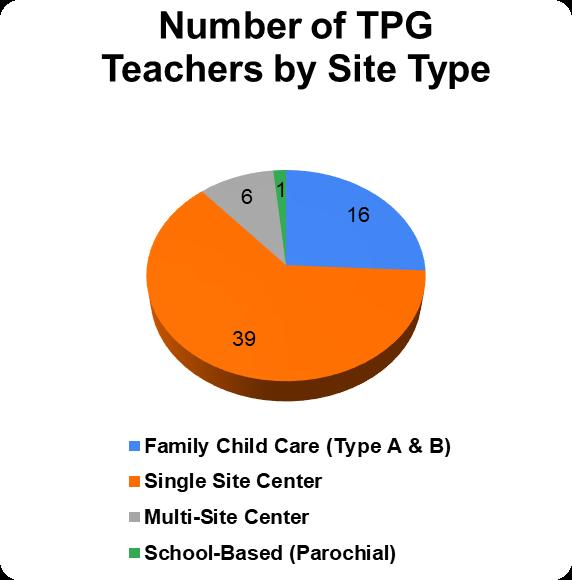
What is the distribution of Providers by Site
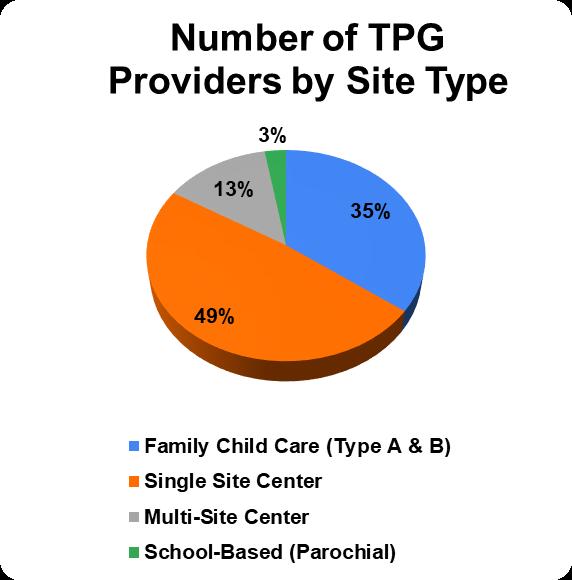
many Teachers receive grants by Site
Site
Family Child Care (Type
Site
Based (Parochial)
How many Quality Improvement Providers received Staff Support Fund in 2021 22?
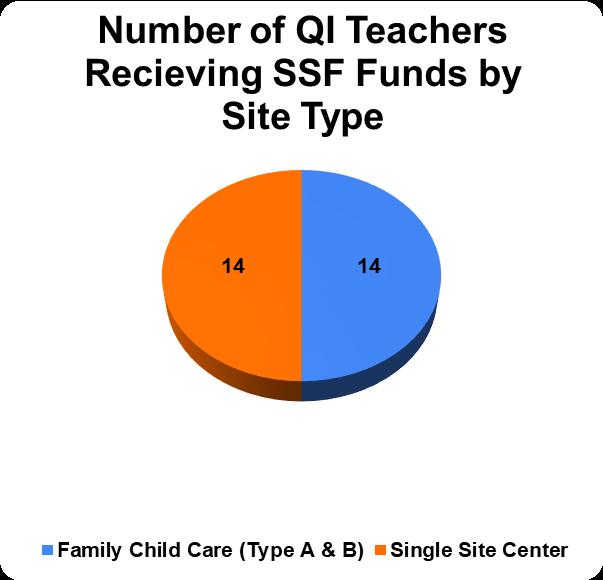
In the 2021-22 school year, 20 Quality Improvement Provider sites were awarded the Staff Support Fund to provide support to 28 Lead and Assistant Preschool Teachers. Sites were awarded grants up to $3,000 per Lead teacher not to exceed $18,000 per site.
What is the distribution of Providers by Site type, and how many Teachers receive grants by Site type?

