Upper Hunter Market Update 1st Half 2025

In Q4 2024, Upper Hunter* recorded a median house price of $576,000 and a median unit price of $430,000.This represents annual (Q4 2023Q4 2024)growth of 10.1% for houses and 8.9% forunits. Comparing Q4 2023and Q4 2024,total sales declined by -5.4% (to 159 sales) for houses and increased by 5.6% (to 19sales) for units. There is highly demanded market, with houses currently undersupplied. This suggests that now is an ideal time forhouse-owners to capitalise on their investments. At present there is limited new stock coming onto the market, indicating potential price increases. Thus,now is an ideal time for first home buyers.

HOUSE SALES YEAR HALF YEAR CHANGE FROM LAST
HOUSE MEDIAN PRICE
HOUSE RENTAL PRICE UNIT SALES UNIT MEDIAN PRICE
RENTAL PRICE

MEDIAN PRICE Q4 2024


Upper Hunter£ will see approximately $3.1Bofnewprojectscommencing constructionin2025
$576K $430K
MEDIAN PRICE Q4 2024
AVERAGE DAYS ON MARKET Q4 2024
58
AVERAGE DAYS ON MARKET Q4 2024


There are many solar farm and battery storage facilities tocommence in 2025. They include the Goulburn River solar Farm ($880.0M)and Edderton Joint Venture Solar Farm & Battery Storage ($850.0M). These projects will help with stimulating the local economy.
Residential projects to commence in Upper Hunter in 2025 include:
• 349Bridgman Road Residential Subdivision Stages 1-5 (384 Lots)
• 18 Kelso Street (19 Townhouses)
• 29Bishopgate Street Units (6 Units)
Although there are some residential projects planned, this is enough to answer current demand; especially for ready-to-sell houses. An undersupply remains, which will push up prices even further – for all property types.


AVERAGE VENDOR DISCOUNT*
Average vendor discount reflects the average percentage difference between the first list price and final sold price. A lower percentage difference (closer to 0.0%) suggests that buyers are willing to purchase close to the first asking price of a property.


Average vendor discounts between Q4 2023and Q4 2024 have tightened slightly to a lesser discount of -2.7% for houses and -1.9% for units. House and units' buyers can continue to benefit from discounts, as sellers are willing to accept below the first list price That said, with average vendor discounts tightening and very little new stock to come to market, buyers must act quickly.
The suburb of Denman has historically provided a more affordable median house price thanthe wider Upper Hunter Local Government Area (LGA) in the past 5years. This changed in 2024# as Denman’s house prices grew significantly and became a premium market (compared to the LGA). Units in Denman show the opposite pattern, of having premium market previously, but now a more affordable option compared to the LGA.
Most of the homes sold in Upper Hunter* across 2024were split evenly between the most affordable price bracket of $499,999and below (36.9%) and the premium price point, of $650,000and above (25.9%). Units had most sales in the affordable price bracket (51.9%), of less than $349,999 Overall, there is a home for every budget.
MARKET COMPARISON
The market comparison graph provides a comparative trend for median price of houses and units over the past 5 years. The main LGA chosen was based on their proximity to the main suburb analysed, which is Upper Hunter.


PRICE BREAKDOWN 2024


$350,000 to $399,999
$400,000 to $449,999
$450,000 to $499,999
$500,000 and above
RENTAL GROWTH 2025€
House rental yields in Upper Hunter¥ was 4.3%as of December 2024,above that of Hunter Region (3.6%) and the Sydney Metro (2.7%). Further, median house rental price increased by 3.8%in the past 12months to Q4 2024, at $550per week During this time, the number of houses rented decreased, by -8.6% (to 128houses in Q4 2024); thus, an undersupply. This indicates a highly demanded house rental market in Upper Hunter¥, which is beneficial to investors.
2-bedroom houses have provided investors with +12.5% rental growth annually, achieving a median rent of $450per week.
Upper Hunter¥ recorded a vacancy rate of 2.0% in December 2024, above the Hunter Region average of 1.2% buton par to Sydney Metro’s 2.1%. Vacancy rates have fluctuated significantly in the past 12 months, trending upwards to sit at its highest rate in the past 3years. This is due to a high number of investors entering the market. That said, a 2.0% vacancy rate is still below the Real Estate Institution of Australia’s healthy benchmark of 3.0%, indicating quicker occupancyof rentals properties This suggests there is still a conducive environment for investors.
RENTAL VACANCY RATES 2025


PROJECT DEVELOPMENT MAP 2025 ₳
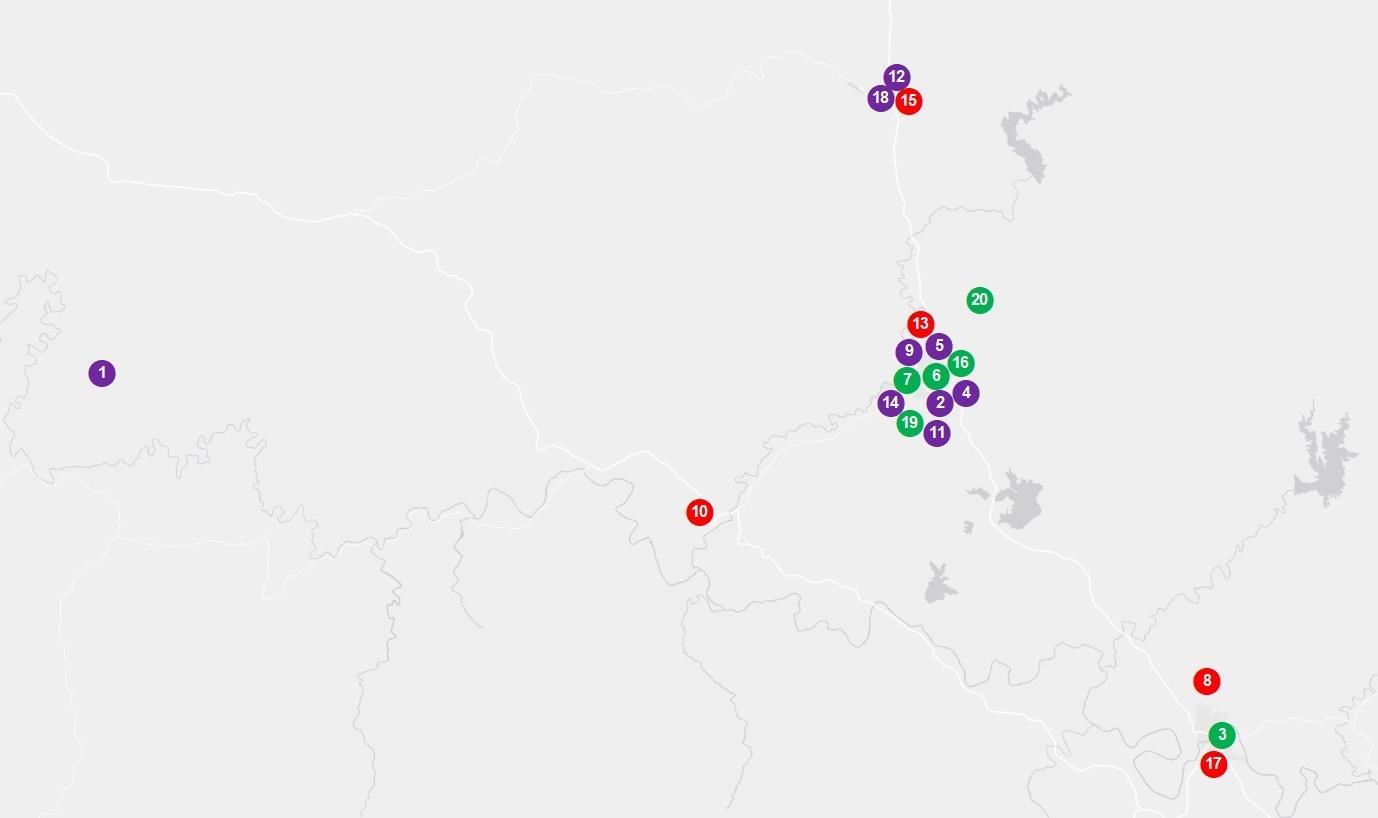
UPPER HUNTER


RESEARCH SERVICES
Our research services span over every suburb, LGA,and state within Australia; captured in a variety of standard and customised products, andinclude:
• Advisory and consultancy
• Market analysis including profiling and trends
• Primary qualitative and quantitative research
• Demographic and target market analysis
• Geographic information mapping
• Project analysis including product and pricing recommendations
• Rental and investment return analysis


OUR KNOWLEDGE
Access to accurate and objective research is the foundation of all good property decisions.
OUR PEOPLE
Our research team is made up of highly qualified researchers who focus solely on propertyanalysis.


REFERENCES
* Upper Hunter sales market data and key indicators encapsulates aggregate property market conditions within the suburbs of Denman, Muswellbrook, Merriwa, Scone, and Singleton.
** Estimated values are based on construction value provided by the relevant data authority and does not reflect commercial and/or re-sale value.
# 2024 encapsulates sales transactions for the 2024 full year (01/01/2024 – 31/12/2024).
€ Annual rental growth is a comparison between Q4 2023 (01/10/2023 – 31/12/2023)and Q4 2024 (01/10/2024 – 31/12/2024) house median rent figures.
¥ Upper Hunter rental market data encapsulates aggregate property conditions within the postcodes of 2328, 2329, 2330, 2333, and 2337.
§ Rental yields shown are as reported as of December 2024.
₳ Project development map showcases a sample of upcoming projects only, due to accuracy of addresses provided by the data provider for geocoding purposes.
£ Projects refers to the top developments within the suburb of Denman, Muswellbrook, Merriwa, Scone, and Singleton.
µ Estimated value is the value of construction costs provided by relevant data authority, it does not reflect the project’s sale/commercial value.
ψ Commencement date quoted for each project is an approximate only, as provided by the relevant data authority, PRD does not hold any liability to the exact date.
Source: APM Pricefinder, Cordell Connect database, SQM Research, Esri ArcGIS.
Disclaimer: PRD does not give any warranty in relation to the accuracy of the information contained in this report. If you intend to rely upon the information contained herein, you must take note that the information, figures and projections have been provided by various sources and have not been verified by us. We have no belief one way or the other in relation to the accuracy of such information, figures and projections. PRD will not be liable for any loss or damage resulting from any statement, figure, calculation or any other information that you rely upon that is contained in the material.
Prepared by PRD Research. © All medians and volumes are calculated by PRD Research. Use with written permission only. All other responsibilities disclaimed. © Copyright PRD 2025.