
Ramsgate Beach Market Update 2nd Half 2025

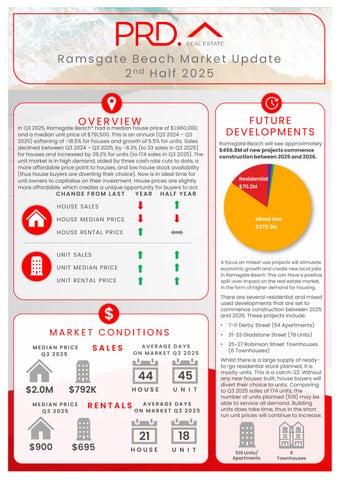
In Q3 2025, Ramsgate Beach* had a median house price of $1,960,000, and a median unit price of $791,500.This is an annual (Q3 2024– Q3 2025)softening of -18.5% for houses and growth of 5.5% for units. Sales declined between Q3 2024– Q32025,by -8.3% (to 33sales in Q3 2025) for houses and increased by 39.2%forunits (to 174sales in Q3 2025). The unit market is in high demand, aided by three cash rate cuts to date, a more affordable price point to houses, and low house stock availability (thus house buyers are diverting their choice). Now is in ideal time for unit owners to capitalise on their investment. House prices are slightly more affordable; which creates a unique opportunity for buyers to act.
CHANGE FROM LAST


Ramsgate Beach will see approximately $456.8Mofnewprojectscommence constructionbetween2025and2026.
YEAR HALF YEAR
HOUSE SALES
HOUSE MEDIAN PRICE
HOUSE RENTAL PRICE UNIT SALES
UNIT MEDIAN PRICE UNIT RENTAL PRICE

MEDIAN PRICE Q3 2025
$2.0M $792K
MEDIAN PRICE Q3 2025
AVERAGE DAYS ON MARKET Q3 2025
44
45
AVERAGE DAYS ON MARKET Q3 2025
HOUSE UNIT 21 18 $900


Afocuson mixed-useprojectswill stimulate economicgrowthandcreate newlocal jobs in RamsgateBeach.This can havea positive spill-overimpacton the realestate market, in the form of higher demandfor housing. There are several residential and mixed used developments that are set to commence construction between 2025 and 2026.These projects include:
• 7-11 Derby Street (54 Apartments)
• 31-33 Gladstone Street (78Units)
• 25-27Robinson Street Townhouses (6 Townhouses)
Whilst there is a large supply of readyto-go residential stock planned, it is mostly units. This is a catch-22. Without any new houses built, house buyers will divert their choice to units. Comparing to Q3 2025sales of 174units, the number of units planned (519) may be able to service all demand. Building units does take time, thus in the short run unit prices will continue to increase.


AVERAGE VENDOR DISCOUNT*
Average vendor discount reflects the average percentage difference between the first list price and final sold price. A lower percentage difference (closer to 0.0%) suggests that buyers are willing to purchase close to the first asking price of a property.


In the past 12months to Q3 2025average house vendor discount is still a premium; but have lowered significantly to a lesser premium of 3.2%.Similarly, average unit vendor discount have widened to a greater discount of -1.7% in Q3 2025. There is a unique opportunity in Ramsgate Beach, as sellers can still benefit from a premium (above the first list price) but buyers canalso benefit from lower premiums (not as high above the first list price as 12 months prior).
The suburb of Sans Souci has historically outperformed the wider Bayside Local Government Area (LGA) in both house and unit median prices. This continued in 2025#,with Sans Souci seeing significant growth; making it a far more premium market than the wider LGA.
Most of the homes sold in Ramsgate Beach* in 2025# are in the premium price point of $2,300,000and above (44.2%), in good news for owners. There is also a sizeable portion of houses sold in the most affordable price point of less than $1,699,999(22.1%). Units recorded most sales in the middle price point of $750,000and $849,999(22.3%) and the most affordable point of less than $649,999(22.1%). This reveals there are options for everyone in Ramsgate Beach*.
MARKET COMPARISON
The market comparison graph provides a comparative trend for the median price of houses and unit in the past 5 years. The main LGA profiled was chosen based on their proximity to the main suburb analysed, which is Sans

PRICE BREAKDOWN 2025


Less than $649,999
$650,000 to $749,999
$750,000 to $849,999
$850,000 to $949,999
$950,000 and above
Souci.
Sans Souci (2219) House Bayside LGA House
Sans Souci (2219) Unit Bayside LGA Unit
RENTAL GROWTH 2025€
House rental yields in Ramsgate Beach¥ was 3.3% in September 2025,higher thanthe Bayside LGA (2.8%) and Sydney Metro (2.7%) yields. This was paired with a 7.1% increase in median house price in the past 12 months to Q3 2025,at $900per week. At the same time the number of houses rented declined by -3.3%, to 29rentals in Q3 2025.The same pattern occurred in the unit rental market, suggesting an overall undersupply in Ramsgate Beach¥. This is beneficial to investors, especially with a slightly more affordable median house price in Q3 2025.
3-bedroom houses have provided investors with +14.1% rental growth annually, achieving a median rent of $960per week.
Ramsgate Beach¥ recorded a vacancy rate of 1.3%in September 2025, lower thanthe Bayside LGA’s 1.7% average, but onpar with the Sydney Metro’s average. Vacancy rates in Ramsgate Beach¥ decreased in the past 12 months, thus a tighter rental market. Further, a 1.3%vacancy rate is well below the Real Estate Institution of Australia’s healthy benchmark of 3.0%, which suggests quicker occupancy of rental homes. This is a conducive environment for investors.
RENTAL VACANCY RATES 2025


Ramsgate Beach (2217)
Bayside LGA
Sydney Metro
REIA 'Healthy' Benchmark
PROJECT DEVELOPMENT MAP 2025-2026 ₳
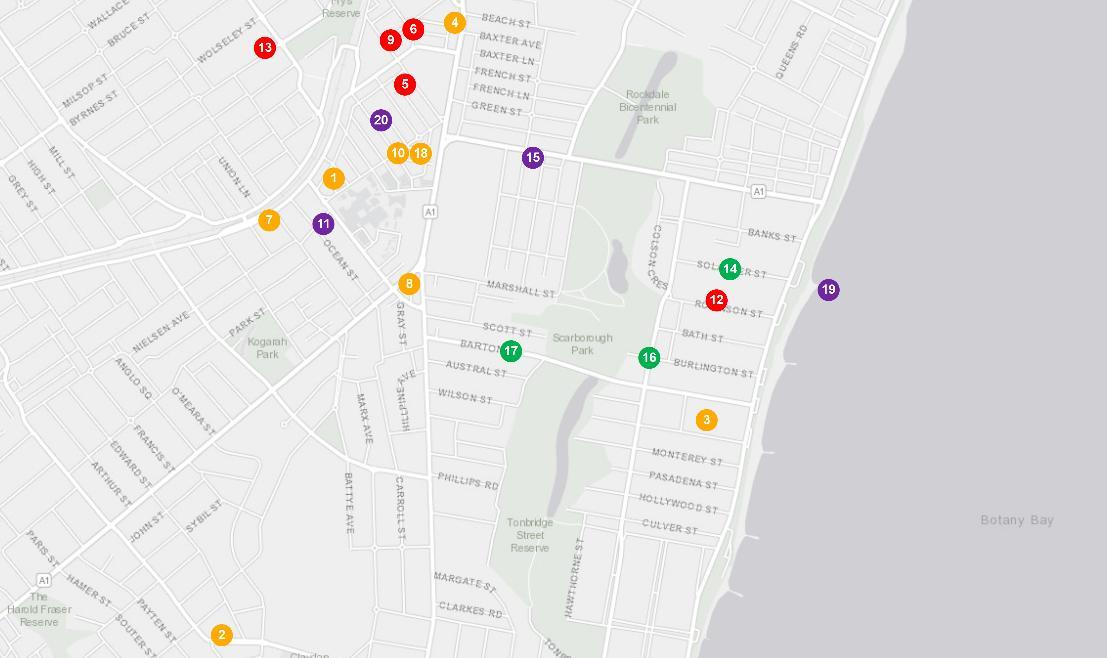

RAMSGATE BEACH


RESEARCH SERVICES
Our research services span over every suburb, LGA,and state within Australia; captured in a variety of standard and customised products, andinclude:
• Advisory and consultancy
• Market analysis including profiling and trends
• Primary qualitative and quantitative research
• Demographic and target market analysis
• Geographic information mapping
• Project analysis including product and pricing recommendations
• Rental and investment return analysis
OUR KNOWLEDGE
Access to accurate and objective research is the foundation of all good property decisions.
OUR PEOPLE
Our research team is made up of highly qualified researchers who focus solely on propertyanalysis.


REFERENCES
* Ramsgate Beach market data and key indicators encapsulates aggregate property market conditions within the suburbs of Ramsgate Beach, Kyeemagh, Kogarah, Sandringham and Monterey.
** Estimated values are based on construction value provided by the relevant data authority and does not reflect commercial and/or re-sale value.
# 2025 encapsulates sales transactions for the first three quarters of 2025 only (01/01/2025 – 30/09/2025).
€ Annual rental growth is a comparison between Q3 2024 (01/07/2024 – 30/09/2024)and Q3 2025 (01/07/2025 – 30/09/2025) house median rent figures.
¥ Ramsgate Beach market data encapsulates aggregate property conditions within the postcode of 2217.
§ Rental yields shown are as reported as of September 2025.
₳ Project development map showcases a sample of upcoming projects only, due to accuracy of addresses provided by the data provider for geocoding purposes.
£ Projects refers to the top developments within the suburbs of Ramsgate Beach, Kyeemagh, Kogarah, Sandringham and Monterey.
µ Estimated value is the value of construction costs provided by relevant data authority, it does not reflect the project’s sale/commercial value.
ψ Commencement date quoted for each project is an approximate only, as provided by the relevant data authority, PRD does not hold any liability to the exact date.
Source: APM Pricefinder, Cordell Connect database, SQM Research, Esri ArcGIS.
Disclaimer: PRD does not give any warranty in relation to the accuracy of the information contained in this report. If you intend to rely upon the information contained herein, you must take note that the information, figures and projections have been provided by various sources and have not been verified by us. We have no belief one way or the other in relation to the accuracy of such information, figures and projections. PRD will not be liable for any loss or damage resulting from any statement, figure, calculation or any other information that you rely upon that is contained in the material.
Prepared by PRD Research. © All medians and volumes are calculated by PRD Research. Use with written permission only. All other responsibilities disclaimed. © Copyright PRD 2024.