DATA IS FUEL FOR YOUR OPERATION
YOUR FARM RUNS ON DATA

Every day, you manage a lot of details: yield projections, seed varieties, machine maintenance, labor schedules, soil health, tillage practices…the list goes on and on. However, by turning those details into data you can use, you will notice changes in your operation.
• You are equipped with the right information when you need it to make your next big or small decision.
• You are spending time and energy on what matters most to you—whether on the farm or away from it.
• You notice that your business is becoming more efficient, productive, and profitable.
Digital tools help you collect, share, and analyze information for your operation. At a minimum, they can simplify and automate your recordkeeping. Fully implemented, they can help you evaluate and improve your farm’s performance like never before.
To use these tools, you need connected machines. A connected machine, coupled with a Generation 4 display, allows the seamless and automatic flow of your data to digital platforms such as John Deere Operations Center TM. When plans change, a connected machine allows you to adjust quickly and from anywhere. You’ll be able to update varieties, prescriptions, send new work plans and more. Here are a few ways you can get connected to the data you need to make smart decisions about situations that challenge your operation
John Deere Connected Support™ tools help get you going when field conditions are right. You can plan maintenance, enable your dealer to remotely update displays and receivers giving you the latest features and fixes, and Remote Display Access helps you quickly train operators in-cab from anywhere so you’re always ready.
Whether you’re planting, spraying or harvesting, you need to keep running when conditions are right. Are your machine settings optimized for the job at hand? Do you know what work has been done and what is yet to complete? Do you have the support needed from your dealer to get you back and running quickly when you encounter machine issues? With a John Deere connected machine, you or your dealer can:


• Receive notifications of machine issues as they happen
• Remotely diagnose your machine making sure it’s fixed correctly the first time
• Monitor live progress in-field

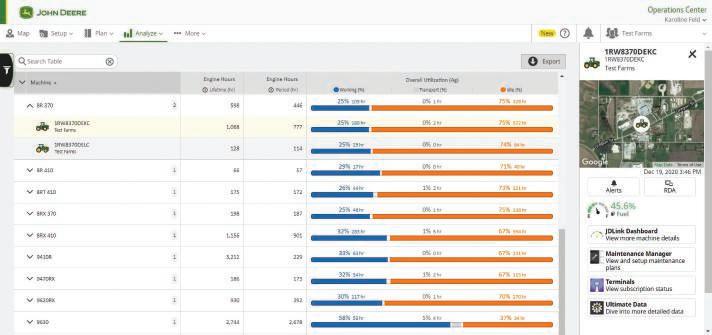
Now that the work is done, it’s time to analyze results. Do you know which machines had the best fuel usage? Do you know your average combine ground speed? Do you know which machines had the highest use rate? Machine Analyzer gives you answers to these questions and more. You can view:

Machine data is a crucial part of the value of data in your operation, but it’s not the full story. Now that you’ve harnessed value of machine data, it’s time to talk about agronomics.
• Fuel consumed (gal/litres)
• Machine utilization with idle, working, and transport times (hr)
• Average Engine Load Factor (%)
• Average Engine Speed (RPM)
• Average ground speed (mph/km/h)

View planting job details in work summary cards
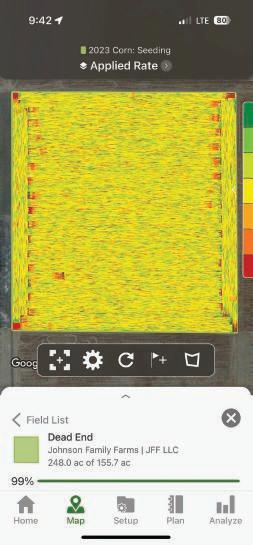

View planting data layers and share PDF reports
It’s late winter, and your planter is ready to go. But is your planting plan ready? Do you know how each variety yielded last year? What about trying new varieties this year?
Inside the Operations Center, you can determine what varieties yielded the best last year and plan which crops and varieties to plant in each field this year. So, when the weather and field conditions are right, you or your operator will be ready to go, knowing which variety to plant where.
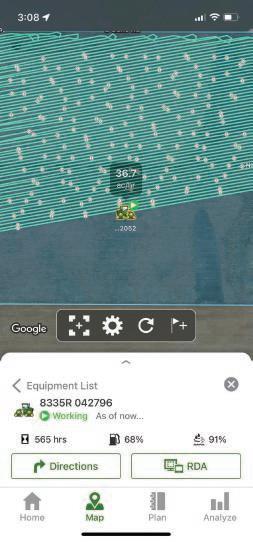

View the location history of each machine and monitor progress
Whether it’s you driving the tractor or someone else, you have to know what’s going on. Where are your machines? Are the settings right? Are you planting the varieties you intended in each field? How close are you to finishing?
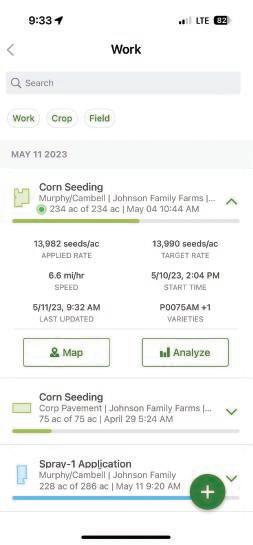
Using Operations Center mobile, you can see what’s happening now and in the past:
• Machine location
• Job details like population rates, varieties, speed, start and stop times
• Machine settings
• Progress in each field
• Maps of what you planted where
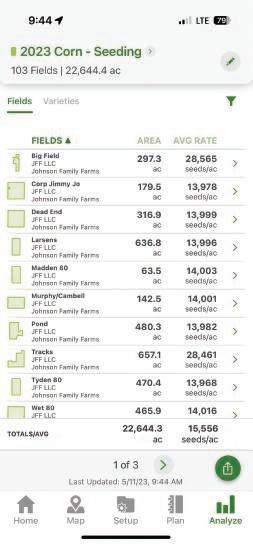

View field plant dates

View variety performance across your operation
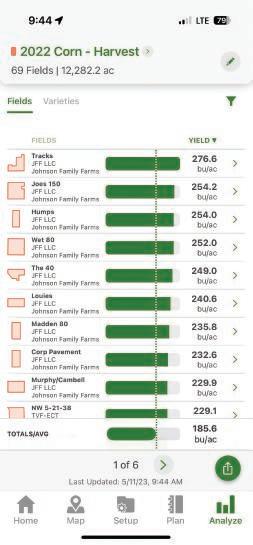


It’s time to see the results of your work — it’s harvest. Which field do you harvest first? How did each variety perform? Do you have a picture of your total yield?
There are several tools that can help you evaluating your year’s performance. Operations Center mobile provides quick reference points to help you decide when and where to harvest. At a glance you’ll know:
• When you planted each field
• Which varieties you planted where
• Moisture content from your completed passes
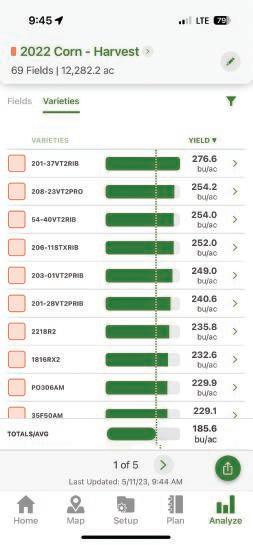
When the job is done, you can dig deeper into your harvest results. Inside the Operations Center you can analyze:
• Which varieties performed the best
• Your total bushels of each crop from the year
• Machine and operator performance
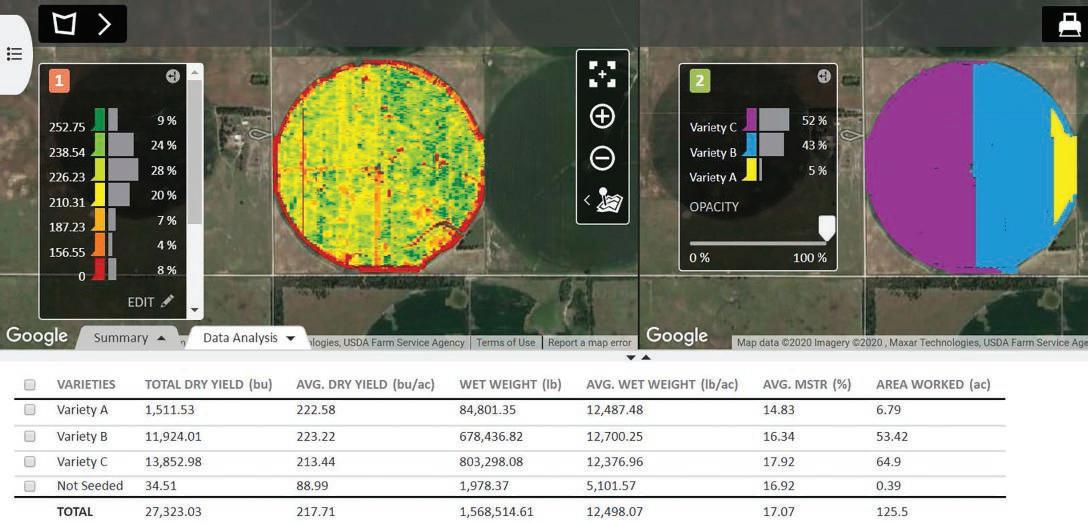
The map on the left shows harvest results for a particular field, while the map on the right indicates the three seed varieties planted in that field. The grower was testing Variety A as a new seed variety for this field. The harvest yield map reveals a clear line, showing that both Variety A and Variety B out-performed Variety C.
To go even deeper in analyzing these yield differences by variety, you can look at the details in the Data Analysis Drawer (the table of data below the maps). The data shows that Variety A yielded within one bushel per acre of top-performing Variety B in this field. Variety C fell short, performing 10 bushels per acre less than Varieties A and B. Digging into the data at this level can help you decide what to plant again next year—and what to leave out of the mix.
After analyzing your year’s success, you can start to prepare for next season. With all your data in one place you can easily organize and share details with trusted partners like your agronomist, banker, or landlord. As you continue building the historical record of your operation’s performance, you will be even better positioned to make decisions in the future.
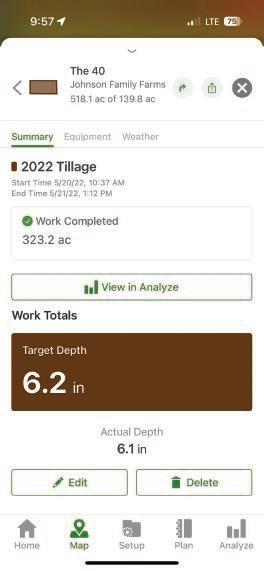
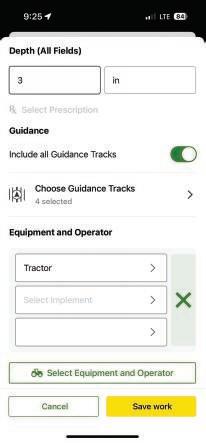
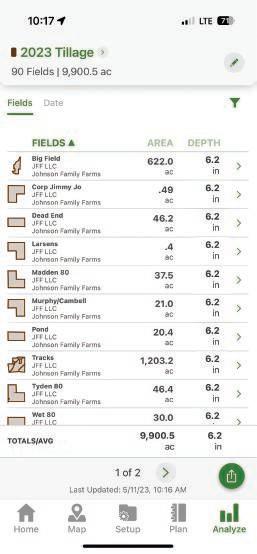
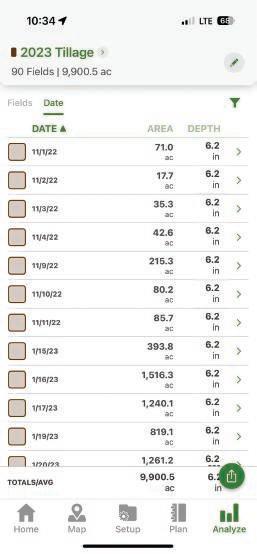
Looking at last season’s collected data can help you plan for each production step this year. Have you looked at last season’s tillage data? Did you or your operator meet the planned speed and depths? Have you decided which fields will be worked in the fall, spring, both, or no-till? Did you see a relationship between your tillage settings and yields?
Inside the Operations Center, you can see how well the completed work compared to your plans. You can also look for high or low performing areas of the field and determine if any variations in tillage settings made an impact. Based on these insights, you can create a plan that will help you maximize crop production.
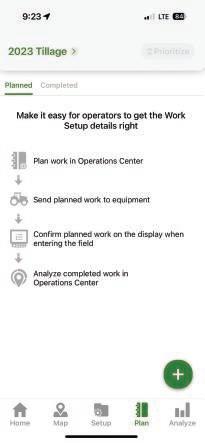
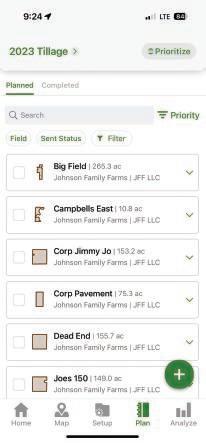
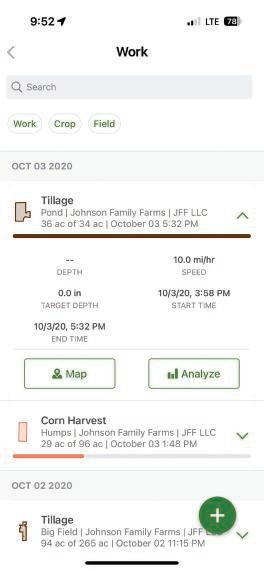
Using Operations Center mobile, you can see what’s happening now and get a quick refresher on what remains to be done: View
Whatever the job, you want a clear view of what’s happening. Where are your operators? Are your machines in the right field? Is the job getting done to your standards? Which fields still need to be worked?
• Machine location
• Job details like area covered, average speed, average depths, and start and stop times
• Progress in each field
• Maps that show where you achieved which speeds and depths


When harvest is wrapping up, and before you start preparing the ground for next season, you could really use a good assessment of how your residue management affected each field. If you varied settings on the tillage pass, did those changes result in varied yields? Did testing a new practice—such as no-till or tilling at a different time of year—help or hurt your yields? Did your machine operators follow directions?
When the job is done, you can dig deeper into the affect of your tillage practices field by field. Inside the Operations Center you can analyze:
• How tillage setting changes in a field correlated with yields
• Machine and operator performance
• How a new tillage practice affected performance in a field

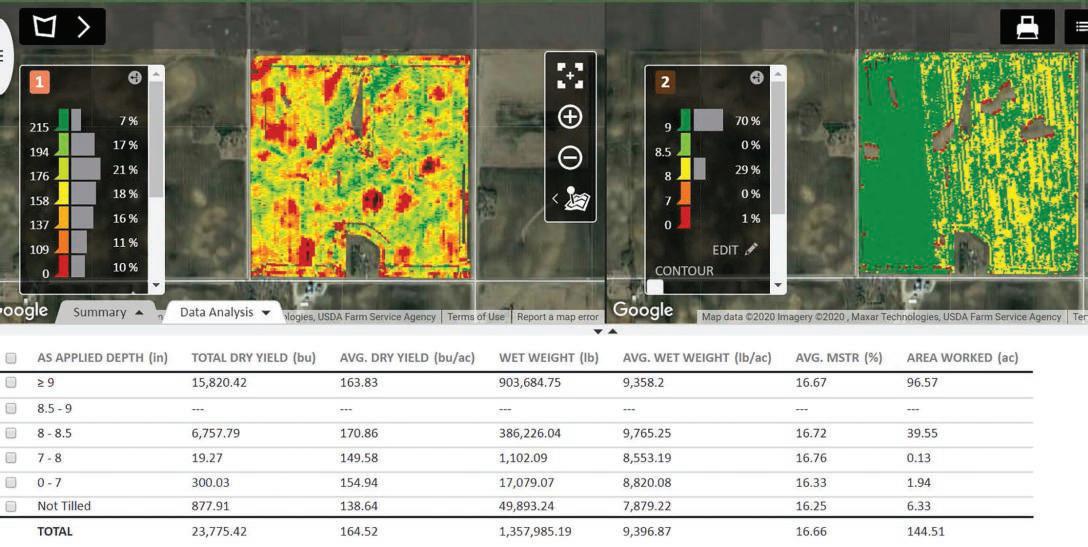
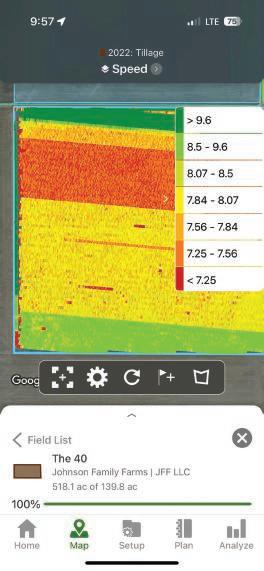
The map on the left shows harvest results from the year prior. Notice that the lowest yields (the “hot” spots on the map) are concentrated more on the left side of the field. The map on the right shows how this field was prepared in the fall. It was tilled at two different depths: dark green indicates tillage at 9 inches and deeper, while yellow shows a tillage depth between 8 and 8.5 inches. At a glance, you can see that shallower tillage resulted in higher yields in this particular field.
To get an even better look at how these two maps correlate, notice the details in the data analysis drawer (the table of data below the maps). Reading across the rows of data, you can see that areas tilled at 9 inches or deeper had an average yield of 164 bu/acre, while areas tilled at 8 to 8.5 inches had an average yield of 171 bu/acre. That’s a 7 bushel increase in areas with the shallower tillage setting.
Working from information like this, you can make decisions about how to adjust your tillage passes to improve yields. Keep tracking this data over time, and in a few years, you may be able to pin down the precise tillage depth that is best for your field.
The Operations Center also offers maps that show how different operators perform their work—how fast, how accurately, how true to your plan. Reviewing these maps may give you insights that help you find your best operator for each job.
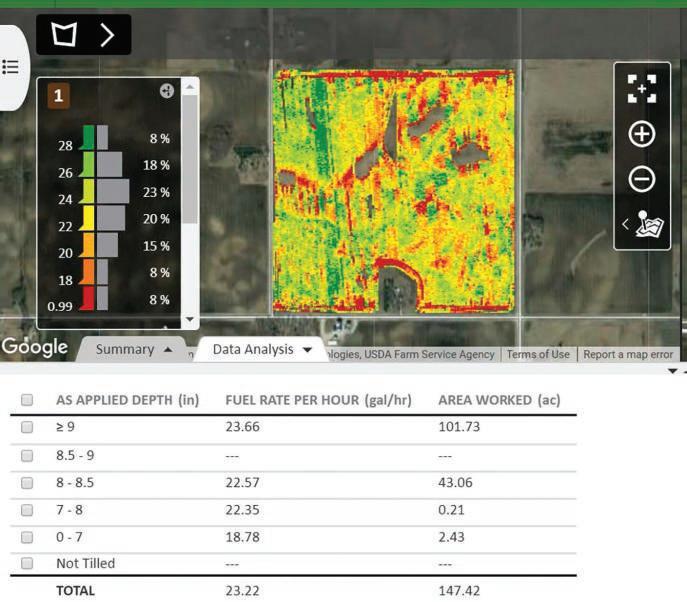
Yield and depth are two important aspects of this story. Now, what about fuel? Here’s another view of that same field. Here, green represents the areas of highest fuel consumption. Based on the colors in the map and the Data Analysis drawer (the table of data below the maps), you can see that areas tilled 9 inches or deeper used more fuel than those tilled at the shallower 8-8.5 inches. In this field, tilling at the shallower depth not only generated higher yields, it burned less fuel.
After analyzing the full story—from tillage through harvest—you will be more prepared to plan your next steps.
Maybe your current tillage practices provide the results you want, or maybe you’ve discovered some details that suggest you should make some changes. Whether you land on one clear answer or a set of workable options, you’ll have solid ideas about how to take your operation to the next level. Interested in seeing this kind of tillage data for your operation? TruSet™ is an option on several of John Deere’s newest tillage tools, and it’s available in a retrofit kit for older John Deere tillage tools. To learn more about TruSet, visit JohnDeere.com or talk with your local dealer today.

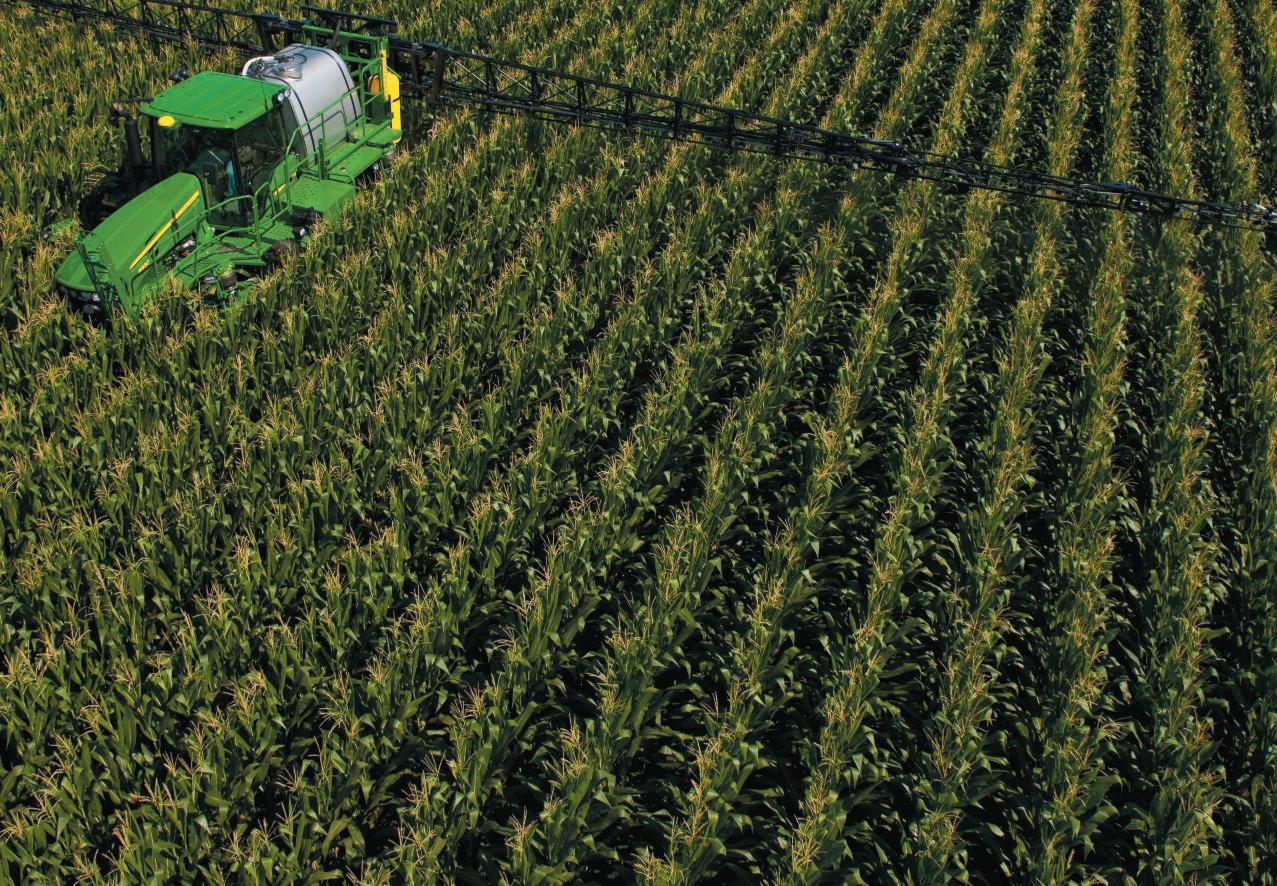
It’s important to have a plan in place—not just for planting and harvest, but throughout the growing season. How will you control weeds and diseases? Are you spraying the fields yourself or hiring a custom applicator? Which herbicides and/or fungicides will you apply and where?
Inside the Operations Center, you can look back at what you applied to each field last year so you can start making decisions for seasons to come. You can also plan how you’ll use your products—giving you or your operator a convenient way to document exactly what you’ve applied, when, where, and how.
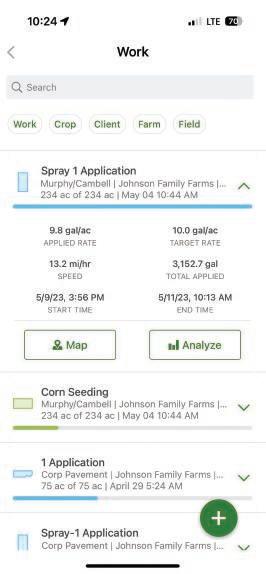
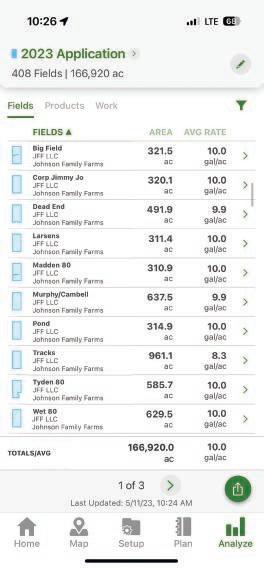
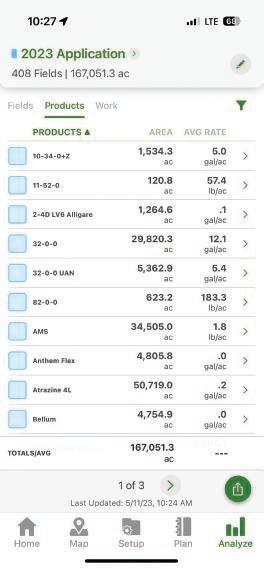
Application can be a costly, sensitive process. To be sure you’re using those inputs wisely, you need to keep track of all the details associated with every application pass. Was the right product applied? Which fields were completed today? How much product did we use?
Using Operations Center mobile, you can see what’s happening now and in the past:
• Job details like product type, actual rate, speed, total product used, and start and end times•
• Progress in each field
• Maps of where product was applied
• Machine location


Once harvest wraps up, you can dig into details of the year’s work to see how each field performed and how various factors played into your yields. Which fields received an application of herbicide or fungicide? What products did you use this season? How did applying each product affect your yields?
Operations Center mobile provides quick reference points to review your application passes from the year. At a glance you can know:
• Which fields had product applied and total area covered
• When each field had product applied
• List of all products used each season
Inside the Operations Center, you can dig even deeper into your results by analyzing:
• Which application products boosted or maintained yields
• Operator and machine performance
• Impacts of products and rates

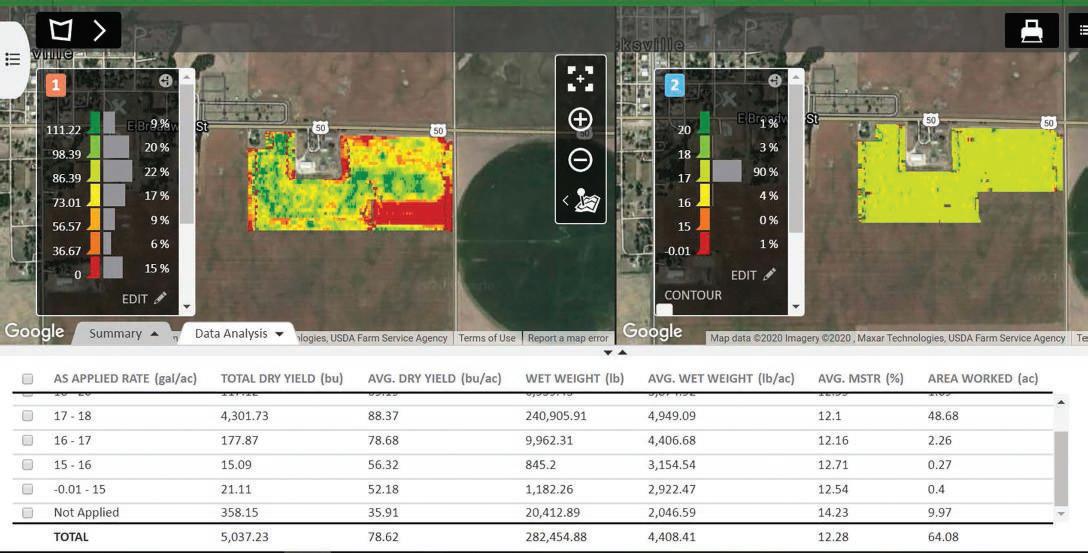
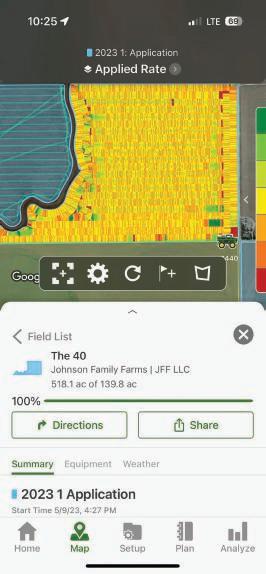
Looking at the map on the right, you can see that fungicide was applied to most of the field, but not all. Notice the lower right corner of the field, which received no application. The corresponding area on the harvest map shows very low yield.
As further evidence of what happened, you can look at the Data Analysis drawer (the table of data below the maps), which shows not only harvest yield and application data, but application rate. In areas where no fungicide was applied, the yield was 53 bu/acre lower than the top-yield areas, where the product was applied at a rate of 17-18 gal/acre.
This is only one year, one field, and one trial’s data. Before making significant agronomic decisions, you would want to test and analyze results over multiple years. To guide your trials from year to year, data like this—about how specific products and varying application rates influence yields—can help you decide what to try next season.
AT JOHN DEERE, WE LIKE TO SAY THAT DATA IS FUEL FOR YOUR OPERATION. IT’S A VALUABLE ASSET YOU CAN USE TO PRODUCE THE BEST POSSIBLE RESULTS—EVERY PASS, EVERY SEASON, EVERY YEAR.
Knowledge. It’s having the right information when you need it to make decisions.
Time. It’s feeling certain you’re spending time on actions that will generate positive results.
Profit. It’s doing everything you can to run an efficient, productive, profitable business.
On these pages, we’ve illustrated just a few ways you could turn data into value for your operation. As you explore the data management tools available, you’ll discover many more possibilities.
The John Deere Operations Center is a great starting point. It’s like home base for your operation—a place to collect, organize, and analyze your data. It’s also a gateway to many other data management tools designed to tackle specific tasks like analyzing yield, keeping track of inputs, and creating prescriptions.
Your John Deere dealer can help you choose and use all these tools. To tap into the power of your data, contact your John Deere dealer today.
HOW DO I GET DATA IN THE OPERATIONS CENTER?
There are four ways to upload data into Operations Center:
1. Data Sync – with Generation 4 Display*
2. Wireless Data Transfer*
3. MyTransfer™ app
4. USB stick (manually)
*Requires JDLink™ service
JohnDeere.com/ OpsCenterUploadData
CAN I BRING DATA INTO THE OPERATIONS CENTER
IF I AM NOT USING ALL JOHN DEERE EQUIPMENT?
Yes. Learn which displays and file types are compatible with the Operations Center at JohnDeere. com/OpsCenterCompatibility
HOW DO I GET STARTED IN THE OPERATIONS CENTER?
That’s easy – simply create a free account. Go to OperationsCenter. Deere.com and select “Create an Account.” You’ll then be prompted to “Create an Organization.”
WHERE DO I GO TO LEARN MORE ABOUT THE OPERATIONS CENTER?
• Help Documentation – accessed inside the Operations Center
• John Deere YouTube Channel – Operations Center Playlist
• Your local John Deere Dealership
• JohnDeere.com
WHO CAN I SHARE MY DATA WITH?
Share only the data you want with only the people you trust to help you get the job done. Need help? To read more visit:
JohnDeere.com/ OpsCenterDataSharing