PQ ACCA F2 & F5 papers
Can I take your order please? Tom Bulman explains all about the Economic Order Quantity and offers an example to explain the theory he Economic Order Quantity (EOQ) is something you’ll see a few times in your ACCA studies: in F2, F5, F9 and beyond into the Strategic Professional Papers. It is a very simple calculation, but one that nevertheless can cause problems for students. First, let’s be clear about what the EOQ does. It tells a company how many units to order when they contact their supplier. Let’s say my company makes chairs from planks of wood. How much wood should I order from the timber merchant? One plank, 100 planks, 1000 planks? The EOQ will tell me. The clue’s in the title: economic (meaning optimal), order, quantity… The EOQ only takes account of three things: 1. Co – the cost of placing an order. This is literally the cost of picking up the phone or completing an online form and making an order. In the real world, this would include the time taken to place an order as well as any order booking fees charged by the supplier. 2. D – the demand. This is the annual requirement for the goods being ordered. How many planks does my company need in total in one year? 3. Ch – the holding cost. This is the cost of storing one unit (plank) for one year. This will include all costs related to the storage of inventory, for example, warehouse rental, insurance, security costs and so on. The EOQ is calculated as: 2 x Co x D Ch This is a very easy formula to remember using the mnemonic ‘two cod and chips wrapped in paper’! You can see in the formula the top line is ‘2 CoD’ and the bottom line is ‘Ch’ for ‘chips’. The square root provides the paper wrapping! What the letters stand for is also very straightforward, as unlike many other formula, the letters correspond exactly to what they represent. Co is the cost of the order, D is demand, and Ch is the cost of holding the inventory.
T
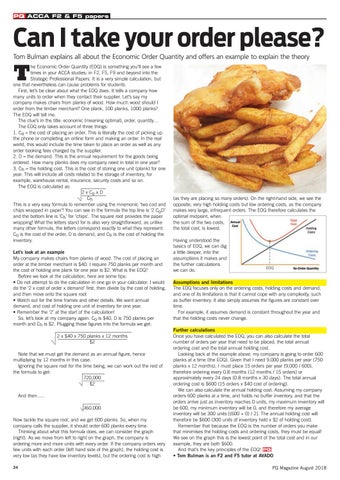
Let’s look at an example My company makes chairs from planks of wood. The cost of placing an order at the timber merchant is $40. I require 750 planks per month and the cost of holding one plank for one year is $2. What is the EOQ? Before we look at the calculation, here are some tips: • Do not attempt to do the calculation in one go in your calculator. I would do the ‘2 x cost of order x demand’ first, then divide by the cost of holding, and then move onto the square root • Watch out for the time frames and other details. We want annual demand, and cost of holding one unit of inventory for one year. • Remember the ‘2’ at the start of the calculation! So, let’s look at my company again. Co is $40, D is 750 planks per month and Ch is $2. Plugging those figures into the formula we get: 2 x $40 x 750 planks x 12 months $2 Note that we must get the demand as an annual figure, hence multiplying by 12 months in this case. Ignoring the square root for the time being, we can work out the rest of the formula to get: 720,000 $2 And then….. 360,000 Now tackle the square root, and we get 600 planks. So, when my company calls the supplier, it should order 600 planks every time. Thinking about what this formula does, we can consider the graph (right). As we move from left to right on the graph, the company is ordering more and more units with every order. If the company orders very few units with each order (left hand side of the graph), the holding cost is very low (as they have low inventory levels), but the ordering cost is high 24
(as they are placing so many orders). On the right-hand side, we see the opposite; very high holding costs but low ordering costs, as the company makes very large, infrequent orders. The EOQ therefore calculates the optimal midpoint, when the sum of the two costs, the total cost, is lowest. Having understood the basics of EOQ, we can dig a little deeper, into the assumptions it makes and the further calculations we can do. Assumptions and limitations The EOQ focuses only on the ordering costs, holding costs and demand, and one of its limitations is that it cannot cope with any complexity, such as buffer inventory. It also simply assumes the figures are constant over time. For example, it assumes demand is constant throughout the year and that the holding costs never change. Further calculations Once you have calculated the EOQ, you can also calculate the total number of orders per year that need to be placed, the total annual ordering cost and the total annual holding cost. Looking back at the example above, my company is going to order 600 planks at a time (the EOQ). Given that I need 9,000 planks per year (750 planks x 12 months), I must place 15 orders per year (9,000 / 600), therefore ordering every 0.8 months (12 months / 15 orders) or approximately every 24 days (0.8 months x 30 days). The total annual ordering cost is $600 (15 orders x $40 cost of ordering). We can also calculate the annual holding cost. Assuming my company orders 600 planks at a time, and holds no buffer inventory, and that the orders arrive just as inventory reaches 0 units, my maximum inventory will be 600, my minimum inventory will be 0, and therefore my average inventory will be 300 units [(600 + 0) / 2]. The annual holding cost will therefore be $600 (300 units of inventory held x $2 of holding cost). Remember that because the EOQ is the number of orders you make that minimises the holding costs and ordering costs, they must be equal! We see on the graph this is the lowest point of the total cost and in our example, they are both $600. And that’s the key principles of the EOQ! PQ • Tom Bulman is an F2 and F5 tutor at AVADO PQ Magazine August 2018