
Volume XXXIV - Issue I - March., 2024
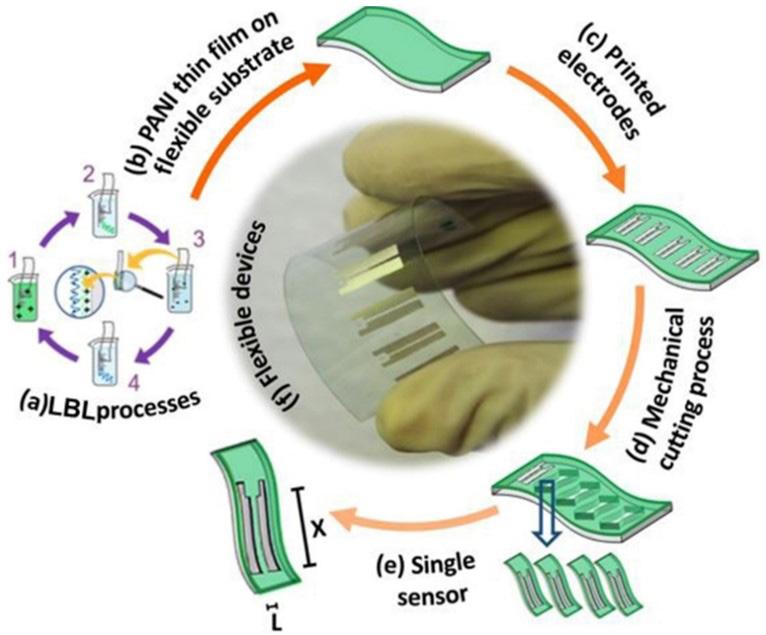
Fabrication process of ultra-thin PANI/PVS-based flexible gas sensor devices
Centro de Caracterização e Desenvolvimento de Materiais/DEMa/UFSCar
Propriedades químicas, reológicas processamento
polimeros@ccdm.ufscar.br

(016) 9 8146 6558

Somos um centro multiusuário de Serviços Tecnológicos, Pesquisa, Desenvolvimento e Inovação em materiais
Propriedades Mecânicas, Físicas, Térmicas
Caracterização e identificação de polímeros.
Desenvolvimento de Compósitos e Blendas Poliméricas.
Análises de falhas.
incompany. www.ccdm.ufscar.br
Cursos e consultoria
P olímero S
e d I tor I al C ou NCI l
Antonio Aprigio S. Curvelo (USP/IQSC) - President m ember S
Ailton S. Gomes (UFRJ/IMA), Rio de Janeiro, RJ (in memoriam)
Alain Dufresne (Grenoble INP/Pagora)
Bluma G. Soares (UFRJ/IMA)
César Liberato Petzhold (UFRGS/IQ)
Cristina T. Andrade (UFRJ/IQ)
Edson R. Simielli (Simielli - Soluções em Polímeros)
Edvani Curti Muniz (UEM/DQI)
Elias Hage Jr. (UFSCar/DEMa)
José Alexandrino de Sousa (UFSCar/DEMa)
José António C. Gomes Covas (UMinho/IPC)
José Carlos C. S. Pinto (UFRJ/COPPE)
Júlio Harada (Harada Hajime Machado Consutoria Ltda)
Luiz Antonio Pessan (UFSCar/DEMa)
Luiz Henrique C. Mattoso (EMBRAPA)
Marcelo Silveira Rabello (UFCGU/AEMa)
Marco Aurelio De Paoli (UNICAMP/IQ)
Osvaldo N. Oliveira Jr. (USP/IFSC)
Paula Moldenaers (KU Leuven/CIT)
Raquel S. Mauler (UFRGS/IQ)
Regina Célia R. Nunes (UFRJ/IMA)
Richard G. Weiss Washington, DC, United States (GU/DeptChemistry) (in memoriam)
Rodrigo Lambert Oréfice (UFMG/DEMET)
Sebastião V. Canevarolo Jr. (UFSCar/DEMa)
Silvio Manrich (UFSCar/DEMa)
Financial support:
Available online at: www.scielo.br

e d I tor I al C omm I ttee
Sebastião V. Canevarolo Jr. – Editor-in-Chief
a SS o CI ate e d I tor S
Alain Dufresne
Bluma G. Soares
César Liberato Petzhold
José António C. Gomes Covas
José Carlos C. S. Pinto Marcelo Silveira Rabello
Paula Moldenaers
Richard G. Weiss (in memoriam) Rodrigo Lambert Oréfice
d e S kto P P ubl IS h IN g
www.editoracubo.com.br
“Polímeros” is a publication of the Associação Brasileira de Polímeros
São Paulo 994 St. São Carlos, SP, Brazil, 13560-340
Phone: +55 16 3374-3949
emails: abpol@abpol.org.br / revista@abpol.org.br http://www.abpol.org.br
Date of publication: March 2024
Polímeros / Associação Brasileira de Polímeros. vol. 1, nº 1 (1991) -.- São Carlos: ABPol, 1991-
Quarterly v. 34, nº 1 (March 2024)
ISSN 0104-1428
ISSN 1678-5169 (electronic version)
1. Polímeros. l. Associação Brasileira de Polímeros.

Website of the “Polímeros”: www.revistapolimeros.org.br
ISSN 0104-1428 (printed) ISSN 1678-5169 (online) P olímero S - I SS ue I - V olume XXXIV - 2024 I ndexed I n : “C hem IC al a bstra C ts ” — “ ra P ra a bstra C ts ” — “a ll - r uss I an I nst I tute of s CI en C e and t e C hn IC al I nformat I on ” — “ l at I ndex ” — “W eb of s CI en C e ”
Polímeros, 34(1), 2024 E1
E E E E E E E E E E E E E E
o r I g IN al a rt IC le
Development of mulch films from biodegradable polymer and agro-industrial waste
Railha Antunes de França, Ana Carolina Ferreira dos Santos Rosa, Cristiano José de Farias Braz, Renata Barbosa and Tatianny Soares Alves .........................................................................................................................................................................e20230042
Welding parameters process study of non-metallic expansion joints polymeric composite
Marcos Dorigão Manfrinato, Eduardo de Campos Leite, Rafael Roberto Pavani, Henrique Boschetti Pereira, Lucas Camargo Soares Carvalho da Silva and Luciana Sgarbi Rossino e20240002
Thermodynamics of the polymerisation of polyglycerols in an acidic and micellar environment
Vadilson Malaquias dos Santos, Fabricio Uliana, Rayanne Penha Wandenkolken Lima and Eloi Alves da Silva Filho e20240003
Nanocellulose reinforced starch biocomposite films via tape-casting technique
Giovana Ladislau Garuti, Roberta Ranielle Matos de Freitas, Vitor Hugo de Lima, Karina Palmizani do Carmo, Franciane Andrade de Pádua and Vagner Roberto Botaro, e20240004
Effect of thyme essential oil on the properties of poly (butylene adipate-co-terephthalate)(PBAT)
Pâmela Barcelar Ferreira Gomes da Silva de Luna, Viviane Fonseca Caetano, Michelle Félix de Andrade, Ivo Diego de Lima Silva, Tiago Lopes de Araújo, Karina Carvalho de Souza, Yêda Medeiros Bastos de Almeida and Glória Maria Vinhas e20240005
Low-cost and novel Arduino®-Load cell-based prototype to determine transition temperatures
Luis Carlos Rodríguez-Pacheco, Francisco Paraguay-Delgado, Rubén Castañeda-Balderas, María Luisa Camacho-Ríos, Guillermo Manuel Herrera-Pérez, Iván Alziri Estrada-Moreno and Daniel Lardizábal-Gutiérrez e20240006
Compatibility and cytotoxicity of poly(ε-caprolactone)/polypyrrole-block-poly(ε-caprolactone) blend films in fibroblast bovine cells
Nelson Luis Gonçalves Dias de Souza , Grasiele Soares Cavallini , Tiago Teixeira Alves, Michele Munk Pereira, Humberto de Mello Brandão and Luiz Fernando Cappa de Oliveira e20240007
Polysaccharide from Cumaru (Amburana cearensis) exudate and its potential for biotechnological applications
José Regilmar Teixeira da Silva, Iranildo Costa Araújo, Eziel Cardoso da Silva, Moisés das Virgens Santana, Geanderson Emilio de Almeida, Emanuel Airton de Oliveira Farias , Laís Ramos Monteiro de Lima, Regina Célia Monteiro de Paula, Durcilene Alves da Silva, Alyne Rodrigues Araújo and Carla Eiras e20240008
Development by extrusion of composite films based on Poly(Lactic Acid)/Babassu Mesocarp Flour
Lucas Rafael Carneiro da Silva, Railha Antunes de França, Raquel do Nascimento Silva, Tatianny Soares Alves, Renata Barbosa, Alessandro de Oliveira Rios and Ruth Marlene Campomanes Santana e20240009
Bio-high density polyethylene films embedded with organoclay and zinc pyrithione Priscylla Jordânia Pereira de Mesquita, Cristiano José de Farias Braz, Tatianny Soares Alves and Renata Barbosa .....................e20240010
A methodology for determination the inlet velocity in injection molding simulations
Diego Alves de Miranda, Willian Kévin Rauber, Miguel Vaz Jr. and Paulo Sergio Berving Zdanski e20240011
All-polymer-based ammonia gas sensor: applying insights from the morphology-driven ac electrical performance
Ana Carolina Kelmer, Cleidinéia Cavalcante da Costa and Rodrigo Fernando Bianchi e20240012
e d I tor I al S e C t I o N News E3 Agenda ................................................................................................................................................................................................ E4 Funding Institutions E5
E2 Polímeros, 34(1), 2024 E i E E i
Biobased and biodegradable polymers for a sustainable future: prosperity partnership full team meeting
Further to the award in 2023 of a £2.5M Prosperity Partnership Grant from EPSRC (total value £5M), efforts have been underway at the partners involved (Croda, a global leader in high performance ingredients and technologies, based in Yorkshire, the University of Nottingham, and the University of York) to develop the next generation of polymer liquid formulations.
Used in a number of day-to-day items including crop protection and personal care products, these special polymers for liquids provide the key function of emulsification and stabilisation, without which, widely used items would be unable to meet consumer requirements. Despite their critical part in formulations, to date there has been no coordinated effort to develop more sustainable versions, and it is estimated that more than 36 million tonnes (enough to fill Wembley Stadium 32 times over) of these polymers are not recovered after use, entering the environment as plastic waste.
With all PhDs for the project now fully recruited, the full team met for the first time at Croda’s Ditton site on 22 January. Updates were received from all work packages, and team members were able to see first-hand how some of the first polymers being formed on this project are performing, with live real time demonstrations of performance.
Source: University of York – york.ac.uk
Indigenous equipment developed for mechanical recycling of waste thermoplastic polymers to composites
A single screw extruder was developed for mechanical recycling through melt-mixing of waste thermoplastic polymers and inorganic particulate fillers can help manufacture and characterize polymer composites that can be moulded to the required shape for making paver blocks, tiles, and bricks. At present, commercially available melt-mixing equipment are not designed for handling waste thermoplastic polymers that are often adhered by contaminants, as the barrel and screw system are not robust enough.
The Indian Institute of Technology Bombay, IIT Bombay, has developed an instrument named GolDN (pronounced as Golden) for melt-mixing of waste thermoplastic polymers and inorganic particulate fillers to manufacture polymer composites. It can carry out melt mixing as a continuous process, particularly in laboratory conditions, to replicate the real-life conditions as compared to other conventionally available instruments. The researchers at the institute considered some key parameters such as compression ratio and clearance depth to facilitate efficient mixing of waste polymers and fillers.
This technology, developed with the support of Department of Science and Technology (DST) through Waste Management Technologies, is now ready for commercialization for carrying out melt- mixing operations in a laboratory environment. It can bring down the cost of this instrument by avoiding the complex design and operating tools and including the indigenous fabrication that are required. The setup consists of a shredder, a mixer cum preheater, and an extruder to obtain the fresh binder filler composite to shred the plastic waste, mix and preheat plastic waste and IBPs, and melt plastic waste along with IBPs followed by conveying at the end, respectively.
The technology developed by IIT Bombay in collaboration with M/S Hindalco Industries Ltd. at Belagavi, is proven and ready for full commercial deployment (TRL-09) and a field-scale plant has been set up.
Source: Government of India, Ministry of Science and Technology – dst.gov.in
N E
Polímeros, 34(1), 2024 E3
W S
G E N D A
April
13th SPE European Thermoforming Conference
Date: April 10-12, 2024
Location: Amsterdam, Netherlands
Website: thermoforming-europe.org/ Bioplastics Brazil
Date: April 24-25, 2024
Location: São Paulo, São Paulo, Brazil
Website: www.bioplasticsbrazil.com/?lang=en
FBPol - French Brazilian Meeting on Polymers
Date: April 21-26, 2024
Location: Florianópolis, Santa Catarina, Brazil https://www.fbpol.com/
May
Fire and Polymers
Date: May 12-15, 2024
Location: New Orleans, Louisiana, United States of America
Website: polyacs.net/24fipo
Polymer Sourcing and Distribution
Date: May 14-16, 2024
Location: Brussels, Belgium
Website: www.ami-events.com/event/a555bb4d-c26b-4729-80fe05c535294593/summary?RefId=Website_AMI
International Symposium on Polymeric Materials (ISPM) 2024
Date: May 14-16, 2024
Location: Kangar, Perlis, Malaysia (hybrid) Website: ispm2024.wixsite.com/unimap
Polymers in Flooring
Date: May 15-16, 2024
Location: Hamburg, Germany
Website: www.ami-events.com/event/4c1e4b8b-4e49-4c29b2c0-db78fce7a924/summary?RefId=Website_AMI
39th International Conference of the Polymer Processing Society - PPS-39
Date: May 19-23, 2024
Location: Cartagena de Indias, Colombia
Website: pps39.uniandes.edu.co/
POLY-CHAR 2024 — Polymers for our future
Date: May 27-31, 2024
Location: Madrid, Spain
Website: congresosalcala.fgua.es/poly-char2024/ 8th PLA World Congress
Date: May 28-29, 2024
Location: Munich, Germany
Website: www.bioplasticsmagazine.com/en/event-calendar/ termine/8th-pla-world-congress-2024/ Polymers 2024 - Polymers for a Safe and Sustainable Future
Date: May 28-31, 2024
Location: Athens, Greece
Website: polymers2024.sciforum.net
June
2nd International Summit on Biopolymers and Polymer Science - ISBPS2024
Date: June 10-12, 2024
Location: Porto, Portugal
Website: www.spectrumconferences.com/2024/isbps
ICP 2024: 18. International Conference on Polymer
Date: June 20-21, 2024
Location: Paris, France
Website: waset.org/polymer-conference-in-june-2024-in-paris
Polymers for sustainable future 2024
Date: June 24-28, 2024
Location: Prague, Czech Republic
Website: imc.cas.cz/sympo/85pmm/ MACRO2024 — 50th World Polymer Congress
Date: June 30- July 4, 2024
Location: Coventry, United Kingdom
Website: iupac.org/event/50th-world-polymer-congressmacro2024/
July
International Conference on Polymer Science and Engineering
Date: July 1-2, 2024
Location: Kuala Lumpur, Malaysia
Website: spectusconferences.com/polymers-conference/ PoWER Conference – Polymer Women Empowerment & Research
Date: July 11-12, 2024
Location: Northwestern University Evanston, Illinois, United States of America
Website: polymerwomenempowermentresearch.com/ 6th Int’l Conference on Polymer Chemistry (ICPC 2024)
Date: July 19-21, 2024
Location: Xi’an, China
Website: www.academicx.org/ICPC/2024/ Polymer Engineering & Science International 2024
Date: July 21-25, 2024
Location: Tokyo, Japan
Website: www.pesi.tw/ August
International Composites, Polyurethane and Engineering
Plastics Fair and Congress 2024
Date: August 20-22, 2024
Location: São Paulo, Brazil
Website: feiplar.com/Presencial/ September
Polymer Markets Outlook
Date: September 10-11, 2024
Location: Brussels, Belgium
Website: go.ami.international/polymer-markets-outlook/ Plastics Extrusion World Expo Europe
Date: September 11-12, 2024
Location: Brussels, Belgium
Website: eu.extrusion-expo.com/home
Advances in Polyolefins
Date: September 29 – October 2, 2024
Location: Rohnert Park, California, United States of America Website: www.polyacs.net/24apo European Regional Meeting of the Polymer Processing Society
Date: September 30 – October 3, 2024
Location: Ferrol, Galicia, Spain Website: pps2024ferrol.com/
October
Polyolefin Additives
Date: October 8-9, 2024
Location: Barcelona, Spain
Website: www.ami-events.com/event/34b50abd-c009-4f50-b5429ab68f17095f/summary?RefId=Website_AMI
Global Research Conference on Polymer Science, Composite Materials and its Application
Date: October 24-26, 2024
Location: Barcelona, Spain Website: https://polymerresearch2024.com/
November
Plastics Extrusion World Expo North America
Date: November 13-14, 2024
Location: Cleveland, Ohio, United States of America Website: na.extrusion-expo.com/
December
Polymer Engineering for Energy
Date: December 3-4, 2024
Location: London, United Kingdom Website: www.ami-events.com/event/535774b9-c2a2-432d-be1fb7864beed551/summary?RefId=Website_AMI
2024
A
E4 Polímeros, 34(1), 2024
Sponsoring Partners
ABPol Associates
Polímeros, 34(1), 2024 E5
Development of mulch films from biodegradable polymer and agro-industrial waste
Railha Antunes de França1 , Ana Carolina Ferreira dos Santos Rosa2 , Cristiano José de Farias Braz1 , Renata Barbosa1 and Tatianny Soares Alves1*
1Programa de Pós-graduação em Ciência e Engenharia dos Materiais, Universidade Federal do Piauí – UFPI, Teresina, PI, Brasil
2Curso de Graduação em Engenharia de Materiais, Universidade Federal do Piauí – UFPI, Teresina, PI, Brasil *tsaeng3@yahoo.com.br
Obstract
Plasticulture improves crop quality and yield through polymeric films, but their improper disposal harms the environment due to humidity and contamination. This study aimed to develop biodegradable mulch films using soybean and peanut hulls and poly (butylene-adipate-co-terephthalate) (PBAT). The residues were characterized by thermogravimetric analysis and mulch films were evaluated by water absorption, contact angle and mechanical properties. The thermal behavior of the residues indicated stability below 200ºC. The agro-waste improved hydrophobicity but increased the water absorption values of the films by up to 18.5x (PBAT/SH5 after 14 days). Micrographs obtained by scanning electron microscopy indicated an important distribution of residue particles and formation of agglomerates, leading to lower mechanical performance. The study found that agro-industrial residues in powder form can be added to the polymeric matrix to produce biodegradable mulch films through traditional processing techniques. This approach has the potential to contribute to a more sustainable production system.
Keywords: PBAT, peanut, plasticulture, soybean, waste.
How to cite: França, R. A., Rosa, A. C. F. S., Braz, C. J. F., Barbosa, R., & Alves, T. S. (2024). Development of mulch films from biodegradable polymer and agro-industrial waste. Polímeros: Ciência e Tecnologia, 34(1), e20230042. https://doi.org/10.1590/0104-1428.20230043
1. Introduction
As population growth accelerates, the demand for food crop production is expected to rise dramatically. However, water resources are becoming increasingly scarce, making it challenging to meet this growing demand[1]. Agriculture plays a crucial role in the global food supply and should be enhanced by adopting better management practices that promote the conservation of natural resources, while also embracing an ecological approach[2] .
The expansion of agricultural production faces challenges due to suboptimal soil conditions, including limited water and nutrient availability, unfavorable temperatures, and weed infestations. These factors contribute to a worldwide struggle in sustaining production, particularly for seasonal products[3]. To control these parameters, one simple and effective strategy to improve soil properties and increase crop production is the use of polymeric films as soil cover. This technique, commonly referred to as plasticulture, enables the control of crucial parameters such as water and nutrient availability, while also aiding in the prevention of weed infestations[4]
According to American Society of Plasticulture, the term Plasticulture refers to the “use of plastics in agriculture” for the production of plants, including plastic cover, drip irrigation, row covers, low tunnels, high tunnels, among others[5,6] .
The mulching technique is a highly effective agricultural practice that involves covering the soil surface around plants with organic or synthetic materials. This creates ideal conditions for plant growth and development, resulting in increased efficiency and higher crop yields[6] .
Some of these films are even biodegradable, making them an eco-friendly option for farmers. By using this technique, farmers can reduce soil erosion, conserve water, and suppress weed growth, all while improving the overall health and productivity of their crops[7,8]. In this context, mulch is a crucial component in conditions of excessive rainfall, as it possesses the ability to reduce the occurrence of fungal diseases and the need for fungicide applications. This can greatly influence microclimatic conditions by increasing the temperature and reducing wind speed, which in turn decreases heat loss due to less air movement[9]
In recent years, the use of biodegradable polymers as an alternative to synthetic materials to cover films has been seen as a sustainable solution, since they can degrade in the field, thus reducing removal and disposal costs[10]. Given this scenario, it is crucial to make changes in the profile of polymeric material usage[11], to add sustainable value to the development of mulch films, and the addition of agro-industrial residues has demonstrated significant viability[12,13] .
https://doi.org/10.1590/0104-1428.20230043 O O O O O O O O O O O O O O O Polímeros, 34(1), e20230042, 2024 ISSN 1678-5169 (Online) 1/8
França, R. A., Rosa, A. C. F. S., Braz, C. J. F., Barbosa, R., & Alves, T. S.
In this line of thought, Mo et al.[14] evaluated the use of biodegradable polymers (BDPs) as mulch film and found that the degradation of BDPs varies depending on soil conditions. This study also noted that degradation of BDPs can lead to the release of microplastics and polymer additives. The authors concluded that the use of BDPs in agricultural soil ecosystems can have both positive and negative impacts. While biodegradable polymers can improve soil quality and promote plant growth, the study also found that the degradation of these plastics in soil can lead to the release of microplastics and nanoplastics, which can have negative environmental impacts. The authors recommended that more research is needed to fully understand the environmental fate and impacts of biodegradable polymers on agricultural soil ecosystems.
Furthermore, Candlen et al.[15] found that biodegradable mulch films produced from soybean-filled polymeric resins, including poly(butylene adipate-co-terephthalate) (PBAT) and poly(lactic acid) (PLA), have promising performance in plasticulture, with similar or better results compared to conventional plastic films. The authors have reached the conclusion that the utilization of biodegradable films represents a viable and sustainable alternative to conventional plastic films. Nevertheless, further investigations are imperative to enhance their performance and mitigate potential environmental repercussions that might impede their biodecomposition.
This work aimed to develop mulch films using biodegradable polymer additived with natural residues of soybean hulls and peanut hulls, and to assess their feasibility for use in plasticulture. It is believed that the results of this research have the potential to make a significant contribution to the mulch film industry by producing a biodegradable product that utilizes readily available renewable resources.
2. Materials and methods
2.1 Materials
Biopolymer PBAT Ecoflex® FC1200 from BASF (melt flow index: 2.7-4.9 g.10min-1 at 2.16 Kg/190 °C - ISO 1133) was used as polymeric matrix. As fillers, agro-industrial residues of soybean and peanut hulls were used.
2.2 Treatment of agro-industrial waste
Prior to their incorporation into the polymer, the peanut hulls (PH) and soybean hulls (SH) residues were crushed using a knife mill. Afterward, the crushed material was passed through a 100-mesh sieve and PBAT were then dried in an oven at 60°C for 24h.
2.3 Preparation of the systems composition
Subsequent to the preparing the agro-industrial waste, polymer/waste systems were initially prepared with 2.5% and 5% by weight to the polymer mass, resulting in the formation of four systems: PBAT/PH2.5, PBAT/PH5, PBAT/SH2.5, and PBAT/SH5. The residues were incorporated into the polymeric matrix by melting them in a single screw extruder (Ax-Plásticos Lab 16) with a temperature profile in the three zones (140,145, and 145°C), and screw speed of 50 rpm.
2.4 Preparation of films
All previously described systems obtained were dried in an oven at 60 °C for 24 h, before being processed into flat films using a single-screw extruder (Lab 16 by Ax-Plásticos) with a temperature profile (140, 155, and 160 °C), screw speed of 50 rpm, and pulling system operating at speeds: roller 1 (15 rpm), roller 2 (15rpm), puller (19 rpm), and winder (18 rpm).
2.5 Characterizations of agro-industrial residues and films
2.5.1 Thermogravimetric analysis
Thermogravimetric analysis (TGA) was conducted using a TA Instruments SDT Q600 analyzer to evaluate the thermal stability of agro-industrial residues. The test was performed under a synthetic air atmosphere, from room temperature to 500 °C, at rate of 10 °C.min-1 .
2.5.2 Water absorption test
Water absorption tests of the mulch films were carried out following ASTM 570 standard. The samples were then weighed at 1, 7, 12, and 28 days after immersion in water.
2.5.3 Water contact angle
To evaluate the hydrophilicity of the mulch films, contact angle measurements were conducted following the ASTM D5725 standard. Through the images captured by the digital camera, the contact angle is determined using SURFTENS – an image processing software.
2.5.4 Scanning electron microscopy
The morphology of the films was observed using a scanning electron microscope FEI Quanta FEG 250, with an accelerating voltage from 1 to 30 kV. Prior to analysis, the surface of the samples was sputter-coated with gold.
2.5.5 Mechanical properties
Tensile strength and elongation at break were carried out in a Universal Testing Machine Emic DL 30000 according to ASTM D882 standard with a speed of 50 mm/min and at room temperature. A minimum of eight samples were tested.
2.5.6 Statistical analysis
All measurements were reported as mean ± standard deviation. One-way analysis of variance (ANOVA) was applied using Excel Microsoft Office (Professional Plus 2019 version), and the Tukey’s test was used to evaluate the significant difference between samples. The confidence level was 95%.
3. Results and Discussions
3.1 Thermogravimetric analysis
TG/DTG thermograms of peanut hull are shown in Figure 1 Note that decomposition occurred in three events, according previous works[16-18]. The first event in the temperature range of 24.0 to 121.1°C, maximum rate of decomposition at 37.4°C, and resulting in a mass lass of 9.20%, corresponds to moisture loss zone. This indicates the evaporation of moisture and the removal of highly volatile compounds.
Polímeros,
e20230042, 2024 2/8
34(1),
Development of mulch films from biodegradable polymer and agro-industrial waste
The second event in the range of 142.7 to 358.2°C, with maximum decomposition rate at 277.5°C, showed a mass loss of 61.4% attributed to the decomposition of organic compounds. According to Varma et al.[18], this region corresponds to the zone of active pyrolysis where hemicellulose, cellulose and lignin bonds are rapidly destroyed. Within this temperature range, devolatilization actively occurs, with the rate increasing sharply as temperature increases. The authors reported peak values between 316 and 342°C, along with a mass loss of 82.0%, depending on the applied heating rate.
The third event was seen in the range between 370.0 and 482.0°C, with a peak temperature of 434.7°C, being associated with the decomposition of cellulose and lignin, with a mass loss of 24.6%. According to Suriapparao and Vinu[19], this event corresponds to the final degradation of cellulose up to 400°C, and above 350°C the decomposition of lignin begins, which goes up to 900°C.
TG/DTG thermograms of soybean hull (Figure 1) also indicated the presence of three thermal events[20,21]. The first event corresponds to the loss of moisture in the sample and occurs in a range of 24 and 156.8°C with a mass reduction of 12.2% and maximum decomposition rate at 47.5°C. The second event occurs between 156.8 and 370.0°C with a mass reduction of 50.2%, that is related to the degradation of organic matter composed of hemicellulose and cellulose. Finally, the third event is associated with the thermal decomposition of cellulose followed by lignin that occurs in the range from 374.5 to 490.5°C with maximum rate at 444.0°C and a mass loss of 25.7%. According to the thermal degradation of lignin and hemicellulose begins around 200°C.
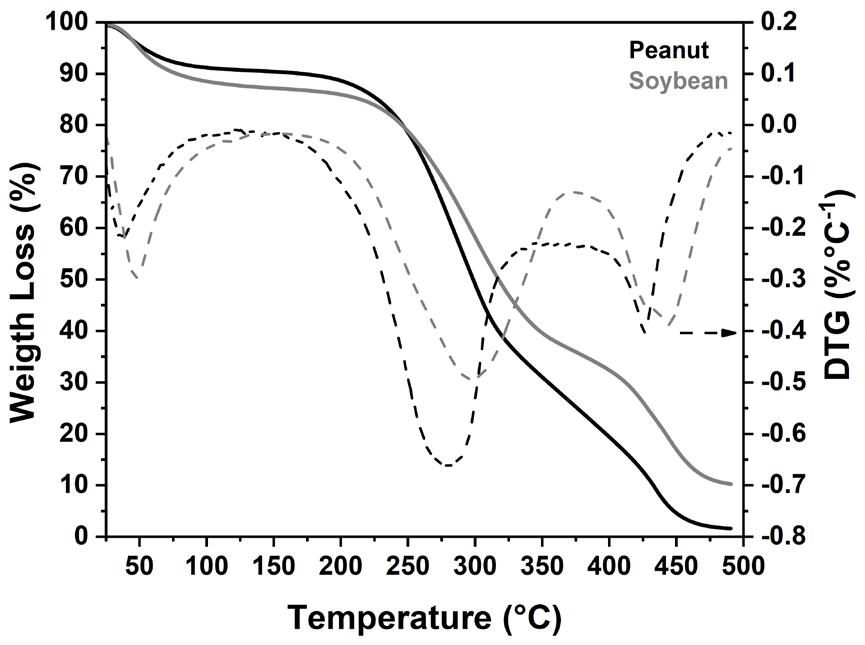
Hemicellulose undergoes total pyrolysis at 315°C, while cellulose elimination starts around 300°C to 400°C. Lignin is the last component to be dissipated at 700°C. These data are in agreement with the results previously reported by Toro-Trochez et al. [20] and Fitri et al. [21] However, Barros et al.[22] and Ikladious et al.[23] observed only two stages of decomposition for peanut shells. The first stage occurred between 27 to 160°C, with a peak at 61.5°C, and a mass loss of only 7.3%. This stage was attributed to the evaporation of water and light volatile components present in hemicellulose and lignin. The second stage occurred between 257 and 394°C, with a peak at 357°C, and a mass loss of only 63%. This stage was attributed to the degradation of the anhydrous material, characteristic of the strong separation between hemicellulose and lignin.
Based on these results, it appears that both fillers exhibit similar levels of thermal stability. Then, they could be used as polymer fillers in traditional processing methods, which typically involve operating temperatures below 200°C. However, it is worth highlighting that extra care must be taken during the drying phase of these fillers, given the hydrophilic nature of cellulosic materials.
3.2 Water absorption test
The results obtained in the water absorption test for pure PBAT and the PBAT/PH2.5, PBAT/SH2.5, PBAT/PH5 and PBAT/SH5 systems are shown in Table 1. The pure PBAT film was used as a reference for the other fillers PBAT systems. It is notable that in the absence of fillers, the percentage of water absorption of the PBAT showed slight changes throughout the analysis, a decrease from 0.42% on the first day to 0.32% after 28 days. As mentioned by Camani et al.[24], neat PABT has low water absorption values (<1%) due to its hydrophobic nature.
Results indicated that increasing filler content resulted in a slight increase in water absorption. This was due to the hydrophilic nature of the natural waste, which is responsible for water absorption in composites due to the presence of abundant hydroxyl groups. Consequently, a higher filler content results in a higher amount of absorbed water, as reported by Obasi[25], who suggested that water molecules can easily penetrate the void spaces of polymer/natural waste systems, increasing the absorbed water content, even in a short period of exposure. No saturation point was observed, suggesting that the exposure time was short.
Results expressed as mean ± standard deviation; different letters (a, b, c, d, and e) in the same column indicate a significant difference between the treatments by Tukey’s test (p < 0.05).
Polímeros, 34(1), e20230042, 2024 3/8
Figure 1. TG/DTG of the peanut hulls and soybean hulls.
Water Absorption (%) 1st day 7th day 14th day 28th day Neat PBAT 0.4266 ± 0.0141c 0.3603 ± 0.0223e 0.3370 ± 0.0276c 0.3164 ± 0.0259b PBAT/PH2.5 2.0036 ± 0.0303b 2.1365 ± 0.0452d 2.7526 ± 0.1235b 4.2366 ± 0.4836a PBAT/PH5 2.2784 ± 0.0403a 2.5503 ± 0.0592b.d 2.9054 ± 0.1519b 4.8102 ± 0.5592a PBAT/SH2.5 2.0366 ± 0.0542b 2.9065 ± 0.4965a.b 6.1026 ± 0.3565a 4.2465 ± 0.2456a PBAT/SH5
3.1361
0.5542
6.2419
0.3793
4.7186
Table 1. Water absorption measurements for all films.
Films
2.3635 ± 0.0645a
±
a
±
a
± 0.2810a
França, R. A., Rosa, A. C. F. S., Braz, C. J. F., Barbosa, R., & Alves, T. S.
It is notable that the PBAT/PH2.5 and PBAT/SH2.5 systems show an increase in the degree of water absorption within 24 hours of testing compared to pure PBAT, exhibiting initial values of approximately 2.10 and 2.15%, respectively. Analogously, with a discrete dynamic within 24 hours, the PBAT/PH5 and PBAT/SH5 systems absorbed about 2.28 and 2.36%, respectively. However, the systems show different behaviors as the test continues. For the systems with the addition of peanut hull: PBAT/PH2.5 and PBAT/PH5, a gradual increase in absorption was observed. However, for the PBAT/SH2.5 and PBAT/SH5 systems, there was a relevant increase after 7 days of evaluation, reaching a peak close to 6.0 and 6.24%, respectively, followed by a decline that at the end of the evaluation with 28 days they obtained an approximate absorption value of 4.35 and 4.72%, in that order.
In this context, the behavior of increasing the water absorption index can be attributed to the presence of vegetable residues that have a hydrophilic character due to the presence of polar groups characteristic of hemicellulose and lignin, which, although presenting a hydrophobic macromolecule, has ramifications of alcohols aromatic in its formation[26,27] , allowing the attraction of water molecules. The systems with the addition of peanut hull which, according to Castro et al.[28] have values in their constitution on average of 16% lignin and 36% hemicellulose, may present polar groups in their structure and through these hydroxyl groups hydrogen bonds are established with water molecules, thus influencing the increase in absorption[23,25]. It is described by several researchers[23,25,29] that it is even plausible to relate the fact of increased water absorption with the reason for the differences in particularities between the matrix and the filler, where there is a hydrophobic characteristic for the PBAT matrix and a hydrophilic one for the natural filler, producing an inadequate compatibility, which consequently causes a weak adhesion between the phases, causing voids and cracks that consequently allow the penetration of water.
The presence of the chosen fillers causes a change in the amount of water absorbed from the pure PBAT film and from the other evaluated materials. According to the ANOVA analyses, significant differences (p<0.05) were found between all water absorption measurements performed at each specified time interval. The results of the average values show that the time considered has an impact on how the water is absorbed.
According to Tukey’s test, the average values of water absorptions for the first 24 hours (1st day) suggest that the content behavior of each filler influences in a similar way, with notable increases shown in comparison with the pure PBAT film. Measurements taken on the seventh day indicate that
each type of filler produced similar absorption with increases of up to 7.1x (PBAT/PH5) and 8.7x (PBAT/SH5) over pure PBT. The PBAT/PH5 and PBAT/SH2.5 compositions show ambiguous behavior to the PBAT/PH2.5 and PBAT/SH5 films, respectively. For the 14th day, it was observed that the water absorption was similar regardless of the filler content. Compared to pure PBAT, absorption was increased by up to 8.6x (PBAT/PH5) and 18.5x (PBAT/SH5). Finally, on the 28th day, it was found that all films containing residues resulted in similar mean water absorption values, regardless of the type of filler applied. Compared to pure PBAT, absorption increased from 13.4x (PBAT/PH2.5) to 15.2x (PBAT/PH5).
3.3 Water contact angle
The results referring to the measurements of the water contact angle of the films based on neat PBAT and the respective systems are presented in Table 2. It is possible to visualize that the pure PBAT presents an angle of 50.90 ± 0.59°, confirming hydrophilic feature. However, higher values (72.0 to 76.6°) were previously reported for PBAT films[30,31]
The contact angle values of systems containing peanut hull were found to be higher than those containing soybean hull. Particularly, the contact angle values of the PBAT/PH2.5 and PBAT/PH5 films were 59.56 ± 1.33° and 57.56 ± 2.15°, respectively, showing a minor decline in values with increasing filler content. On the other hand, when the filler amount grew, the contact angle of the soybean husk filler with the water increased. Water contact angle measurements for the PBAT/SH2.5 and PBAT/SH5 films were 54.44 ± 1.21° and 55.66 ± 1.98°, respectively.
This angular growth behavior when compared to pure PBAT is characterized by an increase in surface hydrophobicity. This increase can be explained by the composition of plant residues, which have lignin in their structure, a complex macromolecule with a high concentration of aromatic groups, with less hydrophobicity than cellulose[32,33]. As observed in the results of TG/DTG (Figure 1), where it was verified that the soybean hull presents a mass loss corresponding to the decomposition of the lignin slightly higher than the peanut hull.
According to Bauli et al.[33], in general, these facts are justified, as natural fibers vary in cross-section, dimensions and physical properties and have rough surfaces. During contact angle measurements, liquid is often absorbed by natural fibers. Therefore, the addition of filler also influences through the roughness on the film surfaces, since a rough surface presents greater wetting of the solid.
PBAT/SH2.5
± 2.15a,b
± 1.21b
PBAT/SH5 55.66 ± 1.98a,b
Results expressed as mean ± standard deviation; different letters (a, b, and c) in the same column indicate a significant difference between the treatments by Tukey’s test (p<0.05).
Polímeros, 34(1), e20230042, 2024 4/8
Film Water Contact Angle (°) Neat PBAT 50.09
c PBAT/PH2.5 59.56
57.56
Table 2. Water contact angle measurements for all films.
± 0.84
± 1.33a PBAT/PH5
54.44
Development of mulch films from biodegradable polymer and agro-industrial waste
Ultimately, according to the ANOVA analyses, there were significant differences (p<0.05) in the water contact angles between the films indicating that a major impact is caused by the presence of fillers in these components. The average results show, however, that there is no statistically significant difference between the contents of each filler from the standpoint of the Tukey’s test. However, when compared to pure PBAT film, its impact can be seen proving that the surface structure of the films is statistically altered by the presence of natural residues, enhancing their hydrophobicity.
3.4 Scanning electron microscopy
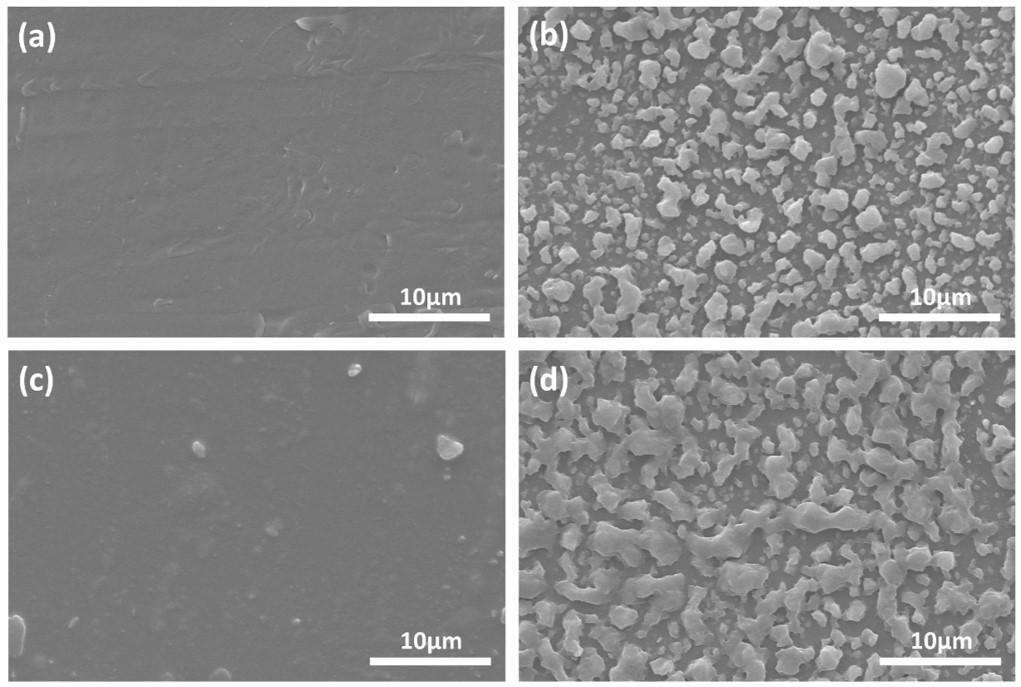
Behavior for pure PBAT with a smoother, more homogeneous and uniform surface morphology was previously reported[34-36]. SEM micrographs of PBAT films with peanut hull and soybean hull at 10,000x magnification are shown in Figure 2.
When particulate fillers are added to a PBAT matrix, the morphology generally tends to present an irregular and rough surface that allows a granular phase to be seen. The filler incorporated into the polymeric matrix is represented by this phase. These characteristics can be observed in films containing 5% by weight of both residues (Figure 2). However, the soybean hull residue (PBAT/SH5 - Figure 2d) showed particles slightly larger and more uniform than those present in the peanut hull film (PBAT/PH5 - Figure 2b). The presence of granular surfaces and the reduction in tensile strength corroborate previous works[35,37,38]. Films with contents of 2.5wt% showed a similar surface. The presence of isolated
granules was observed only for PBAT/2.5SH, possibly due to the greater size distribution among the granules[39]
In general, the images show that in both types of fillers (PH and SH), the increase in the filler content provided the formation of a granular and rough surface, which would be expected due to the higher content of material added to the matrix of the PBAT. The presence of granules associated with increased filler content was previously identified and reported[40-43] .
3.5 Mechanical properties
Mechanical properties of all films containing 2.5, and 5wt% of both fillers are show in Table 3. PBAT’s mechanical properties are highly flexible, similar to those of LDPE, making it a promising material for various applications[40] . It is possible to verify that the tensile strength of the PBAT film was 18.89 ± 1.00 MPa and that there was no rupture of the any film. According to Jian et al.[40] the tensile strength and elongation found were 21.0 MPa and 670%, respectively. On the other hand, according to Moustafa et al.[41], pure PBAT presents low tensile strength close to 14.0 MPa and high elongation at break (>1.500%).
Both tensile strength and elongation at break at break significantly changed when peanut hull fillers were added to the PBAT. For filler contents of 2.5% and 5.0% by weight, respectively, the tensile strength reduced to 12.59 ± 0.55 MPa and 8.96 ± 0.71 MPa, while the elongation at break at break decreased to 473.5 ± 28.06% and 666.5 ± 38.42%.
Polímeros, 34(1), e20230042, 2024 5/8
Figure 2. SEM micrographs of PBAT films with peanut hull (PH) and soybean hull (SH) at 10,000x magnification: (a) PBAT/PH2.5, (b) PBAT/PH5, (c) PBAT/SH2.5, and (d) PBAT/SH5.
França, R. A., Rosa, A. C. F. S., Braz, C. J. F., Barbosa, R., & Alves, T. S.
Table 3. Mechanical properties (tensile strength and elongation at break) for all films.
Results expressed as mean ± standard deviation; different letters (a, b, c, and d) in the same column indicate a significant difference between the treatments by Tukey’s test (p < 0.05). *The neat PBAT films did not break during the tensile test
As cellulosic fibers have a lower elongation at break[42] than PBAT, they may be responsible for these changes. It is clear that these natural residues had an impact on the quality of the films.
Similarly, incorporating soybean hulls into PBAT also led to changes in the tensile strength and elongation at break at break of the resulting films. Specifically, at filler contents of 2% and 5% by weight, the tensile strength and elongation at break values were 8.43 ± 0.79 MPA and 497.3 ± 41.06%, and 11.07 ± 0.97 MPa and 701.30 ± 41.95%, respectively.
It was observed by Al-Oql et al.[42] observed that the tensile strength decreased when the cellulosic fiber filler content was increased. This is due to the fact that, as the filler content increases, the interfacial area between the filler and the polymeric matrix also increases. Voids are formed at this interface and potentially decrease the tensile strength even further, especially when stiffer and inert fillers than the polymeric matrix are applied. In general, more rigid and less resilient materials are created when hard fillers are added to polymer matrices.
The mixture of natural fibers with polysaccharides improves some of the mechanical properties of the matrix. The low resistance observed in the systems may be the result of failures in the interface, caused by the weak interaction of the constituents. Thus, both the stiffness of the fibers and the low affinity between polyesters (such as PBAT) and cellulosic fibers lead to significantly lower elongation at break, despite maintaining or increasing tensile strength and increasing the modulus of elasticity of the composite relative to the matrix. This affinity can be improved through chemical modification of fibers surface[43-46] .
Analysis of variance (ANOVA) applied to the mechanical properties shown in Table 3 revealed a significant difference in the values obtained (p < 0.05), confirming that the fillers used had an impact on the mechanical properties of the PBAT. Tukey’s test showed that each filler generated a statistically significant difference in terms of tensile strength. Only the PBAT/PH5 and PBAT/SH2.5 compositions showed no significant difference between their mean values. In terms of elongation at break at break, a similar mean value was observed for each content (2.5 or 5 wt%). Notably, PBAT/PH2.5 and PBAT/SH5 films exhibited the best mechanical properties of tensile strength and elongation at break at break, respectively, when compared to films with the same type of filler. Therefore, in the selection process, it is important to consider the economically viable profile of each batch for the production of films on an industrial scale.
4. Conclusions
The films were developed from pure PBAT and PBAT systems with 2.5 and 5% by weight of peanut hull and soybean hull. Based on the results obtained, the increase in hydrophobicity and water absorption was caused by the cellulosic components that are the main constituents of the evaluated residues. According to the micrographs, the increase in the content of both fillers provided the formation of a greater number of granules with good distribution and dispersion for peanut hull and an irregular distribution for low content of soybean hull. Filled composites showed, in general, lower expected mechanical performance, due to the increased area and formation of interfacial defects between the filler and the polymeric matrix. However, the fillers added relevant properties such as low cost and better recycling. The findings from this research have the potential to make a significant contribution to the mulch film industry by producing a biodegradable product that utilizes readily available renewable resources.
5. Author’s Contribution
• Conceptualization – Railha Antunes de França.
• Data curation – Railha Antunes de França.
• Formal analysis – Cristiano José de Farias Braz.
• Funding acquisition – Renata Barbosa; Tatianny Soares Alves.
• Investigation – Railha Antunes de França; Cristiano José de Farias Braz.
• Methodology – Railha Antunes de França; Ana Carolina Ferreira dos Santos Rosa.
• Project administration – Tatianny Soares Alves.
• Resources – Renata Barbosa; Tatianny Soares Alves.
• Software – Cristiano José de Farias Braz.
• Supervision – Renata Barbosa; Tatianny Soares Alves.
• Validation – Cristiano José de Farias Braz.
• Visualization – Railha Antunes de França; Cristiano José de Farias Braz.
• Writing – original draft – Railha Antunes de França.
• Writing – review & editing – Cristiano José de Farias Braz; Renata Barbosa; Tatianny Soares Alves.
Polímeros, 34(1), e20230042, 2024 6/8
Film Tensile Strength (MPa) Elongation at break at Break (%) Neat PBAT 18.89
1.00a – * PBAT/PH2.5 12.59
0.55b 473.5
28.06b PBAT/PH5 8.96
0.71d 666.5 ± 38.42a PBAT/SH2.5 8.43 ± 0.79d 497.3 ± 41.06b PBAT/SH5 11.07 ± 0.97c 701.3
41.95a
±
±
±
±
±
Development of mulch films from biodegradable polymer and agro-industrial waste
6. Acknowledgements
The authors acknowledge the support of the Federal University do Piauí (UFPI), the Research Support Foundation of the State of Piauí (FAPEPI), the National Council for Scientific and Technological Development (CNPq), and the Coordination for the Improvement of Higher Education Personnel (CAPES).
7. References
1 Wang, F., Harindintwali, J. D., Yuan, Z., Wang, M., Wang, F., Li, S., Yin, Z., Huang, L., Fu, Y., Li, L., Chang, S. X., Zhang, L., Rinklebe, J., Yuan, Z., Zhu, Q., Xiang, L., Tsang, D. C. W., Xu, L., Jiang, X., Liu, J., Wei, N., Kastner, M., Zou, Y., Ok, Y. S., Shen, J., Peng, D., Zhang, W., Barceló, D., Zhou, Y., Bai, Z., Li, B., Zhang, B., Wei, K., Cao, H., Tan , Z. , Zhao , L.-B. , He , X. , Zheng , J. , Bolan , N. , Liu , X., Huang, C., Dietmann, S., Luo, M., Sun, N., Gong, J., Gong, Y., Brahushi, F., Zhang, T., Xiao, C., Li, X., Chen, W. , Jiao , N. , Lehmann , J. , Zhu , Y. G. , Jin , H. , Schäffer, A., Tiedje, J. M., & Chen, J. M. (2021). Technologies and perspectives for achieving carbon neutrality. The Innovation, 2(4), 100180 http://dx.doi.org/10.1016/j.xinn.2021.100180 PMid:34877561.
2 Chatzimpiros, P., & Harchaoui, S. (2023). Sevenfold variation in global feeding capacity depends on diets, land use and nitrogen management. Nature Food, 4(5), 372-383 http:// dx.doi.org/10.1038/s43016-023-00741-w PMid:37117605.
3 Cassman, K. G., & Grassini, P. (2020). A global perspective on sustainable intensification research. Nature Sustainability, 3(4), 262-268 http://dx.doi.org/10.1038/s41893-020-0507-8
4. Qin, M., Chen, C., Song, B., Shen, M., Cao, W., Yang, H., Zeng, G., & Gong, J. (2021). A review of biodegradable plastics to biodegradable microplastics: another ecological threat to soil environments? Journal of Cleaner Production, 312, 127816 http://dx.doi.org/10.1016/j.jclepro.2021.127816.
5 Adhikari, R., Bristow, K. L., Casey, P. S., Freischmidt, G., Hornbuckle, J. W., & Adhikari, B. (2016). Preformed and sprayable polymeric mulch film to improve agricultural water use efficiency. Agricultural Water Management, 169, 1-13. http://dx.doi.org/10.1016/j.agwat.2016.02.006
6 Barrett, C. E., Zotarelli, L., Paranhos, L. G., Dittmar, P., Fraisse, C. W., & VanSickle, J. (2018). Optimization of irrigation and N-fertilizer strategies for cabbage plasticulture system. Scientia Horticulturae, 234, 323-334 http://dx.doi.org/10.1016/j. scienta.2018.02.063
7. Manful, C. F., Hameed, A., & Thomas, R. H. (2023). Berries. In I. Zabetakis, A. Tsoupras, R. Lordan, & D. Ramji (Eds.), Functional foods and their implications for health promotion (pp. 161-217). Waltham: Elsevier Inc. http://dx.doi.org/10.1016/ B978-0-12-823811-0.00004-3
8 Khalid, N., Aqeel, M., Noman, A., & Rizvi, Z. F. (2023). Impact of plastic mulching as a major source of microplastics in agroecosystems. Journal of Hazardous Materials, 445, 130455. http://dx.doi.org/10.1016/j.jhazmat.2022.130455. PMid:36463747.
9 Wang, C., Wang, J., Zhang, Y., Qin, S., Zhang, Y., & Liu, C. (2022). Effects of different mulching materials on the grain yield and water use efficiency of maize in the north china plain. Agriculture, 12(8), 1112 http://dx.doi.org/10.3390/ agriculture12081112
10 Gupta, V., Biswas, D., & Roy, S. (2022). A comprehensive review of biodegradable polymer-based films and coatings and their food packaging applications. Materials, 15(17), 5899 http://dx.doi.org/10.3390/ma15175899 PMid:36079280.
11 Ferreira-Filipe, D. A., Paço, A., Natal-da-Luz, T., Sousa, J. P., Saraiva, J. A., Duarte, A. C., Rocha-Santos, T., & Silva, A. L. P. (2022). Are mulch biofilms used in agriculture na environmentally friendly solution? An insight into their biodegradability and ecotoxicity using key organisms in soil ecosystems. The Science of the Total Environment, 828, 154269 http://dx.doi. org/10.1016/j.scitotenv.2022.154269 PMid:35276171.
12 Maraveas, C. (2020). Production of sustainable and biodegradable polymers from agricultural waste. Polymers, 12(5), 1127 http://dx.doi.org/10.3390/polym12051127 PMid:32423073.
13. Visco, A., Scolaro, C., Facchin, M., Brahimi, S., Belhamdi, H., Gatto, V., & Beghetto, V. (2022). Agri-food wastes for bioplastics: european prospective on possible applications in their second life for a circular economy. Polymers, 14(13), 2752 http://dx.doi.org/10.3390/polym14132752. PMid:35808796.
14 Mo, A., Zhang, Y., Gao, W., Jiang, J., & He, D. (2023). Environmental fate and impacts of biodegradable plastics in agricultural soil ecosystems. Applied Soil Ecology, 181, 104667. http://dx.doi.org/10.1016/j.apsoil.2022.104667.
15 Candlen, K., Haque, M. A., Farfaras, N., Martey, S., Perez, P., Ratto, J. A., Pulis, R., Hagan, R., & Chen, W.-T. (2022). Biodegradable mulch films produced from soy-filled polymer resins. Materials Today. Communications , 31 , 103331 . http://dx.doi.org/10.1016/j.mtcomm.2022.103331
16 Xu, C., Zhao, J., Yang, W., He, L., Wei, W., Tan, X., Wang, J., & Lin, A. (2020). Evaluation of biochar pyrolyzed from kitchen waste, corn straw, and peanut hulls on immobilization of Pb and Cd in contaminated soil. Environmental Pollution, 261, 114133 http://dx.doi.org/10.1016/j.envpol.2020.114133 PMid:32078879.
17 Makavana, J. M., Sarsavadia, P. N., Chauhan, P. M., Dulawat, M. S., Dobariya, U. D., & Yadav, R. (2021). A review pyrolysis: different agricultural residues and their biochar characteristics. International Journal of Environment and Climate Change, 11(7), 80-88 http://dx.doi.org/10.9734/ijecc/2021/v11i730442
18. Varma, A. K., Singh, S., Rathore, A. K., Thakur, L. S., Shankar, R., & Mondal, P. (2022). Investigation of kinetic and thermodynamic parameters for pyrolysis of peanut shell using thermogravimetric analysis. Biomass Conversion and Biorefinery, 12(11), 4877-4888 http://dx.doi.org/10.1007/s13399-020-00972-y
19 Suriapparao, D. V., & Vinu, R. (2018). Effects of biomass particle size on slow pyrolysis kinetics and fast pyrolysis product distribution. Waste and Biomass Valorization, 9(3), 465-477 http://dx.doi.org/10.1007/s12649-016-9815-7
20 Toro-Trochez, J. L., Carrillo-Pedraza, E. S., Bustos-Martínez, D., García-Mateos, F. J., Ruiz-Rosas, R. R., Rodríguez-Mirasol, J., & Cordero, T. (2019). Thermogravimetric characterization and pyrolysis of soybean hulls. Bioresource Technology Reports, 6, 183-189 http://dx.doi.org/10.1016/j.biteb.2019.02.009
21 Faradilla, R. H. F., Lucia, L., & Hakovirta, M. (2021). Hydrothermal carbonization of soybean hulls for the generation of hydrochar: A promising valorization pathway for low value biomass. Environmental Nanotechnology, Monitoring & Management, 16, 100571 http://dx.doi.org/10.1016/j.enmm.2021.100571
22 Barros, P. J. R., Ascheri, D. P. R., Santos, M. L. S., Morais, C. C., Ascheri, J. L. R., Signini, R., Santos, D. M., Campos, A. J., & Devilla, I. A. (2020). Soybean hulls: optimization of the pulping and bleaching processes and carboxymethyl cellulose synthesis. International Journal of Biological Macromolecules, 144, 208-218 http://dx.doi.org/10.1016/j.ijbiomac.2019.12.074 PMid:31843616.
23 Ikladious, N. E., Shukry, N., El-Kalyoubi, S. F., Asaad, J. N., Mansour, S. H., Tawfik, S. Y., & Abou-Zeid, R. E. (2017). Ecofriendly composites based on peanut shell powder/unsaturated polyester resin. Proceedings of the Institution of Mechanical Engineers, Part L: Journal of Materials: Design and Applications, 233(5), 955-964 http://dx.doi.org/10.1177/1464420717722377
Polímeros, 34(1), e20230042, 2024 7/8
França, R. A., Rosa, A. C. F. S., Braz, C. J. F., Barbosa, R., & Alves, T. S.
24 Camani, P. H., Souza, A. G., Barbosa, R. F. S., Zanini, N. C., Mulinari, D. R., & Rosa, D. S. (2021). Comprehensive insight into surfactant modified-PBAT physicochemical and biodegradability properties. Chemosphere , 269 , 128708 http://dx.doi.org/10.1016/j.chemosphere.2020.128708 PMid:33168282.
25 Obasi , H. C. ( 2015 ). Peanut husk filled polyethylene composites: effects of filler content and compatibilizer on properties. Journal of Polymers, 2015, 189289 http://dx.doi. org/10.1155/2015/189289
26 Silva, R., Haraguchi, S. K., Muniz, E. C., & Rubira, A. F. (2009). Aplicações de fibras lignocelulósicas na química de polímeros e em compósitos. Quimica Nova, 32(3), 661-671 http://dx.doi.org/10.1590/S0100-40422009000300010
27 Stambuk, B. U., Eleutherio, E. C. A., Florez-Pardo, L. M., Souto-Maior, A. M., & Bon, E. P. S. (2008). Brazilian potential for biomass ethanol: challenge of using hexose and pentose cofermenting yeast strains. Journal of Scientific and Industrial Research, 67(11), 918-926. Retrieved in 2023, Jul 14, from http://nopr.niscpr.res.in/handle/123456789/2420
28 Castro-Garzón, H., Contreras, E. J., & Rodríguez, J. P. (2020). Análisis ambiental: impactos generados por los residuos agrícolas en el municipio de El Dorado (Meta, Colombia). Revista ESPACIOS, 41(38), 42-50. http://dx.doi.org/10.48082/ espacios-a20v41n38p05
29 Wu, C.-S. (2012). Utilization of peanut husks as a filler in aliphatic–aromatic polyesters: preparation, characterization, and biodegradability. Polymer Degradation & Stability, 97(11), 2388-2395 http://dx.doi.org/10.1016/j.polymdegradstab. 2012.07.027.
30 Silva, T. B. V., Moreira, T. F. M., Oliveira, A., Bilck, A. P., Gonçalves, O. H., Ferreira, I. C. F. R., Barros, L., Barreiro, M.-F., Yamashita, F., Shirai, M. A., & Leimann, F. V. (2019). Araucaria angustifolia (Bertol.) Kuntze extract as a source of phenolic compounds in TPS/PBAT active films. Food & Function, 10(12), 7697-7706. http://dx.doi.org/10.1039/ C9FO01315F PMid:31720644.
31 Zhang, C., Chen, F., Meng, W., Li, C., Cui, R., Xia, Z., & Liu, C. (2021). Polyurethane prepolymer-modified high-content starch-PBAT films. Carbohydrate Polymers, 253, 117168 http:// dx.doi.org/10.1016/j.carbpol.2020.117168 PMid:33278963.
32. Rojo, E., Peresin, M. S., Sampson, W. W., Hoeger, I. C., Vartiainen, J., Laine, J., & Rojas, O. J. (2015). Comprehensive elucidation of the effect of residual lignin on the physical, barrier, mechanical and surface properties of nanocellulose films. Green Chemistry, 17(3), 1853-1866 http://dx.doi. org/10.1039/C4GC02398F
33. Bauli, C. R., Rocha, D. B., & Rosa, D. S. (2019). Composite films of ecofriendly lignocellulosic nanostructures in biodegradable polymeric matrix. SN Applied Sciences, 1(7), 774 http://dx.doi. org/10.1007/s42452-019-0765-0
34 Liu, Q., Wang, Y., Liu, J., Liu, X., Dong, Y., Huang, X., Zhen, Z., Lv, J., & He, W. (2022). Degradability and properties of PBAT-based biodegradable mulch films in field and their effects on cotton planting. Polymers, 14(15), 3157 http://dx.doi.org/10.3390/polym14153157 PMid:35956671.
35. Oliveira, T. A., Mota, I. O., Mousinho, F. E. P., Barbosa, R., Carvalho, L. H., & Alves, T. S. (2019). Biodegradation of mulch films from poly(butylene adipate co-terephthalate), carnauba wax, and sugarcane residue. Journal of Applied Polymer Science, 136(47), 48240 http://dx.doi.org/10.1002/ app.48240
36 Yang, Y., Zhang, C., & Weng, Y. (2021). Effects of CaCO3 surface modification and water spraying on the weathering properties of PBAT/CaCO3 films. Polymer Testing, 102, 107334 http://dx.doi.org/10.1016/j.polymertesting.2021.107334
37. Ma, F., Wang, B., Leng, X., Wang, Y., Sun, Z., Wang, P., & Wei, Z. (2022). Biodegradable PBAT/PLA/CaCO3 blowing films with enhanced mechanical and barrier properties: investigation of size and content of CaCO3 particles. Macromolecular Materials and Engineering, 307(9), 2200135 http://dx.doi.org/10.1002/ mame.202200135
38 Sciancalepore, C., Togliatti, E., Giubilini, A., Pugliese, D., Moroni, F., Messori, M., & Milanese, D. (2022). Preparation and characterization of innovative poly(butylene adipate terephthalate)-based biocomposites for agri-food packaging application. Journal of Applied Polymer Science, 139(24), 52370. http://dx.doi.org/10.1002/app.52370.
39 Tsou, C.-H., Chen, Z.-J., Yuan, S., Ma, Z.-L., Wu, C.-S., Yang, T., Jia, C.-F., & De Guzman, M. R. (2022). The preparation and performance of poly(butylene adipate) terephthalate/corn stalk composites. Current Research in Green and Sustainable Chemistry, 5, 100329. http://dx.doi.org/10.1016/j.crgsc.2022.100329.
40 Jian, J., Xiangbin, Z., & Xianbo, H. (2020). An overview on synthesis, properties and applications of poly(butylene-adipateco-terephthalate)–PBAT. Advanced Industrial and Engineering Polymer Research, 3(1), 19-26 http://dx.doi.org/10.1016/j. aiepr.2020.01.001
41 Moustafa, H., Guizani, C., Dupont, C., Martin, V., Jeguirim, M., & Dufresne, A. (2017). Utilization of torrefied coffee grounds as reinforcing agent to produce highquality biodegradable PBAT composites for food packaging applications. ACS Sustainable Chemistry & Engineering, 5(2), 1906-1916 http://dx.doi. org/10.1021/acssuschemeng.6b02633.
42 Al-Oqla, F. M., Hayajneh, M. T., & Aldhirat, A. (2021). Tribological and mechanical fracture performance of Mediterranean lignocellulosic fiber reinforced polypropylene composites. Polymer Composites , 42 (10 ), 5501 -5511 http://dx.doi.org/10.1002/pc.26241.
43 Silva, J. S. P., Silva, J. M. F., Soares, B. G., & Livi, S. (2017). Fully biodegradable composites based on poly(butylene adipate-co-terephthalate)/peach palm trees fiber. Composites. Part B, Engineering, 129, 117-123 http://dx.doi.org/10.1016/j. compositesb.2017.07.088
44 Brunengo, E., Conzatti, L., Utzeri, R., Vicini, S., Scatto, M., Falzacappa, E. V., Castellano, M., & Stagnaro, P. (2019). Chemical modification of hemp fibres by plasma treatment for cocomposites based on biodegradable polyester. Journal of Materials Science, 54(23), 14367-14377 http://dx.doi. org/10.1007/s10853-019-03932-8.
45 Lule, Z. C., & Kim, J. (2021). Properties of economical and eco-friendly polybutylene adipate terephthalate composites loaded with surface treated coffee husk. Composites. Part A, Applied Science and Manufacturing , 140 , 106154 http://dx.doi.org/10.1016/j.compositesa.2020.106154.
46 Pei, P., Zou, R., Zhang, C., Yu, M., Chang, S., Tan, J., Li, J., Li, X., & Li, S. (2023). Optimization of alkali-treated banana pseudo-stem fiber/PBAT/PLA bio-composite for packaging application using response surface methodology. BioResources, 18(1), 39-59 http://dx.doi.org/10.15376/biores.18.1.39-59
Received: Jun. 14, 2023
Revised: Oct. 04, 2023
Accepted: Nov.14, 2023
Polímeros, 34(1), e20230042, 2024 8/8
Welding parameters process study of non-metallic expansion joints polymeric composite
Marcos Dorigão Manfrinato1 , Eduardo de Campos Leite1, Rafael Roberto Pavani2 , Henrique Boschetti Pereira3* , Lucas Camargo Soares Carvalho da Silva2 and Luciana Sgarbi Rossino1,2
1Faculdade de Tecnologia do Estado de São Paulo – FATEC, Sorocaba, SP, Brasil
2Universidade Federal de São Carlos – UFSCar, Campus Sorocaba, Sorocaba, SP, Brasil
3Universidade de São Paulo – USP, São Paulo, SP, Brasil *henrique.boschetti.pereira@usp.br
Obstract
Polymeric composite materials, presenting a practical solution for sealing non-metallic expansion joints under extreme conditions such as high temperatures and harsh chemical and physical abrasion, were investigated in this scientific study to discern the impact of welding parameters on their degradation and properties. The study entailed the bonding of polymeric composite blankets through hot plate pressing with a PTFE film, encompassing variations in temperature, duration, and load application. The findings elucidated that lower temperatures and shorter processing times failed to achieve optimal blanket adhesion, while higher temperatures led to material degradation, subsequently diminishing the mechanical strength of the welded joint. In contrast, extended processing times and the application of load during welding demonstrated a positive correlation, enhancing the mechanical strength of the joint by ameliorating interfacial adhesion. This research underscores the critical significance of carefully selecting welding parameters to ensure the peak performance and durability of polymeric composite structures.
Keywords: polymeric composite, hot plate welding, composite, seal blanket.
How to cite: Manfrinato, M. D., Leite, E. C., Pavani, R. R., Pereira, H. B., Silva, L. C. S. C., & Rossino, L. S. (2024). Welding parameters process study of non-metallic expansion joints polymeric composite. Polímeros: Ciência e Tecnologia, 34(1), e20240002. https://doi.org/10.1590/0104-1428.20230004
1. Introduction
Non-metallic expansion joints are subject to specific requirements for their application, including withstanding high temperatures, resisting corrosive environments, and accommodating expansion, axial, and lateral movement[1] Among the key components of a non-metallic expansion joint is the seal blanket, typically constructed from a polymer composite. Laminated seal blankets composed of fluorinated elastoplastic reinforced with fiberglass and aramid, and coated with PTFE (polytetrafluoroethylene), offer thermal stability, allowing continuous operation within a temperature range of approximately -40 °C to 260 °C. This makes them suitable for situations characterized by high thermal and chemical wear[2]
The mechanical and structural properties of these polymeric composites can be influenced by the welding parameters employed during the fabrication of welded joints. Therefore, understanding the characteristics of these materials entails studying their mechanical and thermal properties, such as Young’s modulus and degradation[3] . Consequently, welding fluorinated elastoplastic reinforced with fiberglass and aramid polymeric composite coated with PTFE poses challenges in the production of non-metallic expansion joints. Incorrect execution of the welding process may lead to leaks during service, and degradation of the
PTFE coating can result in cracks in the application of non-metallic joints.
Various polymer welding processes are currently employed, and with the increasing utilization of these materials, new techniques are continually being introduced[4]. Hot plate pressing welding is the most common method employed for joining fluorinated elastoplastic reinforced with fiberglass and aramid polymeric composite coated with PTFE. This technique involves heating the surfaces to be joined through direct contact with heated metal tools, applying compressive force to the mating surfaces. Subsequently, the interface cools and solidifies under controlled pressure, resulting in the welding of polymeric blankets[5-7] .
While failures in polymeric composite materials have been analyzed in recent years[8-10], only a few studies have focused on their joining. For instance, Barbosa et al.[11] investigated resistance welding of composites composed of PPS and fiberglass, exploring microfractography for failure analysis and testing welding parameters to enhance joint mechanical properties and identify potential failure modes. Javaid et al.[12] examined welded joints of unidirectional fiberglass-carbon fiber composites used in wind turbines, studying joint geometries, finite element analysis, tensile testing, and fatigue testing. Du et al.[13] investigated the
https://doi.org/10.1590/0104-1428.20230004 O O O O O O O O O O O O O O O Polímeros, 34(1), e20240002, 2024 ISSN 1678-5169 (Online) 1/9
Manfrinato, M. D., Leite, E. C., Pavani, R. R., Pereira, H. B., Silva, L. C. S. C., & Rossino, L. S.
tensile mechanical properties of integrated composite joints with the fuselage connected by fasteners and adhesives, using tensile testing and finite element modeling to predict joint behavior. Dissimilar joints represent another aspect of composite welding failures, as studied by Hu et al.[14] , who examined bolted joints of unidirectional carbon fiber composites with polyester through interference, assessing the effects of temperature on joint tensile mechanical properties. Despite the limited literature available on composite welded joints, particularly involving thermal joint sealing materials like the commercially known Darlyn®, this study aims to enhance mechanical properties and prevent joint failures by varying welding parameters and assessing their mechanical and thermal properties.
The objective of this work is to determine the influence of hot plate pressing welding parameters on the degradation and mechanical resistance of fluorinated elastoplastic reinforced with fiberglass and aramid polymeric composite coated with PTFE. These parameters will be established to ensure the avoidance of future defects that may arise during service due to changes in the properties of the studied polymeric composite resulting from the welding process used to manufacture expansion joints.
2. Materials and Methods
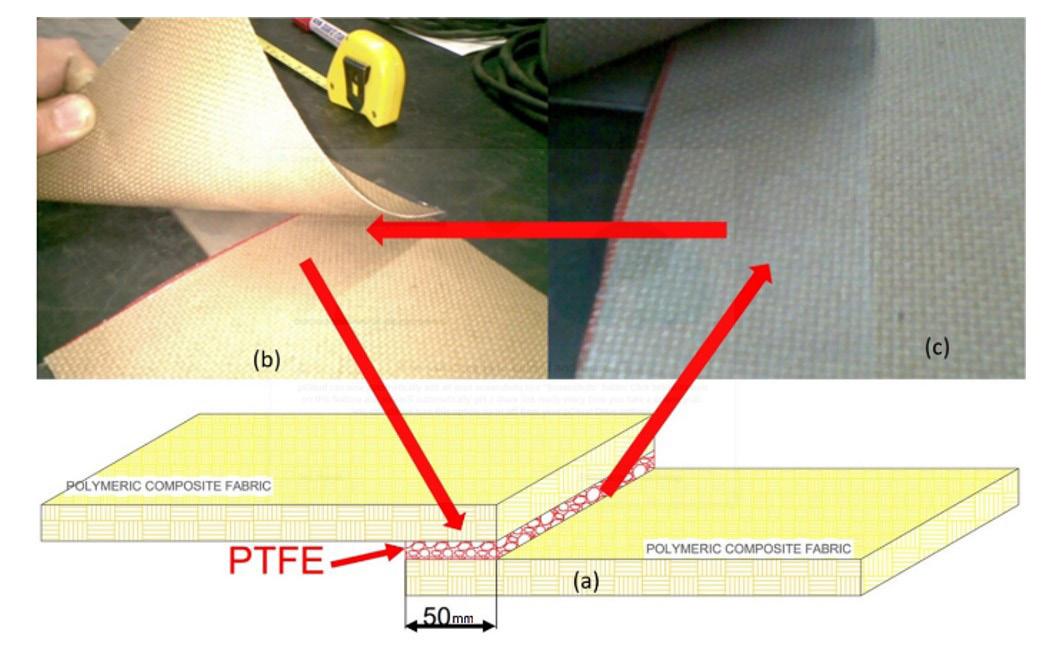
Polymeric composite blankets (PCBs) made of fluorinated elastoplastic reinforced with fiberglass and aramid, and coated with PTFE, were used in this study. The PCBs were in the form of plates with dimensions of (150x220) mm. To join these blankets, a PTFE tape measuring 0.3 mm in thickness, 5.0 mm in width, and 220 mm in length was utilized.
The schematic representation of this assembly is depicted in Figure 1a Figure 1b demonstrates the overlapping of the polymer composite blankets, while Figure 1c illustrates the placement of the PTFE film between the blankets, clearly identifiable by its bright color in the corner of the blanket.
The welding process was performed using a Heat Sealer model 630 heat generator through the hot plate pressing method. The specific parameters employed in the welding process can be found in Table 1.
The tensile strength limit (sr) of both the welded and non-welded materials was determined through a tensile test conducted in accordance with ASTM D412 standard[15]. The tests were performed in triplicate using an EMIC machine with a capacity of 150 kN, applying a crosshead speed of 4 mm/min. In order to assess the influence of the welding process on the material’s resistance behavior, the welded region was strategically positioned within the functional area of the tested sample, as illustrated in Figure 2. Subsequently, the samples were precisely cut using a water jet. The fracture surfaces of the samples were analyzed using an Olympus model SZ61 stereoscopy equipped with a 5-megapixel image acquisition camera and Infinity Analyse® software.
Polímeros, 34(1), e20240002, 2024 2/9
Figure 1. Polymeric composite blanket (a) illustrative scheme of the welded joint overlapping type, (b) overlapping of the polymer composite blankets and (c) positioning of the PTFE film between the blankets.
Temperature Pressing Load °C (°F) kgf 351 (655) 11.5 371 (700) 11.5 398.8 (750) 11.5 398.8 (750) 0.0
Table 1. Parameters of the welding process.
Welding parameters process study of non-metallic expansion joints polymeric composite
The chemical structural properties of the studied materials were determined using Fourier transform infrared spectroscopy (FTIR) on the PTFE film and PCB, both with and without the welding process. This analysis was conducted using a Spectrum 65 (Perkin Elmer) equipment in an ATR model. The absorption spectra were analyzed within the range of 4000 cm-1 to 600 cm-1 with a resolution of 4 cm-1 and 32 scans.
Thermogravimetric analysis (TGA) was performed to characterize the PCB, PCB welded, and PTFE film. This analysis was carried out using the TA Instruments model Discovery TGA 55 equipment. The samples, weighing 10 mg, were heated at a rate of 10 °C/min, starting from -25 °C and reaching 700 °C in an atmosphere of 100% nitrogen.
Furthermore, differential scanning calorimetry (DSC) was employed to analyze the thermal properties of the material.
The TA Instruments Discovery DSC 25 equipment was utilized for this purpose. Samples weighing approximately 7 mg, enclosed in hermetically sealed aluminum holders, were subjected to the DSC analysis. The samples were cooled to -50 °C and then heated to 700 °C at a rate of 10 °C/min in a nitrogen atmosphere.
3. Results and Discussions
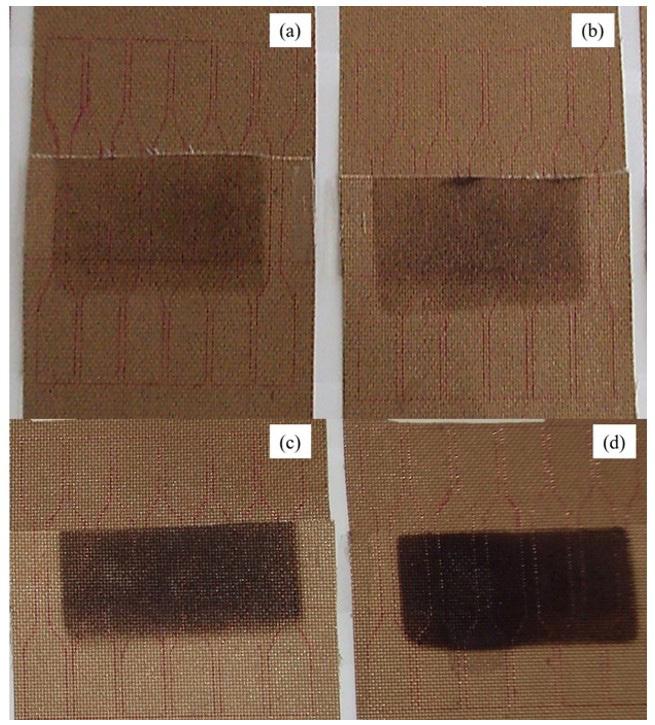
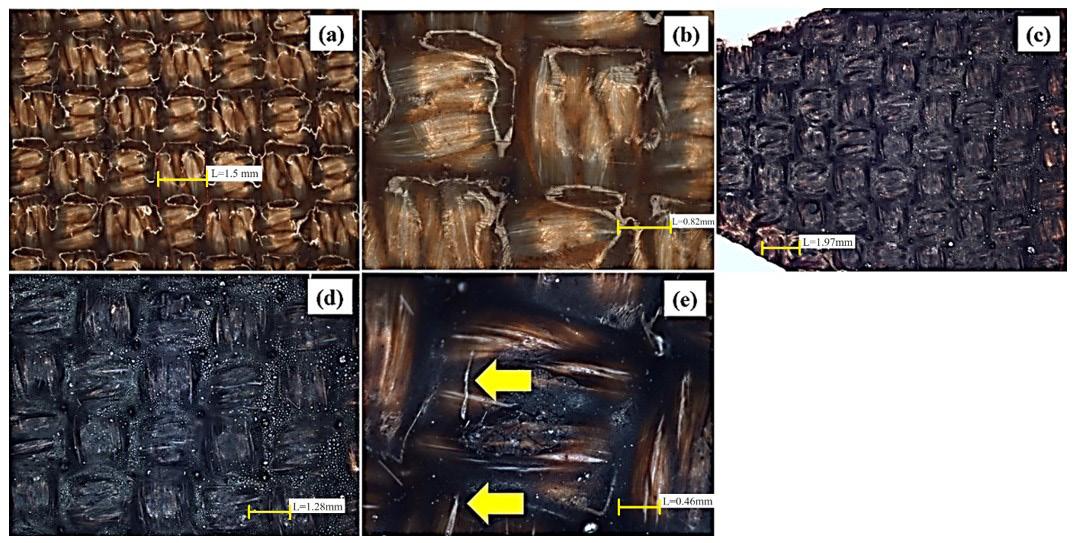
Figure 2 illustrates the surface appearance of the weld region on the PCB, showcasing variations in welding time (2, 4, 6, and 10 minutes) at a constant temperature of 398.8 °C (750 °F) and a load of 11.5 kgf. It can be observed that the material in contact with the hot tool and the PCB exhibits a darker appearance. Prolonged exposure to welding time intensifies the modification of the surface, indicating possible material degradation.
Polímeros, 34(1), e20240002, 2024 3/9
Figure 2. Surface aspect of the welded region of the polymeric composite blankets at 398.8 °C (750 °F) with a load of 11.5 kgf and a welding time of (a) 2 min, (b) 4 min, (c) 6 min, and (d) 10 min
Manfrinato, M. D., Leite, E. C., Pavani, R. R., Pereira, H. B., Silva, L. C. S. C., & Rossino, L. S.
The qualitative degradation of PTFE, characterized by darkening and stiffening, becomes more pronounced with increased soldering time, particularly at 6 and 10 minutes. In contrast, welds created with processing times of 2 and 4 minutes maintain a preserved, non-brittle appearance with slight darkening, without producing soot-like particulate material post-welding. This suggests that shorter processing times contribute to the material’s dissipative capacity and thermal resistivity, preventing significant degradation.
It is important to note that in applications involving non-metallic expansion joints exposed to abrasive chemical vapors and mechanical stress, PTFE degradation can lead to structural issues such as fiber exposure and accelerated damage. This is particularly concerning when it results in reduced mobility of the blanket due to composite stiffening, as observed in welds tested between 6 and 10 minutes.
Furthermore, temperature also influences the qualitative results in a similar manner to time. Increasing the weld temperature leads to darkening and stiffening of the material, intensifying the surface carbonization. Figure 3a presents the PTFE film over the fabric, showcasing the non-degraded qualitative visual aspect of the PCB (detailed in Figure 3b).
The lighter parts seen in Figure 3a and 3b are a reflection of the light, so these figures show the PTFE film whole and not degraded. However, when the weld is performed at 398.8 °C (750 °F) for 6 and 10 minutes, Figure 3c illustrates the burn marks on the PTFE film, resulting in cracks on the surface coating (Figure 3d).
Non-metallic expansion joints display visible signs of damage that serve as indicators of potential structural failures. These signs include external cracking, bubbles, strains, delamination, exposure of reinforcing metal or fabric, separation of fabric layers, polymer deterioration, and leakage[16,17]. These failure modes can be attributed
to various causes, such as excessive extension of the joint assembly[18], chemical attack, excessive pressure or vacuum, high temperatures, insufficient load on the joint union, and degradation of the polymeric material due to external agents[16]
It is important to highlight that PTFE, with a manufacturer-specified melting temperature of 326.8 °C (620.2 °F) as per Chemfab Corporation®, has a lower melting temperature compared to the temperature applied during the welding process. This ensures that the PTFE film melts and spreads over the fabric overlap in the weld. However, it is worth noting that the PTFE film may also undergo degradation as the thermal insulation properties of the polymer are surpassed by thermal conduction, primarily influenced by the duration of material exposure to the welding hot plates.
The results of the tensile test are presented in Figure 4 The efficiencies of the tested materials were determined by comparing the tensile strength of the welded specimens to that of the unwelded material. It can be observed that the highest efficiencies were achieved for welds performed at a temperature of 371 °C (700 °F) with a load of 11.5 kgf and times of 2 minutes and 4 minutes, resulting in efficiencies of 79.2% and 88.9%, respectively. The lowest tensile strength limit was observed in the welded material at 398 °C (750 °F) without load application, highlighting the necessity of load for ensuring good adhesion of the joint union.
Upon analyzing a processing time of 4 hours, the highest efficiency was observed at an intermediate temperature of 371 °C (700 °F). At a welding temperature of 398 °C (750 °F), the PTFE film melted and increased in fluidity, resulting in its flow over the welded region assisted by the applied load. However, degradation of the PTFE film also occurred, supporting the findings of Pugmire et al.[19] .
Polímeros, 34(1), e20240002, 2024 4/9
Figure 3. Surface of the polymeric composite blankets (a) front view of the fabric weaves without welding, (b) detail of the PTFE film on the fibers of the fabric without welding, (c) PTFE film in the welded region at 398.8 ºC (750 °F) for 6 min and application of a load of 11.5 kgf, (d) PTFE film in the welded region at 398.8 °C (750 °F) for 10 min and application of a load of 11.5 kgf, (e) surface cracks in the PTFE film for the welded region at 398.8 °C (750 °F) for 10 minutes and a load application of 11.5 kgf.
Welding parameters process study of non-metallic expansion joints polymeric composite
In contrast, the welding temperature of 371 °C (700 °F) yielded the highest tensile strength limit. This can be attributed to the effective melting of the PTFE film, which acts on the joint without causing burning of the composite in the welded region, unlike what happened at the welding temperature of 398.8 °C (750 °F).
The welding time is another crucial parameter that influences the tensile strength of the welded material as
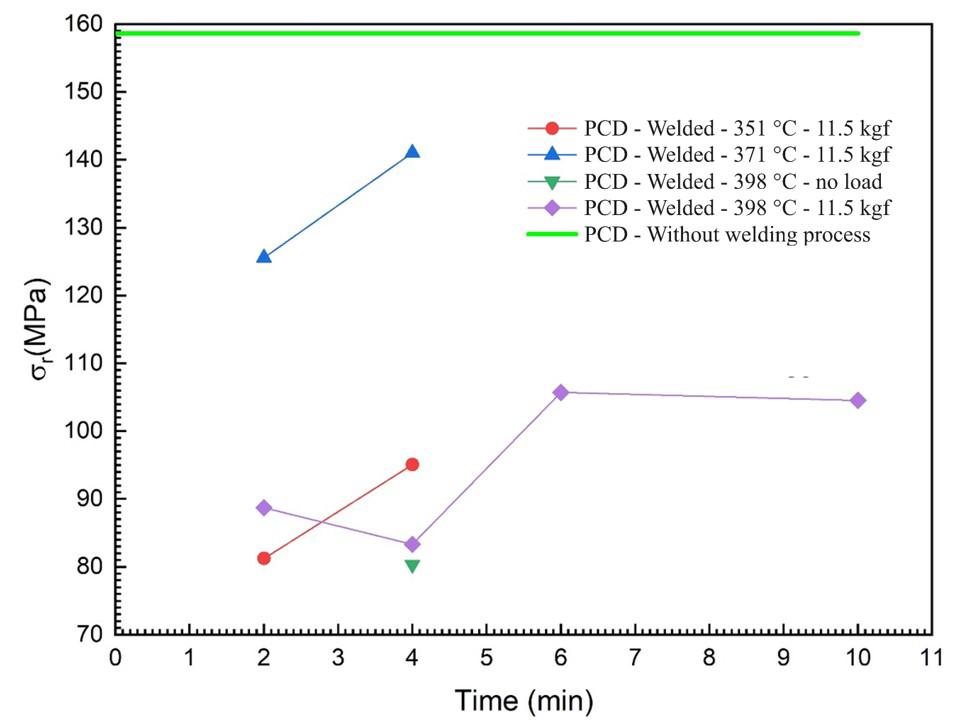
it affects the heat dissipation capacity necessary to melt the PTFE film applied to the fabric blankets. At a welding temperature of 351 °C (665 °F), which exceeds the polymer melting temperature, the PTFE film did not fully melt throughout the samples, indicating the need for a longer welding process time.
While the material welded at 398.8 °C (750 °F) exhibited a higher tensile strength limit for 6 min and 10 mi durations compared to 2 h and 4 h durations, the longer processing times led to thermal degradation of the material, as depicted in Figure 3e. The appearance of cracks in the welded film signifies the rupture of the polymeric chains, compromising the efficiency of the anchorage between the polymeric matrix and the non-polymeric filler in the PCB. This can negatively impact the material’s performance in service. As the fabric is flexible, the cracks expose the fabric fibers due to movements occurring in non-metallic expansion joints, which can result in leaks and reduce the joints’ lifespan.
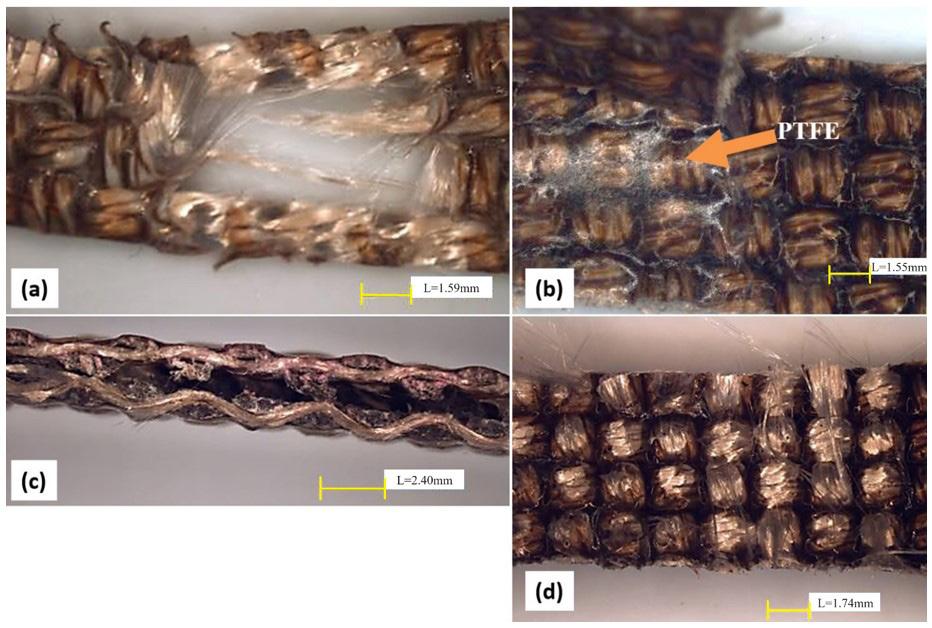
In the absence of the welding process, the PCB exhibited a fracture that initiated in the PTFE and progressed to the fibers, as illustrated in Figure 5a. This offers a basis for comparison between a composite without heat influence and a degraded material caused by the welding process. In a non-degraded material, the interface between the polymer chains and the fibers prevails to the point of breaking one of the composite components, without pulling out the material fibers, which unravel during the application of tensile load.
Polímeros, 34(1), e20240002, 2024 5/9
Figure 4. Tensile strength limit of the welded and unwelded materials at function of the processing time and temperature.
Figure 5. Fracture surface of the samples submitted to tensile test for (a) polymeric composite blankets without welding, (b) top view of the specimen welded at 398.8 °C (750 °F) for 4 minutes with no load applied, (c) side view of the specimen welded at 371 °C (700 °F) for 4 minutes with a load of 11.5 kgf and (d) observation of the exposed fibers of the specimen welded at 398.8 °C (750 °F) for 2 minutes with a load of 11.5 kgf.
Manfrinato, M. D., Leite, E. C., Pavani, R. R., Pereira, H. B., Silva, L. C. S. C., & Rossino, L. S.
However, when mechanically pulling a degraded material, a compromised interface leads to easy pullout of the polymer matrix fibers, as the chemical properties of the polymer are partially impaired[20]
Figure 5b illustrates the fracture region after the tensile test for the specimen welded at 398.8 °C (750 °F) for 4 minutes without load application. It is evident that this specimen exhibited fusion of the PTFE film, and the tension-induced fracture occurred due to the separation of the welded joint caused by the inadequate adhesion of the PTFE film with the fabric, as exemplified in Figure 5c Importantly, the fabric fibers were not pulled out, highlighting the significance of the applied load during the welding process. The surface of the weld displays peeling of the PTFE film, exposing the fibers, as shown in Figure 5d, indicating an adhesion issue at the interface between the PTFE film and the fabric.
To ensure proper processing, the hot plate used in the welding process must maintain an ideal temperature. Deviating from the ideal temperature can lead to adhesion problems between fabrics or degradation of the interface material in the welded joint due to excessive heat[5]. Another parameter to consider is the pressing load applied to the welded joint, as it determines the crystallization rate in semicrystalline polymers, which can influence the mechanical and chemical properties of the welded joint[5,6,21]
The changes in the mechanical properties of the material can also be explained through physicochemical analysis using the spectra obtained by FTIR, which captures the molecular bonds present in the study material. This analysis allows for the observation of chemical changes that may occur due to thermal degradation. Figure 6 presents the infrared absorption spectra of the molecular bonds in the PTFE without processing, PCB without processing, and the effectively degraded PCB.
The spectrum obtained for the PTFE and PCB reveals several absorption bands. Two intense bands are present at 1198 cm-1 and 1146 cm-1, attributed to the asymmetric and symmetrical stretching of the CF bonds in the CF2 group[22] Additionally, a less prominent peak can be observed at 639 cm-1, indicating the angular deformation of the C-F bonds in the CF2 group[23]. Finally, at 2924 cm-1 and 2853 cm-1, there are absorption bands corresponding to the asymmetric and symmetrical stretching of the CH bonds in the -CH2- group, respectively[24]. Although PTFE (C2F4) has no C-H bonds, these bonds were observed. However, it could be fiberglass residue in the samples.
Both the non-degraded and degraded PCB exhibit the same absorption bands observed in the PTFE sample. This similarity is due to the use of a PTFE and fluoroelastomer coating on the fiberglass fabric in the welding blanket[2] However, in the FTIR spectrum of the degraded polymeric
composite blankets, an enlarged peak at 900 cm-1 is observed, indicating changes in the polymeric chains caused by the temperature and time employed in the welding process.
The results of the thermogravimetric analysis are presented in Table 2. The thermal degradation of the PTFE film occurs in a single stage. The degradation process initiates at 491 °C and concludes at 549 °C, with the maximum degradation peak occurring at 518 °C. After the test, a small residue of approximately 0.3% of the initial mass is observed. These findings align with previously reported literature results[25,26] .
In the thermogravimetric analysis of the non-degraded PCB, it was observed that thermal degradation commenced at 515 °C and concluded at 569 °C, with the maximum degradation peak occurring at 554 °C. At the end of the degradation process, the material exhibited approximately 60% residue, which could be attributed to the inorganic fraction present in the fabric along with a partially degraded polymeric fraction that may not have undergone complete degradation during the process.
For the degraded PCB, the thermal degradation process began at 509 °C and concluded at 568 °C, with the maximum degradation peak observed at 551 °C. At the end of the process, the material displayed approximately 77% residue, which can be associated with the inorganic component.
Comparing the results of the physicochemical analysis between the PTFE film and the non-degraded PCB, it is evident that the composite exhibits greater thermal stability than the PTFE film. This enhanced stability may be attributed to the favorable compatibility between the PTFE film and the composite, as the PTFE and glass fiber reinforcement synergistically contribute to a thermally more stable system.
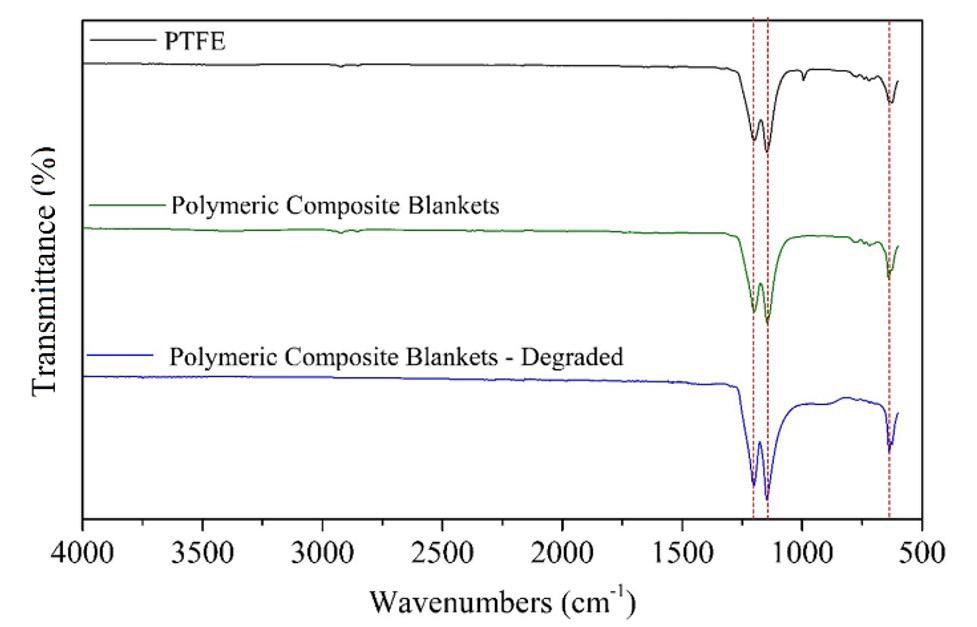
Figure 6. Molecular Bond Infrared Absorption Spectra FTIR analysis reveals molecular structures with distinct peaks at 1198 cm-1, 1146 cm-1, 990 cm-1, and 627 cm-1. Notably, the peak at 990 cm-1 demonstrates a significant loss in the case of degraded polymeric composite blankets.
Polímeros, 34(1), e20240002, 2024 6/9
T onset Tendset T max Residue PTFE film 491 °C 549 °C 518 °C 0.3% Not degraded polymeric composite blankets 515 °C 569 °C 554 °C 59.5% Degraded polymeric composite blankets 509 °C 568 °C 551 °C 77.0%
Table 2. Temperature of start (Tonset), end (Tendset), and maximum (Tmax) of the material degradation test.
Welding parameters process study of non-metallic expansion joints polymeric composite
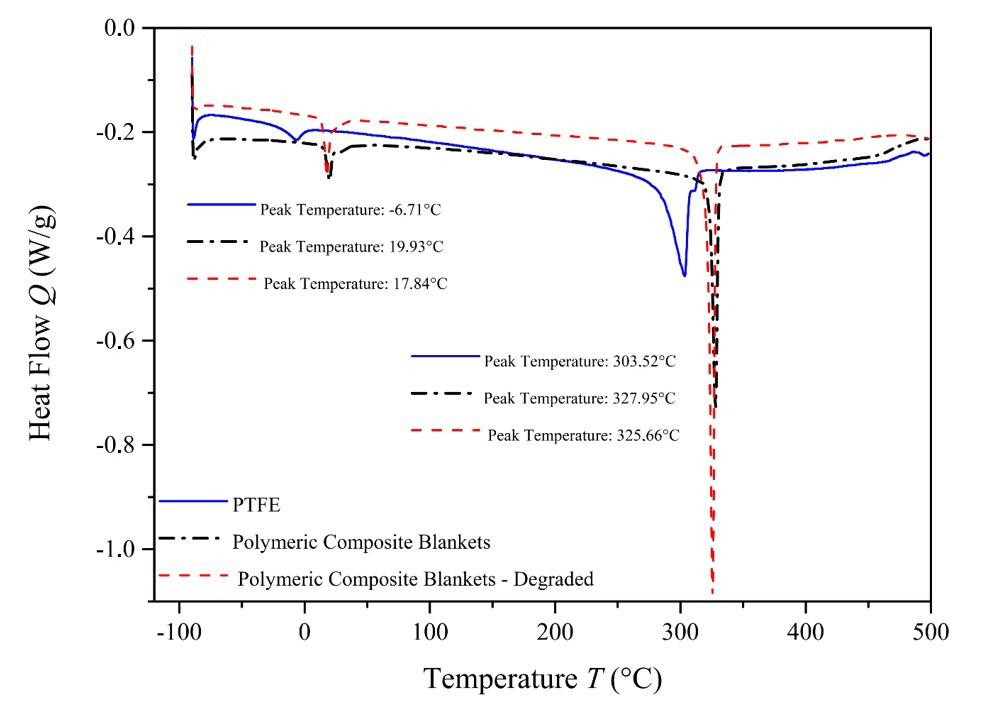
When comparing the results between the non-degraded PCB and the degraded PCB, it is observed that the nondegraded composite experienced greater mass loss. The degraded PCB retained traces of the polymeric phase, indicating that the previous welding process caused partial degradation of the PTFE phase present in the material, primarily affecting the surface region of the blanket while leaving the internal areas less affected by the degradation process.
Figure 7 illustrates the results of the differential scanning calorimetry (DSC) test, revealing the melting temperatures (peak) of different samples. The PTFE film exhibited a melting temperature of 303.5 °C, the non-degraded PCB had a melting temperature of 327.95 °C, and the degraded PCB had a melting temperature of 325.66 °C. It can be observed that the non-degraded PCB demonstrates an interaction between the matrix and fiber systems, resulting in a slight increase in the melting temperature of the polymeric phase within the fabric. The low-temperature phase transitions occurring around -6 to 19 °C may be associated with conformational changes in the solid phase of the material, considering its high degree of crystallinity[27]
4. Conclusions
Welding plays a crucial role in the production of non-metallic expansion joints using polymeric composite fabrics for structural sealing. The fabrication of polymeric composite blankets involves welding the fabrics together using PTFE (polytetrafluoroethylene) as the bonding element. Therefore, it is essential to study and determine appropriate welding parameters to ensure optimal structural efficiency.
Although the tensile strength of the welded composite is lower compared to the material without the welding process, employing suitable welding parameters allows for the production of polymeric composite blankets with desirable properties while utilizing lower temperatures than the conventional practice of 398.8 °C (750 °F). By welding the polymeric composite blankets at 371 °C (700 °F), an efficiency of 82% was achieved compared
to the non-welded material. Additionally, increasing the welding process time from 2 to 4 minutes improved the tensile strength limit of the produced blankets. However, prolonging the welding time to 6 and 10 minutes at 398.8 °C (750 °F) resulted in severe material degradation, as indicated by the presence of cracks that could facilitate the penetration of corrosive fluids. Such degradation processes can negatively impact the lifespan of the structure. Welding temperatures lower than 371 °C (700 °F), such as 351 °C (665 °F), did not yield satisfactory adhesion of the welded parts, leading to a lower tensile strength limit. The lowest tensile strength limit was observed in the welded system without the application of load pressure, emphasizing the significance of this parameter for achieving robust adhesion of the welded material.
Thermal and chemical analyses conducted on the polymeric composite blankets before and after the welding process demonstrated that appropriate time, temperature, and load application during welding resulted in superficial thermal degradation of the studied material. However, the structural integrity of the polymeric phase was maintained even after exposure to temperatures above the melting point of the polymer.
In summary, when assessing the influence of welding parameters for producing non-metallic expansion joints using polymeric composite blankets and PTFE as the bonding element, it is evident that temperature, time, and load application during the welding process significantly impact the behavior of the system.
5. Author’s Contribution
• Conceptualization – Marcos Dorigão Manfrinato; Luciana Sgarbi Rossino; Eduardo de Campos Leite; Rafael Roberto Pavani; Lucas Camargo Soares Carvalho da Silva.
• Data curation – NA.
• Formal analysis – Marcos Dorigão Manfrinato; Luciana Sgarbi Rossino; Eduardo de Campos Leite; Henrique Boschetti Pereira; Rafael Roberto Pavani; Lucas Camargo Soares Carvalho da Silva.
• Funding acquisition – Marcos Dorigão Manfrinato; Luciana Sgarbi Rossino.
• Investigation – Marcos Dorigão Manfrinato; Luciana Sgarbi Rossino; Eduardo de Campos Leite; Rafael Roberto Pavani; Lucas Camargo Soares Carvalho da Silva.
• Methodology – Marcos Dorigão Manfrinato; Luciana Sgarbi Rossino; Eduardo de Campos Leite; Rafael Roberto Pavani; Lucas Camargo Soares Carvalho da Silva.
• Project administration – Marcos Dorigão Manfrinato; Luciana Sgarbi Rossino.
• Resources – Marcos Dorigão Manfrinato; Luciana Sgarbi Rossino.
• Software – NA.
• Supervision – Marcos Dorigão Manfrinato; Luciana Sgarbi Rossino.
Polímeros, 34(1), e20240002, 2024 7/9
Figure 7. Differential calorimetric analysis for the PTFE film, not degraded polymeric composite blankets and the degraded polymeric composite blankets.
Manfrinato, M. D., Leite, E. C., Pavani, R. R., Pereira, H. B., Silva, L. C. S. C., & Rossino, L. S.
• Validation – Marcos Dorigão Manfrinato; Luciana Sgarbi Rossino; Eduardo de Campos Leite; Rafael Roberto Pavani; Lucas Camargo Soares Carvalho da Silva.
• Visualization – Marcos Dorigão Manfrinato; Luciana Sgarbi Rossino; Eduardo de Campos Leite; Henrique Boschetti Pereira; Rafael Roberto Pavani; Lucas Camargo Soares Carvalho da Silva.
• Writing – original draft – Marcos Dorigão Manfrinato; Luciana Sgarbi Rossino; Eduardo de Campos Leite; Henrique Boschetti Pereira; Rafael Roberto Pavani; Lucas Camargo Soares Carvalho da Silva.
• Writing – review & editing – Marcos Dorigão Manfrinato; Luciana Sgarbi Rossino; Eduardo de Campos Leite; Henrique Boschetti Pereira; Rafael Roberto Pavani; Lucas Camargo Soares Carvalho da Silva.
6. References
1 Senior do Brasil Ltda. (2021). Junta de expansão não metálica. Araçariguama. Retrieved in 2023, September 12, from http:// www.juniorflex.com.br/juniorflex/wp-content/uploads/2018/12/ junta_de_expansao_nao_metalica.pdf
2 CORETECH. (2017). Darlyn 1100 Saint-Gobain Performance Plastics Corporation
3 Figueiredo, A. B.-H. S., Carvalho, D. B., Aguilera, L. S., Melo, G. B. M., & Biasi, R. S. (2019). Response to ballistic impact of alumina-aramid-UHMWPE composites. In Anais do 73° Congresso Anual da ABM (pp. 491-499). São Paulo: Associação Brasileira de Metalurgia, Materiais e Mineração (ABM) http://dx.doi.org/10.5151/1516-392X-31399
4 Wise, R. J. (1999). Thermal welding of polymers Cambridge: Woodhead Publishing
5. Stokes, V. K. (1989). Joining methods for plastics and plastic composites: an overview. Polymer Engineering and Science, 29(19), 1310-1324 http://dx.doi.org/10.1002/pen.760291903
6 Grewell, D., & Benatar, A. (2007). Welding of plastics: fundamentals and new developments. International Polymer Processing, 22(1), 43-60 http://dx.doi.org/10.3139/217.0051
7 Ezekoye, O. A., Lowman, C. D., Fahey, M. T., & HulmeLowe, A. G. (1998). Polymer weld strength predictions using a thermal and polymer chain diffusion analysis. Polymer Engineering and Science , 38 (6), 976-991 http://dx.doi. org/10.1002/pen.10266
8 Teotia, M., & Soni, R. K. (2018). Applications of finite element modelling in failure analysis of laminated glass composites: a review. Engineering Failure Analysis, 94, 412-437 http:// dx.doi.org/10.1016/j.engfailanal.2018.08.016
9 Alderliesten, R. C. (2013). Critical review on the assessment of fatigue and fracture in composite materials and structures. Engineering Failure Analysis, 35, 370-379 http://dx.doi. org/10.1016/j.engfailanal.2013.03.022.
10 Zimmermann, N., & Wang, P. H. (2020). A review of failure modes and fracture analysis of aircraft composite materials. Engineering Failure Analysis, 115, 104692 http://dx.doi. org/10.1016/j.engfailanal.2020.104692
11. Barbosa, L. C. M., Souza, S. D. B., Botelho, E. C., Cândido, G. M., & Rezende, M. C. (2019). Fractographic evaluation of welded joints of PPS/glass fiber thermoplastic composites. Engineering Failure Analysis, 102, 60-68 http://dx.doi. org/10.1016/j.engfailanal.2019.04.032
12 Javaid , U. , Ling , C. , & Cardiff , P. ( 2020 ). Mechanical performance of carbon-glass hybrid composite joints in quasi-static tension and tension-tension fatigue. Engineering Failure Analysis, 116, 104730 http://dx.doi.org/10.1016/j. engfailanal.2020.104730
13. Du, Y., Ma, Y., Wang, Z., He, Y., & Wang, Z. (2021). Assessment of tensile behavior and failure mechanism in the two integrated composite joints. Engineering Failure Analysis, 129, 105628 http://dx.doi.org/10.1016/j.engfailanal.2021.105628
14. Hu, J., Mi, S., Yang, Z., Wang, C., Yang, Y., & Tian, W. (2022). An experimental investigation on bearing behavior and failure mechanism of bolted composite interference-fit joints under thermal effects. Engineering Failure Analysis, 131, 105830 http://dx.doi.org/10.1016/j.engfailanal.2021.105830
15 American Society for Testing and Materials – ASTM. (2016). ASTM D412-16: standard test methods for vulcanized rubber and thermoplastic elastomers: tension. West Conshohocken: ASTM International
16 Damdar, S. (2013, 1 december). Preventing failure of elastomeric expansion joints in FGD systems. POWER Magazine, Houston Retrieved in 2023, September 12, from https://www.powermag. com/preventing-failure-of-elastomeric-expansion-joints-infgd-systems/
17. Suwanpakpraek, K., Patamaprohm, B., & Chaikittiratana, A. (2019). Study of adhesive bonded joint failure in compositemetal joining. IOP Conference Series. Materials Science and Engineering, 501, 012023 http://dx.doi.org/10.1088/1757899X/501/1/012023.
18 Bi, K., Rui, Z., Xue, L., & Yang, J. (2021). Failure analysis and improvement of a non-metallic engineering part in an interference fit assembly process. Journal of Advanced Manufacturing Science and Technology, 1(1), 2020002 http:// dx.doi.org/10.51393/j.jamst.2020002
19 Pugmire, D. L., Wetteland, C. J., Duncan, W. S., Lakis, R. E., & Schwartz, D. S. (2009). Cross-linking of polytetrafluoroethylene during room-temperature irradiation. Polymer Degradation & Stability, 94(9), 1533-1541 http://dx.doi.org/10.1016/j. polymdegradstab.2009.04.024
20 De Paoli, M.-A. (2009). Degradação e estabilização de Polímeros São Paulo: Artiliber
21 Sikorska, W., Zieba, M., Musiol, M., Kowalczuk, M., Janeczek, H., Chaber, P., Masiuchok, O., Demchenko, V., Talanyuk, V., Iurzhenko, M., Puskas, J. E., & Adamus, G. (2020). Forensic engineering of advanced polymeric materials-part VII: degradation of biopolymer welded joints. Polymers, 12 (5), 1167. http://dx.doi.org/10.3390/polym12051167. PMid:32438761.
22 Wang, H., Wen, Y., Peng, H., Zheng, C., Li, Y., Wang, S., Sun, S., Xie, X., & Zhou, X. (2018). Grafting polytetrafluoroethylene micropowder via in situ electron beam irradiation-induced polymerization. Polymers, 10(5), 503 http://dx.doi.org/10.3390/ polym10050503 PMid:30966537.
23. Wang, S., Li, J., Suo, J., & Luo, T. (2010). Surface modification of porous poly(tetrafluoraethylene) film by a simple chemical oxidation treatment. Applied Surface Science, 256(7), 22932298 http://dx.doi.org/10.1016/j.apsusc.2009.10.055
24 Piwowarczyk, J., Jedrzejewski, R., Moszyński, D., Kwiatkowski, K., Niemczyk, A., & Baranowska, J. (2019). XPS and FTIR studies of polytetrafluoroethylene thin films obtained by physical methods. Polymers, 11(10), 1629 http://dx.doi.org/10.3390/ polym11101629 PMid:31600899.
25 Sun, L.-L., Zhang, Z.-G., & Zhong, W.-H. (2011). Fluorination deposition on carbon nanofibers by PTFE decomposition as a facile method to enhance dispersion and interaction in PVDF composites. Journal of Materials Chemistry, 21(4), 944-950 http://dx.doi.org/10.1039/C0JM03260C
Polímeros,
e20240002, 2024 8/9
34(1),
Welding parameters process study of non-metallic expansion joints polymeric composite
26 Oshima, A., Ikeda, S., Katoh, E., & Tabata, Y. (2001). Chemical structure and physical properties of radiation-induced crosslinking of polytetrafluoroethylene. Radiation Physics and Chemistry, 62(1), 39-45 http://dx.doi.org/10.1016/S0969-806X(01)00420-0
27 Shulga, Y. M., Vasilets, V. N., Kiryukhin, D. P., Voylov, D. N., & Sokolov, A. P. (2015). Polymer composites prepared by low-temperatu re post-irradiation polymerization of
C2F4 in the presence of graphene-like material: synthesis and characterization. RSC Advances , 5(13), 9865-9874 http://dx.doi.org/10.1039/C4RA09074H
Received: Sept. 12, 2023
Revised: Oct. 26, 2023
Accepted: Nov. 23, 2023
Polímeros, 34(1), e20240002, 2024 9/9
Thermodynamics of the polymerisation of polyglycerols in an acidic and micellar environment
Vadilson Malaquias dos Santos1 , Fabricio Uliana1 , Rayanne Penha Wandenkolken Lima1 and Eloi Alves da Silva Filho1*
1Laboratório de Físico-química, Departamento de Química, Universidade Federal do Espírito Santo – UFES, Vitória, ES, Brasil *eloisilv@gmail.com
Obstract
This work consisted of studying polyglycerols in an acidic and micellar environment. The effects on surface tension, micellisation, and the Gibbs free energy of interface liquid-liquid (w/o) for directing the etherification of monomer glycerol with n-hexanol, n-octanol, n-decanol, n-dodecanol, and micellar solutions of sodium dodecylsulfate and dodecylbenzenesulfonic acid were studied at 70, 90 and 130°C . Polyglycerols with low weights and prepolymers were obtained. Theoretical methods such as density functional theory and molecular dynamics simulations were used to examine the effects of surface tension, the conformations of glycerol, and the position of the hydroxyl group of alcohols. A theoretical analysis (DFT/B3LYP) of the potential energy surface of glycerol and alcohols allowed finding stable conformations of the molecule, differing in the relative arrangement of hydroxyl groups. Our results helped achieve a better understanding of the interaction complex process of surfactant/catalyst of glycerol reactions in biphasic systems.
Keywords: hydroxyl groups, liquid systems, surfactants.
How to cite: Santos, V. M., Uliana, F., Lima, R. P. W., & Silva Filho, E. A. (2024). Thermodynamics of the polymerisation of polyglycerols in an acidic and micellar environment. Polímeros: Ciência e Tecnologia, 34(1), e20240003. https://doi.org/10.1590/0104-1428.20220110
1. Introduction
Polyglycerols (PGs) are highly biocompatible and multifunctional polymers prepared from dicarboxylic acids, alcohols, or diols, which have a wide range of applications in the fields of pharmaceutics, biomimetic materials, foods, cosmetics, and catalysts [1-4]. The (1,2,3-propanetriol) glycerol (GLY) is completely soluble in water and numerous alcohols; it has three hydroxyl groups and is a highly flexible molecule which can form both intramolecular and intermolecular hydrogen bond networks, and its conformation (α, β, and γ) depends on variations in temperature and/or pressure[5]. The high viscosity and hydrophilicity of GLY and its selectivity resulting from the homo- or hetero- etherification of aliphatic alcohols cause the low yield of direct etherification and polymerization[6-8]. The Brønsted Acid-Surfactant-Combined Catalysed reactions of GLY have been shown to represent an excellent process capable of efficiently promoting the reaction of GLY under liquid/liquid biphasic system conditions[7-12]. Several studies in the literature have considered the performances of dodecylbenzenesulfonic acid (DBSA) for catalysis in biphasic water/oil (w/o) mixtures [11,12]. In comparison, sodium dodecylsulfate (SDS) is a surfactant exhibiting sulfonic sites which can also operate at the water/oil interface[12]. The properties of micelle formation and reduction of the surface tension in aqueous solutions gives surfactants excellent catalyst properties for the synthesis of PGs, in particular,
because of the formation of microemulsions during the reaction[13-17]. As an alternative, non-ionic admixtures of surfactants and fatty alcohols, i.e., aliphatic hydrocarbons containing a hydroxyl group usually in the terminal or n-position (range C6-C35) affect the catalytic activity of polymerisation[18,19] .
In this paper, experimental and theoretical methods were applied to study the effects of on surface tension, micellisation, molecular conformation, and Gibbs free energy of w/o interfaces; a synthetic strategy was used to prepare PGs through the direct etherification of GLY with alcohols using heterogeneous interfacial acidic catalysts and surfactants, SDS and DBSA, in the presence of acid cocatalysts.
2. Materials and Methods
2.1
Chemicals
The surfactants and other compounds used included DBSA (Sigma-Aldrich), SDS (Sigma-Aldrich), GLY (Sigma-Aldrich), sulfuric acid (Merk), chloridric acid (Sigma-Aldrich), acetic acid (Sigma-Aldrich), zinc chloride (Sigma-Aldrich), copper oxide (Sigma-Aldrich), potassium hydroxide (Merk), pyridine (Merk), 1-hexanol (HEX1; Vetec), 1-octanol (OCT1; Merk), 1-decanol (DEC1; Merk), and 1-dodecanol (DO1; Vetec).
https://doi.org/10.1590/0104-1428.20220110 O O O O O O O O O O O O O O O Polímeros, 34(1), e20240003, 2024 ISSN 1678-5169 (Online) 1/10
V. M., Uliana, F., Lima, R. P. W., & Silva Filho, E. A.
2.2 Polymerization procedure
Mixtures of 1:1 (m/m) SDS and HCl and 1:1(m/m) SDS and ZnCl2 were placed into a mortar where the mixture was ground for 5 min and allowed to stand for 10 min. A mixture of DBSA (32.6 g) and copper oxide (7.96 g) with a 1:1 molar ratio was added into a 100 mL three-neck flask and separated over 30 min at room temperature; the mixture was stirred at 25ºC, slowly heated to 110ºC, and kept at this temperature for 3 h in order to remove the water formed during the reaction process. The reaction was then cooled to 25 ºC. An equimolar mixture of GLY, aliphatic alcohols (HEX1, OCT1, DEC1, and DO1) and 5, 10, 15, and 20 mol% DBSA, DBSA/copper oxide, SDS/HCl, and water/SDS/ZnCl2 catalysts, respectively, were added to a 50 ml single-necked round-bottom flask with a reflux condenser. The reaction mixture was continuously stirred using a magnetic stirrer for 20-24 h at room temperature or heated slowly to 70, 90, and 130ºC. A semisolid or solid was obtained which was filtered off, thoroughly washed with water, and dried in vacuum. For the water/GLY/alcohol system, an equimolar GLY was added to 50 mL of deionised water and 30 mol% DBSA and for the DBSA/copper oxide or SDS/HCl, water/SDS/ZnCl2, respectively in a 200 mL of erlenmeyer flask with stirring at 80 ºC, after, added an equimolar aliphatic alcohols. The reaction mixture was then continuously stirred again using a magnetic stirrer for 20-24 h at heated slowly to 80, 90, and 130ºC.
2.3 Surface tension and critical micelle concentration (CMC) measurements
Surface tensions were measured using a Lauda TD3 tensiometer equipped with a Pt-Ir du Nouy ring at 25 ± 0.2ºC. All measurements were performed using solutions over a range of temperatures (25−65ºC). Specific conductivity data were measured with a conductometer to determine the critical micelle concentration (CMC) of the surfactant solutions. All the water was deionised.
2.4 Characterisation methods
DSC thermograms were recorded on a DSC Q200 (TA instruments). The samples were first cooled down to −80 ºC and then heated to 300 ºC at a ramping rate of 5 ºC/min. The DSC was used under an N2 atmosphere to determine the glass transition temperature (Tg) and the temperature program equilibration was performed at T = −80 ºC. The first scan was performed to eliminate the thermal history of the polymers and remove volatile substances. A second heating cycle up to 300 ºC was completed at a rate of 5 ºC/min. The FTIR spectra were recorded on a FTLA 2000-102 (ABB Bomen) in the range between 4000-500 cm-1. The hydroxyl value of the PGs was determined according to ASTM D4274-11[4]. The hydroxyl numbers of PGs were determined by measuring the free hydroxyl groups of the PGs acetylated with a solution of acetic anhydride- pyridine in a pressurised bottleat 98ºC, and the acetic acid was titrated with a 1.0 mol/L standard solution of potassium hydroxide (KOH). Viscosity was measured on a Rheotek RPV-1 viscometer at 25 ºC. The molecular weight of the PGs is measured by using viscometer technique.
2.5 Computational details
The structures of all the reactants and surfactants were generated manually using the Avogadro program[20]; these structures were initially optimised with the semi-empirical Hamiltonian PM7 using MOPAC2016 program[21] while the minimum energies and frequency calculations were re-optimised with density functional theory (DFT) calculations considering the B3LYP hybrid functional, with a 6-31G(d) basis set, DEF2-TZVP level of theory in the gas phase, and wb97X-D3 def2-SVP in the aqueous phase . All DFT calculations were carried out in vacuum and aqueous phase using the Orca 5.0.3 package[22]. The natural bond orbital (NBO) populations, frontier molecular orbital (FMO) properties, second-order perturbation stabilisation energies, dipole moments, and Fukui reactivity functions were further investigated using DFT while the molecules/system were prepared using the LigParGen web server[23], ACPYPE software[24], and PACKMOL software version 18.169[25]. The SPC and TIP3P models were applied for water[26]. All molecular dynamics (MD) simulations were performed with the GPU code of the GROMACS 2022.2 package, OPLS-AA force field[27]. The MD simulations of the liquid–liquid interface of the GLY/DO1 and water/DO1 systems were performed on the canonical (N, V, T) ensemble using a Nosé-Hoover thermostat set at a temperature of T = 22 ºC. The pressure tensor method was used to compute the interfacial tension, with the interface positioned perpendicular to the z-axis[15]
3. Results and Discussions
Glycerol and longer-chain alcohols are considered molecules that can form insoluble monolayers, thereby limiting mass transfer in reactions. The protonation of GLY is the first step in acid-catalysed oligomerisation, on the three reactive sites to accept a proton (two α sites and one β site) or three possible structural arrangements of the CH2OH and OH groups: α, β, and γ[5,7,28,29]. This leads to the formation of diglycerol and tri-glycerol through the reaction of two or three GLY molecules (Figure 1A for molecules (6), (7), and (8)), and tri-glycerol through the reaction of two or three GLY molecules through primary hydroxyl. The direct etherification of DO1 and GLY produced hetero-ethers and homo-ethers (Figure 1B, molecules (10) and (11)) which are surface-active reagents[29] . Figure 2 shows the scheme of polymerisation of GLY in the presence of surfactants/water and surfactant-combined catalysts for 10 mol% of DBSA in a biphasic medium stirred at 130°C for 24 h. A monophasic system was observed for up to 20 mol% of DBSA. These results suggest that the stability of the emulsion, the temperature, and the interface contact are import factors for the formation of monomers. GLY/DO emulsions are unstable at high temperatures (~150°C). The results of the synthesis were in good agreement with those obtained in the literature for other similar synthesis procedures using a DBSA combined-catalyst[17,29,30]. The catalytic activity of the SDS is equivalent to that of the Brønsted acids and greater than that of most Lewis acids (SnCl4.6H2O, FeCl3.6H2O, and LnCl3.6H2O). In fact, SDS can hydrolyse into acid and alcohol under acidic conditions[31,32]. Moreover, SDS lowers the interfacial tension between phases to produce a transparent microemulsion and increases the effectiveness of a cocatalyst[33,34]
Polímeros, 34(1), e20240003, 2024 2/10
Santos,
3.1 Polymers characterization
The synthesis produced low molecular weight PGs prepared of up to range 2,500-3,880 g/mol and the hydroxyl numbers of the polymers[4] obtained from the polymerisation of GLY ranged from 684 to 920 mg KOH/g (Table 1). PGs are colorless to yellowish solids and semisolids at room temperature (Figure 3).
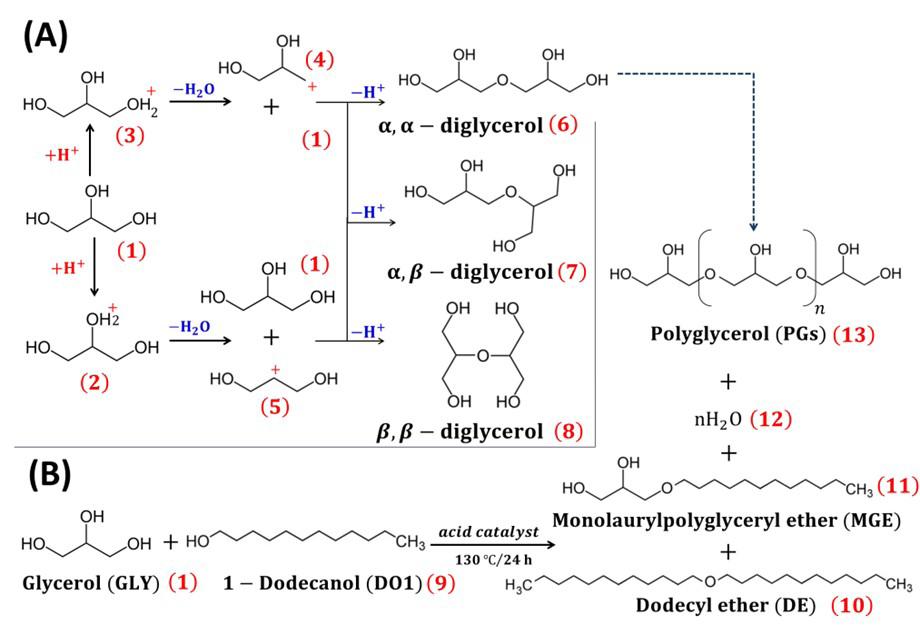
Figure 1. Reaction networks for the catalytic etherification of glycerol in acid medium (A) Homogeneous acid-catalyzed dimerization of glycerol. Adaptad of Valadbeigi and Farrokhpour[28]; (B) Direct etherification and polymerization of dodecanol and glycerol. Adaptad of Gaudin et al.[29] and Fan et al.[30]
Fourier transform infrared spectroscopy (FTIR) was used to identify the functional groups in the synthesised PGs (Figure 4). The PGs spectra showed the presence of hydroxyl group bands from 3050 to 3600 cm−1 indicative of alcohol groups. The absorption band at 1700–1750 cm−1 was related to C=O stretching due to the presence of acrolein (C3H4O) while the band at 2891 cm−1 was associated with aliphatic C-H. The peak at 1455 cm−1 that corresponded to C-OH in-plane bending and CH2 bending, and the absorption at 1000–1150 cm−1 were related to the C-O stretching of the ether groups within the PG backbone. For polyglycerol PG1, the absorption ranging from 1734 to 1176 cm−1 was related to the C=O and C-O of ester groups, while C-H stretching produced bands ranging from 2875 to 2950 cm−1 (sp3). Polyglycerols, on the other hand, show three intense peaks at 3300, 2891, and 1100 cm−1 corresponding to the hydroxyl (OH), aliphatic C–H, and C–O bonds[29-32] .
The thermal behaviour of the synthesised PGs was characterised by differential scanning calorimetry (DSC). The measurements of the thermal decomposition of the polymers allowed us to evaluate the temperature dependence of the PGs backbone structures.
DSC measured a melting temperature (Tm) during heating. Figure 5 plots the results for the PG1, PG2, and PG3. The Tg is observed as a slightly discernible step in the curves between –69.7, –42.8, and –16.5 °C. A melting transition is observed for PG1 at approximately –45.9 °C and, 2nd at 50.5 °C. The cold crystallisation took place at 1.8 °C.
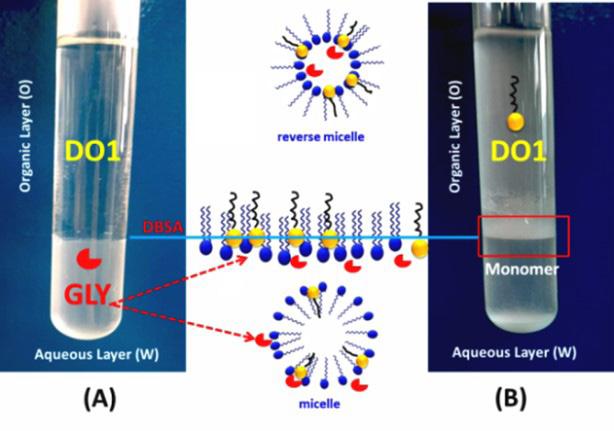
Figure 2. Concept of biphasic catalysis using surfactants (DBSA and SDS). (A) Start reaction, micelle and reverse micelle occupation by GLY and DO1; (B) Stabilize glycerol/dodecanol emulsions and low monomer prepolymer of polyglycerol.
Table 1. Properties of polyglycerols synthesized.
Polímeros, 34(1), e20240003, 2024 3/10
Thermodynamics of the polymerisation of polyglycerols in an acidic and micellar environment
Name Reaction conditions Molecular weight (g/mol) Viscosity (mPa.s) 20 ºC hydroxyl value (mg.KOH/g) GLY Pure 92 1,412 1,829 PG1 DBSA/DO1/H+/130ºC/24h 3,880 10,893 684 PG2 SDS/OCT1/H+/ZnCl2/70ºC/20h 2,556 7,730 903 PG3 SDS/DO1/H+/FeCl2/90ºC /24h 3,280 9,893 920
V. M., Uliana, F., Lima, R. P. W., & Silva Filho, E. A.
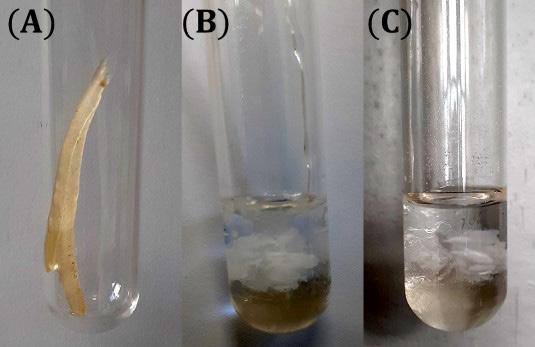
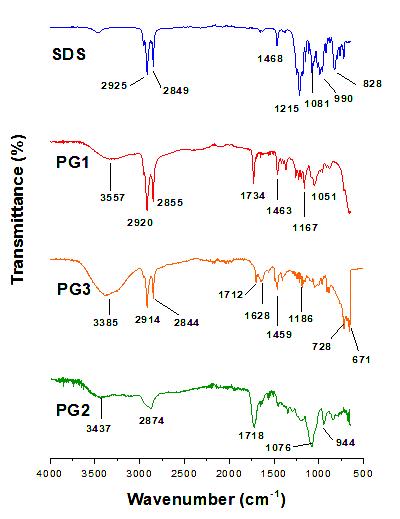
Figure 4. FTIR spectra of SDS, polyglycerol (PG1) and polyglycerol monomers (PG2 and PG3). The main peaks associated with the structures are highlighted.
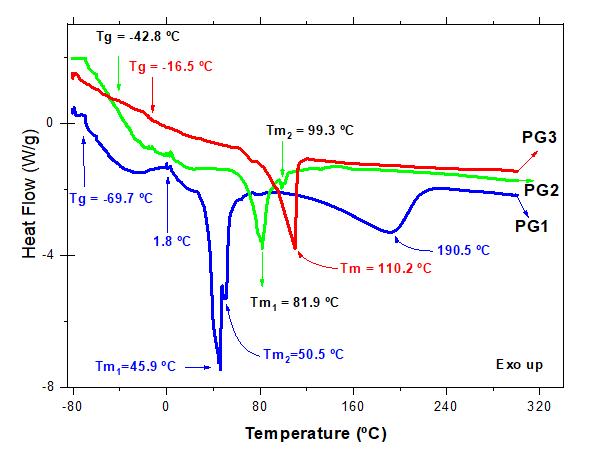
Figure 5. DSC curves for polyglycerol PG1, PG2 and PG3 thermal decomposition at a rate of 5 ºC/min.
The peak at 190.5 °C is relative to thermal degradation. The trend noted for the endothermic melting transition of PGs as temperature increases is a narrowing of the transition region for PG2 and PG3, a reduction in peak magnitude, and a general shift of the peaks towards high temperatures. The presence of endothermic peaks indicates that the PGs samples are semi-crystalline. The relative differences in a sample’s degree of crystallinity can be quantified by measuring the relative differences between areas under the melting peaks. ( m H∆ ) was calculated as the area under the peak by numerical integration: PG1 (80.57 J/g), PG2 (44.30 J/g), and PG3 (71.59 J/g).
3.2 Surface tension and CMC
The effect of alcohols on the interfacial tension can be described by their co-adsorption with surfactants in a mixed adsorption layer. The interfaces of the liquid-liquid system and the CMC are essential to the polymerisation of PGs, as they are often considered to be active sites for phase-transfer catalysis. All measurements of the surface tensions and CMC of the liquid-liquid systems, each in contact with surfactants, were performed over the same range temperature (25-65ºC). The specific conductance of SDS or DBSA changes with the total surfactant concentration and with temperature[35-37]. The values of CMC were obtained from the intersection of the two lines extending from the ‘before micellisation’ and the ‘micellar’ phase for all the considered temperatures. For SDS at 25ºC, the CMC was 7.01mmol/L and at 65ºC it was 9.91 mmol/L; for DBSA, the CMC was 37.5 mmol/L at 20ºC and 39.0 mmol/L at 50ºC. The CMC of SDS decreased from 7.01 to 6.05 mmol/L with the addition of zinc chloride due to the insertion of a counter ion between the surfactant molecules. In the same way, iron (II) chloride was highly soluble in water(64.4g/100 mL at 10°C), alcohol, and acetone, affecting the CMC of SDS. Copper (II) oxide was insoluble in water, GLY, and alcohols, acting as solid base catalyst for the reaction of GLY etherification[35]. The CuO did not reduce the interfacial tension of the system because it was not charged.
The aggregation number ( ) 3 2.5229 nld = ∆ was calculated for all the temperatures considered, where 0 1.51.265 c lnA =+ is the length of the hydrocarbon chain attached to the head group, nc is the number of carbon atoms attached to the hydrocarbon chain, and 21ddd∆ =− and di are the densities of the water or oil solvent and surfactant solutions, respectively[37]. The degree of micellar ionisation ( 21 / SS α = ) was taken as the ratio of the slopes of the straights ( 1S ; 2 S ) with inflection in CMC[37]. The degree of counterion binding ( 1 βα =− ), α, CMC, aggregation number and surface tension are listed in Table 2 and 3 The Gibbs free energy of micellisation ( Gmic∆ ) could be approximated with Equation 1.
In the plot showing Gmic∆ versus temperature, the slope was defined as 0 mic S∆ and the intercept was equal to 0 mic H∆ [36] For SDS, 25ºC, 0 20.6KJ/mol Gmic =− ∆ , 0 36.4/ mic HKJmol =− ∆ and 0 0.032KJ/mol mic S =− ∆ Table 4 lists the data obtained for the DBSA and SDS solutions and the w/o interface. The
Santos,
Polímeros, 34(1), e20240003, 2024 4/10
( ) 2 ∆∆=−= ∆ micmicmic GHTS RTlnCMC α
(1)
Figure 3. Image of a PGs (A) ellipsoids form of PG1 (B) interfacial semisolid of PG2 (C) semisolid aggregates of PG3.
Thermodynamics of the polymerisation of polyglycerols in an acidic and micellar environment
Table 2. The degree of counterion dissociation (α) and binding (β) from/to the micelles and the slopes ( 12 ; SS ), CMC and aggregation number (n) for SDS.
Table 3. The degree of counterion dissociation (α), binding (β) and CMC from/to the micelles and the slopes ( 12 ; SS ), CMC and aggregation number (n) for DBSA.
Table 4. Surface tension (mN/m) data obtained with DBSA, SDS and interface water/oil*.
*w – water; o – dodecanol. Error: ±0.5 mN/m.
Table 5. Surface tension (mN/m) of binary organic-water systems and mixture**.
**25 ±0.2ºC, Concentration: SDS 8 mmol/L; PG 0.2 g/mL. Volume: GLY 9.5 mL; alcohol 20.0 mL; water 20.0 mL. Error: ±0.5 mN/m.
initial interfacial tension of water at 20 °C was measured as 71.9 mN/m, which was very close to the value suggested in the literature (72 mN/m). The interfacial tensions between SDS and water, DBSA and water, and DO1 and water may also need to be confirmed (Table 4). The effects of SDS, GLY, and PG in aqueous solution on the initial interfacial tensions for three water-organic systems is provided in Table 5. Pure GLY had a surface tension of 63.4 mN/m at 20 °C. The interfacial tension had a value of 35.4 mN/m for GLY (20 wt%) and SDS (0.2 wt%) at 20°C. Fatty alcohols are insoluble in water and in the absence of salt, alcohol always reduces the surfactant aggregation number in the mixed surfactant/alcohol micelles, even with long-chain alcohols such as HEX, OCT, and DO[38,39]
3.3
Theoretical study
In aqueous environments, asymmetric alcohols where the hydroxyl group is not located at a chain, and which lack any symmetry elements – except for the identity operation (C1) – will preferentially form monolayers at the water/ vapour interface, which interferes with the catalytic process
of PGs[40] Figure 6A shows the optimised structures of alcohols with the minimum energy obtained through the DFT method; only the structures of DO conformers (g, gauche and t, trans) obtained with B3LYP/6-31G(d) in a gas phase are presented. However, no significant differences were observed when comparing these structures with the DFT/B3LYP/6-31G and wb97X-D3 def2-SVP in water. For instance, the main differences observed were in angle of the attached C−OH groups (Figure 6B). Figure 6C shows the molecular electrostatic potential (MEP) obtained from NBO atomic charges at the wb97X-D3 def2-SVP level for alcohols and the SDS and DBSA surfactants. According to the MEP analysis, the hydroxyl group position changed the electrostatic surface of the isomers of alcohols. With the exception of the hydroxyl group position at the alcohols and head regions of the surfactants, the distribution of the MEP was homogeneous for the tails in the molecules shown in Figure-6c, implying that there were specific sites which were available for nucleophilic and electrophilic attacks.
The electrostatic potential and conformations of GLY are shown in Figure 7 Figure 7A shows the MEP surfaces of the
Polímeros, 34(1), e20240003, 2024 5/10
Isotherm
CMC (mmol/L) ± 0.5 S1 S2 α ± 0.02 β n 25 7.20 67991 22041 0.324 0.676 69.02 35 7.72 63987 23281 0.364 0.636 64.20 45 8.32 67244 25268 0.378 0.624 55.10 55 8.93 67833 31985 0.471 0.528 47.63 65 9.91 68996 30839 0.447 0.553 40.11
(oC)
Isotherm (oC) CMC (mmol/L) ± 0.3 S1 S2 α ± 0.04 β n 10 36.9 276.0 551.9 0.50 0.50 104 20 37.5 397.0 554.0 0.72 0.28 98 30 37.8 464.9 562.8 0.82 0.18 93 40 38.6 384.8 577.3 0.66 0.34 87 50 39.1 520.5 598.8 0.87 0.13 82
Temperature (ºC) Water Water/SDS Water/DBSA Interface tension 25 71.9 33.5 41.5 29.0 35 74.1 32.6 30.4 28.7 45 68.7 32.6 32.1 17.6 55 67.1 31.9 32.7 17.4 65 65.3 31.5 31.8 16.2 70 64.5 31.4 32.5 15.8
System Pure SDS SDS/GLY SDS/PGs PG/GLY PG Water/HEX1 18.76 29.59 18.38 16.29 16.05 15.32 Water/OCT1 19.0 18.5 19.2 18.4 19.2 20.5 Water/DO1 29.0 33.5 24.1 23.0 29.3 28.4
Santos, V. M., Uliana, F., Lima, R. P. W., & Silva Filho, E. A.
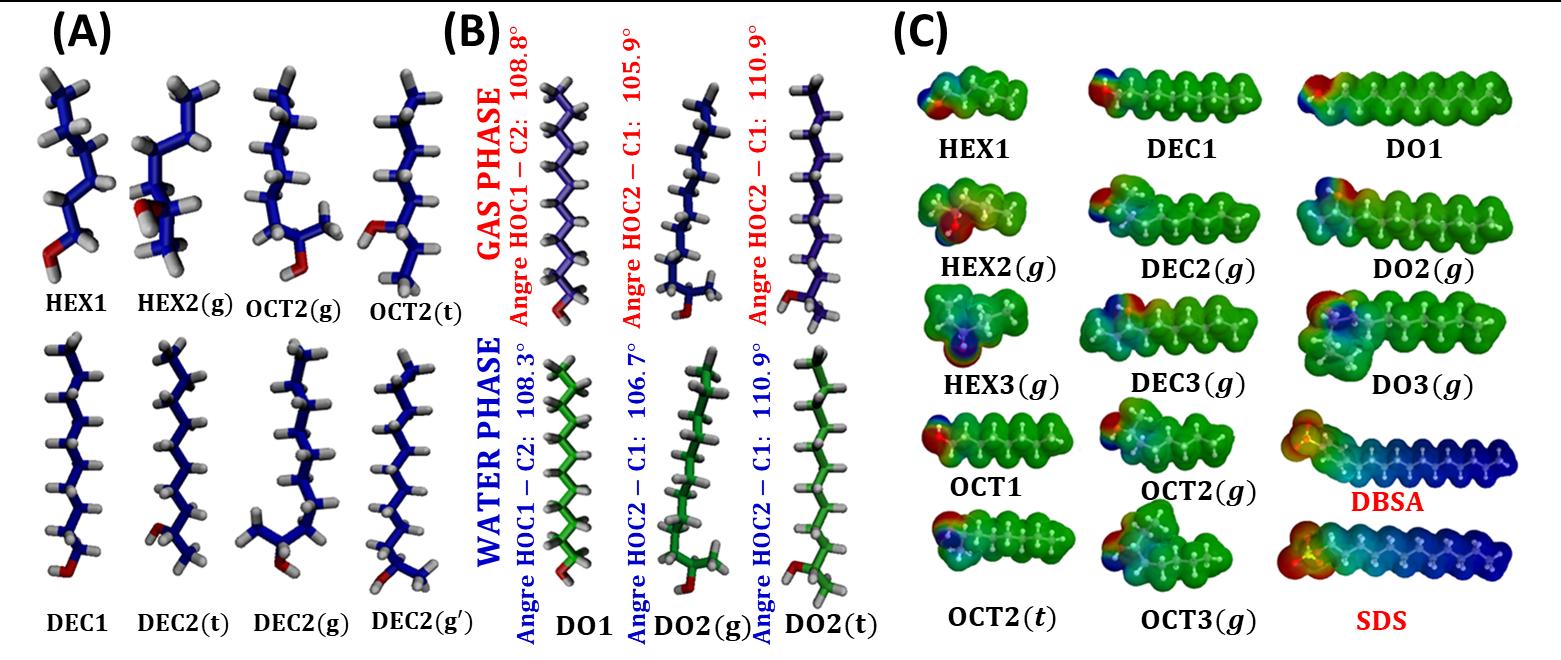
Figure 6. Structures and conformation of the alcohols and surfactants optimized with (A) DFT//B3LYP/6-31G (d) method; (B) Gas phase, DFT/B3LYP/6-31G and water phase, wb97X-D3 def2-SVP level; (C) Calculated (wb97X-D3 def2-SVP) Molecular Electrostatic Potential (MEP) of the alcohols isomers and surfactants.
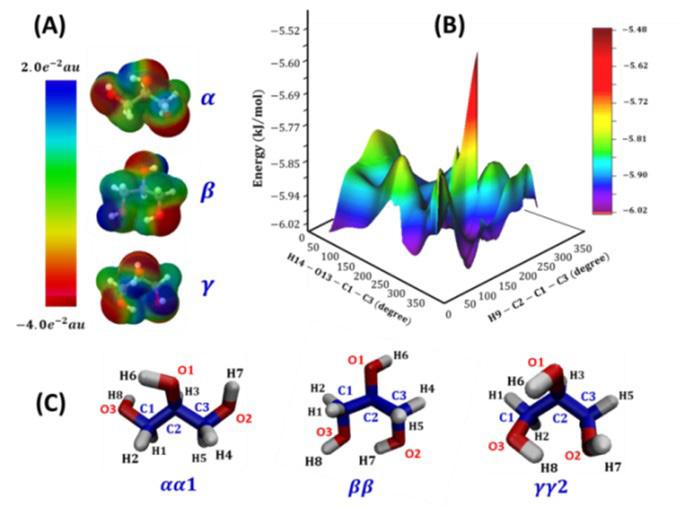
Figure 7. The conformations and properties of glycerol (A) The electrostatic potential is mapped onto the electron density surface with an isovalue of 0.0004 e-/au3 of α, β and γ conformations of glycerol; (B) The partial potential energy surface of glycerol calculated at a PM7 levels; (C) Computed structures αα1, ββ and γγ2 of glycerol
α, β, and γ conformers of GLY and clearly indicates in the conformers has high electron density (red colour) changed with the geometry of hydroxyl group position. Significant differences were observed among the structures of the GLY conformers. The potential energy surface (Figure 7B) describes the relationship between the energy of a GLY molecule and its geometry as a function of dihedral D6 and D11 torsion angles The global minimum around dihedral (D6) and (D11) are relative of stable structures of GLY. For instance, most of the preferred conformers of GLY have two C5 axes of symmetry hydrogen bonds in a gas phase, but in a liquid (water)
phase, the hydrogen bonds of GLY appear to be weaker. The minimum energy was checked by the non-negative frequencies observed in the harmonic vibrational calculations. Here, the semi-empirical PM7 method was used to obtain an estimate of the variation in energy of the molecule as a function of the dihedral D6 and D11 torsion angles, which corresponded to the H9−C2−C1−C3 and H14−O13−C1−C3. The partial potential energy surface of GLY is shown in Figure 7B Figure 7C illustrates the αα1, ββ, and γγ2 of the GLY optimised with DFT//B3LYP/6-31G(d) method. The solvation process weakened the hydrogen bonds of the
Polímeros, 34(1), e20240003,
6/10
2024
Thermodynamics of the polymerisation of polyglycerols in an acidic and micellar environment
GLY, enlarged its potential surface and exists as an ensemble of many feasible local minima in water system. Glycerol consists of a blend of molecules with different conformations, and structural arrangements of hydroxymethyl (CH2OH) and hydroxyl (OH) groups; indeed, there are 126 possible conformations in the gas, liquid, and solid states[28]
Molecular dynamics simulations were used to estimate the interfacial tensions for two immiscible liquid phases within the w/o reaction system. The w/o interfacial tension, g, was calculated using Equation 2, where Lz is the box length along the z-axis direction, Pxx , Pyy , Pzz are the normal and tangential components of the pressure tensor, and n is the number of interfaces in the system of the simulation box on the molecular dynamics[13-15]
in a 10:1 ratio, where the latter had a density of ~831 kg/m3 at 298 K. The oil system was then mixed with the SPC and TIP3P water models to form two separate phases. Indeed, the density profile of this system showed that the water phase and the oil phase were perfectly separated. Based on the trajectory processing of this system simulation, an interfacial tension of 58.95 mN/m was obtained at 25 °C for the w/o liquid-liquid system. If the temperature was raised to 80 °C, the interfacial tension decreased to 56.54 mN/m. This was caused by the interaction of w/o, which was becoming stronger with rising temperatures. The results of the MD indicate that as the SDS or DBSA surface density increased, both the interfacial tension and the interfacial entropy increased: 25 °C, 28.30 mN/m and 353K, 18.86 mN/m for SDS.
To represent oil, we employed a mixture of DO1 and catalysts while the water was represented by an aqueous DBSA or SDS solution. The simulation box was a cubic cell with dimensions of 10 × 10 × 15 nm3 for systems where the organic phase was a pure component and 9 × 9 × 16 nm3 for systems where the organic phase consisted of 85/15% wt DO1/surfactant/catalyst (Figure 8). Initially, the oil model used in this study involved a mixture of DO1 and a surfactant
The MD and ab-initio study reveal that in the GLY-αγ1 conformer the inter-molecular H-bonds led to the formation of bidentate ligands in the OH-groups of DO1 (Figure 8C), and for the intra- and inter-molecular H-bonds, five-member atoms rings in the αα and αγ conformers were formed. A six-atom ring coordination appeared in the γγ conformer. Angular molecular geometries were observed in the DO1, in which there was an important angle variation in 109° for 105° in the OH-groups. In the water/DO1 system HO−C bonding angles of 112° were observed for the dimers of DO1−HO----HO−DO1 and
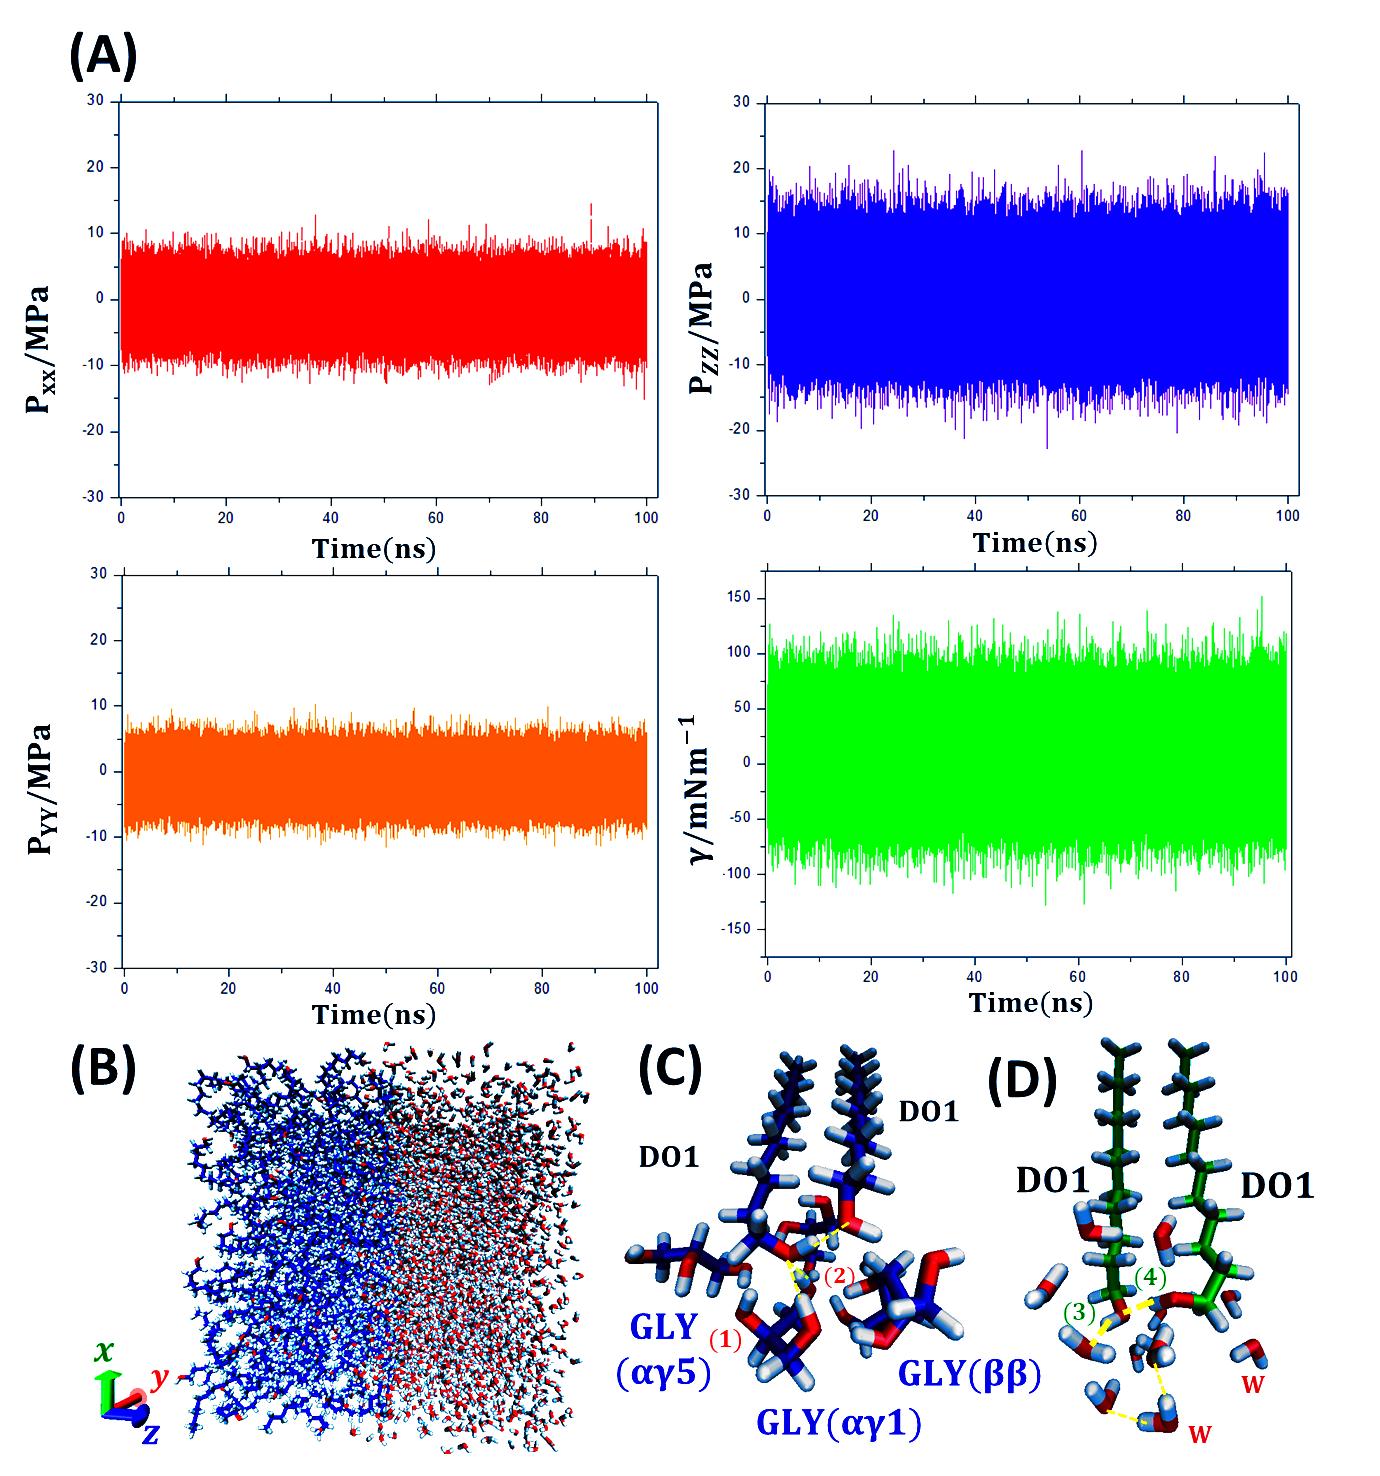
8. MD simulation details (A) diagonal elements of the pressure tensor Pxx, Pyy and Pzz and the resulting interfacial tension, γ, evaluated over the volume simulation box for the case biphasic system DO1/Water; (B) simulation box; (C) Snapshots obtained at 50 ns of the MD simulation for coordination geometries assumed by glycerol molecules upon H-bonding of dimer (tt) DO1 (D) Snapshot of H-bonding water OH-DO1 dimer (tt).
Polímeros, 34(1), e20240003, 2024 7/10
( ) ( ) ( ) ( ) 0 ,, 1 , 2 Lx xxyy zz PztPzt tPzt dz n γ + =− ∫ (2)
Figure
Table 6. Electronic properties calculated using
angles of 113° appeared for DO1/water. Moreover, the water dipole was oriented toward the water bulk phase. The strong water/DO1 interaction was supported by the arrangements of surfaces for layers that were on top of eachother and which had a minimal surface roughness; the OH-groups and H2O had overlapping densities in the z-direction. The most likely H-bonding configuration of DO1 derived from each molecule having one H-bond with water and two H-bonds with another molecule of DO1. Electronic properties play an important role in determining the efficacy of alcohol/GLY and surfactants as phase-forming components of biphasic systems. In the surfactants, the frontier molecular orbitals may predict how the charge transfers along the catalysis occur from liquid-liquid surface process or micelle. The reactivity parameters were based on the energies of the HOMO and those of the LUMO and Koopmans’ theorem[41] Table 6 shows the data collected for the quantum molecular descriptors quantum molecular descriptors: global hardness (η), electronegativity (χ), electronic chemical potential (µ), electrophilicity (ω) and softness chemistry (σ ). The values of Eg imply a high or low stability or reactivity[42] .
Therefore, both DBSA and SDS were considered stable compounds with values of 4.09 eV and 4.53 eV, respectively, but the alcohols were deemed stable with values ranging from 8.12−8.28 eV.
4. Conclusions
The polymerisation of PGs in an acidic medium was conducted successfully using an emulsion/micellar environment technique, and our theoretical studies (DFT and MD simulation) point to the influence of the conformation of alcohols and surfactants on the formation of micelles and their interface with influence on the catalytic process. We suggest that further studies are needed to better understand the effects of SDS and acid cocatalysts on the formation of hetero-ethers, alcohols, and homo-ethers.
5. Author’s Contribution
• Conceptualization – Vadilson Malaquias dos Santos; Fabricio Uliana.
• Data curation – Vadilson Malaquias dos Santos; Fabricio Uliana; Rayanne Penha Wandenkolken Lima.
• Formal analysis – Vadilson Malaquias dos Santos; Fabricio Uliana; Rayanne Penha Wandenkolken Lima.
• Funding acquisition – NA.
• Investigation – Vadilson Malaquias dos Santos; Fabricio Uliana; Rayanne Penha Wandenkolken Lima.
• Methodology – NA.
• Project administration – Eloi Alves da Silva Filho.
• Resources – Vadilson Malaquias dos Santos; Fabricio Uliana; Rayanne Penha Wandenkolken Lima; Eloi Alves da Silva Filho.
• Software – Vadilson Malaquias dos Santos; Fabricio Uliana.
• Supervision – Eloi Alves da Silva Filho.
• Validation – Vadilson Malaquias dos Santos; Fabricio Uliana; Rayanne Penha Wandenkolken Lima.
• Visualization – Vadilson Malaquias dos Santos.
• Writing – original draft – Vadilson Malaquias dos Santos; Eloi Alves da Silva Filho.
• Writing – review & editing – Vadilson Malaquias dos Santos; Eloi Alves da Silva Filho.
6. Acknowledgements
The authors gratefully thanks to analysis by Nucleus of Competences in Petrochemical Chemistry (NCQP-UFES) for instrumentation.
7. References
1. Pouyan, P., Cherri, M., & Haag, R. (2022). Polyglycerols as multi-functional platforms: synthesis and biomedical applications. Polymers, 14(13), 2684 http://dx.doi.org/10.3390/ polym14132684. PMid:35808728.
2 Kuhn, R., Bryant, I. M., Jensch, R., & Böllmann, J. (2022). Applications of environmental nanotechnologies in remediation, wastewater treatment, drinking water treatment, and agriculture. Applied Nanoscience, 3(1), 54-90 http://dx.doi.org/10.3390/ applnano3010005
3 Goyal, S., Hernández, N. B., & Cochran, E. W. (2021). An update on the future prospects of glycerol polymers. Polymer International, 70(7), 911-917 http://dx.doi.org/10.1002/pi.6209
4 Ebadipour, N., Paul, S., Katryniok, B., & Dumeignil, F. (2020). Alkaline-based catalysts for glycerol polymerization reaction:
Polímeros, 34(1), e20240003, 2024 8/10
Santos, V. M., Uliana, F., Lima, R. P. W., & Silva Filho, E. A.
Properties DBSA SDS HEX1 OCT1 DEC1 DO1 HOMO ( ) eV 1.575 1.792 7.435 7.434 7.364 7.430 LUMO ( ) eV 2.512 2.736 0.848 0.806 0.753 0.834 ( ) eV Eg 4.087 4.528 8.283 8.240 8.117 8.264 χ ( ) eV 0.469 0.472 3.294 3.314 3.306 3.298 μ ( ) eV 0.469 0.472 3.294 3.314 3.306 3.298 η ( ) eV 2.044 2.264 4.142 4.120 4.059 4.132 s ( ) eV 0.245 0.221 0.121 0.121 0.123 0.121 ω (
eV 0.054 0.049 1.310 1.333 1.346 1.316
( ) eV 0.489 0.442 0.241 0.243 0.246 0.242
DFT/B3LYP/6-31G.
)
σ
Thermodynamics of the polymerisation of polyglycerols in an acidic and micellar environment
a review. Catalysts, 10(9), 1021 http://dx.doi.org/10.3390/ catal10091021
5 Liu, Y., Huang, K., Zhou, Y., Gou, D., & Shi, H. (2021). Hydrogen bonding and the structural properties of glycerolwater mixtures with a microwave field: a molecular dynamics study. The Journal of Physical Chemistry B, 125(29), 8099-8106 http://dx.doi.org/10.1021/acs.jpcb.1c03232 PMid:34264668.
6. Shi, H., Fan, Z., Ponsinet, V., Sellier, R., Liu, H., Pera-Titus, M., & Clacens, J.-M. (2015). Glycerol/dodecanol double Pickering emulsions stabilized by polystyrene-grafted silica nanoparticles for interfacial catalysis. ChemCatChem, 7(20), 3229-3233 http://dx.doi.org/10.1002/cctc.201500556
7 Alashek, F., Keshe, M., & Alhassan, G. (2022). Preparation of glycerol derivatives by entered of glycerol in different chemical organic reactions: a review. Results in Chemistry, 4, 100359 http://dx.doi.org/10.1016/j.rechem.2022.100359
8 Piradashvili, K., Alexandrino, E. M., Wurm, F. R., & Landfester, K. (2016). Reactions and polymerizations at the liquid-liquid interface. Chemical Reviews, 116(4), 2141-2169 http://dx.doi. org/10.1021/acs.chemrev.5b00567 PMid:26708780.
9 Amarasekara, A. S., Ali, S. R., Fernando, H., Sena, V., & Timofeeva, T. V. (2019). A comparison of homogeneous and heterogeneous Brønsted acid catalysts in the reactions of meso-erythritol with aldehyde/ketones. SN Applied Sciences, 1(3), 212. http://dx.doi.org/10.1007/s42452-019-0226-9.
10 Li, X., Wu, L., Tang, Q., & Dong, J. (2017). Solvent-free acetalization of glycerol with n-octanal using combined Brønsted acid-surfactant catalyst. Tenside, Surfactants, Detergents, 54(1), 54-63 http://dx.doi.org/10.3139/113.110480
11 Toth, A., Schnedl, S., Painer, D., Siebenhofer, M., & Lux, S. (2019). Interfacial catalysis in biphasic carboxylic acid esterification with a nickel-based metallosurfactant. ACS Sustainable Chemistry & Engineering, 7(22), 18547-18553 http://dx.doi.org/10.1021/acssuschemeng.9b04667
12 Kralchevsky, P. A., Danov, K. D., Kolev, V. L., Broze, G., & Mehreteab, A. (2003). Effect of nonionic admixtures on the adsorption of ionic surfactants at fluid interfaces. 1. Sodium dodecyl sulfate and dodecanol. Langmuir, 19(12), 5004-5018 http://dx.doi.org/10.1021/la0268496.
13 Burlatsky, S. F., Atrazhev, V. V., Dmitriev, D. V., Sultanov, V. I., Timokhina, E. N., Ugolkova, E. A., Tulyani, S., & Vincitore, A. (2013). Surface tension model for surfactant solutions at the critical micelle concentration. Journal of Colloid and Interface Science, 393, 151-160 http://dx.doi.org/10.1016/j. jcis.2012.10.020 PMid:23153677.
14 Dong, W. (2021). Thermodynamics of interfaces extended to nanoscales by introducing integral and differential surface tensions. Proceedings of the National Academy of Sciences of the United States of America, 118(3), e2019873118 http:// dx.doi.org/10.1073/pnas.2019873118. PMid:33452136.
15 Kirkwood, J. G., & Buff, F. P. (1949). The statistical mechanical theory of surface tension. The Journal of Chemical Physics, 17(3), 338-343 http://dx.doi.org/10.1063/1.1747248
16. Pera-Titus, M., Leclercq, L., Clacens, J.-M., De Campo, F., & Nardello-Rataj, V. (2015). Pickering interfacial catalysis for biphasic systems: from emulsion design to green reactions. Angewandte Chemie International Edition in English, 54(7), 2006 -2021 http://dx.doi.org/10.1002/anie.201402069 PMid:25644631.
17 Gang , L. , Xinzong , L. , & Eli , W. (2007 ). Solvent-free esterification catalyzed by surfactant-combined catalysts at room temperature. New Journal of Chemistry, 31(3), 348 http://dx.doi.org/10.1039/b615448d
18 Pocheć, M., Krupka, K. M., Panek, J. J., Orzechowski, K., & Jezierska, A. (2022). Intermolecular interactions and spectroscopic signatures of the hydrogen-bonded system-n-
octanol in experimental and theoretical studies. Molecules (Basel, Switzerland), 27(4), 1225 http://dx.doi.org/10.3390/ molecules27041225 PMid:35209010.
19 Jindal, A., & Vasudevan, S. (2020). Hydrogen bonding in the liquid state of linear alcohols: molecular dynamics and thermodynamics. The Journal of Physical Chemistry B, 124(17), 3548-3555 http://dx.doi.org/10.1021/acs.jpcb.0c01199 PMid:32242419.
20. Hanwell, M. D., Curtis, D. E., Lonie, D. C., Vandermeersch, T., Zurek, E., & Hutchison, G. R. (2012). Avogadro: an advanced semantic chemical editor, visualization, and analysis platform. Journal of Cheminformatics, 4(1), 17 http://dx.doi. org/10.1186/1758-2946-4-17 PMid:22889332.
21 Stewart, J. J. P. (1990). MOPAC: a semiempirical molecular orbital program. Journal of Computer-Aided Molecular Design, 4(1), 1-105 http://dx.doi.org/10.1007/BF00128336 PMid:2197373.
22 Neese, F., Wennmohs, F., Becker, U., & Riplinger, C. (2020). The ORCA quantum chemistry program package. The Journal of Chemical Physics, 152(22), 224108 http://dx.doi. org/10.1063/5.0004608 PMid:32534543.
23. Dodda, L. S., Vaca, I. C., Tirado-Rives, J., & Jorgensen, W. L. (2017). LigParGen web server: an automatic OPLS-AA parameter generator for organic ligands. Nucleic Acids Research, 45(W1), W331-W336 http://dx.doi.org/10.1093/nar/gkx312 PMid:28444340.
24 Silva , A. W. S. , & Vranken , W. F. ( 2012 ). ACPYPEAnteChamber PYthon Parser interfacE. BMC Research Notes, 5(1), 367 http://dx.doi.org/10.1186/1756-0500-5-367 PMid:22824207.
25 Martínez, L., Andrade, R., Birgin, E. G., & Martínez, J. M. (2009). PACKMOL: a package for building initial configurations for molecular dynamics simulations. Journal of Computational Chemistry, 30(13), 2157-2164 http://dx.doi.org/10.1002/ jcc.21224. PMid:19229944.
26 Vassetti, D., Pagliai, M., & Procacci, P. (2019). Assessment of GAFF2 and OPLS-AA general force fields in combination with the water models TIP3P, SPCE, and OPC3 for the solvation free energy of druglike organic molecules. Journal of Chemical Theory and Computation, 15(3), 1983-1995 http://dx.doi. org/10.1021/acs.jctc.8b01039 PMid:30694667.
27 Van Der Spoel, D., Lindahl, E., Hess, B., Groenhof, G., Mark, A. E., & Berendsen, H. J. C. (2005). GROMACS: fast, flexible, and free. Journal of Computational Chemistry, 26(16), 17011718. http://dx.doi.org/10.1002/jcc.20291. PMid:16211538.
28 Valadbeigi, Y., & Farrokhpour, H. (2013). DFT study on the different oligomers of glycerol (n=1-4) in gas and aqueous phases. Journal of the Korean Chemical Society, 57(6), 684-690. http://dx.doi.org/10.5012/jkcs.2013.57.6.684
29 Gaudin, P., Jacquot, R., Marion, P., Pouilloux, Y., & Jérôme, F. (2011). Acid-catalyzed etherification of glycerol with long-alkyl-chain alcohols. ChemSusChem, 4(6), 719-722 http://dx.doi.org/10.1002/cssc.201100129 PMid:21591271.
30. Fan, Z., Zhao, Y., Preda, F., Clacens, J.-M., Shi, H., Wang, L., Feng, X., & De Campo, F. (2015). Preparation of bio-based surfactants from glycerol and dodecanol by direct etherification. Green Chemistry, 17(2), 882-892 http://dx.doi.org/10.1039/ C4GC00818A.
31 Qian , J. , Xu , J. , & Zhang , J. ( 2011 ). SDS-catalyzed esterification process to synthesize ethyl chloroacetate. Petroleum Science and Technology , 29 ( 5 ), 462 - 467 . http://dx.doi.org/10.1080/10916461003610405
32 Sivaiah, M. V., Robles-Manuel, S., Valange, S., & Barrault, J. (2012). Recent developments in acid and base-catalyzed etherification of glycerol to polyglycerols. Catalysis Today, 198(1), 305-313 http://dx.doi.org/10.1016/j.cattod.2012.04.073
Polímeros, 34(1), e20240003, 2024 9/10
Santos, V. M., Uliana, F., Lima, R. P. W., & Silva Filho, E. A.
33 Szela̧g , H. , & Sadecka , E. ( 2009 ). Influence of sodium dodecyl sulfate presence on esterification of propylene glycol with lauric acid. Industrial & Engineering Chemistry Research , 48 (18), 8313-8319 http://dx.doi.org/10.1021/ ie8019449
34 Kirby, F., Nieuwelink, A.-E., Kuipers, B. W. M., Kaiser, A., Bruijnincx, P. C. A., & Weckhuysen, B. M. (2015). CaO as dropin colloidal catalysts for the synthesis of higher polyglycerols. Chemistry (Weinheim an der Bergstrasse, Germany), 21(13), 5101-5109 http://dx.doi.org/10.1002/chem.201405906 PMid:25684403.
35 Al-Soufi, W., & Novo, M. (2021). A surfactant concentration model for the systematic determination of the critical micellar concentration and the transition width. Molecules (Basel, Switzerland), 26(17), 5339 http://dx.doi.org/10.3390/ molecules26175339 PMid:34500770.
36 Shah, S. S., Jamroz, N. U., & Sharif, Q. M. (2001). Micellization parameters and electrostatic interactions in micellar solution of sodium dodecyl sulfate (SDS) at different temperatures. Colloids and Surfaces. A, Physicochemical and Engineering Aspects, 178(1–3), 199-206. http://dx.doi.org/10.1016/S0927-7757(00)00697-X.
37 El-Dossoki, F. I., Gomaa, E. A., & Hamza, O. K. (2019). Solvation thermodynamic parameters for sodium dodecyl sulfate (SDS) and sodium lauryl ether sulfate (SLES) surfactants in aqueous and alcoholic-aqueous solvents. SN Applied Sciences, 1(8), 933 http://dx.doi.org/10.1007/s42452-019-0974-6
38 Zana, R. (1995). Aqueous surfactant-alcohol systems: a review. Advances in Colloid and Interface Science, 57, 1-64 http://dx.doi.org/10.1016/0001-8686(95)00235-I
39 Nguyen, K. T., & Nguyen, A. V. (2019). New evidence of head-to-tail complex formation of SDS-DOH mixtures adsorbed at the air-water interface as revealed by vibrational sum frequency generation spectroscopy and isotope labelling. Langmuir, 35(14), 4825-4833 http://dx.doi.org/10.1021/acs. langmuir.8b04213. PMid:30866624.
40 Chelli, R., Gervasio, F. L., Gellini, C., Procacci, P., Cardini, G., & Schettino, V. (2000). Density functional calculation of structural and vibrational properties of glycerol. The Journal of Physical Chemistry A, 104(22), 5351-5357 http://dx.doi. org/10.1021/jp0000883
41. Vargas, R., Garza, J., & Cedillo, A. (2005). Koopmans-like approximation in the Kohn-Sham method and the impact of the frozen core approximation on the computation of the reactivity parameters of the density functional theory. The Journal of Physical Chemistry A, 109(39), 8880-8892 http://dx.doi.org/10.1021/jp052111w PMid:16834292.
42 Yu, J., Su, N. Q., & Yang, W. (2022). Describing chemical reactivity with frontier molecular orbitalets. JACS Au, 2(6), 1383-1394 http://dx.doi.org/10.1021/jacsau.2c00085 PMid:35783161.
Received: Jan. 24, 2023
Revised: June 28, 2023
Accepted: Dec. 11, 2023
Polímeros, 34(1), e20240003, 2024 10/10
Nanocellulose reinforced starch biocomposite films via tape-casting technique
Giovana Ladislau Garuti1, Roberta Ranielle Matos de Freitas1* , Vitor Hugo de Lima1 , Karina Palmizani do Carmo2 , Franciane Andrade de Pádua1 and Vagner Roberto Botaro1,2
1Laboratório de Materiais Poliméricos e Bioenergia, Universidade Federal de São Carlos – UFSCAR, Soracaba, SP, Brasil
2Laboratório de Materiais Poliméricos, Universidade Federal de Ouro Preto – UFOP, Ouro Preto, MG, Brasil *roberta.ranielle@hotmail.com
Obstract
The objective of this study was to characterize the physicochemical-mechanical properties of corn and cassava starch films reinforced with CNF via Tape-Casting. There were differences in size and shape of the starch granules. Corn starch nanocomposites (NCO) showed a significant increase in tensile strength (5.14 to 25.58 MPa) and significant decrease in strain (24.81 to 2.76%) as the CNF concentration increased. Among the cassava starch nanocomposites (NCA), only the cassava starch sample with 1% CNF (NCA-1) showed significant difference both in the maximum stress (4.94 MPa) and strain (15.17%). The corn starch sample with 2% of CNF (NCO-2) presented a lower roughness and NCA-1 a smooth surface. There was no difference in chemical composition between the samples. The CNF-free starch films showed more transparency than other films. The NCA showed more transparency than NCO. Tape-casting technique unveils enhanced mechanical properties of cellulose nanofiber-reinforced starch films. Starch nanocomposites exhibit improved tensile strength and surface characteristics.
Keywords: nanocomposites, biopolymers, starch films, nanocellulose, tape-casting.
How to cite: Garuti, G. L., Freitas, R. R. M., Lima, V. H., Carmo, K. P., Pádua, F. A., & Botaro, V. R. (2024). Nanocellulose reinforced starch biocomposite films via tape-casting technique. Polímeros: Ciência e Tecnologia, 34(1), e20240004. https://doi.org/10.1590/0104-1428.20230084
1. Introduction
Petroleum-based polymers are commonly used in packaging products due to their characteristics, such as malleability, low cost, and chemical and mechanical properties. However, due to the difficulty of separating and reusing its resins used in their composition, these materials have limited recycling and degradation between 100-450 years in the environment, contributing to environmental pollution[1-4] .
The search for more sustainable packaging has increased, aiming the environmental preservation and conscious consumption. A range of biopolymers derived from biomass such as polysaccharides, proteins and lipids have been used as polymeric matrices for obtaining biodegradable packaging, as well as the development of films from renewable sources. However, the major challenge for the industry is to make these films capable of replacing conventional packaging, thus having adequate and specific stability, mechanical and barrier properties for each application[5-13]
The starch has shown itself as one of the raw materials more suitable to thermoplastic films production, because of its high biodegradability potential[3,14-16]. Structurally, starch is composed of two different fractions, amylose, and amylopectin[17]. Native corn starch has a proportion of 25-28% amylose, while cassava has approximately 17%
in its variations. Although starch films have properties of transparency, non-toxicity, and low cost, they still have some mechanical limitations, such as low elasticity and high permeability[17-20]
Several investigations have been carried out to improve the mechanical properties through the incorporation of other components such as natural fibers, nanofibers (CNF) and cellulose nanocrystals, oils, proteins, nanoparticles, among others[17,21]. CNF enhances bio-composites with high rigidity, low density, biodegradability, hydrophilicity, and affinity with natural polymers. The properties of biofilms depend on interactions and preparation techniques[14,21,22]
The Tape-Casting technique used in the field of flat and thin ceramics, mainly in the electronics industry in the production of blades, membranes, load cells for power generation, heat exchangers, among others[23-26] This technique is not widespread for the production of biofilms yet, but it is an alternative for obtaining films with lower thicknesses compared to the conventional methods adopted, such as the traditional casting technique, extrusion and immersion coating[14,27]. The objective of this study was to produce and characterize films with different sources of starch reinforced with CNF through the Tape-Casting method.
https://doi.org/10.1590/0104-1428.20230084 O O O O O O O O O O O O O O O Polímeros, 34(1), e20240004, 2024 ISSN 1678-5169 (Online) 1/11
Garuti, G. L., Freitas, R. R. M., Lima, V. H., Carmo, K. P., Pádua, F. A., & Botaro, V. R.
2. Materials and Methods
2.1
Materials
The Cassava starch used to prepare the films was the sour powder by Qualitá brand and the Corn starch used was by Yoki brand (both are brazilian brands). The CNF suspension was produced by mechanical shear using a Grinder Masuko Supermasscolloider the concentration of 4g of nanofibers for 96g of demineralized water and glycerol (Sigma-Aldrich). The tool used in the production of the films was Tape-Casting with 2.5 mm of the blade opening (Figure 1).
2.2 Preparation of films and nanocomposites
The films were prepared using the Tape-Casting method. To prepare the filmogenic solution, corn starch (10%) and cassava starch (10%) were dissolved in 200 ml of water. This solution was initially weighed and heated using a heating plate and kept under constant stirring until it reached gelatinization (80ºC). Then, the solution was removed from the heating plate, 2% glycerol was added and the solution was completed with water until it reached its initial weight. For each type of starch, three samples were prepared containing the CNF suspension of 0 (standard), 1, and 2% concerning the amount of water in the solution and then deposited the filmogenic solution under the plastic substrate. The films were dried at room temperature and stored in desiccators containing silica gel for approximately three weeks, and then characterized. The formulations used were chosen through preliminary tests and are described in Table 1.
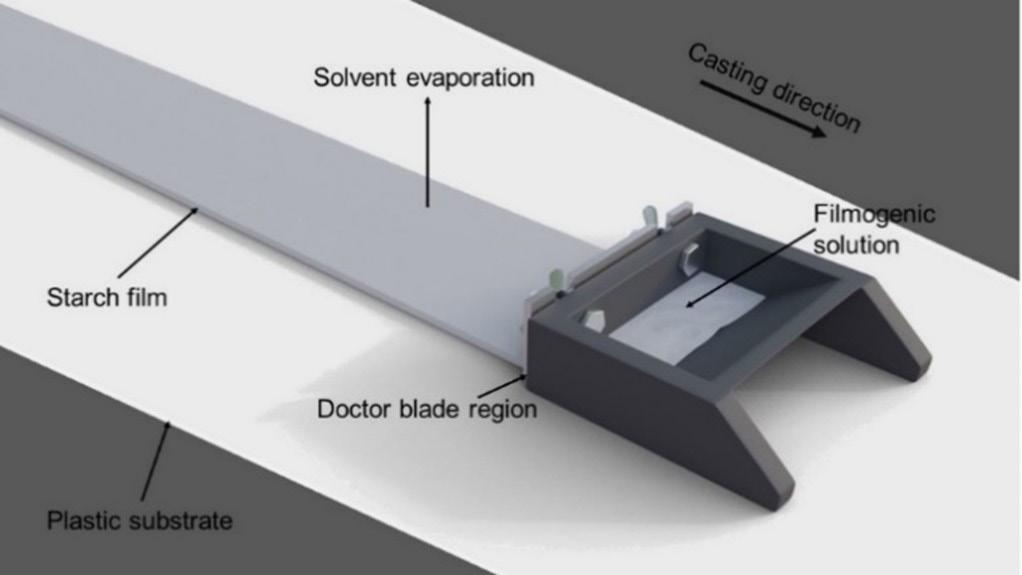
2.3 Subjective analysis
The subjective analysis evaluates the appearance of the film through visual and tactile observations. The samples evaluated as homogeneous and continuous appearance were considered for the other analyses. In the other hand, the defective samples, that is, the samples which presented fissures and a lot of bubbles, were not considered for the other analyses.
2.4 Thickness and density
For density determination, film samples with dimensions of 2x2 cm were obtained. These samples were kept in a desiccator with silica gel for approximately 5 weeks and then weighed on the analytical balance[28]. The thickness measurements using the Fowler Pro-max digital micrometer with 0.01mm resolution.
2.5 Mechanical properties
The mechanical tests were performed according to the ASTM-D882–09[29] standard, using the EMIC traction machine, DL line, 200KN load cell. The specimens were initially cut to the dimensions of 24x150 mm and thickness measurements were obtained in 5 random positions using a Fowler Pro-Max digital micrometer with 0.01mm resolution, with a useful length during the test of 100 mm, with an advance of 9 mm/min.
2.6 Scanning Electron Microscopy (SEM)
This analysis was used to observe the fracture surface of the films after the mechanical tests and also for the characterization of both types of starch. The equipment used was the SEM 3000™ Hitachi model with an acceleration of 15kV and an increase of 600x, 1000x, 3000x, and 7000x. To perform the analysis, the samples were cut into small dimensions of approximately 2 x 4 mm.
2.7 Fourier Transform Infrared Spectroscopy by Attenuated Total Reflection (FTIR-ATR)
It was performed with the Parkin Elmer Spectrum 400 FT-IR spectrometer Model Spectrum 400FT Mid-IR with scanning from 4000 to 600cm-1 and 32 scans. The samples were cut into small strips approximately 0.5 x 2 cm and performed in triplicates.
2.8 Ultraviolet-visible absorption spectroscopy (UV-Vis) for determination of of transparency
The Shimadzu UV-VIS-NIR 3600 Plus spectrophotometer was used to measure the degree of transparency of the films.
Polímeros, 34(1), e20240004, 2024 2/11
Figure 1. Tape-Casting used for the deposition of filmogenic solutions under the plastic substrate.
Table 1. Formulations used for the production of CNF-reinforced starch films.
Cellulose Nanofibers (g) Glycerol (g) f-CO 200 20 - - - 4 NCO-1 130 20 - 50 2.083 4 NCO-2 90 20 - 100 4.16 4 f-CA 200 - 20 - - 4 NCA-1 130 - 20 50 2.083 4 NCA-2 90 - 20 100 4.16 4 *The
4g CNF to 96g water.
Samples Water (g) Corn Starch (g) Cassava Starch (g) Nanofibers Suspension (g)*
suspension concentration is
Nanocellulose reinforced starch biocomposite films via tape-casting technique
As only the degree of transparency was the purpose of the analysis, the samples were analyzed in transmittance modes in the visible region of the spectrum, that is, from 400 to 700 nm with a baseline using air as a standard.
2.9 X-ray diffraction
The crystallinity indexes of the corn and cassava starch powder samples submitted to CuKα radiation, 30mA, 40kV, were evaluated at a speed of 2ϴ = 1°/min in the range of 3-40°. The crystallinity index (Xc) was calculated by the ratio between the area of the absorption peaks and the total diffractogram area and expressed in percentage (%) using the Origin software (version 9.0, Microcal Inc., Northampton, MA, USA).
2.10 Statistical analysis
A Shapiro-Wilk normality test was performed on the database, followed by the analysis of variance (ANOVA) and Tukey test of multiple comparisons with a 5% significance level. The software used for data processing and statistical analysis was PAST software 3.26.
3. Results and Discussion
3.1 Structure analysis of starch granules
The morphology of the starch granules can be seen in Figure 2. It is possible to observe that either corn and cassava starch have a smooth surface in their granules.
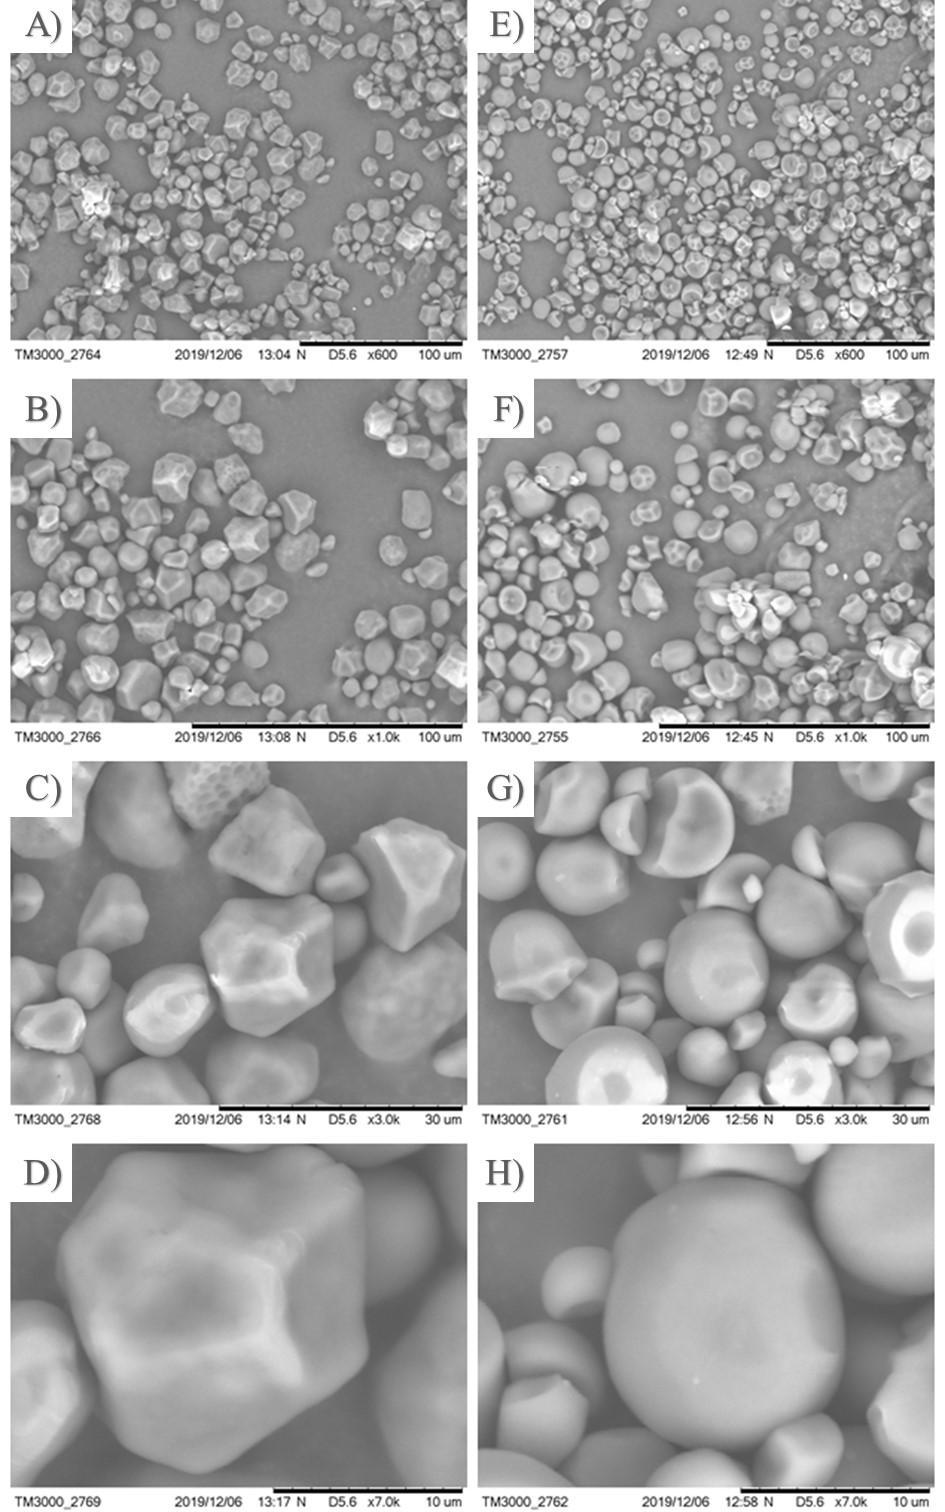
Polímeros, 34(1), e20240004, 2024 3/11
Figure 2. Corn starch granules: A) 600x; B) 1000x; C) 3000x and D) 7000x; And Cassava starch granules: E) 600 x; F) 1000x; G) 3000x and H) 7000x.
Garuti, G. L., Freitas, R. R. M., Lima, V. H., Carmo, K. P., Pádua, F. A., & Botaro, V. R.
Regarding the granules’ morphology, it is observed that corn starch showed a high proportion of angular and some rounded granules. On the other hand, cassava starch has a higher proportion of granules in shape of spheres and some angular shapes.
In Figure 3, the distribution of the sizes of corn starch and cassava granules can be observed and measured by SEM. Most of corn starch granules have a size of approximately 10 to 20 µm (Figure 3), values similar to those found in the literature. According to Penfield and Campbell[30], corn starch granules have a diameter of approximately 5-25 µm. The diameter values of cassava starch granules observed showed that most granules have a diameter ranging from 10 to 15 µm approximately (Figure 3). The size and shape of cassava starch granules vary according to species, plant development stage, harvest time, tuber shape, among other factors[31]. Furthermore, the literature reports that cassava starch granules have diameters ranging from 3 to 32 µm [32]; average diameter 15 to 20 µm and 15 to 23 µm[33]
3.2 Analysis of starch films
Some observations regarding the filmogenic solutions prepared with the different starches were: the cassava starch filmogenic solutions were more viscous when compared to those of corn starch. This can be explained by the higher proportion of amylopectin contained in cassava starch, and due to its greater molar mass compared to the molar mass of amylose, as viscosity increases with the rise of molar mass. Such viscosity hampered the deposition process of cassava starch films and nanocomposites on plastic substrate, leading to the appearance of many bubbles during the process.
Another explanation for the formation of air bubbles in the cassava biofilms sample is that the cassava starch used was the sour powder, that is, modified cassava starch, which has the capacity to expand due to its production process, which makes the casting process more difficult.
Another observation is that when rolling the films already dried in the plastic substrate, for storage, some particularities were noticed in the malleability and rigidity of the samples. Corn starch films appeared to be more malleable, and as CNF adds, nanocomposites appeared to become more rigid. Meanwhile, the cassava starch films showed a greater rigidity, and as the CNF was added, they appeared to become more malleable. These characteristics were later tested in mechanical tests.
Corn starch films appeared to be very homogeneous and opaquer, and for the most part, free from defects such as blisters and cracks. Thus, only the samples free of defects were selected to further analysis.
On the other hand, the cassava starch films appeared to be more transparent than the corn starch films, however, because the filmogenic solution was more viscous and the difficulty in preparation, it caused the appearance of air bubbles (Figure 4).
Therefore, only the bubble-free regions or regions with the least possible defect were selected to perform the tests.
3.3 Thickness and density
The thickness and density values of the films are shown in Table 2. Analyzing the thickness values, it can be observed that the Tape-Casting technique and the equipment were satisfactory in controlling their thickness. Although the differences between the values are not significant, it can be observed that the films without the nano-reinforcement presented higher density values, when compared to the nanocomposites. This behavior can be explained due to the low-density of the CNF. This behavior was also observed by Almeida et al.[34]. The thickness values obtained were lower than those obtained in other studies, such as the films incorporated with propolis extract by Araújo[35] and lower than those reinforced with pupunha palm nanocellulose obtained by Martins[36] and also lower than the starch films reinforced with CNF obtained by Marques et al.[27] and Fazeli et al.[22] .
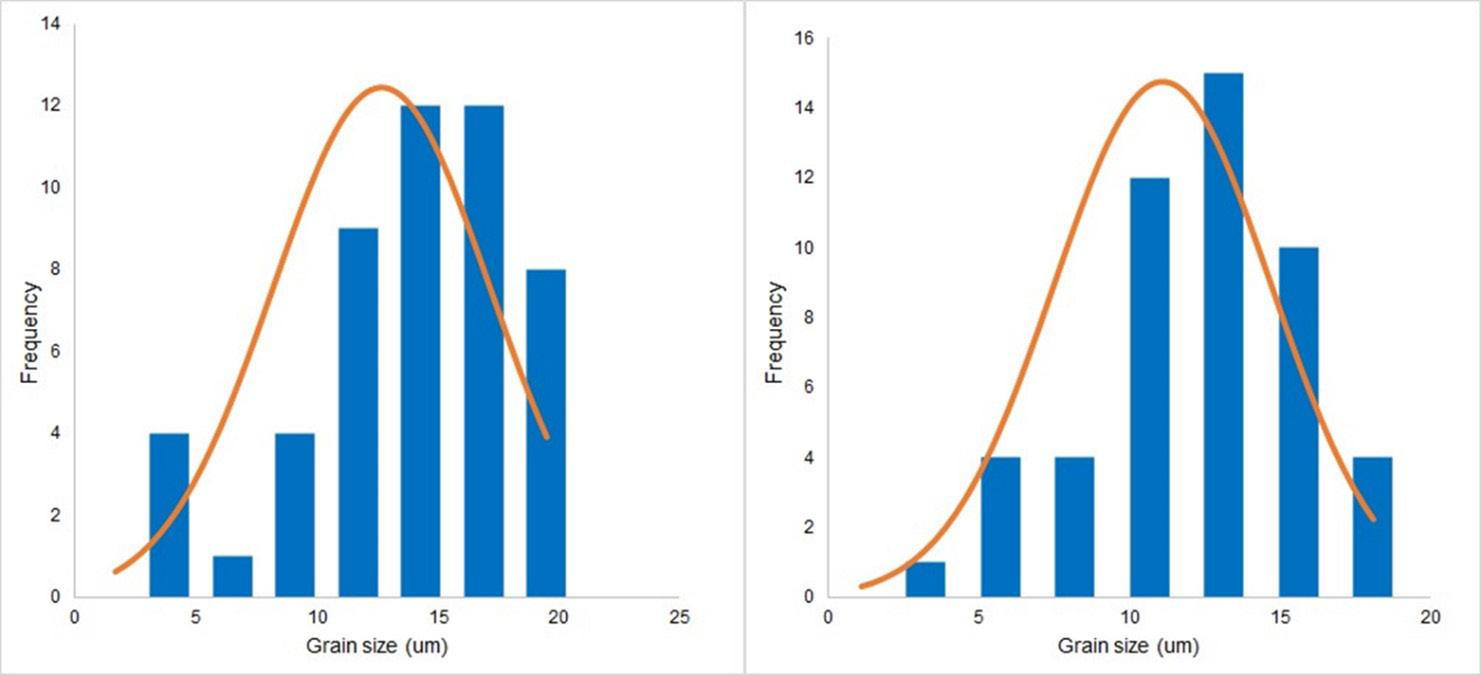
Polímeros, 34(1), e20240004, 2024 4/11
Figure 3. Size distribution of corn starch granules (left) and cassava starch granules (right).
Nanocellulose reinforced starch biocomposite films via tape-casting technique
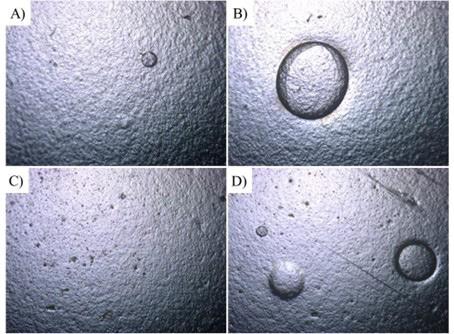
Thickness and density and mechanical properties (mean ± standard deviation) of the samples produced.
T = Maximum tensile strength or Stress; E = Elongation at rupture or Strain; Y = Young’s modulus. a,b,c = Means in the same column with different letters differ significantly (p 0.05) by Tukey’s test.
All these studies used the Casting technique for the production of biofilms, which reinforces the efficiency of the method for obtaining ultrafine biofilms.
A study by Moraes et al.[37] used the Tape-Casting technique to produce starch films, the author noticed that the suspension viscosity as well as the opening of the blade used in the process has a great influence on the final thickness of the films. The results showed that in the formulation of 3g/100g of suspension with and without the addition of nanofibers and with an opening of 3 and 4mm of the blade they presented a thickness between 0.07mm and 0.106mm
(70µm to 106µm), which shows that the thickness of the nanocomposites obtained in this study was similar for different formulations.
3.4 Mechanical properties
The mechanical tests results (Table 2 and Figure 5) showed there were significant differences in the maximum tensile strength between f-CO (5.14 ± 1.73 MPa) and NCA-1 (13.68 ± 1.73 MPa) and NCO-2 (25.58 ± 3.05). It was observed that the tensile strength of the corn starch films increases proportionally to the concentration of CNF.
Polímeros, 34(1), e20240004, 2024 5/11
Figure 4. Samples observed in the Binocular Biological Microscope. Corn starch films: A) 5x increase; B) 10x increase; Cassava starch films: C) 5x increase; D) 10x increase.
Formulation Thickness (µm) Density (g/mm3) Tensile test T (MPa) E (%) Y (MPa) f-CO 85.5 ± 4.1 a 1.52 ± 0.03 a 5.14 ± 1.73 a 24.81 ± 4.54 a 307.9 ± 187.8 a NCO-1 81.1 ± 6.0 a 1.12 ± 0.09 a 13.68 ± 1.73 b 5.97 ± 2.29 b 860.4 ± 73.92 b NCO-2 92.2 ± 7.4 a 1.25 ± 0.06 a 25.58 ± 3.05 c 2.76 ± 0.21 b 1728 ± 181.9 c f-CA 71.1 ± 4.2 a 1.58 ± 0.14 a 16.19 ± 1.61 b 2.63 ± 0.81 b 1065 ± 155.8 b NCA-1 86.6 ± 6.4 a 1.43 ± 0.19 a 4.94 ± 0.35 a 15.17 ± 3.27 c 309.3 ± 74.95 a NCA-2 94.4 ± 6.4 a 1.33 ± 0.10 a 10.64 ± 0.6 b 2.40 ± 0.31 b 807.6 ± 22.59 b
Table 2.
Garuti, G. L., Freitas, R. R. M., Lima, V. H., Carmo, K. P., Pádua, F. A., & Botaro, V. R.
The rupture elongation values (E%) of corn starch nanocomposites (f-CO, NCO-1, NCO-2) showed the opposite behavior, as the CNF concentration increased, the resistance increases, and its deformity decreases, making nanocomposites more rigid with the addition of the nano-reinforcement.
The same behavior is expected for cassava starch-based nanocomposites. However, the samples did not show this behavior. Thus, there were no significant differences (P≥05) in the maximum tensile strength between the f-CA (16.19 ± 1.61 MPa) and NCA-2 (10.64 ± 0.6 MPa), and consequently, the elongation values of rupture showed a significant opposite behavior (P≥0.05) between f-CA (2.63 ± 0.81) and NCA-2 (2.40 ± 0.31), which implies that the resistance and flexibility of both materials have an inverse correlation. The same behavior was observed by Cerqueira et al.[1] .
The results obtained from the cassava starch nanocomposites proved to be different from the results obtained by other authors such as Cerqueira et al.[1], Silva et al.[23], Martins[36] and Marques et al.[27] in studies on cassava starch films reinforced with different sources of nanofibers with similar formulations, but with lower nano-reinforcement concentrations than those tested in this study.
Marques et al.[27] used the formulation of 4.5g of cassava starch, 1.5g of glycerol, and evaluated the following concentrations of nanofibers: 0.10g; 0.30g; and 0.50g. The author observed with such concentrations the maximum tensile strength increased with the increase of the CNF concentration and consequently, the elongation had the opposite behavior. Thus, the concentrations adopted for evaluation of the present study may have saturated the nanocomposites, leading to stabilization and decrease in their maximum tensile strength.
The decrease in tensile strength observed in cassava starch films reinforced with nanofibers is a complex phenomenon that can be attributed to several factors. Undesirable interactions between nanofibers and starch, along with the influence of film morphology, are two plausible hypotheses to explain this occurrence. Inherent challenges in the preparation process, such as increased viscosity and bubble formation, may have contributed to the reduction in mechanical properties of cassava starch films, particularly with the addition of cellulose nanofibers, resulting in a less cohesive structure and lower mechanical resistance.
The NCA-1 nanocomposite showed a significant difference (P≤0.05) when compared with the other samples of cassava starch films (f-CA and NCA-2). Such behavior may have been caused by the presence of small air bubbles that cause tension points on the material’s surface, reducing the tensile strength (16.19 ± 1.61) and increasing its rupture elongation (15.17 ± 3, 27) (Figure 5).
Comparing all samples, it was observed that f-CA was as resistant as NCO-1 and NCA-2, which shows the potentiality of cassava starch even without the addition of nano-reinforcement. Thus, lower concentrations than those tested in this study should be tested in cassava starch-based nanocomposites, since the adopted concentrations appeared to have saturated the material.
Among all samples, NCO-2 presented a higher tensile strength, which demonstrates the potentiality of corn starch
to be used in the production of this type of nanocomposite. Accordingly, the mechanical test demonstrated that corn starch performed better in relation to its mechanical properties when compared to cassava starch.
3.5 Surface analysis of nanocomposite fractures
SEM images were performed to evaluate the fracture surface of the cross-section of the samples (Figure 6). It can be seen that there are no starch granules in the films, as seen in Figure 2.A and 2.E, which presents corn and cassava starch granules with the same magnification (600x) as the SEM image of the films (Figure 6). This means that all the starch was completely gelatinized during the film formation process, and that fractures are characteristic of brittle materials with little deformation due to the fibrous zone and the presence of voids[38] .
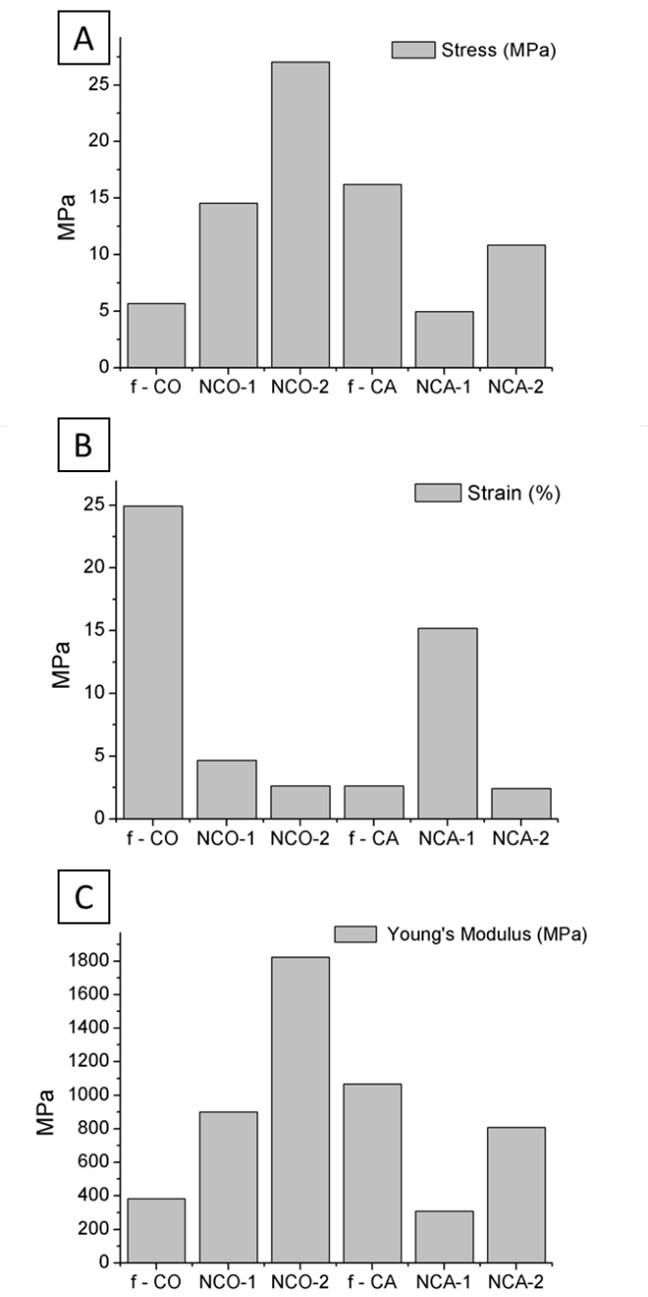
Polímeros, 34(1), e20240004, 2024 6/11
Figure 5. Mechanical properties of films with different CNF concentrations. A) Maximum Tensile Strength or Stress (MPa); B) Elongation at Rupture or Strain (%); C) Young’s Modulus (MPa).
Nanocellulose reinforced starch biocomposite films via tape-casting technique
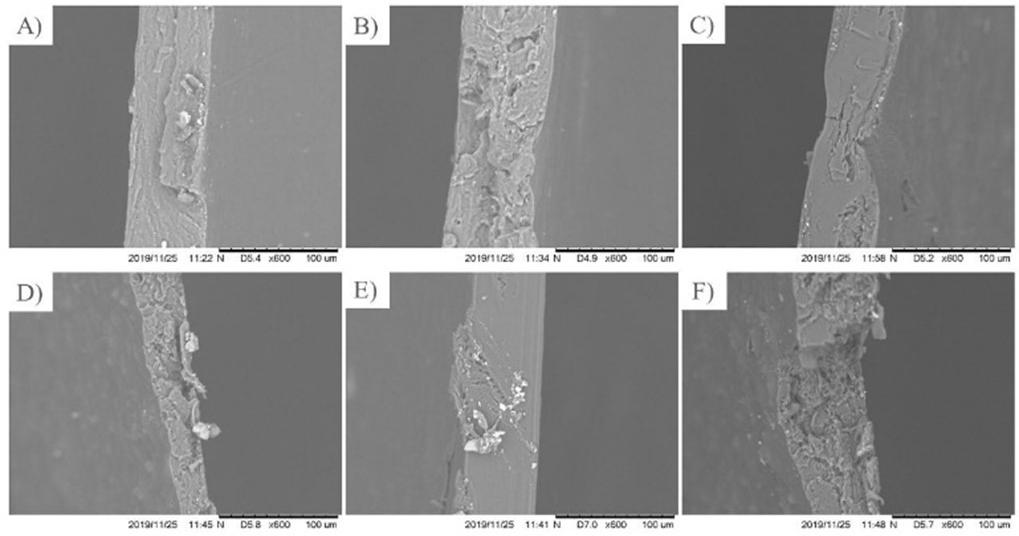
Regarding to the corn starch samples, the (f-CO) surface is smoother than its nanocomposites (Figure 6A) . This is because there are fewer obstacles in f-CO films, which facilitates the propagation of fissures. With the addition of CNF, the surface of nanocomposites has become rougher and rugged (Figure 6B e 6C). The presence of nanofibers prevented the spread of fissures, resulting in cracks in the weaker parts of the matrix. However, the NCO-2 (Figure 6C) showed lower roughness due to the lower strain rate and the higher maximum stress among the others.
On the other hand, among the cassava starch samples, only NCA-1 (Figure 6E) exhibited a relatively flat and smooth fracture surface, indicating a typical brittle fracture. The brittle fracture surface suggests a low-resistance crack formed within the matrix during the stress. Among all the samples, this was the one with the lowest tensile strength and Young’s modulus results (Table 2).
3.6 Fourier Transform Infrared Spectroscopy (FTIR)
Figure 7 shows the FTIR spectra obtained from samples of corn and cassava starch and their respective nanocomposites. A wide peak at 3289 cm-1 attributed to the stretching of the OH bond. The peak at 1646 cm-1 corresponds to the formation of hydrolysis bonds with water. The 1150 cm-1 peak is attributed to the stretching of the C-O glycosidic bond, characteristic stretching of starch. The intense peak at 998 cm-1 corresponds to C-O-H vibration[39] .
Even with the addition of CNF, there was no change in the characteristic starch bands. CNF is composed of cellulose molecules, also formed by glucose units such as starch. The structural difference between starch and cellulose is in the type of bonds of the D-glucose units: in starch, there are α-1,4 and α-1,6 bonds, while in cellulose these bonds are of the β-1 type, 4 and do not affect the respective infrared spectra[40], so the functional groups of both are the same.
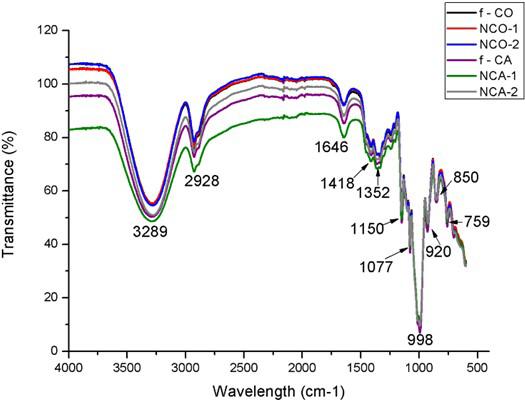
7. FTIR spectrum of corn and cassava starch-based nanocomposites samples.
3.7 X-Ray diffraction
Figure 8 shows the diffractograms corresponding to the corn and cassava starch used in the preparation of the films.Starch granules have a semi-crystalline structure with crystallinity between 20% and 45%. Two types of crystalline structures can be found in the starch structure: monoclinic or type A (short chains of amylopectin and dense branching), found in cereals, and hexagonal or type B (long and less dense chains of amylopectin), which is found in tubers. There is also a third, type C, which is believed to be a mixture of the first two (He & Wei, 2017). Cassava starch showed peaks at 2θ = 15, 17, 18, and 23°, characteristic of type C polymorphism. The crystallinity indexes observed were corn starch 46.1% and cassava starch 45.9%[41,42]
Polímeros, 34(1), e20240004, 2024 7/11
Figure 6. Edges of films after the tensile test (600x increase). A) f-CO; B) NCO-1; C) NCO-2; D) f-CA; E) NCA-1 e F) NCA-2.
Figure
Garuti, G. L., Freitas, R. R. M., Lima, V. H., Carmo, K. P., Pádua, F. A., & Botaro, V. R.
3.8 Determination of transparency
The spectrum was used in the transmittance mode to assess the degree of transparency of the starch films in the visible region of the spectrum by means of light transmittance (%), as shown in Figure 9
It was observed that starch films without CNF showed a higher degree of transparency than the others. On the other hand, nanocomposites showed a lower degree of transparency when compared to films without CNF. For this reason, the addition of CNF decreases the transparency of the nanocomposites. The presence of nano reinforcements acts as an obstacle for the passage of light, consequently, the increase of the concentration of CNF in the starch films, decreases the degree of transparency of them. Another point that explains such behavior is that CNFs present crystalline regions, causing an increase in the crystallinity of nanocomposites, and consequently decreasing transparency. Another factor is the semicrystalline granular structure of the starches and the proportion of amylose and amylopectin because the more disorganized the chains are (amorphous), the emptier spaces the material will present, and it is in these empty spaces that the light will pass through, increasing the transparency of the material. Amylopectin has crystalline behavior, while amylose has amorphous behavior, however amylose after gelatinization and transformation into thermoplastic starch is crystalline in character.
When it is heated together with a plasticizer, its semicrystalline structure is destroyed, consequently obtaining an amorphous material, which after cooling, both amylopectin, which presents crystallinity, and amylose, which does not present crystallinity in the form of granules, tend to crystallize, but amylose tends to crystallize earlier than amylopectin. Storage conditions also influence the formation process of crystalline regions of thermoplastic starch[43,44]. Therefore, the greater degree of transparency observed in the cassava starch is due to the higher content of amylopectin, which despite the crystalline character in its granule form, after the gelatinization and cooling process will have its re-crystallization process more time consuming, consequently becoming more amorphous when compared to corn starch film. On the other hand, corn starch has a higher amylose content, after being transformed into thermoplastic starch, it will crystallize more quickly, becoming an opaque material.
After the addition of nano-reinforcement in the films, the situation is reversed and the corn starch-based nanocomposites become more transparent than the cassava starch-based nanocomposites. This may be related to the saturation of nanofibers in cassava starch-based films,
making them opaquer and also affecting their tensile strength, as already observed in mechanical tests (Table 2). Another factor relates to the surface roughness of NCA films. The NCA films exhibited a surface rougher than the NCO films, a critical factor in determining film transparency. Surface roughness contributed to an increased optical path length required for light to pass through the film, resulting in higher light absorption. Additionally, surface roughness scattered light, rendering the films more opaque.
Table 3 shows that the greatest variation in transparency along the visible spectrum was observed in the 5.84%
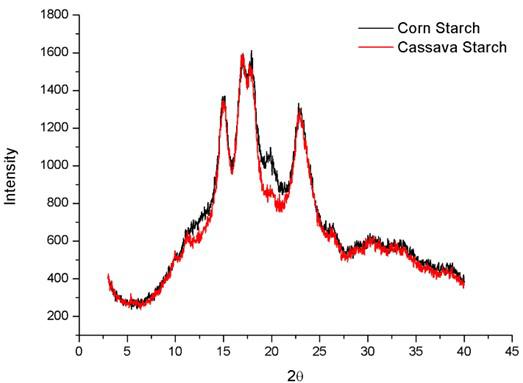
8. Corn and cassava starch diffractogram.
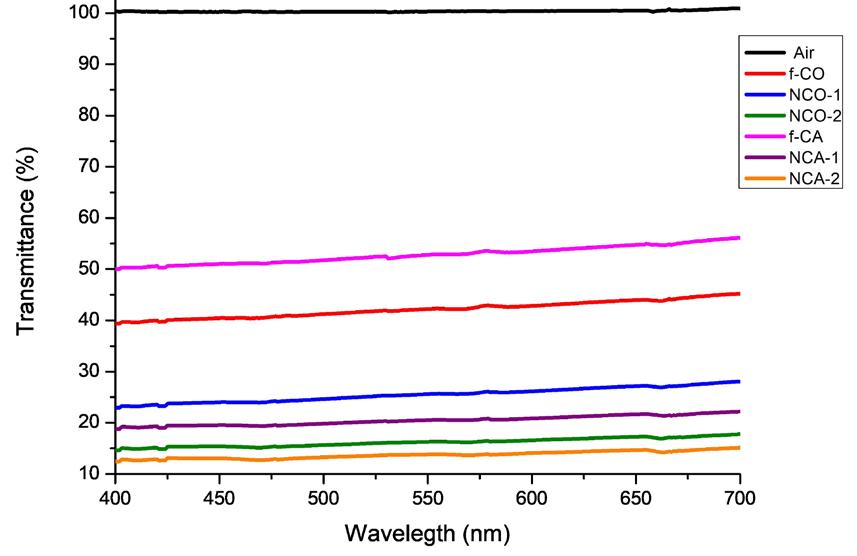
Figure 9. Transmittance of samples in the visible spectrum region. f-CO: Corn Starch film
Cassava Starch film CNF 2%.
Table 3. Variation of the nanocomposite’s transparency across the visible spectrum. Degree of transparency of films (%)
Polímeros, 34(1), e20240004, 2024 8/11
Figure
CNF-free; NCO-1: Corn Starch film CNF 1%; NCO-2: Corn Starch film CNF 2%; f-CA: Cassava Starch film CNF-free; NCA-1: Cassava Starch film CNF 1%; NCA-2:
Wavelength (nm) Color absorbed f-CO NCO-1 NCO-2 f-CA NCA-1 NCA-2 400 to 450 39.35 to 40.43 22.91 to 24.02 14.66 to 15.38 50.01 to 51.02 18.79 to 19.56 12.46 to 13.08 450 to 480 40.43 to 40.80 24.02 to 24.20 15.38 to 15.31 51.02 to 51.36 19.56 to 19.49 13.08 to 12.89 480 to 495 40.80 to 41.07 24.20 to 24.53 15.31 to 15.58 51.36 to 51.60 19.49 to 19.76 12.89 to 13.21 495 to 570 41.07 to 42.29 24.53 to 25.64 15.58 to 16.20 51.60 to 53.04 19.76 to 20.50 13.21 to 13.66 570
590 42.29 to 42.66 25.64 to 25.98 16.20 to 16.43 53.04 to 53.28 20.50 to 20.71 13.66 to 13.90
42.66
to 26.56 16.43 to 16.87 53.28 to 54.01 20.71 to 21.18
28.05
17.76 54.01 to 56.10 21.18 to 22.23 14.33 to 15.13 Total
5.84 5.14 3.1 6.09 3.44 2.67
to
590 to 620
to 43.30 25.98
13.90 to 14.33 620 to 700 43.30 to 45.19 26.56 to
16.87 to
variation in transparency
Nanocellulose reinforced starch biocomposite films via tape-casting technique
variation of cassava starch (f-CO) films, followed by the nanocomposite with 1% nanofiber (NCO-1) with 5.14%, corn starch film (f-CA) with 6.09%, NCA-1 with 3.44%, NCO-2 with 3.1% and NCA-2 with 2.67% variation. Even with variations, the samples obtained the same optical behavior, where transmittance started at 400 nm increasing in percentage to 700nm.
4. Conclusions
In conclusion, this study successfully characterized the physicochemical-mechanical properties of corn and cassava starch films reinforced with cellulose nanofibers (CNF) using the Tape-Casting technique. Despite encountering challenges in the preparation process, such as increased viscosity and bubble formation impacting the mechanical properties of cassava starch films with CNF, the research offered valuable insights into the intricate interplay of factors influencing film characteristics. The findings underscore the importance of considering starch type and CNF concentration in tailoring film properties, providing essential knowledge for potential applications of these nanocomposites. The results uncovered distinct behaviors in mechanical properties, with corn starch films demonstrating an increase in tensile strength with CNF concentration. In contrast, cassava starch films exhibited a more complex response, and despite their higher transparency without CNF, experienced a significant decrease in transparency with the addition of nanofibers. These nuanced outcomes underscore the need for a tailored approach in utilizing starch-based nanocomposites in various applications. The study not only expands our understanding of the interactions between starch and CNF but also provides crucial knowledge for optimizing the potential applications of these nanocomposites.
5. Author’s Contribution
• Conceptualization – Giovana Ladislau Garuti; Roberta Ranielle Matos de Freitas; Vitor Hugo de Lima; Karina Palmizani do Carmo; Franciane Andrade de Pádua; Vagner Roberto Botaro.
• Data curation – Giovana Ladislau Garuti.
• Formal analysis – Giovana Ladislau Garuti.
• Funding acquisition – Franciane Andrade de Pádua; Vagner Roberto Botaro.
• Investigation – Giovana Ladislau Garuti; Roberta Ranielle Matos de Freitas; Vitor Hugo de Lima; Karina Palmizani do Carmo.
• Methodology – Giovana Ladislau Garuti; Roberta Ranielle Matos de Freitas; Vitor Hugo de Lima; Vagner Roberto Botaro.
• Project administration – Roberta Ranielle Matos de Freitas; Vagner Roberto Botaro.
• Resources – Franciane Andrade de Pádua; Vagner Roberto Botaro.
• Software – NA.
• Supervision – Vagner Roberto Botaro.
• Validation – Vagner Roberto Botaro.
• Visualization – Giovana Ladislau Garuti; Roberta Ranielle Matos de Freitas; Vitor Hugo de Lima; Karina Palmizani do Carmo; Franciane Andrade de Pádua; Vagner Roberto Botaro.
• Writing – original draft – Giovana Ladislau Garuti; Roberta Ranielle Matos de Freitas; Vitor Hugo de Lima; Karina Palmizani do Carmo; Franciane Andrade de Pádua; Vagner Roberto Botaro.
• Writing – review & editing – Giovana Ladislau Garuti; Roberta Ranielle Matos de Freitas; Vitor Hugo de Lima; Karina Palmizani do Carmo; Franciane Andrade de Pádua; Vagner Roberto Botaro.
6. Acknowledgements
FAPESP (Processo: 16/19896-2 Linha de fomento: Auxílio à Pesquisa Regular), CNPq and “This study was financed in part by the Coordenação de Aperfeiçoamento de Pessoal de Nível Superior – Brasil (CAPES) Finance Code 001.
7. References
1 Cerqueira, J. C., Penha, J. S., Oliveira, R. S., Guarieiro, L. L. N., Melo, P. S., Viana, J. D., & Machado, B. A. S. (2017). Production of biodegradable starch nanocomposites using cellulose nanocrystals extracted from coconut fibers. Polímeros, 27(4), 320-329 http://dx.doi.org/10.1590/0104-1428.05316
2 Debiagi, F., Ivano, L. R. P. F. M., Nascimento, P. H. A., & Mali, S. (2012). Embalagens biodegradáveis de amido reforçadas com fibras lignocelulósicas provenientes de resíduos agroindustriais. Biochemistry and Biophysics Reports, 1(2), 57-67. http://dx.doi. org/10.5433/2316-5200.2012v1n2p57
3 Mali, S., Grossmann, M. V. E., & Yamashita, F. (2010). Starch films: production, properties and potential of utilization. Semina: Ciências Agrárias, 31(1), 137-156 http://dx.doi. org/10.5433/1679-0359.2010v31n1p137.
4 Zhou, X., Cheng, R., Wang, B., Zeng, J., Xu, J., Li, J., Kang, L., Cheng, Z., Gao, W., & Chen, K. (2021). Biodegradable sandwich-architectured films derived from pea starch and polylactic acid with enhanced shelf-life for fruit preservation. Carbohydrate Polymers, 251, 117117. http://dx.doi.org/10.1016/j. carbpol.2020.117117 PMid:33142652.
5 Scott, G. (2000). ‘Green’ polymers. Polymer Degradation & Stability, 68(1), 1-7 http://dx.doi.org/10.1016/S0141-3910(99)00182-2
6. Abdul Khalil, H. P. S., Davoudpour, Y., Saurabh, C. K., Hossain, M. S., Adnan, A. S., Dungani, R., Paridah, M. T., Mohamed, Z. I. S., Fazita, M. R. N., Syakir, M. I., & Haafiz, M. K. M. (2016). A review on nanocellulosic fibres as new material for sustainable packaging: process and applications. Renewable & Sustainable Energy Reviews, 64, 823-836. http://dx.doi. org/10.1016/j.rser.2016.06.072
7 Freitas, R. R. M., Carmo, K. P., Rodrigues, J. S., Lima, V. H., Silva, J. O., & Botaro, V. R. (2020). Influence of alkaline treatment on sisal fibre applied as reinforcement agent in composites of corn starch and cellulose acetate matrices. Plastics. Plastics, Rubber and Composites , 50 (1), 9-17 http://dx.doi.org/10.1080/14658011.2020.1816119
8 Varghese, S. A., Pulikkalparambil, H., Rangappa, S. M., Siengchin , S., & Parameswaranpillai , J. (2020 ). Novel biodegradable polymer films based on poly(3-hydroxybutyrateco-3-hydroxyvalerate) and Ceiba pentandra natural fibers for packaging applications. Food Packaging and Shelf Life, 25, 100538 http://dx.doi.org/10.1016/j.fpsl.2020.100538
Polímeros, 34(1), e20240004, 2024 9/11
Garuti, G. L., Freitas, R. R. M., Lima, V. H., Carmo, K. P., Pádua, F. A., & Botaro, V. R.
9 Xie, Q., Li, F., Li, J., Wang, L., Li, Y., Zhang, C., Xu, J., & Chen, S. (2018). A new biodegradable sisal fiber–starch packing composite with nest structure. Carbohydrate Polymers, 189, 56-64 http://dx.doi.org/10.1016/j.carbpol.2018.01.063 PMid:29580426.
10. Tavares, K. M., Campos, A., Mitsuyuki, M. C., Luchesi, B. R., & Marconcini, J. M. (2019). Corn and cassava starch with carboxymethyl cellulose films and its mechanical and hydrophobic properties. Carbohydrate Polymers, 223, 115055 http://dx.doi. org/10.1016/j.carbpol.2019.115055. PMid:31426991.
11 Travalini, A. P., Lamsal, B., Magalhães, W. L. E., & Demiate, I. M. (2019). Cassava starch films reinforced with lignocellulose nanofibers from cassava bagasse. International Journal of Biological Macromolecules, 139, 1151-1161 http://dx.doi. org/10.1016/j.ijbiomac.2019.08.115 PMid:31419552.
12 Zou, Y., Yuan, C., Cui, B., Liu, P., Wu, Z., & Zhao, H. (2021). Formation of high amylose corn starch/konjac glucomannan composite film with improved mechanical and barrier properties. Carbohydrate Polymers, 251, 117039 http://dx.doi. org/10.1016/j.carbpol.2020.117039 PMid:33142597.
13 Prabhu, T. N., & Prashantha, K. (2018). A review on present status and future challenges of starch based polymer films and their composites in food packaging applications. Polymer Composites, 39(7), 2499-2522 http://dx.doi.org/10.1002/pc.24236
14 Ghanbari, A., Tabarsa, T., Ashori, A., Shakeri, A., & Mashkour, M. (2018). Preparation and characterization of thermoplastic starch and cellulose nanofibers as green nanocomposites: extrusion processing. International Journal of Biological Macromolecules, 112, 442-447 http://dx.doi.org/10.1016/j. ijbiomac.2018.02.007 PMid:29410268.
15 Kong, R., Wang, J., Cheng, M., Lu, W., Chen, M., Zhang, R., & Wang, X. (2020). Development and characterization of corn starch/ PVA active films incorporated with carvacrol nanoemulsions. International Journal of Biological Macromolecules, 164, 1631-1639 http://dx.doi.org/10.1016/j.ijbiomac.2020.08.016 PMid:32763393.
16 Denardin, C. C., & Silva, L. P. (2009). Starch granules structure and its regards with physicochemical properties. Ciência Rural, 39(3), 945-954. http://dx.doi.org/10.1590/S0103-84782009005000003.
17 Carmo, K. P., & Paiva, J. M. F. (2015). Biodegradable films and starch compositions with other materials. Revista Virtual de Química, 7(6), 2377-2386 http://dx.doi.org/10.5935/19846835.20150141
18 Ismail, S., Mansor, N., Majeed, Z., & Man, Z. (2016). Effect of water and [Emim][OAc] as plasticizer on gelatinization of starch. Procedia Engineering, 148, 524-529. http://dx.doi. org/10.1016/j.proeng.2016.06.542
19 Schmitt, H., Guidez, A., Prashantha, K., Soulestin, J., Lacrampe, M. F., & Krawczak, P. (2015). Studies on the effect of storage time and plasticizers on the structural variations in thermoplastic starch. Carbohydrate Polymers, 115, 364-372 http://dx.doi. org/10.1016/j.carbpol.2014.09.004 PMid:25439906.
20. Mali, S., Grossmann, M. V. E., García, M. A., Martino, M. N., & Zaritzky, N. E. (2004). Barrier, mechanical and optical properties of plasticized yam starch films. Carbohydrate Polymers, 56(2), 129-135 http://dx.doi.org/10.1016/j.carbpol.2004.01.004
21 Li, J., Zhou, M., Cheng, G., Cheng, F., Lin, Y., & Zhu, P.-X. (2019). Fabrication and characterization of starch-based nanocomposites reinforced with montmorillonite and cellulose nanofibers. Carbohydrate Polymers, 210, 429-436 http:// dx.doi.org/10.1016/j.carbpol.2019.01.051 PMid:30732779.
22 Fazeli, M., Keley, M., & Biazar, E. (2018). Preparation and characterization of starch-based composite films reinforced by cellulose nanofibers. International Journal of Biological Macromolecules, 116, 272-280 http://dx.doi.org/10.1016/j. ijbiomac.2018.04.186 PMid:29729338.
23 Silva, B. A., Oliveira, V. S. G., Di Luccio, M., Hotza, D., Rezwan, K., & Wilhelm, M. (2020). Characterization of functionalized zirconia membranes manufactured by aqueous tape casting. Ceramics International, 46(10), 16096-16103 http://dx.doi.org/10.1016/j.ceramint.2020.03.162
24. Krishnan, P. P. R., Vijayan, S., Wilson, P., Kumar, P. A., & Prabhakaran, K. (2019). Aqueous tape casting of alumina using natural rubber latex binder. Ceramics International, 45(15), 18543-18550 http://dx.doi.org/10.1016/j.ceramint.2019.06.075
25. Mister, R. E., & Twiname, E. R. (2000). Tape casting: theory and practice USA: Wiley-American Ceramic Society. Retrieved in 2023, September 5, from https://www.wiley.com/en-us/ Tape+Casting%3A+Theory+and+Practice-p-9781574980295
26 Twiname, E. R. (2020). Tape casting and lamination. In M. Pomeroy (Ed.), Encyclopedia of materials: technical ceramics and glasses (pp. 189-194). USA: Elsevier
27. Marques, G. S., Carvalho, G. R., Marinho, N. P., Muniz, G. I. B., Jorge, L. M. M., & Jorge, R. M. M. (2019). Production and characterization of starch‐based films reinforced by ramie nanofibers ( Boehmeria nivea ). Journal of Applied Polymer Science, 136(36), 47919 http://dx.doi.org/10.1002/ app.47919
28 Müller, C. M. O., Yamashita, F., & Laurindo, J. B. (2008). Evaluation of the effects of glycerol and sorbitol concentration and water activity on the water barrier properties of cassava starch films through a solubility approach. Carbohydrate Polymers , 72 ( 1 ), 82 - 87 http://dx.doi.org/10.1016/j. carbpol.2007.07.026.
29 ASTM International. (2010). ASTM D882-10: standard test method for tensile properties of thin plastic sheeting. USA: ASTM International
30 Penfield, M. P., & Campbell, A. M. (1990). Experimental food science USA: Academic Press. Retrieved in 2023, September 5, from https://shop.elsevier.com/books/experimental-food-science/ penfield/978-0-12-157920-3
31 Sriroth, K., Santisopasri, V., Petchalanuwat, C., Kurotjanawong, K., Piyachomkwan, K., & Oates, C. G. (1999). Cassava starch granule structure-function properties: influence of time and conditions at harvest on four cultivars of cassava starch. Carbohydrate Polymers, 38(2), 161-170 http://dx.doi. org/10.1016/S0144-8617(98)00117-9
32. Defloor, I., Dehing, I., & Delcour, J. A. (1998). Physicochemical properties of cassava starch. Stärke, 50(2-3), 58-64 http://dx.doi.org/10.1002/(SICI)1521-379X(199803)50:2/3<58::AIDSTAR58>3.0.CO;2-N
33 Leonel, M. (2007). Analysis of the shape and size of starch grains from different botanical species. Food Science and Technology (Campinas), 27(3), 579-588 http://dx.doi.org/10.1590/S010120612007000300024
34 Almeida, D. M., Woiciechowski, A. L., Wosiacki, G., Prestes, R. A., & Pinheiro, L. A. (2013). Phisical, chemical and barrier properties in film made by bacterial celullose and potato starch blend. Polímeros: Ciência e Tecnologia, 23(4), 538-546. http://dx.doi.org/10.4322/polimeros.2013.038
35 Araújo, G. K. P., De Souza, S. J., Da Silva, M. V., Yamashita, F., Gonçalves, O. H., Leimann, F. V., & Shirai, M. A. (2015). Physical, antimicrobial and antioxidant properties of starchbased film containing ethanolic propolis extract. International Journal of Food Science & Technology, 50(9), 2080-2087 http://dx.doi.org/10.1111/ijfs.12869
36 Martins, M. P. (2017). Desenvolvimento e caracterização de filme de fécula de mandioca (Manihot esculenta) reforçado com nanocelulose extraída de resíduo de pupunha (Bactris gasipaes Kunth) (Master’s dissertation). Universidade Federal do Paraná, Curitiba. Retrieved in 2023, September 5, from https://acervodigital.ufpr.br/handle/1884/52220
Polímeros,
10/11
34(1), e20240004, 2024
Nanocellulose reinforced starch biocomposite films via tape-casting technique
37 Moraes, J. O., Scheibe, A. S., Sereno, A., & Laurindo, J. B. (2013). Scale-up of the production of cassava starch based films using tape-casting. Journal of Food Engineering, 119(4), 800-808. http://dx.doi.org/10.1016/j.jfoodeng.2013.07.009.
38 Amin, M. R., Chowdhury, M. A., & Kowser, M. A. (2019). Characterization and performance analysis of composite bioplastics synthesized using titanium dioxide nanoparticles with corn starch. Heliyon, 5(8), e02009. http://dx.doi.org/10.1016/j. heliyon.2019.e02009 PMid:31497660.
39 Garcia, N. L., Ribba, L., Dufresne, A., Aranguren, M. I., & Goyanes, S. (2009). Physico-mechanical properties of biodegradable starch nanocomposites. Macromolecular Materials and Engineering, 294(3), 169-177 http://dx.doi. org/10.1002/mame.200800271.
40 Coultate, T. P. (2009). The Chemistry of Its Components UK: The Royal Society of Chmeistry. Retrieved in 2023, September 5, from https://books.google.com.br/books?hl=ptBR&lr=&id=KF2A8Cz7B-cC&oi=fnd&pg=PR17&dq=The+c hemistry+of+its+components&ots=fkz4_scoX4&sig=tK4eT6 BdPROuElAFA6AXDqdnUzk#v=onepage&q=The chemistry of its components&f=false
41 Batista, R. D., Mendes, D. C. S., Morais, C. C., Thomaz, D. V., Ascheri, D. P. R., Damiani, C., & Asquieri, E. R. (2020). Physicochemical, functional and rheological properties of fermented and non-fermented starch from canary seed (Phalaris canariensis). Food Hydrocolloids, 99, 105346. http://dx.doi.org/10.1016/j.foodhyd.2019.105346
42 Fan, H., Ji, N., Zhao, M., Xiong, L., & Sun, Q. (2016). Characterization of starch films impregnated with starch nanoparticles prepared by 2,2,6,6-tetramethylpiperidine-1-oxyl (TEMPO)-mediated oxidation. Food Chemistry, 192, 865-872 http://dx.doi.org/10.1016/j.foodchem.2015.07.093 PMid:26304422.
43 Corradini, E., Lotti, C., Medeiros, E. S., Carvalho, A. J. F., Curvelo, A. A. S., & Mattoso, L. H. C. (2005). Comparative studies of corn thermoplastic starches with different amylose content. Polímeros: Ciência e Tecnologia, 15(4), 268-273 http://dx.doi.org/10.1590/S0104-14282005000400011.
44 Eliasson, A. (2004). Starch in food: structure, function and applications. USA: Woodhead Publishing Limited Published
Received: Sept. 05, 2023
Revised: Nov. 26, 2023
Accepted: Dec. 26, 2023
Polímeros, 34(1), e20240004, 2024 11/11
Effect of thyme essential oil on the properties of poly (butylene adipate-co-terephthalate)(PBAT)
Pâmela Barcelar Ferreira Gomes da Silva de Luna1 , Viviane Fonseca Caetano1* , Michelle Félix de Andrade1 , Ivo Diego de Lima Silva1 , Tiago Lopes de Araújo1 , Karina Carvalho de Souza1 , Yêda Medeiros Bastos de Almeida1 and Glória Maria Vinhas1
1Laboratório de Petroquímica, Instituto de Pesquisa em Petróleo e Energia, Universidade Federal de Pernambuco –UFPE, Recife, PE, Brasil
*viviane_fc@yahoo.com.br
Obstract
In this study, thyme essential oil was added to poly (butylene adipate-co-terephthalate) (PBAT) films in a variety of compositions (0, 1, 2, 5, 10, 15, and 20% w/w), and the effect of the essential oil on the PBAT’s characteristics was evaluated. The films were produced using the casting technique. Thyme essential oil (EO) was evaluated by mid-infrared, gas chromatography-mass spectrometer, and antimicrobial activity. The films were evaluated by mid-infrared, mechanical, and thermal tests. The results demonstrated that EO has a higher concentration of o-cymene and antimicrobial activity against the bacteria Escherichia coli and Staphylococcus aureus. The films were analyzed for their mechanical and thermal properties according to the compositions tested. The films have shown promise for use as active packaging.
Keywords: PBAT, thyme essential oil, active packaging.
How to cite: Luna, P. B. F. G. S., Caetano, V. F., Andrade, M. F., Silva, I. D. L., Araújo, T. L., Souza, K. C., Almeida, Y. M. B., & Vinhas, G. M. (2024). Effect of thyme essential oil on the properties of poly (butylene adipate-co-terephthalate) (PBAT). Polímeros: Ciência e Tecnologia, 34(1), e20240005. https://doi.org/10.1590/0104-1428.20230009
1. Introduction
Over the past few decades, there has been a significant increase in the consumption of plastic by both industry and society[1]. This is justified by their characteristics like fabricability, flexibility, weightlessness, low cost, and great applicability in different sectors[2]. However, because of high polymer consumption, there was a high accumulation of these materials on the ground, in landfills, and in marine environments, which generated environmental problems because these materials degrade very slowly when disposed of in nature[3,4]. A reduction alternative or polymer substitution in some applications in the short term, such as food packaging, is using biodegradable polymers. The degradation of biodegradable polymers is faster in comparison with non-biodegradable polymers, because when disposed of in a bioactive environment, they disintegrate by enzyme catalysis procedures induced by microorganisms like fungus or bacteria[5] .
Traditional packaging protects against physical, chemical, and biological contaminants using physical barriers. They don’t, however, come into interaction with the food to maintain its sensory qualities and increase its shelf life. The concept of interacting with food through components that possess active properties, such as antioxidant, antibacterial, antifungal, etc. gives rise to active packaging. In this context, an interesting combination is a biodegradable polymer (butylene-adipate-co-terephthalate) (PBAT) with thyme essential oil.
PBAT is an aliphatic-aromatic co-polyester. It’s a very interesting material for the packaging sector. Petrochemical in origin, the PBAT has mechanical qualities like low-density polyethylene, including high elongation at break and toughness[6]. Its compatibility, fabricability, and flexibility make it a promising material for a variety of applications, including packaging. Its strong mechanical qualities are attributed to the aromatic unit in the molecular chain, while its biodegradability is a result of the aliphatic units in the chemical structure[7-10]
Thyme essential oil is reported in the literature as a natural additive that has antibacterial action on a variety of pathogens, including E. coli and E. Salmonella[11]. These properties are mostly attributed to phenolic components found in essential oils, specifically carvacrol and thymol[12-14] .
The polymer’s mechanical and thermal properties may be significantly impacted by the essential oils, which may potentially accelerate or retardation the polymer to degrade. This will depend on the additive’s chemical composition and how it interacts with the polymer matrix. To determine whether essential oils like clove and cinnamon[6], orange[8], tea tree[15] , carvacrol, citral and α-terpineol[16] and oregano[17] would affect the physical, chemical, mechanical, and thermal properties of the polymer, studies utilizing PBAT, and these oils were reported in the literature. Nevertheless, the polymeric PBAT matrix associated with thymol essential oil has not been utilized in any of the research that have been reported in the literature.
https://doi.org/10.1590/0104-1428.20230009 O O O O O O O O O O O O O O O Polímeros, 34(1), e20240005, 2024 ISSN 1678-5169 (Online) 1/9
Luna, P. B. F. G. S., Caetano, V. F., Andrade, M. F., Silva, I. D. L., Araújo, T. L., Souza, K. C., Almeida, Y. M. B., & Vinhas, G. M.
Thus, this study evaluated the effect of thyme essential oil on the mechanical and thermal properties of PBAT with the goal of pursuing future applications such as active packaging. It also determined whether thyme essential oil possessed antibacterial action and whether it could be incorporated into the polymeric matrix using the methodology utilized with a focus on upcoming uses like active packaging.
2. Materials and Methods
2.1 Materials
PBAT, commercially known as ECOFLEX® F BLEND C1200 and acquired from BASF (Germany), was used in pellets from BASF, and white thyme essential oil (GT Hungria) from LAZLO was used in the concentration of 0, 1, 2, 5, 10, and 15% wt. Films were produced by casting method and the solvent used was chloroform from DINAMICA. The samples were named PBAT film, PBAT/T1, PBAT/T2, PBAT/T5, PBAT/T10, PBAT/T15, PBAT/T20.
2.2 Film production
Solution casting was the technique utilized for producing both pure PBAT films and PBAT films containing thyme essential oil[8]. Table 1 lists the bulk materials (PBAT and thyme essential oil) that were used. To evaluate the impact of various oil concentrations in the produced films, PBAT films containing thyme essential oil at concentrations of 0, 1, 2, 5, 10, 15, and 20% w/w were made. The films were produced in triplicates.
2.3 PBAT films
1.400 g of PBAT were weighed and dissolved in 50 ml of chloroform to produce PBAT films containing 0% wt of essential oil. For 30 minutes, this mixture was magnetically stirred at ambient temperature (24ºC). Following this time, the mixture was transferred into Petri plates and let to entirely evaporate. After five days, the dry film was taken out of the Petri plate.
2.4 PBAT films with thyme essential oil
A step was added to the PBAT tidy film production process. The solution was stirred for 30 minutes, and then thyme essential oil was added in accordance with the concentrations shown in Table 1. To allow the solvent to evaporate, this solution was placed into a Petri dish and swirled for a further fifteen minutes. The films were taken out of the Petri plate after five days.
2.5 Gas chromatography–mass spectrometer (GC-MS)
Thyme essential oil was analyzed in a gas chromatograph equipment model Trace 1330 coupled to mass spectrometry ISQ Single Quadrupole (ThermoScientific) to identify and quantify oil constituents. The temperature programming was 60 °C/min, heating rate of 6 °C/min until 100 °C, of 14 °C/min until 240 °C, and the analysis lasted a total of 18.10 min.
2.6 Antimicrobial activity analysis of the oil
The disc diffusion method was used to verify the antimicrobial activities against E. coli and S. aureus, according to Bauer et al.[14]
Initially, the inoculum was prepared by adding microorganisms to sterile water until turbidity was set to 0.5 (McFarland scale), corresponding to 108 CFU/mL. Petri dishes with agar (Müeller-Hinton) were inoculated with 0.1 mL of inoculum and spread on a drigalski spatula. Paper discs were immersed in thyme oil and then added over the agar. After, the Petri dishes were incubated in an oven at 35 °C for 24 h. Finally, the diameters of the halos were read with a micrometer.
2.7 Fourier-transform infrared spectroscopy (FTIR)
FTIR spectra of the films were recorded in attenuated total reflectance (ATR) mode at a wavelength range from 400 to 4000 cm−1, with 16 scans and at a resolution of 4 cm−1 in FT/IR-4600 type (Jasco).
2.8 Principal component analysis (PCA)
Principal component analysis was carried out with the program Unscrambler 9.7, using two films for each composition, and analyzing two regions: between 3100 and 2700 cm−1 and 850-800 cm-1 of all films. To remove any external interference, a normalization treatment through the average was used.
2.9 Mechanical analyses
Mechanical analysis was carried out in the Universal Mechanical Testing Machine (DL-500MF, brand EMIC) according to ASTM D882-02[18] to verify the mechanic attributes as the tensile strength (TS), elongation at break (EAB), and elastic modulus (E).
The test occurred at room temperature and the film thickness was measured using a digital micrometer (Mitutoyo Corp, Brazil). Test conditions were the following: crosshead speed of 5 mm/min, cell load of 500 N, the distance between grips of 4 cm, and sample dimensions of 2.5 x 7.5 cm.
Polímeros, 34(1), e20240005, 2024 2/9
PBAT bulk(g) Essential oil bulk (g) Polymer bulk (g) Total bulk (g) PBAT film 0.000 1.400 1.400 PBAT/T1 0.014 1.386 1.400 PBAT/T2 0.028 1.372 1.400 PBAT/T5 0.070 1.330 1.400 PBAT/T10 0.140 1.260 1.400 PBAT/T15 0.210 1.190 1.400 PBAT/T20 0.280 1.120 1.400
Table 1. Composition of PBAT and thyme essential oil used in film production.
Effect of thyme essential oil on the properties of poly (butylene adipate-co-terephthalate)(PBAT)
2.10 Statistical analyses
Mechanical properties data were analyzed by analysis of variance (ANOVA) using the Statistica software, version 10.0.228.8. Duncan’s test was used to determine differences at a level of significance of 5% (p ≤ 0,05).
2.11 Differential scanning calorimetry (DSC)
The samples were cut and weighed to approximately 5 mg. Then, they were sealed in aluminum pans. All samples were subjected to three ramps: the first from 0 to 200 °C with a heating rate of 30 °C/min and lasting approximately 10 min to eliminate the polymer thermal history; the second ramp from 200 to 0 °C; and the third one from 0 to 200 °C, both with a rate of 10 °C/min. The equipment used was a Mettler Toledo model 1STAR System (Sao Paulo, Brazil). Equation 1 was used to calculate relative crystallinity.
between 4.1 and 27.6%, thymol between 29.3 and 50.3%, and carvacrol between 2.8 and 20.6%.
3.3
Antimicrobial activity analyses of oil
The results are shown in Figures 1 and 2. It was possible to verify the inhibition halos, and this could confirm the oil capacity to stop Escherichia coli and Staphylococcus aureus growth. The average of halos with diameter was 49.95 mm for E. coli and 86.25 mm for S. aureus. These halos’ diameters can be classified as sensible because they are greater than 20 mm[24]. In the literature, there isn’t any report about PBAT antimicrobial activity, and a study conducted by Moraes et al.[6] confirmed this property because their neat PBAT films were submitted to an antimicrobial test, and bacteria grew normally without any resistance.
where ΔH m is the melting enthalpy from the equipment, f is the weight fraction of PBAT in the film, and ΔHm ° is the enthalpy of 100% crystalline PBAT considered as 114 J.g-1[19]
2.12 Thermogravimetric analysis (TGA)
The TGA was performed on a Mettler Toledo model TGA/DSC 2 STAR with a heating rate of 50 to 600 °C and a heating speed of 10 °C/min under a 20 mL/min flow of nitrogen. The samples were weighed at approximately 15 mg.
3. Results and Discussions
3.1 PBAT films and PBAT films on thyme oil
All films showed were flexible and, through visual analysis, seemed to be homogeneous, whitish, and opaque. According to the increase in the oil percentage, the films became more transparent than neat PBAT films but maintained flexibility. The odor from the films added to thyme oil had a smell characteristic of thyme, even in low concentrations. Reducing opacity is related to oil dispersion on the polymer chain; the oil is a lipidic phase and carries an increase in reflectance and a decrease in roughness after it’s incorporated into the films, increasing the brightness[17]
3.2 Characterization of thyme oil by a chromatography-mass spectrometer
The resulting chromatogram is shown in Table 2, and the major components were found to be o-cymene (52.16%), thymol (28.21%), and carvacrol (13.26%).
Sadekuzzaman et al.[20] verified cymene, thymol, and α-pinene as major components in their research. Burt[21] confirmed that the thyme oil analyzed was cymene with a range of 10 to 56%, thymol 10 to 64%, and carvacrol 2 to 11%. However, the oil composition can be variable, according to the region where thyme was planted, the part of the plant from which oil was extracted (leaves or stem), the weather, water availability on the ground, and others[15,21,22]. Cosentino et al. [23] investigated four thyme oil compositions extracted from different species of thyme and obtained components: cymene
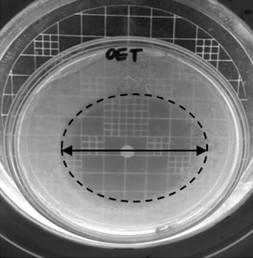
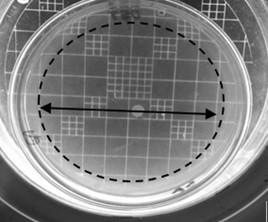
Polímeros, 34(1), e20240005, 2024 3/9
) Xc 100% (. m m H fH ° ∆ =× ∆ (1)
Components Area (%) Retention time (min) o-cymene 52.16 6.18 Thymol 28.21 10.47 Carvacrol 13.26 10.59 Camphene 2.64 4.78 α-terpineol 1.29 9.16
Table 2. Major components of thyme oil essential.
Figure 1. Halos of inhibition of Escherichia coli
Figure 2. Halos of inhibition of Staphylococcus aureus
P. B. F. G. S., Caetano, V. F., Andrade, M. F., Silva, I. D. L., Araújo, T. L., Souza, K. C., Almeida, Y. M. B., & Vinhas, G. M.
Antimicrobial activity was higher in Gram-positive bacteria than Gram-negative bacteria, as observed in this study, due to their structure[25]. In Gram-negative bacteria, they have a thin peptidoglycan cell wall that is surrounded by another wall made of lipopolysaccharide, which justifies their higher resistance to being attacked by agents’ antimicrobials. Gram-positive bacteria don’t have an outer membrane, and this benefits the penetration of the cell wall, attack on the bilayer phospholipid membrane of the bacterial cell, and exposure of the cytoplasm.
Lemos et al.[26] described thyme oil inhibition against Escherichia coli, Staphylococcus aureus, and Salmonella typhimurium in their research because the major components, thymol and carvacrol, phenolic compounds, are reactive due to the aromatic core through hydrogen bonds with the active site of the enzymes. Mirsharif et al.[27] produced composite films made of PVA, chitosan, and almond gum and used thyme essential oil nanoemulsion as an additive, and they verified that, in the composite film without that emulsion, they didn’t observe any bacteria growth, but others containing 4% and 6% thyme nanoemulsion growth inhibition zones were verified.
3.4 FTIR of thyme essential oil
The FTIR spectrum and main vibrational bands of thyme essential oil are shown in Figure 3. A peak at 3400 cm−1 corresponds to the stretching vibration of bond O-H which refers to the phenolic groups of thymol, carvacrol, and cymene. A peak at 2964 cm−1 is related to stretching vibration due to the aliphatic bonds of C-H2 [28]. Peaks at 1583 cm−1 e 1459 cm−1 can be attributed to the existence of an aromatic ring in the cymene molecule and the bonds C=C of thymol and carvacrol. Bands at 1362 cm−1 and 1381 cm−1, respectively, are related to the symmetric and asymmetric bending vibrations of isopropyl and methyl groups. Finally, there is a peak at 813 cm-1 is due to bond C-H out of a plane in the cymene structure[29]
3.5 FTIR of PBAT film and PBAT films with thyme essential oils
FTIR analysis was used to verify the interactions between oil and PBAT. The spectrum is shown in Figure 4 In the neat PBAT films, it was confirmed the presence of stretching vibration and its peak at 1709 cm-1 due to C=O bonds referring to the ester group[30,31]. Other bands are at 1250 cm-1 due to the C-O symmetric stretching mode of ester bonds, 1400 cm-1 related to CH2 bonds, about 1090 cm-1 and 800 cm-1 refer to a substituted benzene ring, and then at 720 cm-1 due to adjacent methylene groups[32]
Comparing the spectrum between the neat films and films added with thyme oil, it was observed that they are very similar. A hypothesis is that there is an overlapping of bands due to PBAT being in larger amounts than thyme oil, and the high intensity of PBAT’s molecular vibration makes it difficult to see bands related to the additive[8]. Thus, to verify the presence of oil in films, PCA was performed PCA.
3.6 Principal components analysis (PCA)
In Figure 5, it’s represented the Principal Component Analysis (PCA). This chemometric tool’s dimensionality reduction technique is frequently used to reduce the number
of variables of large sets, including spectral matrices The technique does this by minimizing the original collection of variables while retaining the majority of the information it contains[33]
In Figure 5, the PC1xPC2 score graph is shown. Figure confirms the formation of six distinct groups corresponding to the compositions of 0, 1, 2, 5, 10, 15, and 20% w/w of thymol oil contained in the PBAT films. These axes (PC1 and PC2), known as “Principal Components,” show the variation in the data; PC1 shows the greatest variation, and PC2 shows the second-most variation. The coefficients of these linear combinations are provided by the PC’s eigenvector.
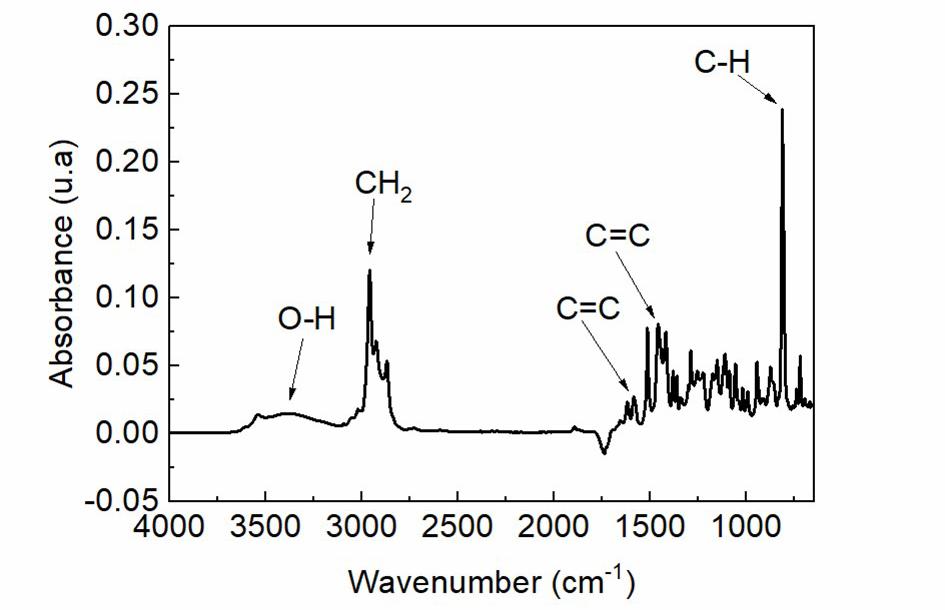
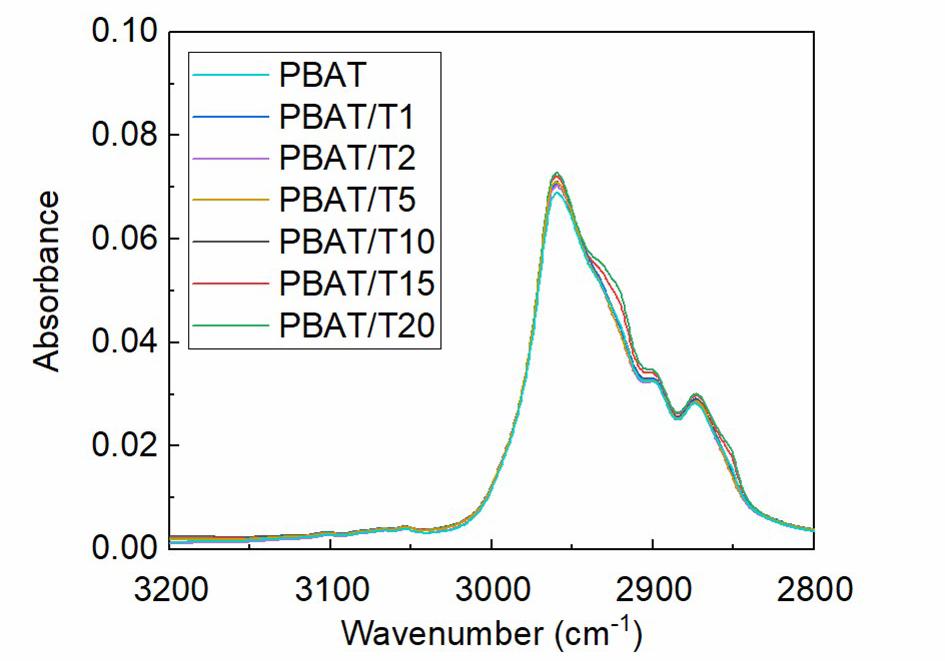
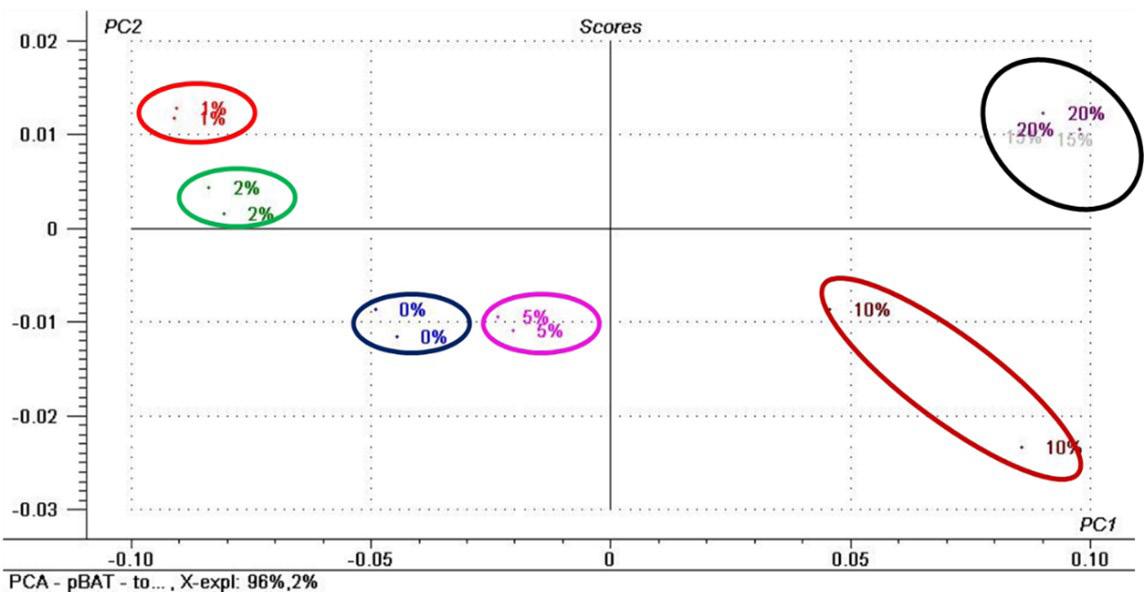
Polímeros, 34(1), e20240005, 2024 4/9
Luna,
Figure 3. FTIR spectrum of thyme essential oil.
Figure 4. FTIR spectra to neat PBAT film and PBAT films with thyme oil.
Figure 5. Scores PC1xPC2 of neat PBAT films and PBAT films with 0. 1. 2. 5. 10. 15 e. 20% w/w thyme oil.
PCs are linear combinations of the variables in the dataset. The PC1 and PC2 explained variances were 96 and 2%, respectively. These groups were created based on the similarity of the spectra, or with the same quantity of additive, demonstrating that the additive was incorporated in various quantities as shown by the formation of distinct groups that were separated from one another.
The loadings graphics from PC1 and PC2 are shown in Figures 6 and 7, where variables (wavenumber) influencing PCA construction and sample separation by groups may be detected. The formation of groups based on absorbance in 2964 cm-1 (pertaining to PBAT and thyme essential oil) and 720 cm-1 (referring to thyme essential oil) allowed for the identification of responsible peaks and provided proof that thyme essential oil had been incorporated into the polymer film.
3.7 Mechanical properties
Table 3 shows properties like tensile strength, elongation at break, and elastic modulus and whether they changed with thyme oil addition in the polymer chain in comparison with neat PBAT film.
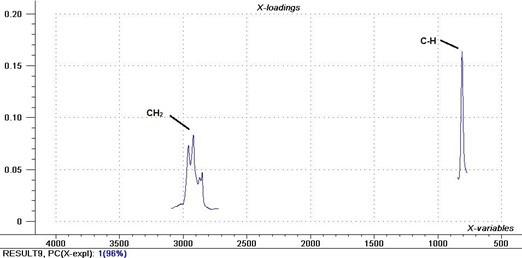
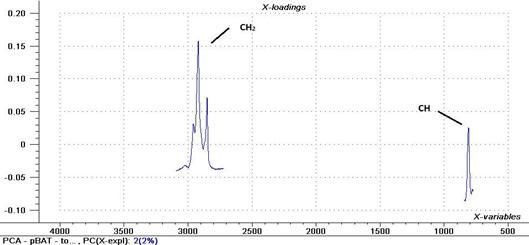
When compared to PBAT film, the tensile strength of the essential oil at concentrations of 1, 2, and 15% w/w significantly decreased; at other concentrations, there was no noticeable difference. Because the film was formed using the casting technique (solvent evaporation), this can be an indication that certain areas of the film may have concentrated a greater amount of essential oil during the evaporation process, which would explain these variations in the results. This property’s decrease corresponds to the weaker bonds between essential oil molecules in place of the strong interactions between polymer units[8,17,34] .
About the elongation at break, the films that presented a higher reduction were the films additivated with 2% thyme oil, and the films with 5% thyme oil didn’t change this property in comparison to the neat PBAT film. At other concentrations (1%, 10%, and 20% w/w), the presence of oil could be interfered with by polymer unit interactions, reducing the intermolecular forces along the polymer chain.
For elastic modulus, there was a significant decrease in almost all samples, the exception was the film with 2% w/w thyme oil where there was any significant change. The highest reduction was for the film with 20% w/w thyme oil and this film was the most flexible, justified by the plasticizer effect of carvacrol and thymol, components of thyme oil[35]. Some oily compounds such as carvacrol and thymol can act as plasticizers in polymers, reducing intermolecular forces of the polymer chain and increasing film flexibility. Laorenza and Harnkarnsujarit[16] produced films made of PVA/PBAT with carvacrol oil essential and found that, in comparison to neat blend film, carvacrol improved flexibility, with increased elongation at the break due to improved compatibility of the polymer networks. Moreover, high concentrations of essential oil plasticized and improved film extensibility.
3.8 Differential scanning calorimetry
Two peaks were identified for all samples, one endothermic due to crystallization temperature (Tc) and the other exothermic due to melting temperature (Tm), as too observed by Cardoso et al.[17]. It’s shown in Table 4 data referring to the cold crystallization of neat PBAT films and additivated thyme oil, where ΔHc is the latent heat of crystallization and Xc is the degree of crystallinity.
Table 4 was observed that the Tm of the samples is close to the pure PBAT film and that there was a slight decrease in the Tc because there was an increase in oil in the films.
a,b,c, d,e shows that they are significantly different with p ≤ 0.05.
Polímeros, 34(1), e20240005, 2024 5/9
Effect of thyme essential oil on the properties of poly (butylene adipate-co-terephthalate)(PBAT)
Tensile strength (MPa) Elastic modulus (MPa) Elongation at break (%) PBAT film 12.1 ± 1.0a 51.5 ± 2.5ª 451.8 ± 56.8b,c PBAT/T1 10.2 ± 0.3b 45.3 ± 3.1b 473.7 ± 87.4 b,e,d PBAT/T2 10.3 ± 1.2b 51.7 ± 2.1ª 236.3 ± 6.1a PBAT/T5 12.1 ± 0.8a 47.2 ± 1.2b 414.6 ±63.4b,c PBAT/T10 12.9 ± 1.0ª 38.6 ±2.3c 599.6± 81.8d PBAT/T15 8.4 ± 1.2c 32.8 ±1.9d 346.3 ± 104.6ª,b PBAT/T20 11.6± 0.8a,b 28.5±2.5e 496.8 ± 53.5e,d
Table 3. Average values to mechanical properties.
Samples
Figure 6. Loadings on PC1.
Figure 7. Loadings on PC2.
Luna, P. B. F. G. S., Caetano, V. F., Andrade, M. F., Silva, I. D. L., Araújo, T. L., Souza, K. C., Almeida, Y. M. B., & Vinhas, G. M.
Generally, essential oils do not significantly alter the melting temperature of films[36]. Other studies with PBAT and essential oils have reported the same result[6,8,17,34] In terms of the crystallization temperature (Tc), it appears that adding the essential oil caused this parameter to decrease. This result is consistent with mechanical test results that showed a decrease in the elastic modulus property, indicating that the polymer, except for the PBAT/T2 film, became less rigid with the addition of essential oil. The result can be attributed to the interactions between the polymer matrix and the molecules of the additive, which promote greater structural disorganization and, consequently, require a greater amount of energy to crystallize the polymer[8]
3.9 Thermogravimetric analysis (TGA)
Figures 5 and 6 show the thermogravimetric curves of TGA and DTG for the samples evaluated. The films with or without additives had a similar thermal curve profile. It was observed that there was complete degradation in one stage in the range of 370 °C and 430ºC. All samples show a mass loss of about 90%. Thyme essential oil is a thermosensitive product, and the weight loss between 50°C and 150°C is due to the degradation of low-boiling-point aromatic compounds such as α-thujene and α-pinene. After 150°C until 200°C, it is related to the degradation of high-boiling-point aromatic compounds such as thymol, carvacrol, p-cymene, and γ-Terpinene[16]. According to some researchers, the thermal behavior of PBAT exhibits two stages that correspond to the degradation of PBAT. These stages may be caused by the aromatic copolyester (terephthalic acid) decomposing at 520–600 °C and the aliphatic copolyester (adipic acid and 1,4-butanediol) decomposing at 340-400 °C[37-41]
Table 5 shows the initial temperature (Ton), final temperature (Toff), and maximum temperature of degradation (Tmax) for each sample represented in Figures 8 and 9
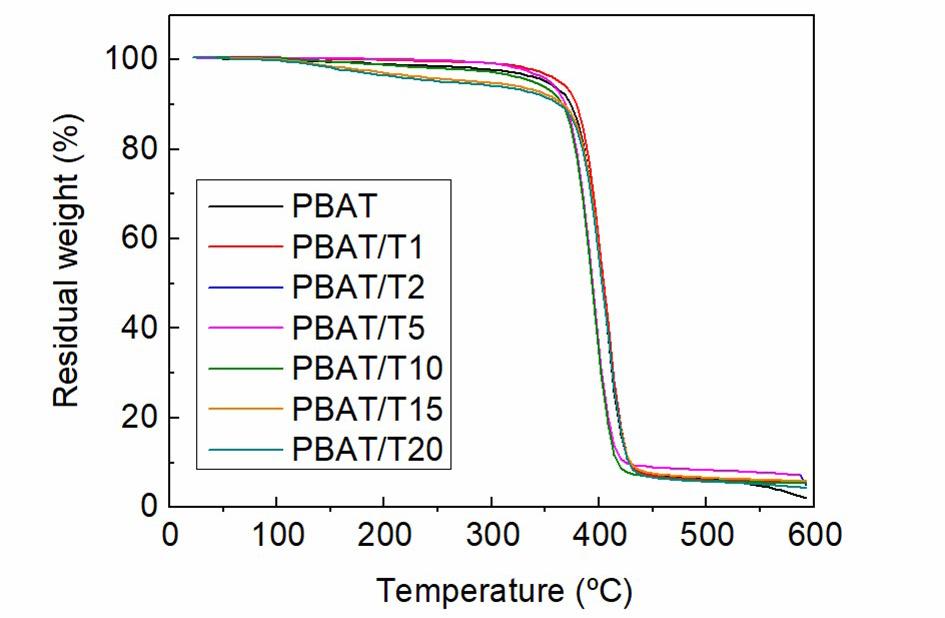
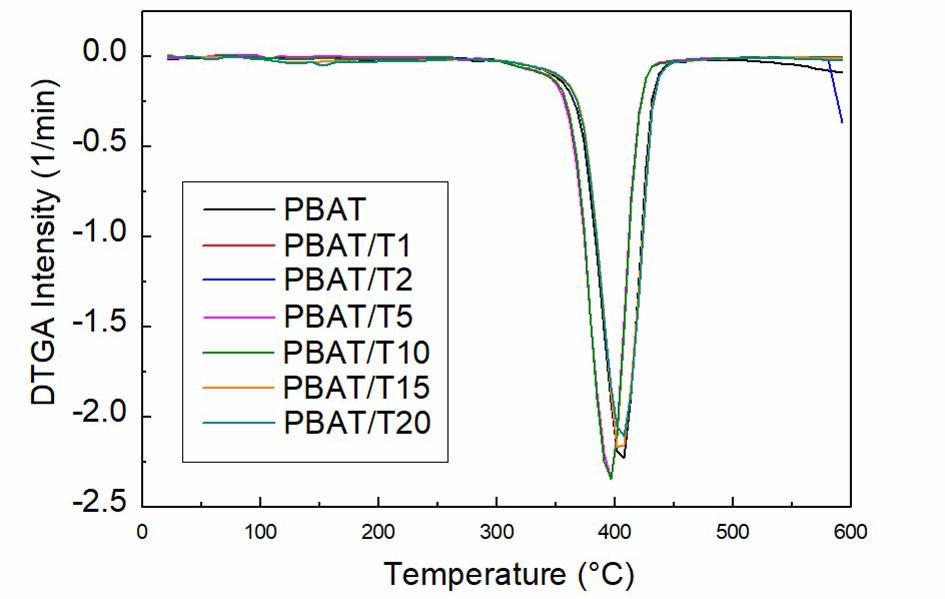
Polímeros, 34(1), e20240005, 2024 6/9
Samples T m (°C) T c (°C) ΔH c (J/g) X c (%) PBAT film 121.8 70.8 11.6 10.2 PBAT/T1 122.3 61.8 10.4 9.1 PBAT/T2 121.6 57.7 12.3 10.7 PBAT/T5 125.1 66.1 11.8 10.4 PBAT/T10 124.4 62.6 12.3 10.8 PBAT/T15 121.8 64.8 12.1 10.6 PBAT/T20 119.3 68.1 11.8 10.4
Table 4. DSC parameters of neat PBAT film and PBAT films with thyme oil.
Films T on Toff T max PBAT film 371.81 425.76 407.72 PBAT/T1 370.22 427.20 407.25 PBAT/T2 361.76 417.46 396.23 PBAT/T5 363.67 413.47 396.39 PBAT/T10 363.83 417.14 396.23 PBAT/T15 373.73 428.63 402.62 PBAT/T20 374.53 429.11 408.20
Table 5. TGA film parameters.
Figure 8. TGA curves of neat PBAT film and additivated film to thyme oil.
Figure 9. DTG curves of neat PBAT film and additivated film to thyme oil.
Effect of thyme essential oil on the properties of poly (butylene adipate-co-terephthalate)(PBAT)
It was found that the maximum degradation temperature and initial temperature decreased for films incorporated with essential oil concentrations ranging from 1 to 10% m/m, indicating a decrease in the thermal stability of the material in this range. However, with the addition of this essential oil, the PBAT/T15 and PBAT/T20 compositions have more thermal stability. This is an indication that higher concentrations of thyme essential oil improve the thermal stability of PBAT and that low concentrations, such as 1% w/w, do not significantly affect the thermal stability of the material.
4. Conclusions
PBAT films with thyme essential oil were successfully produced using the casting technique and proven incorporation of the additive by PCA. Thyme essential oil has been shown to be an effective antimicrobial agent against both gram-positive and gram-negative bacteria. The films present different behaviors in their mechanical and thermal properties according to the evaluated oil concentration, thus increasing the range of applications for this material in the food industry. The PBAT proposal with thyme essential oil showed promise for active packaging for food, as the oil showed efficient antimicrobial activity.
5. Author’s Contribution
• Conceptualization – Glória Maria Vinhas.
• Data curation – NA.
• Formal analysis – Pâmela Barcelar Ferreira Gomes da Silva de Luna; Viviane Fonseca Caetano; Tiago Lopes de Araújo; Glória Maria Vinhas.
• Funding acquisition - Glória Maria Vinhas.
• Investigation – Pâmela Barcelar Ferreira Gomes da Silva de Luna.
• Methodology – Pâmela Barcelar Ferreira Gomes da Silva de Luna; Viviane Fonseca Caetano; Ivo Diego de Lima Silva; Michelle Félix de Andrade; Tiago Lopes de Araújo; Karina Carvalho de Souza.
• Project administration – Glória Maria Vinhas.
• Resources – Glória Maria Vinhas.
• Software – NA.
• Supervision – Viviane Fonseca Caetano; Glória Maria Vinhas.
• Validation – Viviane Fonseca Caetano; Glória Maria Vinhas.
• Visualization – Pâmela Barcelar Ferreira Gomes da Silva de Luna; Viviane Fonseca Caetano; Yêda Medeiros Bastos de Almeida; Glória Maria Vinhas.
• Writing – original draft – Pâmela Barcelar Ferreira Gomes da Silva de Luna; Viviane Fonseca Caetano; Michelle Félix de Andrade; Ivo Diego de Lima Silva; Glória Maria Vinhas.
• Writing – review & editing – Pâmela Barcelar Ferreira Gomes da Silva de Luna; Viviane Fonseca Caetano; Tiago Lopes de Araújo; Glória Maria Vinhas.
6. Acknowledgements
The financial support Foundation for the Support of Science and Technology of the State of Pernambuco (Facepe).
7. References
1 Ardusso, M., Forero-López, A. D., Buzzi, N. S., Spetterac, C. V., & Fernández-Severinia, M. D. (2021). COVID-19 pandemic repercussions on plastic and antiviral polymeric textile causing pollution on beaches and coasts of South America. The Science of the Total Environment, 763, 144365 http://dx.doi. org/10.1016/j.scitotenv.2020.144365 PMid:33360513.
2 Skariyachan, S., Patil, A. A., Shankar, A., Manjunath, M., Bachappanavar, N., & Kiran, S. (2018). Enhanced polymer degradation of polyethylene and polypropylene by novel thermophilic consortia of Brevibacillus sps. and Aneurinibacillus sp. screened from waste management landfills and sewage treatment plants. Polymer Degradation & Stability, 149, 52-68 http://dx.doi.org/10.1016/j.polymdegradstab.2018.01.018
3 Bonilla, J., Paiano, R. B., Lourenço, R. V., Bittante, A. M. Q. B., & Sobral, P. J. A. (2020). Biodegradability in aquatic system of thin materials based on chitosan, PBAT and HDPE polymers: respirometric and physical-chemical analysis. International Journal of Biological Macromolecules, 164, 1399-1412 http:// dx.doi.org/10.1016/j.ijbiomac.2020.07.309 PMid:32763389.
4. Wilkes, R. A., & Aristilde, L. (2017). Degradation and metabolism of synthetic plastics and associated products by Pseudomonas sp.: capabilities and challenges. Journal of Applied Microbiology, 123(3), 582-593 http://dx.doi.org/10.1111/ jam.13472 PMid:28419654.
5 Zhong, Y., Godwin, P., Jin, Y., & Xiao, H. (2020). Biodegradable polymers and green-based antimicrobial packaging materials: a mini-review. Advanced Industrial and Engineering Polymer Research, 3(1), 27-35 http://dx.doi.org/10.1016/j.aiepr.2019.11.002
6. Moraes, L. E. P. T. Fo, Andrade, M. F., Freitas, L. F., Palha, M. L. A. P. F., & Vinhas, G. M. (2022). Development and characterization of poly(butylene adipateco-terephthalate) (PBAT) antimicrobial films with clove and cinnamon essential oils. Journal of Food Processing and Preservation, 46(4), e16489 http://dx.doi.org/10.1111/jfpp.16489
7 Guo, G., Zhang, C., Du, Z., Zou, W., Tian, H., Xiang, A., & Li, H. (2015). Structure and property of biodegradable soy protein isolate/PBAT blends. Industrial Crops and Products, 74, 731-736. http://dx.doi.org/10.1016/j.indcrop.2015.06.009.
8 Andrade, M. F., Silva, I. D. L., Silva, G. A., Cavalcante, P. V. D., Silva, F. T., Almeida, Y. M. B., Vinhas, G. M., & Carvalho, L. H. (2020). A study of poly (butylene adipate-co-terephthalate)/ orange essential oil films for application in active antimicrobial packaging. Lebensmittel-Wissenschaft + Technologie, 125, 109148 http://dx.doi.org/10.1016/j.lwt.2020.109148
9 Zuo, L.-Z., Li, H.-X., Lin, L., Sun, Y.-X., Diao, Z.-H., Liu, S., Zhang, Z.-Y., & Xu, X.-R. (2019). Sorption and desorption of phenanthrene on biodegradable poly(butylene adipate co-terephtalate) microplastics. Chemosphere, 215, 25-32 http:// dx.doi.org/10.1016/j.chemosphere.2018.09.173 PMid:30300808.
10 Jian, J., Xiangbin, Z., & Xianbo, H. (2020). An overview on synthesis, properties and applications of poly(butylene-adipateco-terephthalate)–PBAT. Advanced Industrial and Engineering Polymer Research, 3(1), 9-26 http://dx.doi.org/10.1016/j. aiepr.2020.01.001
11. Cui, H., Ma, C., Li, C., & Lin, L. (2016). Enhancing the antibacterial activity of thyme oil against Salmonella on eggshell by plasma-assisted process. Food Control, 70, 183-190 http://dx.doi.org/10.1016/j.foodcont.2016.05.056
Polímeros, 34(1), e20240005, 2024 7/9
12 Altan, A., Aytac, Z., & Uyar, T. (2018). Carvacrol loaded electrospun fibrous films from zein and poly(lactic acid) for active food packaging. Food Hydrocolloids, 81, 48-59. http://dx.doi.org/10.1016/j.foodhyd.2018.02.028
13 Hu, J., Zhang, Y., Xiao, Z., & Wang, X. (2018). Preparation and properties of cinnamon-thyme-ginger composite essential oil nanocapsules. Industrial Crops and Products, 122, 85-92 http://dx.doi.org/10.1016/j.indcrop.2018.05.058
14 Zhang, Y., Zhou, L., Zhang, C., Show, P. L., Du, A., Fu, J., & Ashokkumar, V. (2020). Preparation and characterization of curdlan/polyvinyl alcohol/ thyme essential oil blending film and its application to chilled meat preservation. Carbohydrate Polymers, 247, 116670 http://dx.doi.org/10.1016/j.carbpol.2020.116670 PMid:32829798.
15 Borges, A. G. F. C., Pessoa, P. H., Araújo, T. L., Souza, K. C., Carneiro, C. N., Luna, P. B. F. G. S., Vinhas, G. M., & Almeida, Y. M. B. (2022). Preparation and characterization of poly(butylene adipate-co-terephthalate) films added with Melaleuca alternifolia essential oil. Research, Social Development, 11(8), e55511831332 http://dx.doi.org/10.33448/ rsd-v11i8.31332.
16 Laorenza, Y., & Harnkarnsujarit, N. (2021). Carvacrol, citral and α-terpineol essential oil incorporated biodegradable films for functional active packaging of Pacific white shrimp. Food Chemistry, 363, 130252 http://dx.doi.org/10.1016/j. foodchem.2021.130252 PMid:34118755.
17 Cardoso, L. G., Santos, J. C. P., Camilloto, G. P., Miranda, A. L., Druzian, J. I., & Guimarães, A. G. (2017). Development of active films poly (butylene adipate co-terephthalate) – PBAT incorporated with oregano essential oil and application in fish fillet preservation. Industrial Crops and Products, 108, 388-397. http://dx.doi.org/10.1016/j.indcrop.2017.06.058.
18 ASTM International. (2002). ASTM D 882-02: standard test method for tensile properties of thin plastic sheeting USA: ASTM International http://dx.doi.org/10.1520/D0882-18
19 Pereira, R. B., & Morales, A. R. (2014). Estudo do comportamento térmico e mecânico do PLA modificado com aditivo nucleante e modificador de impacto. Polímeros , 24 (2 ), 198 -202 http://dx.doi.org/10.4322/polimeros.2014.042.
20 Sadekuzzaman, M., Mizan, M. F. R., Kim, H.-S., Yang, S., & Ha, S.-D. (2018). Activity of thyme and tea tree essential oils against selected foodborne pathogens in biofilms on abiotic surfaces. Lebensmittel-Wissenschaft + Technologie, 89, 134-139 http://dx.doi.org/10.1016/j.lwt.2017.10.042
21 Burt, S. (2004). Essential oils: their antibacterial properties and potential applications in foods - a review. International Journal of Food Microbiology, 94(3), 223-253 http://dx.doi. org/10.1016/j.ijfoodmicro.2004.03.022 PMid:15246235.
22 Pirbalouti, A. G., Hashemi, M., & Ghahfarokhi, F. T. (2013). Essential oil and chemical compositions of wild and cultivated Thymus daenensis Celak and Thymus vulgaris L. Industrial Crops and Products, 48, 43-48 http://dx.doi.org/10.1016/j. indcrop.2013.04.004
23 Cosentino, S., Tuberoso, C. I. G., Pisano, B., Satta, M., Mascia, V., Arzedi, E., & Palmas, F. (1999). In-vitro antimicrobial activity and chemical composition of Sardinian Thymus essential oils. Letters in Applied Microbiology, 29(2), 130-135. http://dx.doi. org/10.1046/j.1472-765X.1999.00605.x PMid:10499301.
24 The National Committee for Clinical Laboratory StandardsNCCLS. (2023). M2-A8: performance standards for antimicrobial disk susceptibility test USA: NCCLS
25 Valeriano, C., Piccoli, R. H., Cardoso, M. G., & Alves, E. (2012). Atividade antimicrobiana de óleos essenciais em bactérias patogênicas de origem alimentar. Revista Brasileira de Plantas Medicinais, 14(1), 57-67 http://dx.doi.org/10.1590/ S1516-05722012000100009
26 Lemos, M. F., Lemos, M. F., Pacheco, H. P., Guimarães, A. C., Fronza, M., Endringer, D. C., & Scherer, R. (2017). Seasonal variation affects the composition and antibacterial and antioxidant activities of Thymus vulgaris. Industrial Crops and Products, 95, 543-548 http://dx.doi.org/10.1016/j. indcrop.2016.11.008
27. Mirsharifi, S. M., Sami, M., Jazaeri, M., & Rezaei, A. (2023). Production, characterization, and antimicrobial activity of almond gum/ polyvinyl alcohol/chitosan composite films containing thyme essential oil nanoemulsion for extending the shelf-life of chicken breast fillets. International Journal of Biological Macromolecules, 227, 405-415 http://dx.doi. org/10.1016/j.ijbiomac.2022.12.183 PMid:36563800.
28 Lin , L. , Zhu , Y. , & Cui , H. ( 2018 ). Electrospun thyme essential oil/gelatin nanofibers for active packaging against Campylobacter jejuni in chicken. Lebensmittel-Wissenschaft + Technologie , 97 , 711-718 http://dx.doi.org/10.1016/j. lwt.2018.08.015
29. Valderrama, A. C. S., & De, G. C. R. (2017). Traceability of Active Compounds of Essential Oils in Antimicrobial Food Packaging Using a Chemometric Method by ATR-FTIR. American Journal of Analytical Chemistry, 8(11), 726-741 http://dx.doi.org/10.4236/ajac.2017.811053
30 Li, X., Tan, D., Xie, L., Sun, H., Sun, S., Zhong, G., & Ren, P. (2018). Effect of surface property of halloysite on the crystallization behavior of PBAT. Applied Clay Science, 157, 218-226 http://dx.doi.org/10.1016/j.clay.2018.02.005
31 Bheemaneni, G., Saravana, S., & Kandaswamy, R. (2018). Processing and Characterization of Poly (butylene adipateco-terephthalate) / Wollastonite Biocomposites for Medical Applications. Materials Today: Proceedings, 5(1), 1807-1816 http://dx.doi.org/10.1016/j.matpr.2017.11.279
32 Brandelero, R. P. H., Grossmann, M. V., & Yamashita, F. (2013). Hidrofilicidade de filmes de amido/poli(butileno adipato co-tereftalato) (pbat) adicionados de tween 80 e óleo de soja. Polímeros, 23(2), 270-275 http://dx.doi.org/10.1590/ S0104-14282013005000011
33 Jolliffe, I. T., & Cadima, J. (2016). Principal component analysis: a review and recent developments. Philosophical Transactions. Series A, Mathematical, Physical, and Engineering Sciences, 374(2065), 20150202 http://dx.doi.org/10.1098/rsta.2015.0202 PMid:26953178.
34 Hao, Y., Chu, Y., Zhang, M., Shi, W., Chen, Y., Li, D., & Li, L. (2022). Preparation of functional degradable antibacterial film and application in fresh-keeping of grass carp. Journal of Agriculture and Food Research, 9, 100341 http://dx.doi. org/10.1016/j.jafr.2022.100341
35 Persico, P., Ambrogi, V., Carfagna, C., Cerruti, P., Ferrocino, I., & Mauriello, G. (2009). Nanocomposite polymer films containing carvacrol for antimicrobial active packaging. Polymer Engineering and Science, 49(7), 1447-1455 http:// dx.doi.org/10.1002/pen.21191.
36 Sung, S.-Y., Sin, L. T., Tee, T.-T., Bee, S.-T., & Rahmat, A. R. (2014). Effects of Allium sativum essence oil as antimicrobial agent for food packaging plastic film. Innovative Food Science & Emerging Technologies, 26, 406-414. http://dx.doi. org/10.1016/j.ifset.2014.05.009
37 Pelissari, F. M. (2009). Produção e caracterização de filmes de amido de mandioca, quitosana e glicerol com incorporação de óleo essencial de orégano (Master’s thesis). Londrina: Universidade Estadual de Londrina
38 Signori, F., Coltelli, M.-B., & Bronco, S. (2009). Thermal degradation of poly(lactic acid) (PLA) and poly(butylene adipate-co-terephthalate) (PBAT) and their blends upon melt processing. Polymer Degradation & Stability, 94(1), 74-82 http://dx.doi.org/10.1016/j.polymdegradstab.2008.10.004
Luna, P. B. F. G. S., Caetano, V. F., Andrade, M. F., Silva, I. D. L., Araújo, T. L., Souza, K. C., Almeida, Y. M. B., & Vinhas, G. M. Polímeros, 34(1), e20240005, 2024
8/9
Effect of thyme essential oil on the properties of poly (butylene adipate-co-terephthalate)(PBAT)
39 Al-Itry, R., Lamnawar, K., & Maazouz, A. (2012). Improvement of thermal stability, rheological and mechanical properties of PLA, PBAT and their blends by reactive extrusion with functionalized epoxy. Polymer Degradation & Stability, 97(10), 1898-1914 http://dx.doi.org/10.1016/j.polymdegradstab.2012.06.028.
40 Kijchavengkul, T., Auras, R., & Rubino, M. (2008). Measuring gel content of aromatic polyesters using FTIR spectrophotometry and DSC. Polymer Testing , 27 (1), 55-60 http://dx.doi. org/10.1016/j.polymertesting.2007.08.007
41 Ibrahim, N. A., Rahim, N. M., Wan, Y. W. Z., & Sharif, J. (2011). A study of poly vinyl chloride / poly(butylene adipateco-terephthalate) blends. Journal of Polymer Research, 18(5), 891-896 http://dx.doi.org/10.1007/s10965-010-9486-1
Received: Feb. 06, 2023
Revised: Dec. 07, 2023
Accepted: Dec. 28, 2023
Polímeros, 34(1), e20240005, 2024 9/9
Low-cost and novel Arduino®-Load cell-based prototype to determine transition temperatures
Luis Carlos Rodríguez-Pacheco1, Francisco Paraguay-Delgado1 , Rubén Castañeda-Balderas1 , María Luisa Camacho-Ríos1 , Guillermo Manuel Herrera-Pérez1 , Iván Alziri Estrada-Moreno2 and Daniel Lardizábal-Gutiérrez1*
1Laboratorio de Análisis Térmicos, Departamento de Física de Materiales, Centro de Investigación en Materiales Avanzados S.C. – CIMAV, Chihuahua, Chihuahua, Mexico
2Laboratorio de Reología de Polímeros, Departamento de Ingeniería y Química de Materiales, Centro de Investigación en Materiales Avanzados S.C. – CONACyT, Chihuahua, Chihuahua, Mexico
*daniel.lardizabal@cimav.edu.mx
Obstract
The polymer transition temperature is a crucial parameter in the industry for knowing raw materials before starting the manufacturing process. The current work reports a novel low-cost prototype instrument to measure the transition temperature with reliable accuracy. The equipment was built using commercial load cells composed of strain gauges in combination with an Arduino® microcontroller. The prototype measurement quality was validated by measuring the transition temperatures of most commercial polymers. The obtained values were compared with values obtained by conventional thermal analysis known as differential scanning calorimetric and thermo-mechanical analysis (DSC and TMA), which results in identical values.
Keywords: Arduino®, load cell, polymer transition, DSC, TMA.
How to cite: Rodríguez-Pacheco, L. C., Paraguay-Delgado, F., Castañeda-Balderas, R., Camacho-Ríos, M. L., Herrera-Pérez, G. M., Estrada-Moreno, I. A., & Lardizábal-Gutiérrez, D. Low-cost and novel Arduino®-Load cell-based prototype to determine transition temperatures. Polímeros: Ciência e Tecnologia, 34(1), e20240006. https://doi.org/10.1590/0104-1428.20230036
1. Introduction
The transition temperature is an important parameter that can be applied to polymers which contribute to determining their application in manufacturing. According to the morphology, thermoplastics can have either one or two possible transitions: glass-transition temperature (Tg) and melting temperature (Tm). The first is present for polymers with a predominant amorphous structure and the second is when the structure is crystalline. Meanwhile, polymers with the semi-crystalline structure showcase both Tg and Tm[1]. When a polymer is heated up, any of these transition temperatures are reached and it changes in properties like specific volume and heat capacity[2]. The glass transition is a second-order change, it occurs when the ends of the polymeric chains initiate a vibration, with the consequent change to rigidity, hardness, and/or brittleness. Due to these transitions, polymer materials can be evaluated with different thermal techniques[3]. Commonly used thermal analyses to characterize polymers are differential scanning calorimetric (DSC) analysis, dynamic mechanical analysis (DMA), thermo-mechanical analysis (TMA), and dielectric thermal analysis (DEA)[4]. For the plastics industry, the importance of Tg and Tm involves two aspects. First, it is to establish the processing temperatures for the injection and molding[5]. The second is about characterizing and identifying each polymer. A frequent problem in the plastics industry is the inter-change of raw materials generating mistakes.
This problem occurs mainly in factories, which use many types of raw materials. Sometimes this problem is not easily detected. For example, when two polymers with clearly different processing temperatures are mixed, resulting in a nozzle obstruction or slow flow during the injection. Unfortunately, this phenomenon is not detected just when the final product reaches the customers. These products present faults up to break, due to the mixing of pellets with different amounts of filler[6] .
The common thermal analysis instruments to characterize polymers are expensive, with prices of around 30,000 USD. It is an expensive inversion for medium and small companies. There is also the alternative of paying out-services for these analyses through certified laboratories. However, this option becomes unprofitable when the test numbers increase.
The purpose of this work is to design a novel prototype to measure transition temperatures with high precision and low cost. This prototype is made with commercial load cells (strain gauges)[7,8] in combination with an Arduino® microcontroller. The sensor module is a platform based on open-source software and hardware, widely used by developers due to its high flexibility for measurement and control projects[9]. The prototype was validated by measuring transition temperatures for four different commercially available polymers. These values were compared with data obtained by TMA and DSC techniques[10] .
https://doi.org/10.1590/0104-1428.20230036 O O O O O O O O
Polímeros, 34(1), e20240006, 2024 ISSN 1678-5169 (Online) 1/5
O O O O O O O
Rodríguez-Pacheco, L. C., Paraguay-Delgado, F., Castañeda-Balderas, R., Camacho-Ríos, M. L., Herrera-Pérez, G. M., Estrada-Moreno, I. A., & Lardizábal-Gutiérrez, D.
2. Materials and Methods
2.1 Materials
Acrylonitrile butadiene styrene (ABS) and polystyrene (PS) were used to perform the glass transition temperature (Tg) measurements. While polyoxymethylene (POM) and high-density polyethylene (HDPE) were chosen to measure melting temperature (Tm). All materials were brand Henkel.
2.2 Thermal characterization
Comparative thermal analysis was made by DSC and TA Instruments model Q200, with a heat-up and cool-down cycle range from 25 °C to 200 °C. The DSC and TMA measurements were obtained three times for each sample. The heating ramp was programmed at 10 °C/min in an inert atmosphere with a volume flow of 50 Ncm3/min. Meanwhile for thermo-mechanical analysis (TMA) was used TA Instruments model Q400. The same heat ramp was used in DSC, reaching 200 °C, and an applied load of 0.1 N with a penetration probe. ASTM D3418 standard was followed for DSC measurement to determine the middle points in slope change of glass-transition temperature for ABS and PS[11]. However, in the case of endothermic fusion HDPE and POM were considered the middle point. ASTM E1545[12] standard was followed for TMA analysis to assign temperature points where dimensional changes correspond to glass-transition and fusion points.
The polymer probes to measure by prototype were sheet plates with 10 × 10 mm dimensions and a 1.5 mm thickness. These plates were put on top of an internal oven platform (Figure 1). Over the plates, a probe with a penetration tip was placed and adjusted to an approximate load of 1 N by a calibrated spring. The oven was programmed with a heating ramp of 10 °C/min, starting from room temperature to 200 °C.
2.3 Prototype
An Arduino® Mega 2560 microcontroller was used for data processing and storage. For deformation data reading, a sensor module, cold-junction-compensated with K-thermocouple-to-digital converter model MAX6675, and a 1 kg load cell (brand Sparkfun) plugged into an ADC HX71 24 bits module (brand XFW), were used. These load cells are co-formed by 2 strain gauges placed at the bottom and top. They measure the deformation produced in the load cell by reading the voltage induced in them. These components were connected to the microcontroller to plot data, with the X axis related to temperature, and the Y axis associated with a DC signal response. The heating ramp implemented was 10 °C/min. Figure 1 shows prototype components, which consist of a platform where the Arduino® was placed, while one edge of the load cell is attached to the same platform. The other edge was fixed with a penetration probe that is in contact with the sample.
The sample holder is concentrically positioned concerning the oven hole (Figure 2). It is a platform where a piece of polymer sample to analyze was located and on it was placed the penetration probe of 6 mm in diameter, adjusted at 1 N by a calibrated spring. Close to the sample was placed a K-type thermocouple (TC). It was used to register the temperature of the polymer sample.
3. Results and Discussion
3.1 Acrylonitrile Butadiene Styrene (ABS)
Figure 3a shows DSC and TMA analysis for the ABS polymer. The black dotted vertical line (denoted the DSC) shows a change in the slope of the curve, indicating a glass transition (Tg) of the material at 75.8 °C. While the TMA technique shows the onset temperature at 80.7 °C.
Figure 3b shows the graph acquired for the ABS sample by the prototype. In this case, the signal is a voltage change as a function of the temperature. The dotted line reveals the beginning of a voltage drop in the output signal at 82.1 °C, this was determined by the derivative of the signal voltage drop vs temperature. This value is similar to the TMA measurement. There is a 1.4 °C difference between both instruments.
3.2 Polystyrene (PS)
Figure 4a shows results for polystyrene by DSC and TMA techniques. The value determined by the DSC graph is dotted by the vertical line to locate a change in the slope of the curve. The glass transition is localized at 101.1 °C. It can be noticed, that the signal is weak and it could not be accurate. However, the value determined by TMA is 100.4 °C. In this case at the beginning of the dimensional change; there is a difference of 0.7 °C in comparison to getting by DSC. The glass-transition temperature for this polymer is almost the same value for both techniques.
Figure 4b shows the glass-transition temperature registered by the prototype, the value is 98.6 °C. The glass transition temperature was determined by the change of the slope in the signal drop vs temperature derivative. This value is reflecting a difference of 1.8 °C below the value determined by TMA.
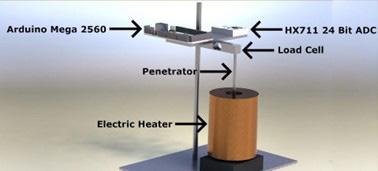
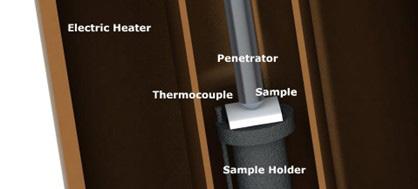
Polímeros, 34(1), e20240006, 2024 2/5
Figure 1. Schematical representation of prototype components.
Figure 2. Cross-section view of the sample holder inside the electric heater.
Low-cost and novel Arduino®-Load cell-based prototype to determine transition temperatures
3.3 High-Density Polyethylene (HDPE)
Figure 5a shows the melting transition temperatures for HDPE polymer. For this sample, the DSC behavior is so different. The value is determined by two black dotted lines prolongation crossing. This result agrees with the DSC melting point temperature registered at 129.1 °C. This type of sample is noticed, in contrast to the signal to determine the Tg value (weak slope changing).
Meanwhile, the melting point temperature obtained by the TMA technique, onset the value is at 128.9 °C.
The melting transition temperature registered by our prototype is shown in Figure 5b. The derivative of the signal voltage drop vs temperature showed the beginning of the melting point in HDPE. In this case, the value is at 128.8 °C which is below 0.1 °C concerning the TMA technique.
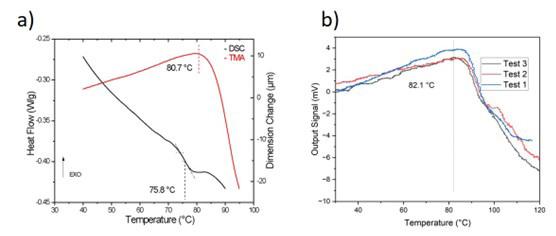
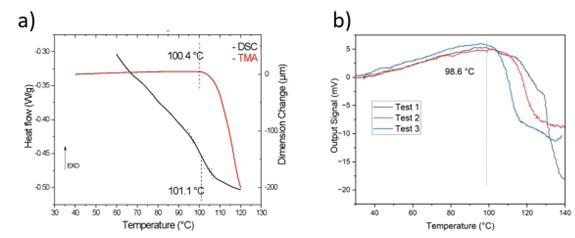
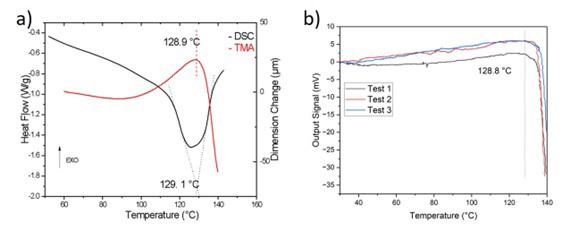
Polímeros, 34(1), e20240006, 2024 3/5
Figure 3. (a) DSC/TMA analysis of ABS; (b) ABS analysis by prototype (load cell-strain gauge).
Figure 4. (a) DSC/TMA analysis of PS; (b) PS analysis by prototype (load cell-strain gauge).
Figure 5. (a) DSC/TMA behavior for HDPE sample; (b) HDPE polymer behavior by prototype (load cell-strain gauge).
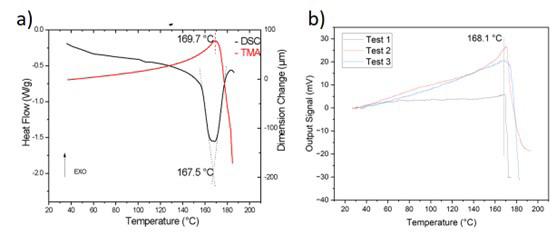
3.4 Polyoxymethylene (POM)
DSC and TMA analysis was also performed for the POM sample. Figure 6a shows the melting point temperature. Similar to the criterion for the sample evaluated in Figure 5a, the two black-dotted lines crossing corresponds to the mid-point of the endotherm registered at 167.5 °C. The red-dotted line indicates the beginning of a dimensional change in TMA, corresponding to a melting point, registered at a temperature of 169.7 °C.
The melting temperature (determined by the slope change in the derivative signal voltage drop vs temperature) for the sample POM registered by our prototype is shown in Figure 6b. The value determined is 168.1 °C. This is associated with melting, where a phase starts to change for the polymer POM. There is a 1.6 °C value difference between the prototype and TMA measurement. In general, the signal variation registered in the measurement process by the prototype is clear in comparison to the DSC technique. It is more difficult to determine the Tg value for the polymer samples.
3.5 Transition temperatures comparison between TMA and prototype
There is an evident transition temperature correlation between TMA and our prototype. The values determined by both instruments are adequate to get glass transition and melting temperatures for polymers. This affinity is based on the implemented measurement principle, where the Tg property changes from rigid to soft. A slight penetration of the probe, and in the case of melting temperatures where changes are observed when the material goes into a liquid state. Table 1 shows a comparison of both techniques with the respective percentage errors.
It can be noticed that the prototype values variation percentage from the TMA technique does not surpass 2%. In the case involved the melting temperature did not surpass a 1% variation. Then, it is more effective to determine such temperatures. This becomes logical when dimensional change is measured (in the case of TMA) and voltage variation (in the case of the prototype), which are greater for melting processes than glass transitions.
4. Conclusions
A novel low-cost prototype to perform thermal measurements with reliable accuracy was successfully developed. Four commercial polymers were used to validate the high-precision measurements of this prototype. The values obtained in the current comparison present minimum differences with results obtained by DSC and TMA techniques. The glass transition and melting transition temperature changes exhibit a minimum variation in comparison to data obtained by TMA and DSC techniques. This happens because of the difference in the quantity of energy involved, being the energy for melting is more than the energy for Tg. The most outstanding advantages are that modules can be acquired easily and cheap fabrication costs. For the present prototype, investment did not surpass 500 USD in materials. All used devices make it a reliable low-cost option for micro and small companies working in the plastics industry.
5. Author’s Contribution
• Conceptualization – Luis Carlos Rodríguez-Pacheco; Daniel Lardizábal-Gutiérrez.
• Data curation – NA.
Paraguay-Delgado,
Estrada-Moreno,
Polímeros, 34(1), e20240006, 2024 4/5
Rodríguez-Pacheco, L. C.,
F., Castañeda-Balderas, R., Camacho-Ríos, M. L., Herrera-Pérez, G. M.,
I. A., & Lardizábal-Gutiérrez, D.
Polymers Transition type TMA (°C) Prototype (°C) Variation percentage concerning TMA (%) ABS Tg 80.7 82.1 1.73 PS Tg 100.4 98.6 1.79 HDPE Tm 128.9 128.8 -0.08 POM Tm 169.7 168.1 -0.94
Table 1. Comparison between thermo-mechanical analysis (TMA) and prototype measurements.
Figure 6. (a) DSC/TMA analysis of POM; (b) POM analysis by prototype (load cell-strain gauge).
Low-cost and novel Arduino®-Load cell-based prototype to determine transition temperatures
• Formal analysis – María Luisa Camacho-Ríos; Luis Carlos Rodríguez-Pacheco; Daniel LardizábalGutiérrez.
• Funding acquisition – NA.
• Investigation – Guillermo Manuel Herrera-Pérez; María Luisa Camacho-Ríos; Luis Carlos RodríguezPacheco; Daniel Lardizábal-Gutiérrez.
• Methodology – Francisco Paraguay-Delgado; Luis Carlos Rodríguez-Pacheco; Iván Alziri Estrada-Moreno.
• Project administration – NA.
• Resources – Daniel Lardizábal-Gutiérrez; Francisco Paraguay-Delgado.
• Software – Rubén Castañeda-Balderas; Luis Carlos Rodríguez-Pacheco.
• Supervision – Francisco Paraguay-Delgado; Iván Alziri Estrada Moreno.
• Validation – Rubén Castañeda-Balderas; Guillermo Manuel Herrera-Pérez.
• Visualization – Daniel Lardizábal-Gutiérrez; Francisco Paraguay-Delgado; Luis Carlos Rodríguez-Pacheco.
• Writing – original draft – Daniel LardizábalGutiérrez; Luis Carlos Rodríguez-Pacheco.
• Writing – review & editing – Daniel LardizábalGutiérrez; Francisco Paraguay-Delgado; Luis Carlos Rodríguez-Pacheco.
6. Acknowledgements
The authors thank Luis de La Torre and Miguel Alonso Orozco-Alvarado (CIMAV) for their technical support.
7. References
1 Rieger, J. (2001). The Glass transition temperature Tg of polymers - Comparison of the values from differential thermal analysis (DTA, DSC) and dynamic mechanical measurements (torsion pendulum). Polymer Testing , 20 ( 2 ), 199 - 204 http://dx.doi.org/10.1016/S0142-9418(00)00023-4
2 Srivastava, A., Chandel, N., & Mehta, N. (2019). Novel explanation for thermal analysis of glass transition.
Materials Science and Engineering B , 247 , 114378 http://dx.doi.org/10.1016/j.mseb.2019.114378
3 Gracia-Fernández, C. A., Gómez-Barreiro, S., López-Beceiro, J., Saavedra, J. T., Naya, S., & Artiaga, R. (2010). Comparative study of the dynamic glass transition temperature by DMA and TMDSC. Polymer Testing, 29(8), 1002-1006 http://dx.doi. org/10.1016/j.polymertesting.2010.09.005
4 Michel, M., & Ferrier, E. (2020). Effect of curing temperature conditions on glass transition temperature values of epoxy polymer used for wet lay-up applications. Construction & Building Materials, 231, 117206 http://dx.doi.org/10.1016/j. conbuildmat.2019.117206
5 Rosato, D. V., Rosato, D. V., & Rosato, M. G. (Eds.) (2000). Injection molding handbook USA: Springer http://dx.doi. org/10.1007/978-1-4615-4597-2
6 Friedrich, K., Zhang, Z., & Schlarb, A. K. (2005). Effects of various fillers on the sliding wear of polymer composites. Composites Science and Technology, 65(15-16), 2329-2343. http://dx.doi.org/10.1016/j.compscitech.2005.05.028
7 Hempel, M., Nezich, D., Kong, J., & Hofmann, M. (2012). A novel class of strain gauges based on layered percolative films of 2D materials. Nano Letters, 12(11), 5714-5718 http://dx.doi.org/10.1021/nl302959a PMid:23045955.
8 Lienhard, J., & Huberth, F. (2019). Strain rate dependent thermo-mecha nical aspects of glass fiber reinforced thermoplastic based on experimental data. International Journal of Impact Engineering, 131, 57-65 http://dx.doi.org/10.1016/j. ijimpeng.2019.04.023
9 El-Abd, M. (2017). A review of embedded systems education in the arduino age: lessons learned and future directions. International Journal of Engineering Pedagogy, 7(2), 79-93. http://dx.doi.org/10.3991/ijep.v7i2.6845
10 Huang, C.-Y., & Ying, K.-C. (2017). Applying strain gauges to measuring thermal warpage of printed circuit boards. Measurement, 110, 239-248 http://dx.doi.org/10.1016/j. measurement.2017.06.029
11 Rieger, J. (1996). The glass transition temperature of polystyrene. Journal of Thermal Analysis, 46(3), 965-972 http://dx.doi. org/10.1007/BF01983614.
12 American Society for Testing and Materials – ASTM (2011). ASTM E1545-11: standard test method for assignment of the glass transition temperature by thermomechanical analysis West Conshohocken: ASTM
Received: Jun. 23, 2023 Revised: Jan. 25, 2024 Accepted: Jan. 26, 2024
Polímeros, 34(1), e20240006, 2024 5/5
Compatibility
and cytotoxicity of poly(ε-caprolactone)/ polypyrrole-block-poly(ε-caprolactone) blend films
fibroblast bovine cells
in
Nelson Luis Gonçalves Dias de Souza1,2* , Grasiele Soares Cavallini1,2 , Tiago Teixeira Alves2 , Michele Munk Pereira3 , Humberto de Mello Brandão4 and Luiz Fernando Cappa de Oliveira5
1Colegiado de Ciências Exatas e Biotecnológicas, Universidade Federal do Tocantins – UFT, Gurupi, TO, Brasil
2Programa de Pós-graduação em Química, Universidade Federal do Tocantins – UFT, Gurupi, TO, Brasil
3Departamento de Biologia, Instituto de Ciências Biológicas, Universidade Federal de Juiz de Fora – UFJF, Juiz de Fora, MG, Brasil
4Empresa Brasileira de Pesquisa Agropecuária – Embrapa Gado de Leite, Juiz de Fora, MG, Brasil
5Núcleo de Espectroscopia e Estrutura Molecular, Departamento de Química, Universidade Federal de Juiz de Fora – UFJF, Juiz de Fora, MG, Brasil
*nelson.luis@uft.edu.br
Obstract
Polymer blends, derived from the combination of two or more polymers, yield novel materials with properties distinct from that of the original polymers. These materials have garnered interest in the medical field. However, for such applications the biocompatibility of the material must be evaluated. In this study, we prepared polymer blends from poly(ε-caprolactone) (PCL) and polypyrrole-block-poly(caprolactone) (PPy-b-PCL) using the casting method. The observed compatibility resulted from specific interactions between the carboxylic group of PCL and the amine group of PPy-b-PCL, as well as between the pyrrole ring of PPy-b-PCL and the CH2 group of PCL. Micro-Raman imaging revealed homogeneity in surface morphology, whereas thermogravimetric analysis indicated that the formation of polymer blends enhances the material’s thermal stability. Importantly, the results demonstrated that the addition of PPy-b-PCL does not affect the cytotoxicity to bovine fibroblasts, suggesting their biocompatibility and potential application in cattle veterinary devices.
Keywords: biocompatibility, cell proliferation, polymer blends.
How to cite: Souza, N. L. G. D., Cavallini, G. S., Alves, T. T., Pereira, M. M., Brandão, H. M., & Oliveira, L. F. C. (2024). Compatibility and cytotoxicity of poly(ε-caprolactone)/polypyrrole-block-poly(ε-caprolactone) blend films in fibroblast bovine cells. Polímeros: Ciencia e Tecnologia, 34(1), e20240007. https://doi.org/10.1590/0104-1428.20230082
1. Introduction
Polymer blends are created by combining two or more polymers to yield a new material with properties distinct from that of the original polymers[1,2]. The fabrication of these blends is a cost-effective method for generating new polymer materials, as it eliminates the need to synthesize new polymers[3]. During the production of a blend, two factors must be considered: miscibility and compatibility. Thermodynamically miscible polymers intermingle at the molecular level, a process that should result in negative Gibbs free energy. The final properties of miscible blends typically represent an average of the properties of the blend components. Conversely, immiscible mixtures form a heterogeneous system, where the properties of the constituent components are retained[4]. The term compatibility, however, has various interpretations in the literature. Some authors describe compatible polymers as those that do not show significant phase separation upon mixing or when the desired physical properties are attained[5]. A definition of compatibility suggested by Coleman and Painter involves
the application of infrared spectroscopy. Accordingly, if two polymers are compatible, the spectrum of the mixture should exhibit changes when contrasted with the spectra of the pure polymers[6] .
Polymeric systems have garnered significant interest in the medical field, finding applications in the development of controlled release systems, mucoadhesive films, bioseparation, vascular prostheses, hemodialysis membranes, urinary catheters, dressings, and orthopedic implants, among others[7,8] However, the biocompatibility of these materials must be evaluated before use. The in-vitro cytotoxicity assay serves as the initial test to determine the biocompatibility of any material intended for biomedical devices[9] .
The literature describes numerous cytotoxicity tests, most of which measure cell death or other detrimental effects on cell function. Consequently, if a material demonstrates inertness in cell culture under these test conditions, its potential for use in biomedical devices is enhanced[10]
https://doi.org/10.1590/0104-1428.20230082 O O O O O O O O O O O O O O O Polímeros, 34(1), e20240007, 2024 ISSN 1678-5169 (Online) 1/9
Souza, N. L. G. D., Cavallini, G. S., Alves, T. T., Pereira, M. M., Brandão, H. M., & Oliveira, L. F. C.
The primary cause of polymer cytotoxicity is the presence of charged functional groups within the polymer structure. These groups can interact with the cell membrane, potentially causing rupture, interfering with the transport of vital materials to the cell, or chelating essential cellular nutrients[11]
Poly(ε-caprolactone) (PCL) is a biodegradable and bioabsorbable polymer that has gained attention due to its low cost. In realistic applications, PCL with a high molecular weight is preferred because it improves the mechanical properties resulting from the entanglement of the polymeric chains[12]. This linear, semi-crystalline synthetic polyester possesses an orthorhombic crystalline structure and can be readily prepared through the catalytic polymerization of the caprolactone monomer. Its hydrophobic nature and high crystallinity ensures that it undergoes hydrolysis at a slow pace[13,14]. Because of these interesting properties this polymer has been used alone and in combination with a range of materials in different types of biomedical applications[15].
Conductive polymers are utilized in neural tissue engineering due to their superior electrical properties[16]. Polypyrrole (PPy), in particular, has garnered significant attention in the medical field. This is attributed to its ease of synthesis, potential for chemical modifications, well-documented in vitro and in vivo biocompatibility, and relatively high conductivity under physiological conditions[17-19]. However, PPy is not biodegradable, which is a desirable property for tissue engineering constructs. This makes it necessary to reduce its content to the lowest possible levels[20,21]. In this context, some polymeric materials using PPy have been reported in literature. Hydrogels containing low concentrations of PPy promoted cell adhesion, growth, and neuronal differentiation of human bone marrow mesenchymal stem cells. Therefore, they may serve as a useful platform to study the effects of electrical and mechanical signals on these cells and to develop multifunctional scaffolds for neural tissue engineering[22]. Collagen/PPy-b-PCL hydrogels containing 0.5, 1.0, and 2.0% PPy-b-PCL were developed and showed good printability and biocompatibility. Thus, they have the potential to be used in the bioprinting of neural tissue constructs, for the repair of damaged neural tissues, and drug testing or precision medicine applications[23].
The aim of this study was to fabricate and characterize films of polymer blends composed of copolymer PPy-b-PCL (biodegradable and conductive polymer) and PCL. The analysis focused on assessing compatibility, supramolecular interactions, and potential cytotoxic effects on bovine fibroblasts.
2. Materials and Methods
2.1 Materials
The PCL (MW = 80,000 g.mol-1), PPy-b-PCL (MW = PPy: 4,000 g.mol-1 and PCL: 2,000 g.mol-1), Dulbecco’s Modified Eagle Medium-F12 (DMEM), fetal bovine serum (FBS) and penicillin-streptomycin antibiotics were procured from Sigma–Aldrich® (St. Louis, MO, USA) and used without further purification. Dichloromethane and ethanol, purchased from Vetec®, was employed as a solvent, also without further purification. The reference controls, high-density
polyethylene (HDPE) and polyurethane, which contained 0.1% zinc diethyldithiocarbamate (ZDEC), were obtained from the Food and Drug Safety Center (Kanagawa, Japan). Phosphate buffered saline (PBS) was purchased from LGC Biotechnology (São Paulo, Brazil).
2.2 Preparation of polymer blends
Polymer blends were prepared using the solvent evaporation technique. In this method, the selected polymers are dissolved in a specific solvent and the solution is stirred for a certain period of time to obtain a homogeneous solution. After the solvent had evaporated, the resulting product was collected[24]. Thus, five distinct solutions (2.0% m/v) of PCL and PPy-b-PCL in dichloromethane were prepared by combining the polymers in weight ratios of 0/100, 1/99, 3/97, 5/95, and 100/0 for PPy-b-PCL and PCL, respectively (Table 1). The mass of PCL was calculated assuming a purity of 100%. However, since PPy-b-PCL is a dispersion with a purity range of 0.3-0.7%, we used a purity value of 0.7% to determine the mass of the solution needed to obtain the required amount of PPy-b-PCL for the polymer blend. These solutions were stirred (120 rpm) for approximately 24 hours before being transferred to Petri dishes to facilitate solvent evaporation at room temperature (26 °C). The blends were subsequently collected as cast films[25,26] .
2.3 Cytotoxicity test
Primary fibroblast cell cultures derived from bovine skin biopsies were acquired from the cell bank of the Laboratory of Animal Reproduction and Biotechnology of Brazilian Agricultural Research Corporation. The cells were cultured at 37 °C, 5% CO2 and 95% humidity, in Dulbecco’s modified Eagle’s medium supplemented with 10% fetal calf serum and 100 units mL-1 penicillin–streptomycin and were cryopreserved at the second passage. Prior to their utilization, fibroblasts were thawed and cultured until the third passage.
The direct contact assay was performed with a monolayer of bovine fibroblasts. Briefly, 4x10⁵ cells/well were seeded uniformly into six-well plates (35 mm diameter) and cultured for 48 h. Subsequently, polymer films (1.0 cm x 1.0 cm) were carefully placed at the center of the wells and incubated for 24 h. Following this, the films were removed, the culture medium was discarded, and the plates were washed with phosphatebuffered saline and stained with a solution of 0.2% crystal violet in ethanol for 20 min. The cytotoxicity of the polymer films was determined by observing the cells by phase contrast and by qualitative means, the zone index value (Table 2). This analysis was performed under an inverted light microscope (ICM 405, Zeiss, Germany) with a camera (Axiocam ERC 5 s, Zeiss, Germany) attached to a computer for the images to be captured.
Table 1. Polymer blend films composition and code.
Polímeros, 34(1), e20240007, 2024 2/9
Films PPy-b-PCL (%) PCL (%) PCL 0.0 100.0 1 PPy-b-PCL/ 99 PCL 1.0 99.0 3 PPy-b-PCL/ 97 PCL 3.0 93.0 5 PPy-b-PCL/ 95 PCL 5.0 95.0 PPy-b-PCL 100.0 0.0
Compatibility and cytotoxicity of poly(ε-caprolactone)/polypyrrole-block-poly(ε-caprolactone) blend films in fibroblast bovine cells
Image capture and the distance between viable cells and films were measured using Zen 2.3 lite software. For positive and negative controls, we used polyurethane containing 0.1% ZDEC (zinc diethyldithiocarbamate) and HDPE (high- density polyethylene), respectively[27]
2.4 Vibrational spectroscopy
Fourier transform infrared (FTIR) spectra were obtained in an ALPHA FT-IR Bruker Spectrometer in the 4000-600 cm-1 region. For the samples, we used the method of attenuated total reflection (ATR), with a resolution of 2 cm-1 and 64 scan accumulations. Raman measurements were performed on a Bruker RFS 100 equipment excited with a Nd+3/YAG laser operating at 1064 nm, equipped with a CCD detector cooled with liquid nitrogen and a spectral resolution of 2 cm-1 .
Grade Description of the reactive Zone Cytotoxicity
0 No zone rises around the sample Without
1 Limited under the sample area Slightly
2 Zone not greater than 2 mm Mildly
3 Zone between 2 and 10 mm Moderately
4 Zone between 10 and 20 mm Severely
An average of 1024 scans were collected with a laser power of 50 mW directed at the sample.
2.5 Micro-Raman imaging
The measurements were performed on Brucker SENTERRA equipment attached to the microscope. The Raman image was acquired by mapping one hundred points of the sample using an optical lens 50 times, laser excitation at 785 nm, average 25 co-additions and 3 seconds of exposure for each point, a laser power of 10mW and spectral resolution of 4 cm-1
2.6 Thermogravimetric analysis
Thermogravimetric analyses (TGA) were performed in a Shimadzu TG-60 instrument under nitrogen atmosphere in a flow of 50.0 mL.min-1, with a heating rate of 10 °C.min-1 , from 25 to 600 °C.
3. Results and Discussions
The infrared and Raman spectra of the polymers are depicted in Figures 1 and 2, respectively, with tentative band assignments presented in Table 3, derived from a comparison with literature data[10,28-35]
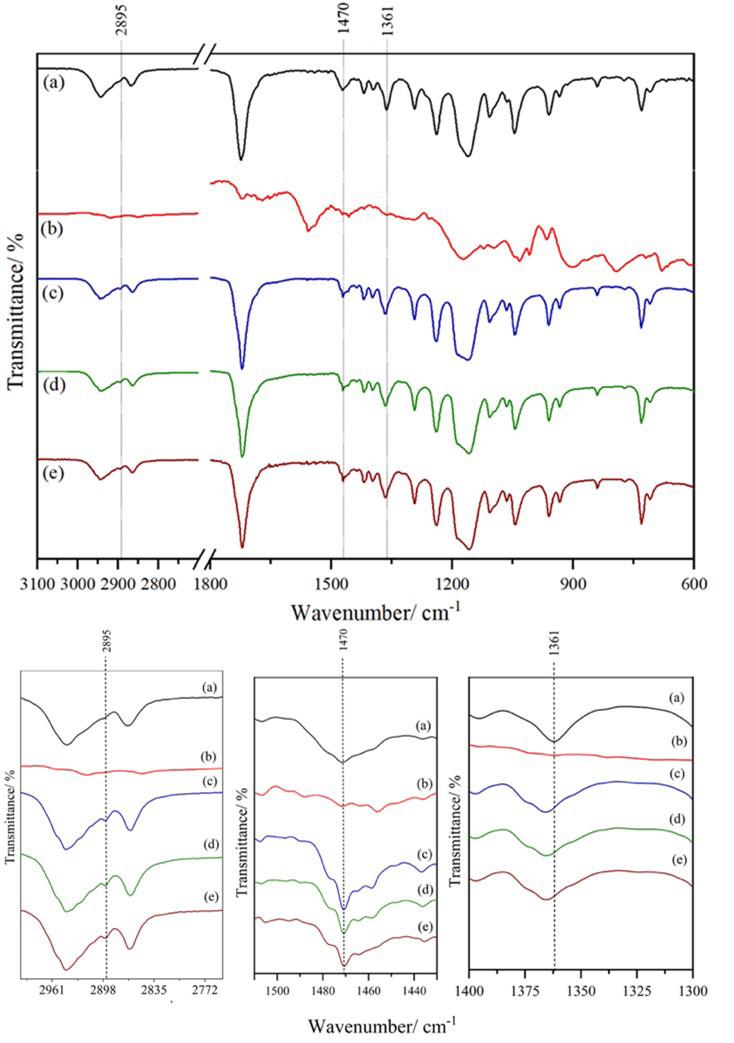
Polímeros, 34(1), e20240007, 2024 3/9
Table 2. Cytotoxicity index by reactivity grades classification.
Figure 1. Infrared absorption spectra of PCL (a) PPy-b-PCL (b), 1 PPy-b-PCL / 99 PCL (c), 3 PPy-b-PCL / 97 PCL (d) and 5 PPy-b-PCL/ 95 PCL (e).
Souza, N. L. G. D., Cavallini, G. S., Alves, T. T., Pereira, M. M., Brandão, H. M., & Oliveira, L. F. C.
In the infrared spectra of polymer blends, the only discernible changes pertain to the bands associated with the C–H bond vibration. A new band at 2895 cm-1 is observable in the polymer blend spectra, along with the narrowing of the band at 1470 cm-1, emergence of shoulders at 1458 and 1463 cm-1, and shift of the band at 1361 cm-1 to 1365 cm-1. The Raman spectrum of the 5 PPy-b-PCL / 95 PCL blend exhibits changes; the bands at 1587, 1237, and 936 cm-1, associated with the polymer PPy-b-PCL, shift to larger wavenumbers, while the bands at 1722, 1441, and 1305 cm-1, associated with the polymer PCL, shift to 1728, 1446, and 1310 cm-1, respectively. Consequently, the vibrational spectroscopy data suggest the existence of two types of intermolecular interactions: hydrogen bonds between the carbonyl of PCL and the amine group of PPy-b-PCL, and CH–π type interaction between the PPy-b-PCL pyrrole ring and the CH2 group of PCL (Figure 3). Studies on blends using PCL and PPy, a material similar to the one in this study, revealed the presence of hydrogen bonds in the polymeric mixtures and the absence of PPy domains in the mixtures due to this interaction. Furthermore, the formation of the polymer blend has led to enhanced physical and chemical properties[36,37]
Heterogeneity often arises in the composition and morphology of polymer blends. In this context, it is believed that the general material properties generally depend to a large extent on the relevant microscopic heterogeneity. Therefore, to better understand the influence of heterogeneity on material properties, it is desirable to obtain sample information with high spatial resolution. Thus, micro-Raman image analysis can be used to study the spatial distribution of molecular species within polymer mixtures[38] Figure 4 shows the micro-Raman image of the polymer blends, focusing on the PPy-b-PCL band at 1588 cm-1. This was chosen because it is a region in which only PPy-b-PCL shows a signal and because this component is present in a smaller proportion. In the Raman image of all the mixtures, 100 points were analysed and in all of them the presence
of bands at 1588 cm-1 was observed, with more or less intensity, represented by blue to pink colouration on the contour map. This fact indicates the presence of PCL-b-PPy at all points of the sample and the non-heterogeneity at a spatial resolution of approximately 1mm[39]. There are no studies in the literature on the morphology of blends formed between PCL and PCL-b-PPy. However, a study of the morphology of PCL/PPy blends (95/5, 90/10 and 85/15) showed that PPy is homogeneously distributed in the host matrix and does not show PPy agglomerates in isolated domains[36] .
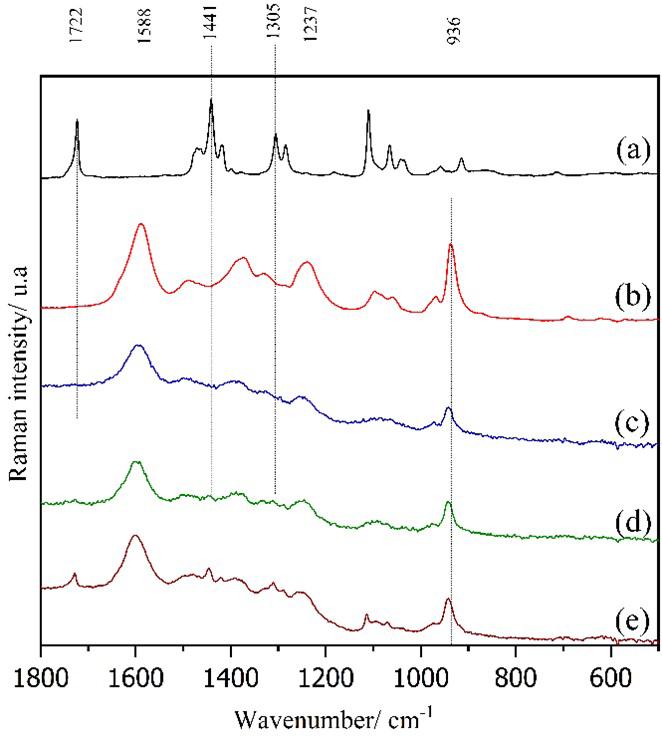
2. Raman spectra excited at 1064 nm of PCL (a), PPy-b-PCL (b), 1 PPy-b-PCL / 99 PCL (c), 3 PPy-b-PCL / 97 PCL (d) and 5 PPy-b-PCL / 95 PCL (e).
Table 3. Main infrared absorption and Raman wavenumber values (in cm-1) of samples.
PPy-b-PCL
FTIR
Raman
PCL
FTIR
2942/2867
Raman
2919/2866
1720 1722 1722
1556 1587
1489/1380
1454/1170
1470/1395/1361
1257 1328 1290
1237
1031
965
790
1238/1107/1045
1467/1441/1417
1305/1284
1110/1039
1237/1097/1058/968 1061
Tentative assignment
ν(CH2)
ν(C=O)
ν(C=C)
δ(CH2)
ν(C-N)
vibration of the pyrrole ring
ω(CΗ)
ν(C-C)
δ(NH)
ν(C-O-C)
δ(CH) 1161
913/957
960/930
ν(C-O)
ν(C-COO)
δ(C-O-C)
936 pyrrole ring deformation
ω(=C-Η)
Polímeros, 34(1), e20240007, 2024 4/9
Figure
Compatibility and cytotoxicity of poly(ε-caprolactone)/polypyrrole-block-poly(ε-caprolactone) blend films in fibroblast bovine cells
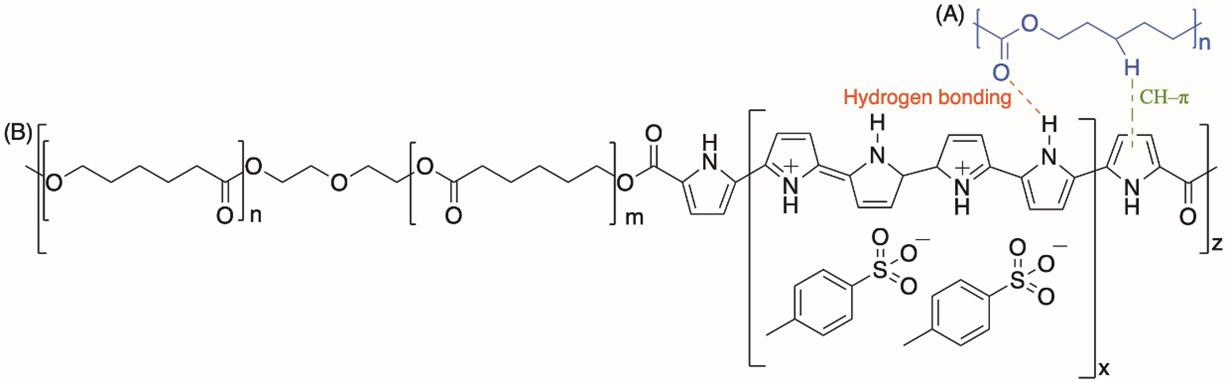
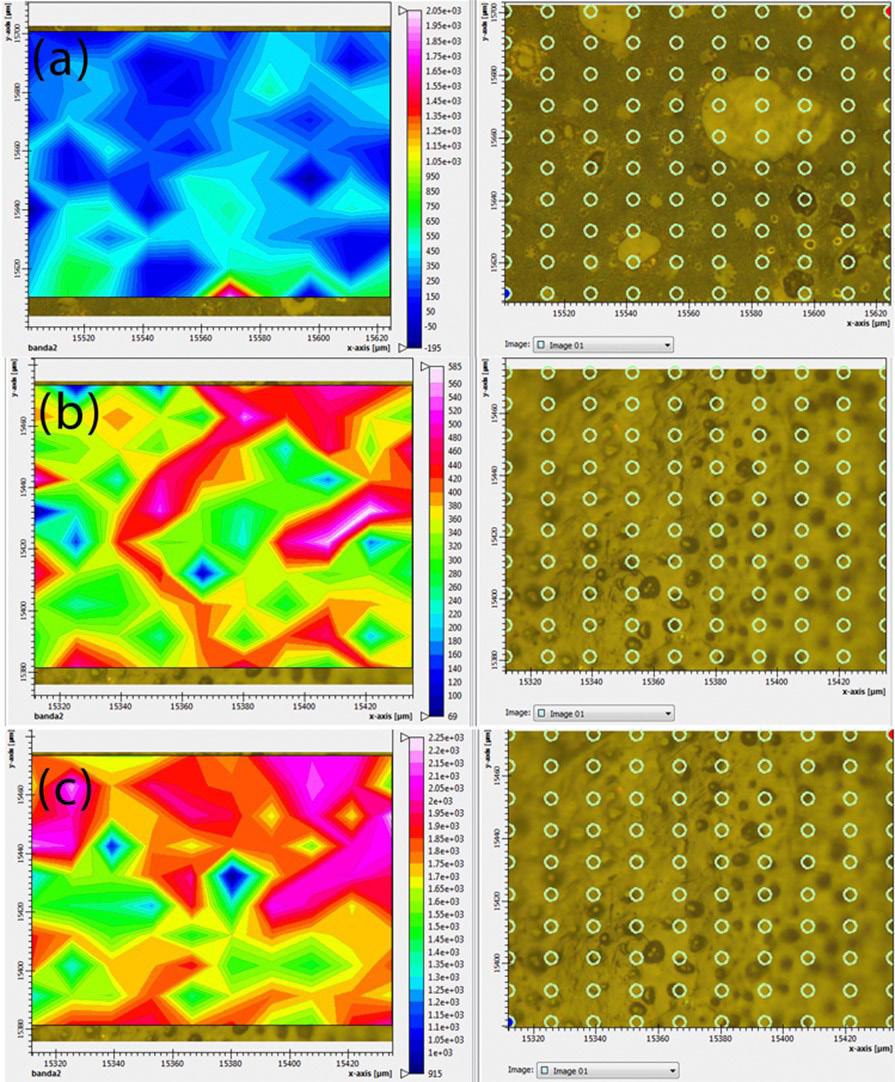
Polímeros, 34(1), e20240007, 2024 5/9
Figure 3. Illustration of CH–π and hydrogen bonding interactions between PCL (A) and PPy-b-PCL (B).
Figure 4. Micro-Raman Imaging of 1 PPy-b-PCL/ 99 PCL (a), 3 PPy-b-PCL/ 97 PCL (b) and 5 PPy-b-PCL/ 95 PCL (c).
Souza, N. L. G. D., Cavallini, G. S., Alves, T. T., Pereira, M. M., Brandão, H.
Figure 5 depicts the TGA (Thermogravimetric analysis) and DTG (derivative thermogravimetry) curves, respectively, for PCL, PPy-b-PCL, and their blends, with corresponding thermal data provided in Table 4. The TGA curve for PCL exhibits a single decomposition step characteristic of this compound, related to random fission of the polymeric chain and subsequent formation of CO2, H2O, 5-hexenoic acid, and caprolactone[40]. However, while PCL fully degrades at 550 °C, PPy-b-PCL experiences a 45% mass loss at the same temperature. The thermal data analysis for the polymer blends reveals their distinct behavior compared to that of the pure polymers. The Tonset temperature for all blends is very close to that of the polymer with the higher Tonset (PCL), which can be explained by the low concentration of PPy-b-PCL in the polymer films. In terms of DTG curve analysis, the Tdmax1 temperature (maximum degradation rate temperature) for the polymer blends exceeds that of the PCL polymer. This increase in the maximum degradation temperature values may be related to the compatibility of
M., & Oliveira, L. F. C.
these two polymers and the presence of intermolecular interactions between them[41-43]
Optical micrographs (Figure 6) demonstrate that the polymer films produced do not cause any morphological changes in the shape of the fibroblasts, which would indicate signs of cytotoxicity, in accordance with the morphological criteria established in the literature[44,45] .
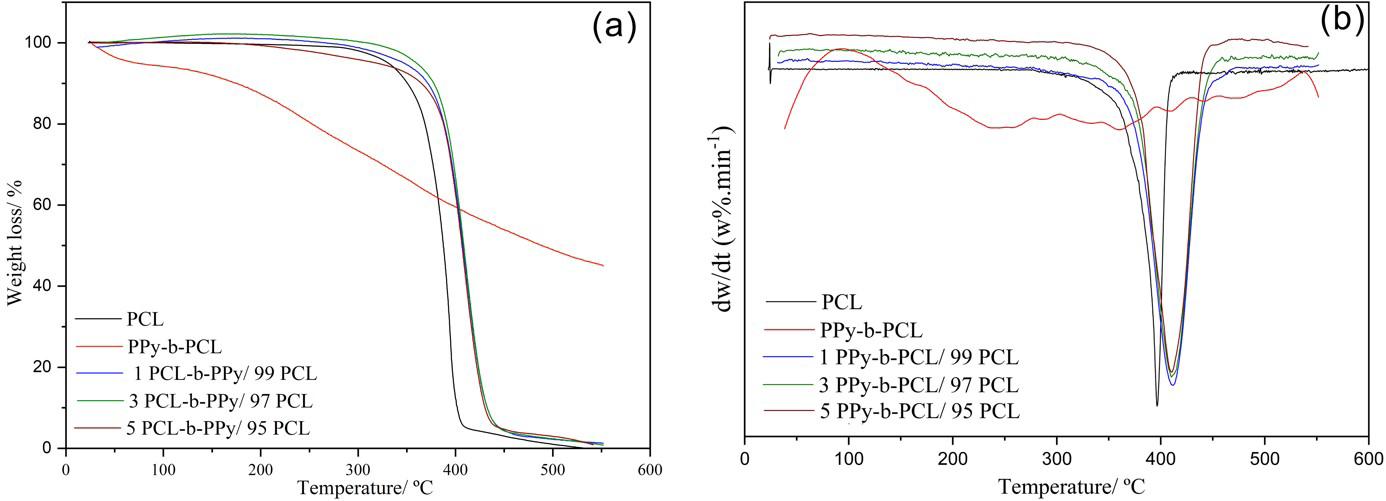
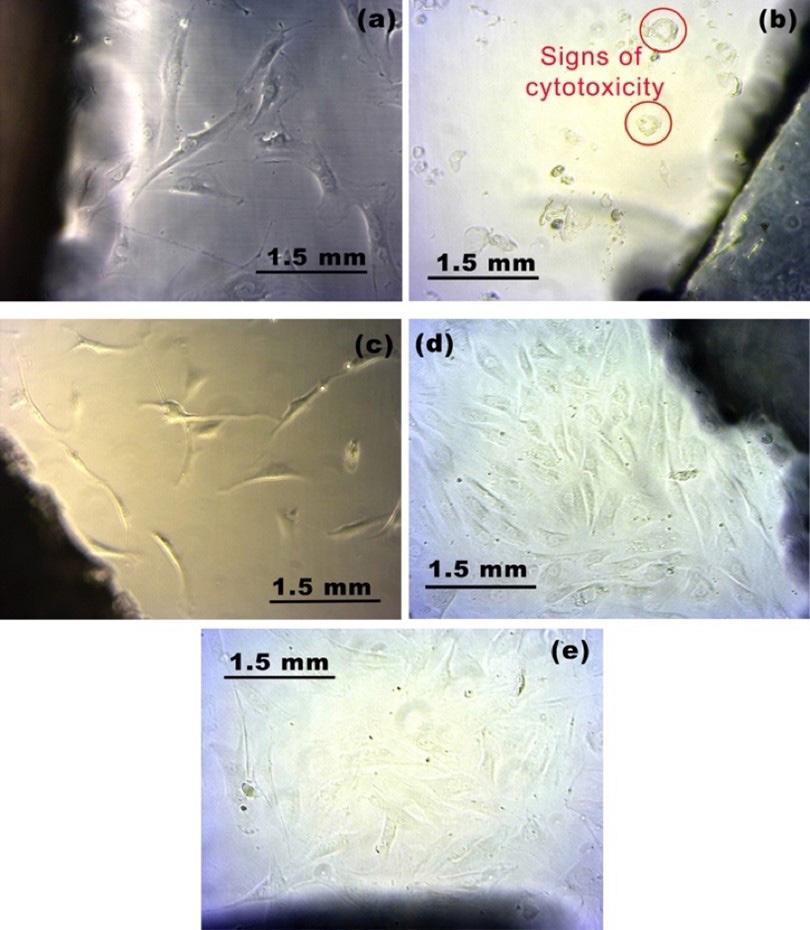
Polímeros, 34(1), e20240007, 2024 6/9
Figure 5. TGA (a) and DTG (b) curves of the samples.
Figure 6. Inverted optical microscope images of negative control (a), positive control (b), 1 PPy-b-PCL/ 99 PCL (c), 3 PPy-b-PCL/ 97 PCL (d) and 5 PPy-b-PCL/ 95 PCL (e).
TGA DTG T onset (°C) Tdmax1 (°C) PCL 386 396 1
383 408
386 413 5 PPy-b-PCL
95 PCL 382 409 PPy-b-PCL 207 238
Table 4. Thermal data of the samples.
Samples
PPy-b-PCL/ 99 PCL
3 PPy-b-PCL/ 97 PCL
/
Compatibility and cytotoxicity of poly(ε-caprolactone)/polypyrrole-block-poly(ε-caprolactone) blend films in fibroblast bovine cells
Table 5. Results of the average distance between the cells and the polymer film.
Sample Results
1 PPy-b-PCL/ 99 PCL Without cytotoxicity
3 PPy-b-PCL/ 97 PCL Without cytotoxicity
5 PPy-b-PCL/ 95 PCL Without cytotoxicityity
Similar to the negative control, the cells proliferated adequately in the wells. Conversely, cells cultured with the standard toxic polymer (positive control) exhibited a spherical shape and detached from the culture dish surface. The micrograph images enabled the measurement of the distance between viable cells and the polymer films. These results were compared with reference values (Table 1) to ascertain the toxicity levels of the samples (Table 5), which demonstrated no toxic effects on cells. PLC is described as a non-toxic polymer in the literature[10] and PPy exhibits low toxicity[46]. Therefore, the results suggest that the addition of PPy-b-PCL to PCL does not alter its cytotoxicity. This finding aligns with other studies in the literature, indicating that the addition of PPy does not modify the cytotoxicity of the material[23,47]
4. Conclusions
In this research, the compatibility of PPy-b-PCL / PCL blends was investigated using FTIR and Raman spectroscopy, micro-Raman imaging, and TGA analysis. The results from these methods indicated that PCL and PPy-b-PCL form compatible blends. Spectroscopic analysis revealed that this compatibility arises from specific interactions between the carboxylic group of PCL and the amine group of PPy-b-PCL , as well as between the pyrrole ring of PPy-b-PCL and the CH2 group of PCL. Micro-Raman imaging demonstrated homogeneity in the surface morphology of the polymer blends. Additionally, TGA analysis indicated that the formation of these polymer blends enhances the thermal stability of the material. Importantly, the results showed that the addition of PPy-b-PCL does not affect cytotoxicity to bovine fibroblasts, suggesting their biocompatibility and potential use in cattle veterinary devices.
5. Author’s Contribution
• Conceptualization – Nelson Luis Gonçalves Dias de Souza; Humberto de Mello Brandão; Luiz Fernando Cappa de Oliveira.
• Data curation – Nelson Luis Gonçalves Dias de Souza.
• Formal analysis – Nelson Luis Gonçalves Dias de Souza; Humberto de Mello Brandão; Luiz Fernando Cappa de Oliveira.
• Funding acquisition – Luiz Fernando Cappa de Oliveira.
• Investigation – Nelson Luis Gonçalves Dias de Souza; Michele Munk Pereira.
• Methodology – Nelson Luis Gonçalves Dias de Souza; Michele Munk Pereira; Humberto de Mello Brandão; Luiz Fernando Cappa de Oliveira.
• Project administration – Luiz Fernando Cappa de Oliveira.
• Resources – Humberto de Mello Brandão; Luiz Fernando Cappa de Oliveira.
• Software – NA.
• Supervision – Humberto de Mello Brandão; Luiz Fernando Cappa de Oliveira.
• Validation – NA.
• Visualization – Nelson Luis Gonçalves Dias de Souza; Grasiele Soares Cavallini; Tiago Teixeira Alves.
• Writing – original draft – Nelson Luis Gonçalves Dias de Souza; Grasiele Soares Cavallini; Tiago Teixeira Alves.
• Writing – review & editing – Nelson Luis Gonçalves Dias de Souza; Grasiele Soares Cavallini; Tiago Teixeira Alves; Michele Munk Pereira; Humberto de Mello Brandão; Luiz Fernando Cappa de Oliveira.
6. Acknowledgements
The authors wish to thank the Brazilian Agencies National Counsel of Technological and Scientific Development (CNPq), Coordination of Superior Level Staff Improvement (CAPES), Pro-Rectory of Research and Graduate Graduation (Federal University of Tocantins – UFT), Federal University of Juiz de Fora, Tocantins Research Support Foundation (FAPT) and Foundation for Research Support of the State of Minas Gerais (FAPEMIG).
7. References
1 Souza, N. L. G. D., Brandão, H. M., & Oliveira, L. F. C. (2014). Chitosan and poly(methyl methacrylate-co-butyl methacrylate) bioblends: a compatibility study. Polymer-Plastics Technology and Engineering, 53(4), 319-326 http://dx.doi.org/10.1080/0 3602559.2013.844240
2 Dasan, K. P., & Rekha, C. (2012). Polymer blend microspheres for controlled drug release: the techniques for preparation and characterization: a review article. Current Drug Delivery, 9(6), 588-595. http://dx.doi.org/10.2174/156720112803529783. PMid:22780912.
3 Reddy, K. S., Prabhakar, M. N., Babu, P. K., Venkatesulu, G., Rao, U. S. K., Rao, K. C., & Subha, M. C. S. (2012). Miscibility studies of hydroxypropyl cellulose/poly(ethylene glycol) in dilute solutions and solid state. International Journal of Carbohydrate Chemistry , 2012, 906389 http://dx.doi. org/10.1155/2012/906389
4 Aid, S., Eddhahak, A., Ortega, Z., Froelich, D., & Tcharkhtchi, A. (2017). Experimental study of the miscibility of ABS/ PC polymer blends and investigation of the processing effect. Journal of Applied Polymer Science, 134(25), 44975 http://dx.doi.org/10.1002/app.44975
5 Arribada, R. G., Behar-Cohen, F., Barros, A. L. B., & SilvaCunha, A. (2022). The use of polymer blends in the treatment of ocular diseases. Pharmaceutics, 14(7), 1431 http://dx.doi. org/10.3390/pharmaceutics14071431 PMid:35890326.
Polímeros, 34(1), e20240007, 2024 7/9
Souza, N. L. G. D., Cavallini, G. S., Alves, T. T., Pereira, M. M., Brandão, H. M., & Oliveira, L. F. C.
6 Robeson, L. (2014). Historical perspective of advances in the science and technology of polymer blends. Polymers, 6(5), 1251-1265 http://dx.doi.org/10.3390/polym6051251
7 Maitz, M. F. (2015). Applications of synthetic polymers in clinical medicine. Biosurface and Biotribology, 1(3), 161-176. http://dx.doi.org/10.1016/j.bsbt.2015.08.002
8 Tekade, R. K. (Ed.). (2019). Basic fundamentals of drug delivery London: Academic Press
9 Li, W., Zhou, J., & Xu, Y. (2015). Study of the in vitro cytotoxicity testing of medical devices. Biomedical Reports, 3(5), 617-620 http://dx.doi.org/10.3892/br.2015.481 PMid:26405534.
10. Souza, N. L. G. D., Munk, M., Brandão, H. M., & Oliveira, L. F. C. (2017). Cytotoxicity and compatibility of polymeric blend: evaluation of the cytotoxicity in fibroblast bovine cells and compatibility of Poly(ɛ-Caprolactone)/Poly(Methyl Methacrylate-co-Butyl Methacrylate) blend films. Polymer-Plastics Technology and Engineering, 56(10), 1076-1083 http://dx.doi. org/10.1080/03602559.2016.1253735
11 Pereira, M. M., Raposo, N. R. B., Brayner, R., Teixeira, E. M., Oliveira, V., Quintão, C. C. R., Camargo, L. S. A., Mattoso, L. H. C., & Brandão, H. M. (2013). Cytotoxicity and expression of genes involved in the cellular stress response and apoptosis in mammalian fibroblast exposed to cotton cellulose nanofibers. Nanotechnology, 24(7), 075103. http:// dx.doi.org/10.1088/0957-4484/24/7/075103 PMid:23358497.
12 Liu, Z.-H., Li, Y., Zhang, C.-J., Zhang, Y.-Y., Cao, X.-H., & Zhang, X.-H. (2020). Synthesis of high-molecular-weight poly(ε-caprolactone) via heterogeneous zinc-cobalt(III) double metal cyanide complex. Giant, 3, 100030 http://dx.doi. org/10.1016/j.giant.2020.100030
13 Arcana, I. M., Bundjali, B., Yudistira, I., Jariah, B., & Sukria, L. (2007). Study on properties of polymer blends from polypropylene with polycaprolactone and their biodegradability. Polymer Journal, 39(12), 1337-1344 http://dx.doi.org/10.1295/ polymj.PJ2006250
14 Martin, D. P., & Williams, S. F. (2003). Medical applications of poly-4-hydroxybutyrate: a strong flexible absorbable biomaterial. Biochemical Engineering Journal, 16(2), 97-105 http://dx.doi.org/10.1016/S1369-703X(03)00040-8
15 Malikmammadov, E., Tanir, T. E., Kiziltay, A., Hasirci, V., & Hasirci, N. (2018). PCL and PCL-based materials in biomedical applications. Journal of Biomaterials Science. Polymer Edition, 29(7-9), 863-893 http://dx.doi.org/10.1080/09205063.2017. 1394711 PMid:29053081.
16 Talebi, A., Labbaf, S., & Karimzadeh, F. (2020). Polycaprolactonechitosan-polypyrrole conductive biocomposite nanofibrous scaffold for biomedical applications. Polymer Composites, 41(2), 645-652 http://dx.doi.org/10.1002/pc.25395
17 Zhang, Z., Roy, R., Dugré, F. J., Tessier, D., & Dao, L. H. (2001). In vitro biocompatibility study of electrically conductive polypyrrole-coated polyester fabrics. Journal of Biomedical Materials Research, 57(1), 63-71 http://dx.doi.org/10.1002/10974636(200110)57:1<63::AID-JBM1142>3.0.CO;2-L PMid:11416850.
18 Ramanaviciene, A., Kausaite, A., Tautkus, S., & Ramanavicius, A. (2007). Biocompatibility of polypyrrole particles: an in-vivo study in mice. The Journal of Pharmacy and Pharmacology, 59(2), 311-315 http://dx.doi.org/10.1211/jpp.59.2.0017 PMid:17270084.
19. Hardy, J. G., Lee, J. Y., & Schmidt, C. E. (2013). Biomimetic conducting polymer-based tissue scaffolds. Current Opinion in Biotechnology, 24(5), 847-854 http://dx.doi.org/10.1016/j. copbio.2013.03.011 PMid:23578463.
20 Razavi, M. (2017). Biomaterials for tissue engineering London: Bentham Science Publishers
21 Rocha, M. F. B., Aguiar, M. F., Vinhas, G. M., Melo, C. P., Morelli, C. L., & Alves, K. G. B. (2023). Preparation and characterization of PLA/polypyrrole blends with antibacterial properties. Materials Research, 26(Suppl. 1), e20230045 http://dx.doi.org/10.1590/1980-5373-mr-2023-0045
22 Yang, S., Jang, L., Kim, S., Yang, J., Yang, K., Cho, S.-W., & Lee, J. Y. (2016). Polypyrrole/alginate hybrid hydrogels: electrically conductive and soft biomaterials for human mesenchymal stem cell culture and potential neural tissue engineering applications. Macromolecular Bioscience, 16(11), 1653-1661 http://dx.doi. org/10.1002/mabi.201600148 PMid:27455895.
23. Vijayavenkataraman, S., Vialli, N., Fuh, J. Y. H., & Lu, W. F. (2019). Conductive collagen/polypyrrole-b-polycaprolactone hydrogel for bioprinting of neural tissue constructs. International Journal of Bioprinting, 5(1), 229 http://dx.doi.org/10.18063/ ijb.v5i2.1.229
24 Zhu, G., Wang, F., Xu, K., Gao, Q., & Liu, Y. (2013). Study on properties of poly(vinyl alcohol)/polyacrylonitrile blend film. Polímeros, 23(2), 146-151 http://dx.doi.org/10.4322/ polimeros.2013.076
25 Rojanapitayakorn, P., Thongyai, S., Higgins, J. S., & Clarke, N. (2001). Effects of sample preparation method on mixing and phase separation in binary polymer blends. Polymer, 42(8), 3475-3487 http://dx.doi.org/10.1016/S0032-3861(00)00783-7
26 Leite, A. M. D., Araújo, E. M., Lira, H. L., Barbosa, R., & Ito, E. N. (2009). Obtenção de membranas microporosas a partir de manocompósitos de poliamida 6/argila nacional. Parte 1: influência da presença da argila na morfologia das membranas. Polímeros, 19(4), 271-277 http://dx.doi.org/10.1590/S010414282009000400005
27. Souza, N. L. G. D., Munk, M., Brandão, H. M., & Oliveira, L. F. C. (2018). Functionalization of poly(epichlorohydrin) using sodium hydrogen squarate: cytotoxicity and compatibility in blends with chitosan. Polymer Bulletin, 75(10), 4627-4639 http://dx.doi.org/10.1007/s00289-018-2290-5
28 Arjomandi, J., Shah, A.-U.-H. A., Bilal, S., Van Hoang, H., & Holze, R. (2011). In situ Raman and UV-vis spectroscopic studies of polypyrrole and poly(pyrrole-2,6-dimethyl-βcyclodextrin). Spectrochimica Acta. Part A: Molecular and Biomolecular Spectroscopy, 78(1), 1-6 http://dx.doi. org/10.1016/j.saa.2009.12.026 PMid:21111671.
29 Ourari, A., Aggoun, D., & Ouahab, L. (2014). Poly(pyrrole) films efficiently electrodeposited using new monomers derived from 3-bromopropyl-N-pyrrol and dihydroxyacetophenone: electrocatalytic reduction ability towards bromocyclopentane. Colloids and Surfaces. A, Physicochemical and Engineering Aspects, 446, 190-198 http://dx.doi.org/10.1016/j.colsurfa.2014.01.047
30 Misra, R. M., Agarwal, R., Tandon, P., & Gupta, V. D. (2004). Phonon dispersion and heat capacity in poly(ε-caprolactone). European Polymer Journal, 40(8), 1787-1798 http://dx.doi. org/10.1016/j.eurpolymj.2004.04.022
31. Hou, Y., Zhang, L., Chen, L. Y., Liu, P., Hirata, A., & Chen, M. W. (2014). Raman characterization of pseudocapacitive behavior of polypyrrole on nanoporous gold. Physical Chemistry Chemical Physics, 16(8), 3523-3528. http://dx.doi.org/10.1039/ c3cp54497d PMid:24441648.
32 Nartker, S., Hassan, M., & Stogsdill, M. (2015). Electrospun cellulose nitrate and polycaprolactone blended nanofibers. Materials Research Express, 2(3), 035401 http://dx.doi. org/10.1088/2053-1591/2/3/035401
33 Abdelrazek, E. M., Hezma, A. M., El-khodary, A., & Elzayat, A. M. (2016). Spectroscopic studies and thermal properties of PCL/PMMA biopolymer blend. Egyptian Journal of Basic and Applied Sciences, 3(1), 10-15 http://dx.doi.org/10.1016/j. ejbas.2015.06.001
Polímeros,
8/9
34(1), e20240007, 2024
Compatibility and cytotoxicity of poly(ε-caprolactone)/polypyrrole-block-poly(ε-caprolactone) blend films in fibroblast bovine cells
34 Kołodziej, A., Długoń, E., Świętek, M., Ziąbka, M., Dawiec, E., Gubernat, M., Michalec, M., & Wesełucha-Birczyńska, A. (2021). A Raman spectroscopic analysis of polymer membranes with graphene oxide and reduced graphene oxide. Journal of Composites Science, 5(1), 20 http://dx.doi.org/10.3390/ jcs5010020
35 Phillipson, K., Hay, J. N., & Jenkins, M. J. (2014). Thermal analysis FTIR spectroscopy of poly(ε-caprolactone). Thermochimica Acta, 595, 74-82 http://dx.doi.org/10.1016/j.tca.2014.08.027
36 Ángeles Corres, M., Mugica, A., Carrasco, P. M., & Milagros Cortázar, M. (2006). Effect of crystallization on morphologyconductivity relationship in polypyrrole/poly(ɛ-caprolactone) blends. Polymer, 47(19), 6759-6764 http://dx.doi.org/10.1016/j. polymer.2006.07.042.
37 Basavaraja, C., Kim, W. J., Kim, D. G., & Huh, D. S. (2011). Synthesis and characterization of soluble polypyrrole–poly(ɛcaprolactone) polymer blends with improved electrical conductivities. Materials Chemistry and Physics, 129(3), 787793 http://dx.doi.org/10.1016/j.matchemphys.2011.05.057
38 Mitsutake, H., Poppi, R. J., & Breitkreitz, M. C. (2019). Raman imaging spectroscopy: history, fundamentals and current scenario of the technique. Journal of the Brazilian Chemical Society, 30(11), 2243-2258 http://dx.doi.org/10.21577/01035053.20190116
39. Shirahase, T., Komatsu, Y., Tominaga, Y., Asai, S., & Sumita, M. (2006). Miscibility and hydrolytic degradation in alkaline solution of poly(l-lactide) and poly(methyl methacrylate) blends. Polymer, 47(13), 4839-4844. http://dx.doi.org/10.1016/j. polymer.2006.04.012
40 Sivalingam, G., & Madras, G. (2003). Thermal degradation of poly (ε-caprolactone). Polymer Degradation & Stability, 80(1), 11-16 http://dx.doi.org/10.1016/S0141-3910(02)00376-2
41 Choo, K., Ching, Y. C., Chuah, C. H., Julai, S., & Liou, N.-S. (2016). Preparation and characterization of polyvinyl alcoholchitosan composite films reinforced with cellulose nanofiber. Materials, 9(8), 644 http://dx.doi.org/10.3390/ma9080644 PMid:28773763.
42 Marangoni Júnior, L., Rodrigues, P. R., Silva, R. G., Vieira, R. P., & Alves, R. M. V. (2021). Sustainable packaging films composed of sodium alginate and hydrolyzed collagen: preparation and characterization. Food and Bioprocess Technology, 14(12), 2336-2346. http://dx.doi.org/10.1007/ s11947-021-02727-7
43 Zhang, M., Ding, C., Chen, L., & Huang, L. (2013). The preparation of cellulose/collagen composite films using 1-ethyl3-methylimidazolium acetate as a solvent. BioResources, 9(1), 756-771 http://dx.doi.org/10.15376/biores.9.1.756-771
44 Yang, M. Y., & Rajamahendran, R. (2000). Morphological and biochemical identification of apoptosis in small, medium, and large bovine follicles and the effects of follicle-stimulating hormone and insulin-like growth factor-I on spontaneous apoptosis in cultured bovine granulosa cells. Biology of Reproduction, 62(5), 1209-1217. http://dx.doi.org/10.1095/ biolreprod62.5.1209 PMid:10775168.
45 Rello, S., Stockert, J. C., Moreno, V., Gámez, A., Pacheco, M., Juarranz, A., Cañete, M., & Villanueva, A. (2005). Morphological criteria to distinguish cell death induced by apoptotic and necrotic treatments. Apoptosis, 10(1), 201-208. http://dx.doi. org/10.1007/s10495-005-6075-6 PMid:15711936.
46 Manzari-Tavakoli, A., Tarasi, R., Sedghi, R., Moghimi, A., & Niknejad, H. (2020). Fabrication of nanochitosan incorporated polypyrrole/alginate conducting scaffold for neural tissue engineering. Scientific Reports, 10(1), 22012 http://dx.doi. org/10.1038/s41598-020-78650-2 PMid:33328579.
47 Ferreira, C. L., Valente, C. A., Zanini, M. L., Sgarioni, B., Tondo, P. H. F., Chagastelles, P. C., Braga, J., Campos, M. M., Malmonge, J. A., & Basso, N. R. S. (2019). Biocompatible PCL/PLGA/polypyrrole composites for regenerating nerves. Macromolecular Symposia, 383(1), 1800028. http://dx.doi. org/10.1002/masy.201800028
Received: Aug. 29, 2023
Revised: Jan. 25, 2024
Accepted: Jan. 30, 2024
Polímeros, 34(1), e20240007, 2024 9/9
Polysaccharide from Cumaru (Amburana cearensis) exudate and its potential for biotechnological applications
José Regilmar Teixeira da Silva1 , Iranildo Costa Araújo1 , Eziel Cardoso da Silva1 , Moisés das Virgens Santana1 , Geanderson Emilio de Almeida1 , Emanuel Airton de Oliveira Farias1,2 , Laís Ramos Monteiro de Lima3 , Regina Célia Monteiro de Paula3 , Durcilene Alves da Silva2 , Alyne Rodrigues Araújo2 and Carla Eiras1*
1Laboratório de Pesquisa e Desenvolvimento de Novos Materiais e Sistemas Sensores – MATSENS, Universidade Federal do Piauí – UFPI, Teresina, PI, Brasil
2Núcleo de Pesquisa em Biodiversidade e Biotecnologia – BIOTEC, Universidade Federal do Delta do Parnaíba –UFDPar, Parnaíba, PI, Brasil
3Departamento de Química Orgânica e Inorgânica, Universidade Federal do Ceará – UFC, Fortaleza, CE, Brasil *carla.eiras.ufpi@gmail.com
Obstract
Amburana cearensis tree is used in various applications, from artisanal to pharmaceutical use. However, the gum extracted from its exudate has not yet been investigated. This study aimed to the physicochemical and structural characterization of Amburana cearensis Gum (AcG) by elemental, rheological, and thermal analyses, X-ray diffraction (XRD), highPerformance Liquid Chromatography (HPLC), Gel Permeation Chromatography (GPC), Infrared Spectroscopy (FTIR), UV-Vis spectroscopy and nuclear magnetic resonance (NMR). Additionally, a hemolytic assay was performed to evaluate the biocompatibility of AcG using human erythrocytes. The results showed that AcG consists of β-D-Galactopyranose monomers linked by glycosidic bonds (1→3). At the same time, the side chains exhibit β-Galactopyranose (1→6) and α-L-Arabinofuranoside (1→3,6) monomers as non-reducing terminals, whose biocompatibility was excellent in the model used. AcG was described for the first time as a biopolymer that could have broad applications in the pharmaceutical and cosmetic industries, justifying the interest in further studies about AcG applications.
Keywords: gum of tree exudate, biopolymer, arabinogalactan, hemolytic activity.
How to cite: Silva, J. R. T., Araújo, I. C., Silva, E. C., Santana, M. V., Almeida, G. E., Farias, E. A. O., Lima, L. R. M., Paula, R. C. M., Silva, D. A., Araújo A. R., & Eiras, C. (2024). Polysaccharide from Cumaru (Amburana cearensis) exudate and its potential for biotechnological applications. Polímeros: Ciência e Tecnologia, 34(1), e20240008. https://doi.org/ 10.1590/0104-1428.20230025
1. Introduction
The exudation process is an adaptive strategy of higher plant species in response to environmental stresses or specific interactions with other organisms. The exudates of these plants are produced by specialized epithelial cells[1]. In general, exudates are chemically made up of substances of low molar mass (flavonoids and alkaloids), sugars, organic acids, proteins, inorganic salts, and lignins. Therefore, plant exudates can produce biopolymers called natural gums after isolation and purification procedures[2]
Polysaccharides from exudates have been widely studied because of their availability from renewable sources, low cost, biodegradability, and application versatility. Arabic gum ( Acacia senegal ) is traditionally used in both the food industry [3] and industrial sectors [4] Cashew gum ( Anacardium occidentale ) is a good substitute for Arabic gum in various applications, such as emulsifiers [5]. In addition, the use of this gum in more sophisticated applications, such as encapsulation matrix for extracts[6] and essential oils[7]. Besides, cashew
gum has been applied in biotechnology, such as, as a composite with larvicidal activity or a reducing agent in the green synthesis of nanoparticles with antimicrobial activity [8]. From this perspective, investigating new polysaccharides is necessary because physicochemical, structural, and rheological properties may vary according to the production source[9,10] .
Amburana cearensis AC Smith, belonging to the Fabaceae family, is popularly known as amburana-de-cheiro, cherry tree, and cumaru. Its natural presence occurs in several states in Brazil, specifically in the Northeast, Southeast, and Center-West. Furthermore, this species is also found in other South American countries, such as Argentina, Paraguay, and Bolivia[11]. This tree, up to 15 meters tall, has large black seeds, white flowers, and a reddish-brown bark with thin layers that come off during drought, emitting a characteristic coumarin aroma[12]
In addition to its wide geographic distribution, A. cearensis stands out economically due to the versatility of its components.
https://doi.org/10.1590/0104-1428.20230025 O O O O O O O O O O O O O O O Polímeros, 34(1), e20240008, 2024 ISSN 1678-5169 (Online) 1/8
Silva, J. R. T., Araújo, I. C., Silva, E. C., Santana, M. V., Almeida, G. E., Farias, E. A. O., Lima, L. R. M., Paula, R. C. M., Silva, D. A., Araújo A. R., & Eiras, C.
The wood is widely used in carpentry and manufacturing barrels to store cachaça[13]. Its seeds are marketed as flavorings, and the seed extract or leaf powder offers a natural option as an insect repellent[14]. In folk medicine, cooking the bark of the trunk is used to produce homemade syrups, known as lickers, used to treat respiratory diseases[12]
Beyond traditional uses, the study of A. cearensis led to the discovery and characterization of new molecules, such as coumarin, amburosin A, and amburosin B, which have inhibitory activity against the malaria parasite[15] and other effects against Leishmaniasis[16]. Some constituents found in the exudate extracted from the trunk of A. cearensis were also identified. The new compound called 3’,4’-dimethoxy1’-(7-methoxy-4-oxo-4H-chromen-3-yl) benzo-2’,5’-quinone was isolated from ethanolic fractions of its exudate[17]. Other constituents, such as Dilmin and Lulin, were isolated from its exudate[18]
Despite all the applications already proposed for A. cearensis tree, its gum has been little studied. Recently, the possibility of using A. cearensis gum in the development of biodegradable food packaging was demonstrated[19,20] , but studies on the properties of this gum are still scarce. Thus, aiming to determine the properties of this polysaccharide, this study aims to characterize the gum isolated from the exudate of Amburana cearensis (AcG), covering its physicochemical properties, chemical structure, and biocompatibility.
2. Materials and Methods
2.1 Gum extraction and purification
Amburana cearensis exudate was collected from native tree material between July and September 2019, and its species are located in Cocal da Estação-PI (Brazil), coordinates 03”28’33.00° S and 41”33’28.00° W . After collection, the material was sun-dried for two weeks until total solidification of the resin was observed, using the methodology adapted from the work of Paula et al.[9]. Initially, the solidified exudate was crushed to facilitate its solubilization in distilled water (at 5% w/v). The mixture was kept under constant stirring at room temperature (25 °C) for 2 h. Ultimately, this mixture was filtered through filter paper with a porosity of 14 μm and a glass funnel. The pH filtrate was adjusted to a neutral value with 0.05 mol/L NaOH. Then, sodium chloride at 20% w/w was added under stirring for 30 min. The polysaccharide was precipitated with ethanol 99.8% (Dynamic, Brazil) at the ratio 3:1 (v/v) ethanol: exudate solution.
The system was centrifugated at 5000 rpm for 5 min. The supernatant was discarded while the residue obtained was washed with ethanol and acetone (Dynamic, Brazil) and dried at 100 °C for 3h. Subsequently, the isolated gum (AcGIs) was crushed again and subjected to two purification steps similar to the primary extraction process, except that in the second purification, sodium chloride was not added to the system, as described in the literature[1,2,9]
The products obtained were called (AcGP1), i.e., Amburana cearensis gum purified once, and (AcGP2), i.e., Amburana cearensis gum purified after two purification steps or twice, called bipurified here. The moisture content
was determined from exudate to bipurified gum. For the other analyses, only the gum of the bipurified Amburana (AcGP2) was used because it presented a higher degree of purity of the polysaccharide studied. Then the polysaccharide was named only Amburana cearensis gum (AcG). All AcG base solutions or other solutes were prepared with distilled water.
2.2 Moisture content and ash
The moisture content was determined by mass difference (in triplicate). For each material obtained from the exudate, AcGIs (isolated), AcGP1(purified), and AcGP2 (bipurified)—1.0 g were heated at 105 °C for 5 h. Afterward, each mass was measured again, and the mass difference was considered as the mass of water removed from each sample. The moisture content was determined according to Bashir and Haripriya[21], Equation 1. %
where moisture content (MC) is expressed as a percentage of water mass per polysaccharide mass of exudate, AcGIs, AcGP1, and AcGP2; MH is the mass of the hydrated material, and Md is the mass of the dry material.
The mass difference for AcG also obtained the ash content (AS). A mass of 1.0 g of AcG was placed into a well of known mass, weighed, and calcined. A heating rate of 10 °C/min was applied up to 600 °C and maintained at that temperature for 2h. After the calcination period, the system was slowly cooled to room temperature, and the ash mass obtained was weighed. This experiment was carried out in triplicate, and the moisture content was used to determine the mass value of the dry gum. The ash content was expressed as the percentage of ash weight per mass of dehydrated gum, as calculated by Bashir and Haripriya[21] in Equation 2.
where AS is expressed as the percentage of ash mass per mass of AcG, Am is the mass of the ash, and Gm is the gum mass without moisture.
2.3 Polysaccharide composition
2.3.1 Hydrolysis of polysaccharide and determination of monomers
AcG was hydrolyzed using trifluoroacetic acid (TFA) to determine monosaccharides. A volume of 1.0 mL of water was added to 10 mg of the material and maintained under stirring for 24 h in a capped tube. Afterward, 1.0 mL of 4.0 mol/L TFA was added, and the system was sustained in a thermal bath at 100 °C for 3.5 h. Subsequently, the tubes were uncovered for the evaporation of the acid. Then, methanol was added, and the system was dried in a rotary evaporator three times.
After drying, the sample was dissolved in water with a 1mg/mL concentration or 0.1% (m/v) and analyzed by high-performance liquid chromatography (HPLC). For this purpose, a Shimadzu LC-20AD was coupled to a refractive index detector (RID-10A). A Rezex organic acid
Polímeros, 34(1), e20240008, 2024 2/8
MM MC
M =
100 Hd H
x
(1)
%
100 m m A ASx G = (2)
Polysaccharide from Cumaru (Amburana cearensis) exudate and its potential for biotechnological applications
column measuring 300 mm × 7.8 mm was used for this analysis using 8.0 mmol/L H2SO4 as eluent. The measurement was performed at 55 °C with a 0.6 mL/min flow rate, and the injected volume was 50 μL[21] .
2.3.2 Determination of molar mass
The molar mass distribution was determined using gel permeation chromatography (GPC) on Shimadzu LC-20AD equipment and a refractive index detector (RID-10A). A linear polysep column was used for analysis, 300 mm × 7.8 mm and 0.1 mol/L NaNO3 as eluent. The measurement was carried out at 30 °C with a 1.0 mL/min flow, and the injected volume was 50 μL (sample). Concentration: 1mg/mL or 0.1% (m/v). Exclusion limit: 103-107 g/mol. The calibration curve was obtained using pullulan as a pattern (Equation 3):
14.40967 –1.1392 LogM Ve = × (3)
2.3.3 Protein content
The nitrogen content (N) was initially determined by elemental microanalysis using this Series II CHNS/O Analyzer from PerkinElmer. Then, the protein content was determined using factor 6.25.
2.4 Spectroscopic characterizations (UV-VIS, FT-IR, NMR)
The UV-Vis spectrum was obtained using a Nanometers spectrophotometer ranging from 200 nm to 800 nm. The solution concentration for each sample (exudate, AcGIs, AcGP1, and AcGP2) was prepared at 0.1% (m/v).
The characterization by NMR, all 1H, 13C-BB (Broadband)One-dimensional 13C experiments carried out under total decoupling of hydrogens. The FT-IR characterization was performed on analytical grade KBr pellets using Perkin-Elmer FT-IR Spectrum 1000. HSQC and 13C-DEPT 135 NMR spectra were acquired on a Bruker Avance DRX 500 spectrometer at 70 °C. The sample was dissolved in D2O. The chemical shift was expressed in ppm using DSS as the internal standard.
2.5 Study of hemolytic activity of AcG
The hemolytic activity of A. cearensis gum was performed with human erythrocytes against different gum concentrations (62.5 to 2000 μg/mL), according to Quelemes et al.[22]. Briefly, blood was collected by venipuncture in an anticoagulant tube (EDTA-K2, BD Vacutainer®), and the erythrocytes were separated from the plasma by centrifugation (3600 rpm/15 min). The erythrocytes were washed thrice with saline (0.85% w/v), and a suspension (4% erythrocytes) was prepared. This erythrocyte suspension was incubated with the gum for 30 min at 37 °C; after that incubation period, the supernatant was collected, and the absorbance read at 492 nm. Saline solution (0.85% w/v) and 0.1% (v/v) Triton-X were used as controls. The percentage of hemolysis (% H) was calculated with the following Equation 4:
( ) GumSaline H % 100 TritonSaline
3. Results and Discussions
3.1 Polysaccharide extraction and purification
The AcG extraction was based on the method described by Rodrigues et al.[23]. In this study, AcG presented a yield of 75.9%, approximating the values obtained for other polysaccharides extracted by processes based on the same method used here, such as the gum extracted from the exudate of Anacardium occidentale[2] (77%) and Prunus persica[24] (75%).
3.2 Moisture content and ash
The moisture content was evaluated for the exudate, AcGIs (isolated), AcGP1 (purified), and AcGP2 (bipurified) were respectively 11.24 ± 0.04, 10.46 ± 0.13, 8.90 ± 0.11, and 8.06 ± 0.08. The obtained values showed a gradual reduction in the hydrophilic capacity of the material as the extraction and purification processes were carried out. This is because the extract contains more carbohydrates, making it more hydrophilic. The moisture content values obtained for exudate and AcG are close to those found for other polysaccharides derived from the exudate and extracted by similar techniques, such as almond gum (12.23%) and Arabic gum (10.77%)[21] .
The ash content is an important parameter, particularly for the food industry, in calculating nutritional value or as an index of food refinement[25]. The AcG ash content (5.32%) was higher when compared to other gums, such as Angico (Anadenanthera macrocarpa) (1.8%)[26] and banana (0.8%)[27]. This value suggests that its application as a food additive is inadequate, considering that, for this purpose, the ash content is desired to be below 2.5%[25]
3.3 Polysaccharide composition
3.3.1 UV-Vis and FTIR spectroscopies
The absorption spectra in the UV-Vis region of the exudate of Amburana cearensis and the polysaccharide (AcG) in their various stages of purification are illustrated in Figure 1A, where absorption bands can be observed at 251, 280, and 378 nm. The absorption bands at 251 nm and 280 nm can be attributed to the presence of proteins associated with nucleic acids that constitute the polysaccharide since absorption bands located at 260 nm and 280 nm are attributed to these chemical species[23,24]
Phenolic compounds could be identified from the occurrence of the band at 378 nm, characteristic of these compounds[25]. This is clear when considering that several quinone compounds, chalcones, and flavonoids were isolated from phytochemical studies that evaluated the constituents of the exudate of Amburana cearensis from ethanolic extracts[13,14]
When comparing the UV-Vis spectra of the exudate of Amburana cearensis with the polysaccharide (AcGIs), Figure 1A, the absence of bands at 378 nm and 251 nm, formerly attributed to phenolic compounds and amino acids, is noted in the AcGIs spectrum. However, in the same spectrum, it is possible to observe the band at 280 nm associated with the presence of protein. Interestingly, despite the successive purification steps to which the polysaccharide was subjected, the band located at 280 nm remains.
Polímeros, 34(1), e20240008, 2024 3/8
x = AbsAbs AbsAbs
(4)
Silva,
J. R. T., Araújo, I. C., Silva, E. C., Santana, M. V., Almeida, G. E., Farias, E. A. O., Lima, L. R. M., Paula, R. C. M., Silva, D. A., Araújo A. R., & Eiras, C.
Therefore, it is possible to infer that the structure of AcG is a protein-polysaccharide complex, as observed in the polysaccharide extracted from Acacia senegal[26]
Thus, it is understood that the purification process to which the polysaccharide was submitted helped remove inorganic and organic compounds such as chalcones, flavonoids, and a considerable part of proteins and amino acids that were not part of the chemical structure of the polysaccharide macromolecule.
Fourier transform infrared spectroscopy (FTIR) was used to obtain spectra for Exudate, AcGIs, AcGP1, and AcGP2; however, no significant differences were observed between them, so was illustrated in Figure 1B FTIR for only AcGP2. The fact that there are no differences between the FTIR spectra of the samples evaluated (data not shown) suggests that the AcG extraction and purification process does not promote chemical changes in its structure.
The broad bands observed in the absorption region from 3170 to 3600 cm-1 , Figure 1B, are characteristic of the presence of O–H groups of carbohydrates[28,29]. Medium-intensity absorption bands are observed from 2840 to 3000 cm-1 , attributed to the symmetrical and asymmetrical vibrations of C–H of the methyl and methylene groups arising from
the monosaccharide units AcG[29] and may also result from ethanol residues.
Characteristic signs confirming the presence and characterization of carbohydrates were observed at 1035 cm-1 assigned to the C–O group, 1050 cm-1 assigned to the C–O–C glycosidic bond, and 1075 cm-1 assigned to the C1–H anomeric carbon[28]. The presence of the C–H bond in α and β configurations was confirmed by the deformation frequency around 712 and 780 cm-1, respectively[30] .
The presence of protein can be identified through the absorption frequencies at 1613 cm-1, referring to type I amide carboxylate ions, at 1425 cm-1 (carboxylate ions), and 1300 cm-1 characterized by the presence of unordered protein and type III amide group[31,32]. The N–H stretch, which often absorbs at 3400 cm-1[29], overlaps the wide O–H band.
3.4 Main monomers and molar mass distribution
AcGP2 after the hydrolysis process indicated the predominant presence of arabinose and galactose monomers, with a molar ratio of arabinose and galactose of 1.32:1, Figure 2. The majority presence of these monomers suggesting that the polysaccharide can be a heteropolysaccharide arabinogalactan type[3,33,34]
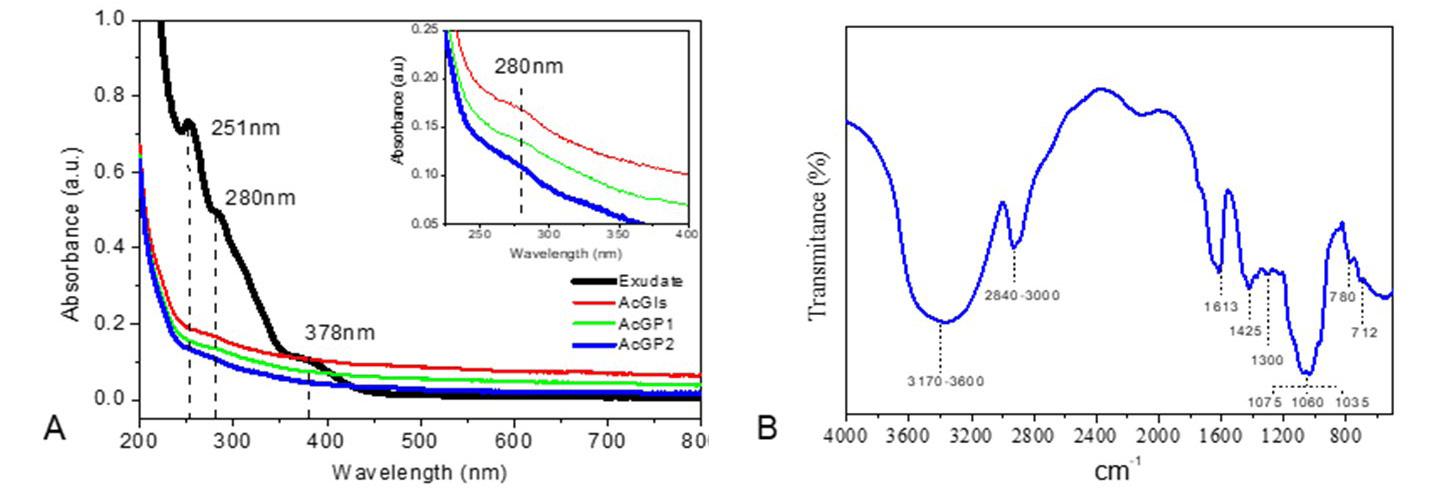
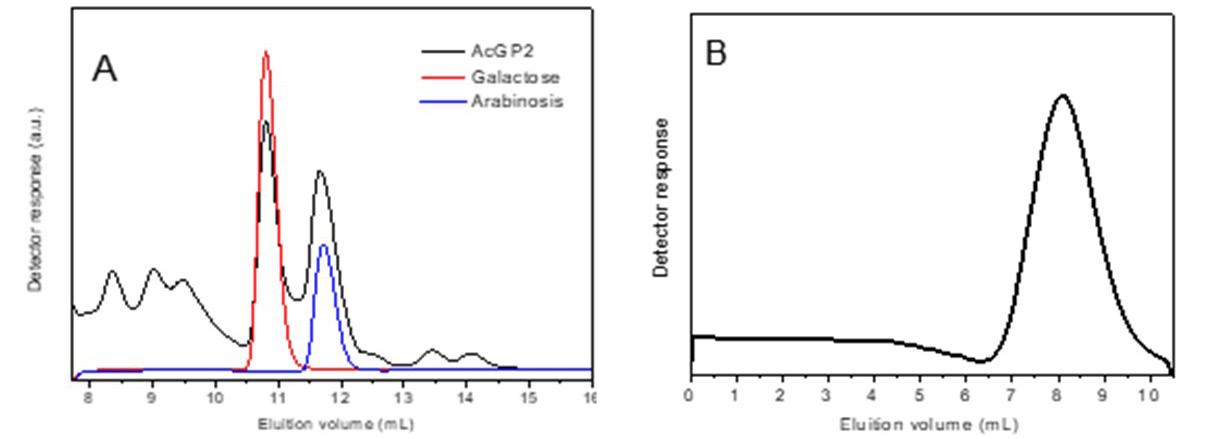
Polímeros, 34(1), e20240008, 2024 4/8
Figure 1. (A) Absorbance spectra in the Ultraviolet-Visible region of a 0.1% w/v aqueous solution of the exudate of Amburana cearensis, AcGIs, AcGP1, and AcGP2; (B) FTIR spectrum obtained for AcGP2 in KBr.
Figure 2. (A) HPLC graph to determine the main monomers of AcGP2; (B) GPC graph to determine the molar mass distribution of AcGP2.
Polysaccharide from Cumaru (Amburana cearensis) exudate and its potential for biotechnological applications
The multiplication of the nitrogen content (N) by 6.25 is traditionally used to estimate the value of the protein content in percentage (P%)[23]. Arabinogalactans present a wide range of P% from 0.4% to 38%[3,35]
The Amburana cearensis gum, after the successive solubilization-precipitation stages in the extraction and purification processes, presented N equal to 0.79%, according to elemental analysis. Its estimated protein content was 4.93% ± 0.88%. This value was higher than that found in cashew gum (1.1%)[23] and Arabic gum (2.0%)[35], while well below the gum content of Acacia Senegal gum (27%)[3]
The mass distribution profile (Figure 2B) proved monomodal for AcG, indicating no mixture of types I and II arabinogalactans[34]. The weight average molar mass (Mw), 3.83 × 10⁵ Da, peak molar mass (MpK), 1.67 × 10⁵ Da, and a polydispersity index, 1.06 × 101, of the AcGP2 were also determined by GPC.
The assumption that the AcGP2 structure is a complex of polysaccharide-protein is reinforced by the high value of the molar mass peak determined by GPC (Figure 2B). This complex type was also observed in other arabinogalactans, such as Angico gum (Anadenanthera macrocarpa)[26] , Acacia senegal, and Acacia seyal gums[3]
Additionally, we also investigated the rheological behavior of AcGP2 (data not shown), where the flow curves of 1% (w/v) AcGP2 aqueous solutions at 37 °C and 50 °C were obtained, and the solutions presented non-Newtonian behavior, typical of polysaccharides extracted from exudates of higher plant species such as Prunus persica[24] e Sterculia striata[10]. Thus, the viscosity behavior of AcGP2 indicates that it can be used as a material for hydrogel or film formation.
3.5 NMR spectroscopy
Figure 3 shows the 13C, DEPT 135, and HSQC NMR spectra obtained in the characterization of AcG, where the signals, as well as their correlations at 106.0/4.50 and 112.0/5.23 δ (ppm), corresponded to the anomeric carbon region and were assigned to the carbon (C1/H1) of the β-DGalactopyranose and α-L-Arabinofuranose units respectively (Figure 3A and 3B), taking into account the latter, where the shift signal at 112.0 δ (ppm) can be assigned to C1 of non-reducing terminal units. In addition, residue-related signals referring to the O-substituted and terminal non-reducing α-L-Araf units can be seen in the region of δ 111; 110, and 109; in the chemical shifts at δ 104.2, and 100, some signs correspond to residues of the β-Galp units[36-39]
The presence of signals at 72.0 and 63.8 δ (ppm) are attributed to the –CH2 carbons present in the β-Dgalactopyranose (C6) and α-L-arabinofuranose (C5) units. These signals are confirmed in the 13C NMR spectrum in DEPT 135[40] , Figure 3E.
The signals and their correlations at 106.0/4.50 (C1/H1); 72.8/3.54 (C2/H2); 84.0/4.20 (C3/H3); 71.0/3.66 (C4/H4); 75.50/3.90 (C5/H5) and 72.0/4.03 (C6/H6) δ (ppm), confirm the presence of (β-D-Galactopyranose 1→3)–bonded units, the which suggests being the main chain (Figure 4A). All signals were attributed from a comparison with studies found in the literature for polysaccharides similar to AcG, such as those extracted from the species Lentinus edodes[42], Ganoderma resinaceum[43] , Picea abies and Pinus sylvestris[44]
Typical signals and correlations suggesting the presence of (α-L-Arabinofuranose 1→3,6)–bonded units (Figure 4B) showed a paramagnetic chemical shift in the 13C and 1H NMR spectrum at 112.0/ 5.23 (C1/H1); 83.0/3.75 (C2/H2); 79.0/3.92 (C3/H3); 87.0/4.12 (C4/H4) and 63.8/3.45 (C5/H5) δ (ppm).
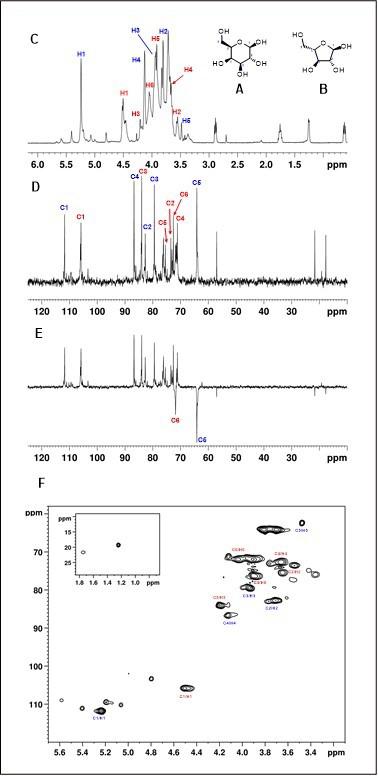
Figure 3. Unit structures (A) β-D-Galactopyranose and (B) α-LArabinofuranose; (C) 1H NMR; (D) 13C; (E) DEPT 135; and (F) HSQC. The chemical shifts in ppm of C and H refer to β-D-Galactopyranose shown in red, while to α-L-Arabinofuranose is shown in blue.
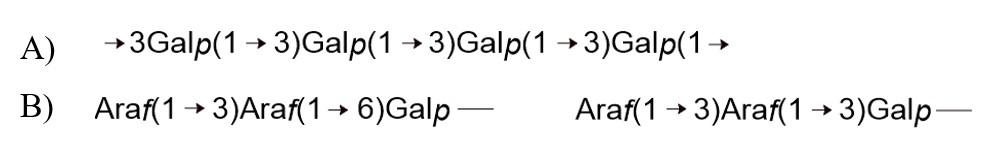
Figure 4. (A) Representation of β-D-Galactopyranose (1→3)-bonded units and (B) representation of fragments of non-reducing terminal units of arabinose and α-L-Arabinofuranose (1→3,6)-bonded chains[39-41]
Polímeros, 34(1), e20240008, 2024 5/8
Silva, J. R. T., Araújo, I. C., Silva, E. C., Santana, M. V., Almeida, G. E., Farias, E. A. O., Lima, L. R. M., Paula, R. C. M., Silva, D. A., Araújo A. R., & Eiras, C.
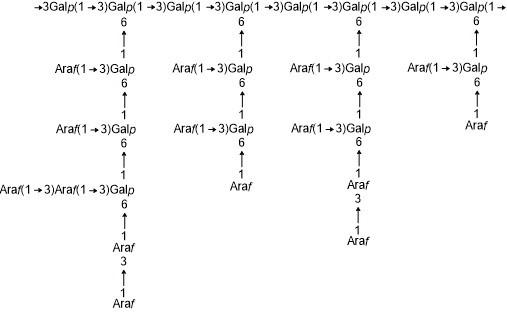
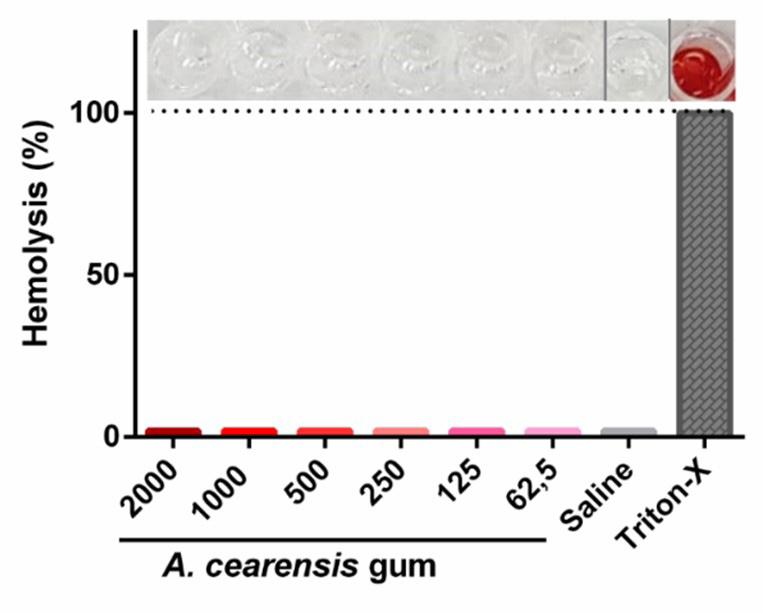
From these results, it can be inferred that AcG can be classified as a type II arabinogalactan or arabinogalactanprotein, as they are also known (Figure 5), due to the presence of the glycosidic bond of the β-D-Galactopyranose units in its chain main of type (1→3) or (1→6)–linked with lateral branches from units of β-D-Galp(1→6) with non-reducing terminals of α-L-Araf(1→3,6), which are present in both types of arabinogalactans[41]
Because it is a polysaccharide that has not yet been studied in the literature, complementary techniques to determine exactly the arrangement of the glycosidic bonds are necessary.
3.6 Hemolytic assay
The hemolytic assay is a protocol commonly used to evaluate the toxicity of natural products against human red blood cells. When subjected to these tests, AcG did not promote hemolysis at any of the concentrations tested (≤ 2,000 μg/mL), demonstrating excellent compatibility with the cell model studied (Figure 6).
Thus, apparently, the biocompatibility of AcG seems to be superior to that of other natural gums that have already been extensively studied, such as Karaya and Chichá gums (extracted from the genus Sterculia), which demonstrated hemolysis below 1% at the concentrations evaluated (100.0 to 0.78 μg/mL)[45]. Or even White Angico gum (Anadenanthera colubrina), which exhibited a hemolysis rate close to 2% at all concentrations tested (10 to 1000 μg/mL)[46] . In the work of Quelemes et al.[22], cashew gum (Anacardium occidentale) promoted approximately 10% hemolysis at a 1000 μg/mL concentration. These results reinforce the excellent biocompatibility of AcG and its potential for applications in biotechnology, although more studies must be carried out.
4. Conclusions
By extraction with an organic solvent, a polysaccharide was obtained from the exudate of Amburana cearensis AcG was a type II arabinogalactan, constituted by a polysaccharide-protein complex. Its structure was estimated as a polymer containing the main chain composed of β-DGalactopyranose units with glycosidic bonds (1→3), and its side chains are composed of β-D-Galactopyranose units (1→6) with non-reducing terminals of α-L-Arabinofuranose (1→3,6). Besides, hemolytic assays showed that this biopolymer has low toxicity, even when compared to other natural gums widely used in biotechnology. Thus, AcG emerges as a new product with potential applications for the industry in general.
5. Author’s Contribution
• Conceptualization – José Regilmar Teixeira da Silva; Iranildo Costa Araújo; Eziel Cardoso da Silva; Moisés das Virgens Santana; Emanuel Airton de Oliveira Farias; Laís Ramos Monteiro de Lima; Regina Célia Monteiro de Paula; Durcilene Alves da Silva; Alyne Rodrigues Araújo; Carla Eiras.
Polímeros, 34(1), e20240008, 2024 6/8
Figure 5. Suggested structure of a type II arabinogalactan found in AcG[39,41]
Figure 6. Hemolysis assay for biocompatibility of AcGP2.
Polysaccharide from Cumaru (Amburana cearensis) exudate and its potential for biotechnological applications
• Data curation – José Regilmar Teixeira da Silva; Carla Eiras.
• Formal analysis – José Regilmar Teixeira da Silva; Carla Eiras.
• Funding acquisition – Carla Eiras.
• Investigation – José Regilmar Teixeira da Silva; Iranildo Costa Araújo; Eziel Cardoso da Silva; Moisés das Virgens Santana; Emanuel Airton de Oliveira Farias; Laís Ramos Monteiro de Lima; Regina Célia Monteiro de Paula; Durcilene Alves da Silva; Alyne Rodrigues Araújo; Carla Eiras.
• Methodology – Carla Eiras.
• Project administration – Carla Eiras.
• Resources – NA.
• Software – NA.
• Supervision – NA.
• Validation – NA.
• Visualization – NA.
• Writing – original draft – José Regilmar Teixeira da Silva; Emanuel Airton de Oliveira Farias; Carla Eiras.
• Writing – review & editing – Geanderson Emilio de Almeida.
6. Acknowledgements
This work received financial support from CNPq/ Brazil (process 313370/202-6, CNPq Call no 09/2020). Besides, the authors are grateful to the CAPES, Brazil by scholarships for the students involved.
7. References
1 Paula, R. C. M., & Rodrigues, J. F. (1995). Composition and rheological properties of cashew tree gum. the exudate polysaccharide from Anacardium occidentale L. Carbohydrate Polymers, 26(3), 177-181 http://dx.doi.org/10.1016/01448617(95)00006-S
2 Costa, S. M. O., Rodrigues, J. F., & Paula, R. C. M. (1996). Monitorização do processo de purificação de gomas naturais: goma do Cajueiro. Polímeros: Ciência e Tecnologia, 6(2), 49-55. Retrieved in 2024, February 15, from https://www. revistapolimeros.org.br/article/5883713d7f8c9d0a0c8b47d4/ pdf/polimeros-6-2-4.pdf
3 Lopez-Torrez, L., Nigen, M., Williams, P., Doco, T., & Sanchez, C. (2015). Acacia senegal vs. Acacia seyal gums – part 1: composition and structure of hyperbranched plant exudates. Food Hydrocolloids, 51, 41-53 http://dx.doi.org/10.1016/j. foodhyd.2015.04.019
4 Mothé, C. G., & Rao, M. A. (2000). Thermal behavior of gum arabic in comparison with cashew gum. Thermochimica Acta, 357-358, 9-13 http://dx.doi.org/10.1016/S0040-6031(00)00358-0
5 Porto, B. C., & Cristianini, M. (2014). Evaluation of cashew tree gum (Anacardium occidentale L.) emulsifying properties. Lebensmittel-Wissenschaft + Technologie, 59(2), 1325-1331 http://dx.doi.org/10.1016/j.lwt.2014.03.033
6 Silva, F., Torres, L., Silva, L., Figueiredo, R., Garruti, D., Araújo, T., Duarte, A., Brito, D., & Ricardo, N. (2018). Cashew gum and maltrodextrin particles for green tea (Camellia sinensis var Assamica) extract encapsulation. Food Chemistry, 261, 169-175 http://dx.doi.org/10.1016/j.foodchem.2018.04.028 PMid:29739579.
7 Oliveira, E. F., Paula, H. C. B., & Paula, R. C. M. (2014). Alginate/cashew gum nanoparticles for essential oil encapsulation. Colloids and Surfaces. B, Biointerfaces, 113, 146-151. http:// dx.doi.org/10.1016/j.colsurfb.2013.08.038 PMid:24077112.
8 Paula, H. C. B., Sombra, F. M., Cavalcante, R. F., Abreu, F. O. M., & Paula, R. C. M. (2011). Preparation and characterization of chitosan/cashew gum beads loaded with Lippia sidoides essential oil. Materials Science and Engineering C, 31(2), 173-178 http://dx.doi.org/10.1016/j.msec.2010.08.013
9 Paula, R. C. M., Heatley, F., & Budd, P. M. (1998). Characterization of Anacardium occidentale exudate polysaccharide. Polymer International, 45(1), 27-35 http://dx.doi.org/10.1002/(SICI)10970126(199801)45:1<27::AID-PI900>3.0.CO;2-9
10 Brito, A. C. F., Silva, D. A., Paula, R. C. M., & Feitosa, J. P. A. (2004). Sterculia striata exudate polysaccharide: characterization, rheological properties and comparison with Sterculia urens (karaya) polysaccharide. Polymer International, 53(8), 1025-1032 http://dx.doi.org/10.1002/pi.1468
11. Empresa Brasileira de Pesquisa Agropecuária – Embrapa. (2003). Cumaru: taxonomia e nomenclatura (Circular Técnica, No. 76). Colombo: Embrapa. Retrieved in 2024, February 15, from https://www.infoteca.cnptia.embrapa.br/bitstream/ doc/314139/1/CT0076.pdf
12 Canuto, K. M., & Silveira, E. R. (2006). Constituintes químicos da casca do caule de Amburana cearensis A.C. Smith. Quimica Nova, 29(6), 1241-1243 http://dx.doi.org/10.1590/S010040422006000600018.
13 Santiago, W. D., Cardoso, M. G., & Nelson, D. L. (2017). Cachaça stored in casks newly constructed of oak (Quercus sp.), amburana (Amburana cearensis), jatoba (Hymenaeae carbouril), balsam (Myroxylon peruiferum) and peroba (Paratecoma peroba): alcohol content, phenol composition, colour intensity and dry extract. Journal of the Institute of Brewing, 123(2), 232-241 http://dx.doi.org/10.1002/jib.414
14. Melo, B. A., Molina-Rugama, A. J., Haddi, K., Leite, D. T., & Oliveira, E. E. (2015). Repellency and bioactivity of Caatinga biome plant powders against Callosobruchus maculatus (Coleoptera: Chrysomelidae: Bruchinae). The Florida Entomologist, 98(2), 417-423 http://dx.doi.org/10.1653/024.098.0204
15 Bravo, J. A., Sauvain, M., Gimenez, A., Muñoz, V., Callapa, J., Le Men-Olivier, L., Massiot, G., & Lavaud, C. (1999). Bioactive phenolic glycosides from Amburana cearensis. Phytochemistry, 50(1), 71-74 http://dx.doi.org/10.1016/S0031-9422(98)00497-X
16 Pereira, É. P. L., Souza, C. S., Amparo, J., Ferreira, R. S., NuñezFigueredo, Y., Fernandez, L. G., Ribeiro, P. R., Braga-de-Souza, S., Silva, V. D. A., & Costa, S. L. (2017). Amburana cearensis seed extract protects brain mitochondria from oxidative stress and cerebellar cells from excitotoxicity induced by glutamate. Journal of Ethnopharmacology, 209, 157-166 http://dx.doi. org/10.1016/j.jep.2017.07.017 PMid:28712890.
17. Bandeira, P. N., Farias, S. S., Lemos, T. L. G., Braz-Filho, R., Santos, H. S., Albuquerque, M. R. J. R., & Costa, S. M. O. (2011). New isoflavone derivative and other flavonoids from the resin of Amburana cearensis. Journal of the Brazilian Chemical Society, 22(2), 372-375 http://dx.doi.org/10.1590/S0103-50532011000200025
18 Oliveira, G. P., Silva, T. M. G., Camara, C. A., Santana, A. L. B. D., Moreira, M. S. A., & Silva, T. M. S. (2017). Isolation and structure elucidation of flavonoids from Amburana cearensis resin and identification of human DNA topoisomerase II-α inhibitors. Phytochemistry Letters, 22, 61-70 http://dx.doi. org/10.1016/j.phytol.2017.09.006
19 Pinto, R. M., Cunha, J. N. B., Silva, J. R. T., Araújo, R., Farias, E. A. O., Barud, H. S., Nunes, L. C. C., & Eiras, C. (2023). Self-supported films of Amburana cearensis bipolymer as an alternative for biodegradable packaging. Waste and Biomass Valorization, 2023, 1-10 http://dx.doi.org/10.1007/s12649-023-02339-6
Polímeros, 34(1), e20240008, 2024 7/8
Silva, J. R. T., Araújo, I. C., Silva, E. C., Santana, M. V., Almeida, G. E., Farias, E. A. O., Lima, L. R. M., Paula, R. C. M., Silva, D. A., Araújo A. R., & Eiras, C.
20 Leal, L. K. A. M., Nechio, M., Silveira, E. R., Canuto, K. M., Fontenele, J. B., Ribeiro, R. A., & Viana, G. S. B. (2003). Anti-inflammatory and smooth muscle relaxant activities of the hydroalcoholic extract and chemical constituents from Amburana cearensis A. C. Smith. Phytotherapy Research, 17(4), 335-340 http://dx.doi.org/10.1002/ptr.1139 PMid:12722135.
21 Bashir, M., & Haripriya, S. (2016). Assessment of physical and structural characteristics of almond gum. International Journal of Biological Macromolecules, 93(Pt A), 476-482 http://dx.doi. org/10.1016/j.ijbiomac.2016.09.009 PMid:27608543.
22 Quelemes, P. V., Araújo, A. R., Plácido, A., Delerue-Matos, C., Maciel, J. S., Bessa, L. J., Ombredane, A. S., Joanitti, G. A., Soares, M. J. S., Silva, D. A., & Leite, J. R. S. A. (2017). Quaternized cashew gum: an anti-staphylococcal and biocompatible cationic polymer for biotechnological applications. Carbohydrate Polymers, 157, 567-575 http://dx.doi.org/10.1016/j.carbpol.2016.10.026 PMid:27987963.
23 Rodrigues, J. F., Paula, R. C. M., & Costa, S. M. O. (1993). Métodos de isolamento de gomas naturais: comparação através da goma do cajueiro (Anacardium occidentale L.). Polímeros: Ciência e Tecnologia, 3(1), 31-36. Retrieved in 2024, February 15, from https://www.revistapolimeros.org.br/article/588371 337f8c9d0a0c8b479c/pdf/polimeros-3-1-31.pdf
24 Simas-Tosin, F. F., Barraza, R. R., Petkowicz, C. L. O., Silveira, J. L. M., Sassaki, G. L., Santos, E. M. R., Gorin, P. A. J., & Iacomini, M. (2010). Rheological and structural characteristics of peach tree gum exudate. Food Hydrocolloids, 24(5), 486493 http://dx.doi.org/10.1016/j.foodhyd.2009.12.010
25 Åkerberg, A. K. E., Liljeberg, H. G. M., Granfeldt, Y. E., Drews, A. W., & Björck, I. M. E. (1998). An in vitro method. based on chewing. to predict resistant starch content in foods allows parallel determination of potentially available starch and dietary fiber. The Journal of Nutrition, 128(3), 651-660 http://dx.doi.org/10.1093/jn/128.3.651. PMid:9482777.
26 Silva, A. G., Rodrigues, J. F., & Paula, R. C. M. (1998). Composição e propriedades reológicas da goma do angico (Anadenanthera Macrocarpa Benth). Polímeros, 8(2), 34-40 http://dx.doi.org/10.1590/S0104-14281998000200006
27 Suvakanta, D., Narsimha, M. P., Pulak, D., Joshabir, C., & Biswajit, D. (2014). Optimization and characterization of purified polysaccharide from Musa sapientum L. as a pharmaceutical excipient. Food Chemistry, 149, 76-83 http:// dx.doi.org/10.1016/j.foodchem.2013.10.068 PMid:24295679.
28 Brondsted, H., Hovgaard, L., & Simonsen, L. (1995). Dextran hydrogels for colon-specific drug delivery IV: comparative release study of hydrocortisone and prednisolone sodium phosphate. STP Pharma Sciences, 5(1), 65-69
29 Silverstein, R. M., Webster, F. X., & Kiemle, D. J. (2006). Identificação espectrofotométrica de compostos orgânicos. Rio de Janeiro: LTC
30 Menezes, T. M. F. (2014). Isolamento dos polissacarídeos dos cogumelos Agaricus blazei e Lentinus edodes: caracterização estrutural, estudo reológico e potencial para uso terapêutico (Master’s dissertation). Universidade Federal do Ceará, Fortaleza
31. Mohaček-Grošev, V., Božac, R., & Puppels, G. J. (2001). Vibrational spectroscopic characterization of wild growing mushrooms and toadstools. Spectrochimica Acta. Part A: Molecular and Biomolecular Spectroscopy, 57(14), 2815-2829 http://dx.doi. org/10.1016/S1386-1425(01)00584-4 PMid:11789883.
32 Payne, K. J., & Veis, A. (1988). Fourier transform IR spectroscopy of collagen and gelatin solutions: deconvolution of the amide I band for conformational studies. Biopolymers, 27(11), 17491760 http://dx.doi.org/10.1002/bip.360271105 PMid:3233328.
33 Liang, F., Hu, C., He, Z., & Pan, Y. (2014). An arabinogalactan from flowers of Chrysanthemum morifolium: structural and bioactivity studies. Carbohydrate Research, 387, 37-41 http:// dx.doi.org/10.1016/j.carres.2013.09.002 PMid:24565932.
34 Leivas, C. L., Iacomini, M., & Cordeiro, L. M. C. (2016). Pectic type II arabinogalactans from starfruit (Averrhoa carambola L.). Food Chemistry, 199, 252-257 http://dx.doi. org/10.1016/j.foodchem.2015.12.020 PMid:26775968.
35 Li, X., Fang, Y., Zhang, H., Nishinari, K., Al-Assaf, S., & Phillips, G. O. (2011). Rheological properties of gum arabic solution: from Newtonianism to thixotropy. Food Hydrocolloids, 25(3), 293-298 http://dx.doi.org/10.1016/j.foodhyd.2010.06.006
36 Marson-Ascêncio, P. G., Ascêncio, S. D., & Baggio, S. F. Z. (2012). Isolamento e análise química parcial de exopolissacarídeos da diatomácea marinha cultivada Coscinodiscus wailesii (Coscinodiscales, Bacillariophyta). Quimica Nova, 35(8), 15421548 http://dx.doi.org/10.1590/S0100-40422012000800010
37 Gorin, P. A. J., & Mazurek, M. (1975). Further studies on the assignment of signals in 13C magnetic resonance spectra of aldoses and derived methyl glycosides. Canadian Journal of Chemistry, 53(8), 1212-1223 http://dx.doi.org/10.1139/v75-168
38. Dong, Q., & Fang, J.-N. (2001). Structural elucidation of a new arabinogalactan from the leaves of Nerium indicum. Carbohydrate Research , 332(1), 109-114 http://dx.doi. org/10.1016/S0008-6215(01)00073-8. PMid:11403084.
39 Aspinall, G. O. (1973). Carbohydrate polymers of plant cell walls. In F. Loewus (Ed.), Biogenesis of plant cell wall polysaccharides (pp. 95-115). New York: Academic Press. http://dx.doi.org/10.1016/B978-0-12-455350-7.50011-0
40 Pavia, D. L., Lampman, G. M., Kriz, G. S., & Vyvyan, J. A. (2014). Introduction to spectroscopy. Stamford: Cengage Learning
41 Carpita, N. C., & Gibeaut, D. M. (1993). Structural models of primary cell walls in flowering plants: consistency of molecular structure with the physical properties of the walls during growth. The Plant Journal, 3(1), 1-30 http://dx.doi. org/10.1111/j.1365-313X.1993.tb00007.x PMid:8401598.
42 Carbonero, E. R., Gracher, A. H. P., Komura, D. L., Marcon, R., Freitas, C. S., Baggio, C. H., Santos, A. R. S., Torri, G., Gorin, P. A. J., & Iacomini, M. (2008). Lentinus edodes heterogalactan: antinociceptive and anti-inflammatory effects. Food Chemistry, 111(3), 531-537 http://dx.doi.org/10.1016/j. foodchem.2008.04.015
43 Amaral, A. E., Carbonero, E. R., Simão, R. C. G., Kadowaki, M. K., Sassaki, G. L., Osaku, C. A., Gorin, P. A. J., & Iacomini, M. (2008). An unusual water-soluble β-glucan from the basidiocarp of the fungus Ganoderma resinaceum. Carbohydrate Polymers, 72(3), 473-478 http://dx.doi.org/10.1016/j.carbpol.2007.09.016
44 Willför, S., Sjöholm, R., Laine, C., & Holmbom, B. (2002). Structural features of water-soluble arabinogalactans from Norway spruce and Scots pine heartwood. Wood Science and Technology, 36(2), 101-110 http://dx.doi.org/10.1007/s00226-001-0137-x
45. Silva, S. C. C. C., Braz, E. M. A., Carvalho, F. A. A., Brito, C. A. R. S., Brito, L. M., Barreto, H. M., Silva, E. C., Fo., & Silva, D. A. (2020). Antibacterial and cytotoxic properties from esterified Sterculia gum. International Journal of Biological Macromolecules, 164, 606-615 http://dx.doi.org/10.1016/j. ijbiomac.2020.07.031 PMid:32652149.
46. Oliveira, R. W. G., Oliveira, J. M., Paz, F. B., Muniz, E. C., Moura, E. M., Costa, J. C. S., Nascimento, M. O., Carvalho, A. L. M., Pinheiro, I. M., Mendes, A. N., Filgueiras, L. A., Souza, P. R., & Moura, C. V. R. (2023). Films composed of white angico gum and chitosan containing chlorhexidine as an antimicrobial agent. International Journal of Biological Macromolecules, 235, 123905 http://dx.doi.org/10.1016/j. ijbiomac.2023.123905. PMid:36870650.
Received: June 15, 2023
Revised: Jan. 14, 2024
Accepted: Feb. 05, 2024
Polímeros, 34(1), e20240008, 2024 8/8
Development by extrusion of composite films based on Poly(Lactic Acid)/Babassu Mesocarp Flour
Lucas Rafael Carneiro da Silva1* , Railha Antunes de França2 , Raquel do Nascimento Silva2 , Tatianny Soares Alves2 , Renata Barbosa2 , Alessandro de Oliveira Rios3 and Ruth Marlene Campomanes Santana1
1 Programa de Pós-graduação em Engenharia de Minas, Metalúrgica e de Materiais, Universidade Federal do Rio Grande do Sul – UFRGS, Porto Alegre, RS, Brasil
2 Programa de Pós-graduação em Ciência e Engenharia dos Materiais, Universidade Federal do Piauí –UFPI, Teresina, PI, Brasil
3 Programa de Pós-graduação em Ciência e Tecnologia de Alimentos, Universidade Federal do Rio Grande do Sul – UFRGS, Porto Alegre, RS, Brasil *lr.rafaelcarneiro@gmail.com
Obstract
The objective of this manuscript was to investigate the influence of different Babassu Mesocarp Flour (BMF) contents (3, 5, 8, and 10% by weight) on the physical and surface properties of the Poly(Lactic Acid) (PLA) matrix. For this purpose, composite films were produced through flat-die extrusion processing. Visual analysis showed that the films were successfully produced by this processing method and exhibited good handling. The physical properties of the films varied as follows: width (16.41‒20.38 cm), thickness (0.14‒0.24 mm), apparent density (0.78‒1.07 g/cm3), and grammage (168.34‒255.31 g/m2). Through optical microscopy, good distribution and dispersion of the particles were observed despite the presence of some agglomerates. The film surface became rough due to the incorporated flour content, which influenced the contact angle result. The combination of PLA/BMF for producing composite films has technological potential, enabling the valorization of an industrial by-product and preserving the environment.
Keywords: Babassu Mesocarp Flour, composite films, flat-die extrusion, packaging, Poly(Lactic Acid).
How to cite: Silva, L. R. C., França, R. A., Silva, R. N., Alves, T. S., Barbosa, R., Rios, A. O., & Santana, R. M. C. (2024). Development by extrusion of composite films based on Poly(Lactic Acid)/Babassu Mesocarp Flour. Polímeros: Ciência e Tecnologia, 34(1), e20240009. https://doi.org/10.1590/0104-1428.20230103
1. Introduction
Over the years, polymer materials, commonly known as “plastics”, have dominated the packaging industry, mainly those of petrochemical and non-biodegradable origin. This industry still widely uses plastics to produce short-term food packaging (single-use/disposable)[1]. It is crucial that the packaging produced can protect the packaged food, as its inefficiency results in the waste of resources and environmental impacts caused by improper disposal[2]. According to the 2021 United Nations Environment Programme (UNEP) report, plastic accounts for 85% of marine litter[3] .
Alternative solutions to these environmental problems have been proposed to reduce the accumulation of nonbiodegradable plastics in the environment. One of these alternatives is using plastics that combine renewable origin and biodegradable nature (biopolymers) to develop ecologically correct packaging, making it possible to meet the requirements of a more sustainable circular economy[4] Among the available options, Poly(Lactic Acid) (PLA), a linear aliphatic polyester, is prominent in replacing conventional plastics and has aroused growing academic and industrial interest[5]
However, due to the relatively high polymer cost, producing a polymer film consisting only of PLA applied as a packaging material still needs to be economically feasible[6]. One promising option to minimize the cost of the final products based on PLA is to incorporate a fraction of another material into the polymer[7,8]. The ecological character of PLA must not be drastically affected; therefore, the incorporated material should also be environmentally friendly (bio-reinforcement).
From this perspective, incorporating industrial by-products is an ecological, promising, economic, and advantageous approach. Babassu Mesocarp Flour (BMF) is an excellent alternative, a by-product of the babassu oil extraction industry. The use of these materials helps to reduce the waste of resources, in addition to presenting exciting opportunities for innovation. The babassu palm (Orbignya phalerata, this species is the most common) is native to countries in South America, mainly in the Northeast and North of Brazil, being found in smaller proportions in Bolivia, Colombia, and Suriname. In Brazil, the central area of occurrence of
https://doi.org/10.1590/0104-1428.20230103 O O O O O O O O O O O O O O O Polímeros, 34(1), e20240009, 2024 ISSN 1678-5169 (Online) 1/10
Silva, L. R. C., França, R. A., Silva, R. N., Alves, T. S., Barbosa, R., Rios, A. O., & Santana, R. M. C.
babassu is located in a transition zone between the tropical forests of the Amazon basin and the semi-arid region[9,10]
Based on the above, this manuscript aimed to investigate the physical (width, thickness, density, and grammage) and surface properties (optical microscopy, optical profilometry, and contact angle) of PLA/BMF-based films, as they directly influence the choice of a food model for subsequent film application. The films were produced by flat-die extrusion under laboratory conditions. Flat-die extrusion is highly efficient, allowing continuous film production quickly and economically with minimal downtime. It is a safe and ecological process, producing less waste than other production alternatives.
2. Materials and Methods
2.1 Materials
The polymer used was PLA, marketed under Ingeo™ Biopolymer 4043D (NatureWorks, Minnesota, USA). PLA exhibits the following properties: Density = 1.24 g/cm3 , Fluidity Index = 6 g/10 min (210 °C, 2.16 kg), and Melting Temperature (T m) = 145‒160 °C. The bio-reinforcement used was BMF obtained by grinding babassu mesocarp as part of the full use of babassu coconut (Florestas Brasileiras S.A., Itapecuru-Mirim, Maranhão, Brazil). Different techniques in our previous manuscript characterized BMF[11]
2.2 Masterbatch production based on PLA/BMF
The PLA and BMF were dried at 60 °C for 24 h in an oven with air circulation and renewal (De Leo, Porto Alegre, Brazil). The concentrates (masterbatch) were prepared in the proportion of 50% PLA and 50% BMF. That is, 25 g of each material was used (50 g). The equipment used was an Internal Mixer (Model HAAKE™ Rheomix 600 OS, Thermo Scientific) operating at 160 °C with a rotation speed of roller-type rotors of 60 rpm. PLA pellets were fed into the equipment at the beginning of the processing. After 4 min, the internal mixer was fed with BMF without interrupting the process until the total time was 8 min.
The masterbatch obtained was ground in a Knife Mill (PROJEMAQ Engenharia, Brazil).
2.3 Preparation of PLA/BMF film formulations
The ground material was dried at 60 °C for 24 h in an oven (Model SL-100, Solab, Brazil). Subsequently, the material was diluted in virgin PLA resin in adequate amounts to produce formulations with 3, 5, 8, and 10% by weight of BMF. The BMF contents used in this manuscript were based on the literature regarding producing films from composites[12,13]. The dilution was carried out in a SingleScrew Extruder (screw diameter = 16 mm; L/D ratio = 26), Model AX-16 by AX Plásticos, with a temperature profile of 145, 155, and 170 °C and with a screw speed of 50 rpm. The virgin PLA pellets were dried and processed with the same parameters. Table 1 presents the formulations and their respective identification code.
2.4 Processing of films by flat-die extrusion
Figure 1 shows the extruder with the flat-die (width = 22 cm) and some images captured during film processing. The previous topic described processing temperatures and screw speed.
Table 2 presents the parameters used for film processing. After the end of the processing, the films were stored in Low-Density Polyethylene (LDPE) hermetic zip-lock bags (35 × 45 cm).
Table 1. PLA/BMF-based film formulations and their identification code.
PLA/8%BMF 92 8 P/8F
PLA/10%BMF 90 10 P/10F
Caption: P = PLA; F = Flour.
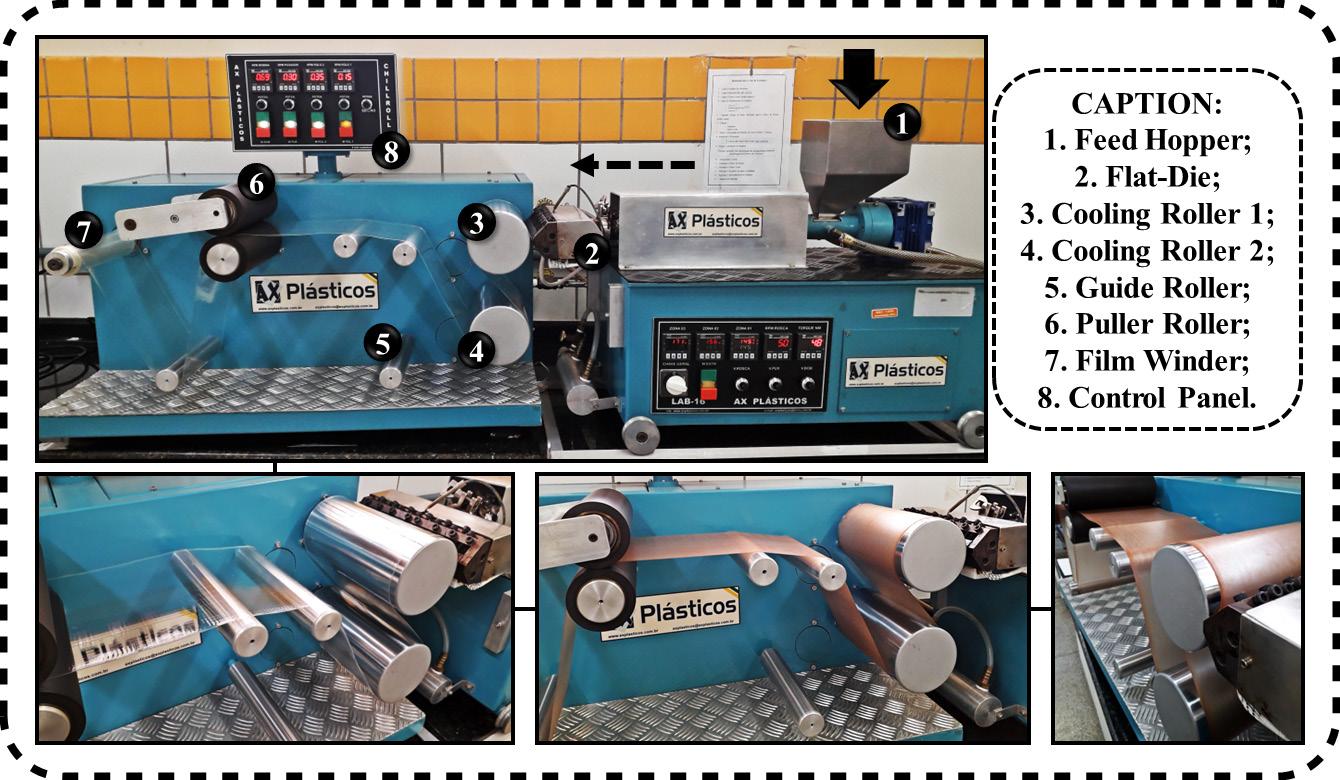
Polímeros, 34(1), e20240009, 2024 2/10
Film Formulations Content (%) Identification Code PLA BMF Neat PLA 100 0 Neat PLA PLA/3%BMF 97 3 P/3F
95 5
PLA/5%BMF
P/5F
Figure 1. Flat-die extrusion equipment and images captured during film processing.
2.5 Characterization of composite films
The physical aspect of the films was evaluated through visual and tactile observations to elucidate the influence of flat-die extrusion processing and the incorporated BMF content. Surface irregularities (macroscopic scale) were also investigated for discussion purposes. The images of the films were captured using a Samsung Galaxy M51 (64 megapixels).
The average width of the films was determined based on twenty measurements using a graduated ruler. Each film reel was unwound, and measurements were taken at different lengths. The average width value was used to calculate the Transverse Ratio (TR) (Equation 1):
film flatdie W TR W = (1)
Where: WFILM is the average width of the film (cm), and WFLAT-DIE is the width of the flat-die used in the extrusion, corresponding to 22 cm. The closer the TR value is to 1, the closer the film width is to that of the flat-die.
The thickness of the samples was determined using a thickness gauge with a graduation of 0.01 mm and an accuracy of ±0.02 mm (Model 130.125, DIGIMESS, São Paulo, Brazil). Six film samples for each formulation, each 3.0 × 3.0 cm in size, were used for the analysis. The thickness was measured at ten points on the sample: two in the central part and eight in the perimeter.
The apparent density of the film was calculated directly from the ratio between mass and volume by Equation 2. The sample dimension was 1.7 × 1.7 cm, and the thickness was measured with a thickness gauge (Model M-73010, Mainard, São Paulo, Brazil) in the central part of the sample. The final density value was presented as the average of six replicates.
m Ax ρ δ = (2)
where: m is the mass of the sample (g), A is the area of the sample (2.89 cm2), δ is the thickness of the sample (cm), and ρ is the film density expressed in g/cm3
The grammage of the film samples was determined as the average ratio between the mass and area of six samples according to Equation 3:
m G A = (3)
where: m is the mass of the sample (g), A is the sample area (0.000289 m2), and G is the average grammage of the film (g/m2).
The film samples were analyzed in a Binocular Optical Microscope (Model DM500, Leica Microsystems) under the following conditions: transmission mode, ICC50 E capture camera, 40x magnification, and 500 μm scale. The sample was taken from a region between the film perimeter and the center.
The 3D Optical Profilometry technique (Model ContourGT-K, Bruker) investigated the surface topography and quantitative parameters, such as average roughness (RA), maximum peak height (RP), and maximum valley depth (RV). Topographic images (2D and 3D) were obtained from a film sample measuring 0.9 x 1.3 mm, and the parameters were expressed in µm. The “Vision6” software was used for data acquisition.
Contact angle measurements (sessile drop method) were performed using a Drop Shape Analyzer-DSA100 (KRÜSS Scientific, Germany) to analyze the samples surface wettability. This method gently deposited a deionized water droplet onto the sample surface using a micro syringe at room temperature and humidity. The “DSA4” software calculated the contact angle based on the droplet image captured ~5 s after the droplet was deposited. The final value is the average of twenty measurements for each film formulation.
3. Results and Discussions
3.1 Visual evaluation
Figure 2 presents the film reels produced to explain the efficiency of the flat-die extrusion processing and report the observed surface irregularities.
All films were successfully produced using the flat-die extrusion. It is vital to make it clear that the films were not free of surface irregularities and, therefore, tiny pores were observed in different regions of the film. The surface lines from the melt flow were best visualized on the PLA film surface. This type of processing is highly productive, so the films produced are long and wide. The parameters must be set correctly to prevent the films from tearing during processing. Here, the parameters used allowed the production of continuous films. The films produced did not show brittle behavior when handled, which allowed them to be rolled up during processing. The composite films were easier to roll up as the BMF content increased, possibly due to obtaining a thinner thickness for a higher flour content. The PLAbased film showed high brightness, transparency, and good handling, and the composite films were opaque (Figure 3).
3.2 Width inspection
One of the main tasks of a flat-die is to distribute the molten polymer to the desired width and thickness and
based
Polímeros, 34(1), e20240009, 2024 3/10
Development by extrusion of composite films
on Poly(Lactic Acid)/Babassu Mesocarp Flour
Film Formulations Parameters ‒ Chill Rolls (rpm) Cooling Roller 1 Cooling Roller 2 Puller Roller Film Winder Neat PLA 1.5 3.9 3.0 6.8 PLA/3%BMF 1.5 2.0 3.0 6.9 PLA/5%BMF 1.5 2.0 3.0 6.9 PLA/8%BMF 1.5 2.0 3.0 6.9 PLA/10%BMF 1.5 2.0 3.0 6.9
Table 2. Processing parameters used for film production.
Silva, L. R. C., França, R. A., Silva, R. N., Alves, T. S., Barbosa, R., Rios, A. O., & Santana, R. M. C.
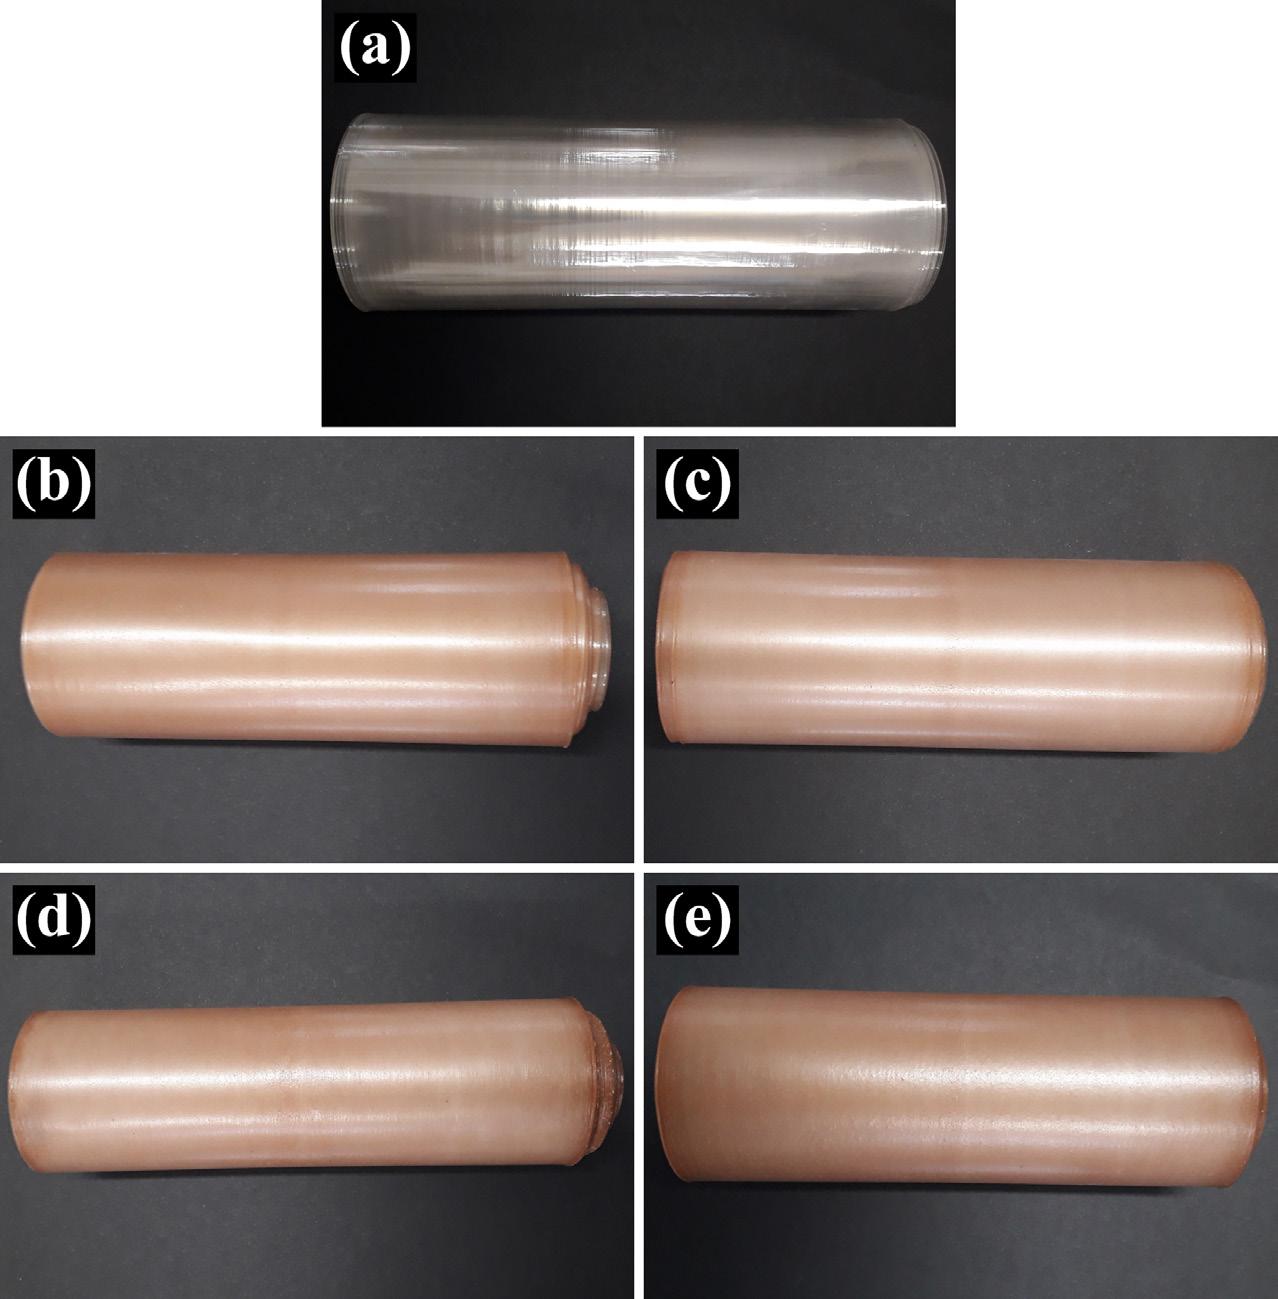
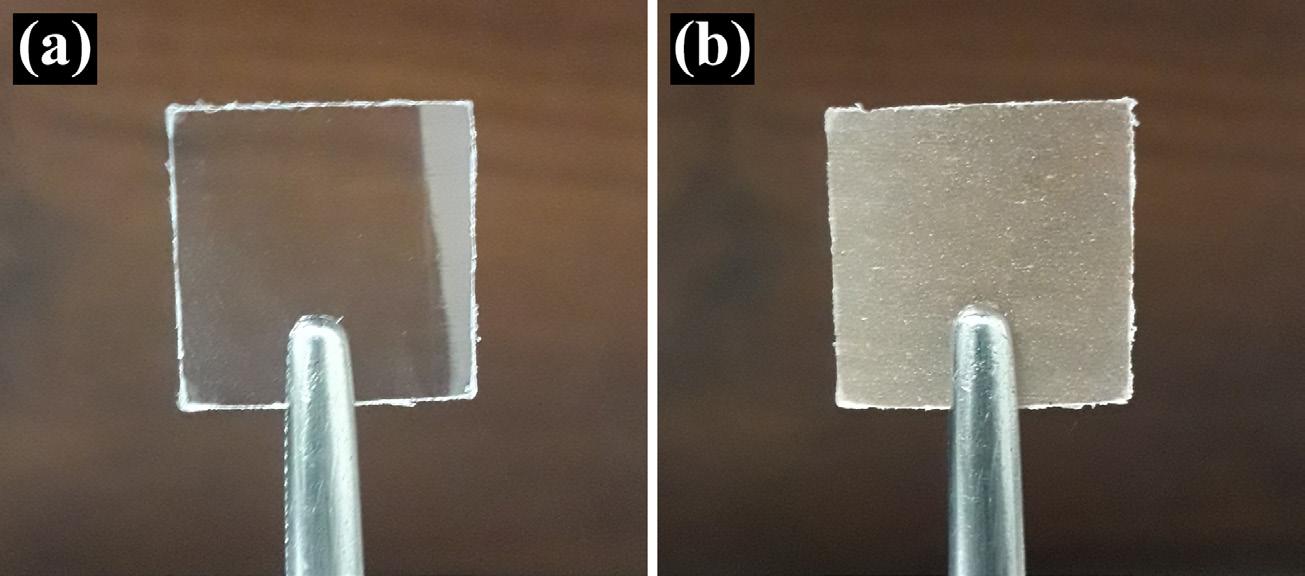
develop a uniform flow pattern[14]. Thus, as shown in Figure 4, the influence of BMF on the width of composite films was investigated.
As shown in Figure 4, all films produced have a smaller width than the width of the flat-die. The results showed that the film based on neat PLA had the greatest width, as there was no component in the film formulation that could restrict the flow of molten material and considerably reduce the width in processing, showing a reduction of 7.36%. With the incorporation of BMF in different contents to the PLA
matrix, it was observed that the width was even more reduced, resulting in 25.41 (P/3F), 21.41 (P/5F), 12.91 (P/8F), and 11.59% (P/10F). Incorporating BMF into PLA may have limited its polymer chain mobility, and the composite film width was smaller due to the reduced melt flow.
A distinct reason that justifies reducing the width of all films is shown in Figure 5a. The molten material exiting the flat-die is directed along the edge of the film because the equipment rollers pull the film away from the flat-die. Consequently, the width of the film was reduced due to this
Polímeros,
e20240009, 2024 4/10
34(1),
Figure 2. Film reels: (a) Neat PLA, (b) P/3F, (c) P/5F, (d) P/8F, and (e) P/10F.
Figure 3. Digital photograph of neat PLA and PLA/BMF (8% by weight) film samples highlighting: (a) transparency and (b) opacity, respectively.
stretching. During film processing, stretching is inevitable as the extruded material is pulled along the processing flow direction (machine direction). This phenomenon of reducing the width of the film is known as “neck-in”; therefore, it is recommended that the width of the flat-die be greater than that of the final product[15]
Another interpretation would be that the BMF content for the composite films influenced the neck-in. As the film was pulled and rolled up at a certain speed during processing, a fraction of the BMF particles drifted toward the film edges (Figure 5b and 5c). Therefore, with lower particle content at the edges, the reduction in width was more pronounced, and with an increase in particle content, the width did not undergo significant reductions. However, it is essential to mention that the reduction of the film width by the flat-die makes the edges of the film thicker than the center of the film (edge bead)[16]. Composite films based on 3 and 5% by weight of BMF showed the thickest edges. Thus, the
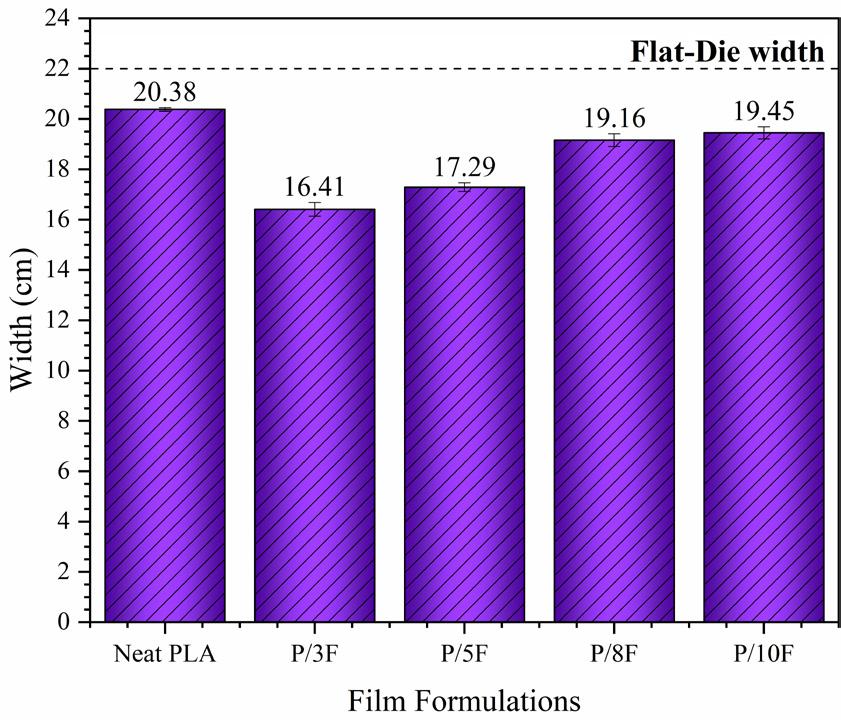
previously raised idea that the lower particle content on the edges could facilitate the width reduction may not have impacted the results. Thicker edges would make it more challenging to reduce the width, which leads to the assumption that the reduction in width due to the neck-in acted more relevantly. The TR results were 0.93 (Neat PLA), 0.75 (P/3F), 0.79 (P/5F), 0.87 (P/8F), and 0.88 (P/10F).
3.3 Thickness measurements
Thickness is an essential characteristic of polymer films used in food packaging. Figure 6 shows the average thickness of the films produced.
In general, the average thickness of the films varied between 0.14‒0.24 mm, within the thickness range explained by Barlow and Morgan[17]. According to the authors, the thickness of the films applied to food packaging varies between 10‒250 µm (0.01‒0.25 mm) depending on the resistance, durability, and barrier function determined by the application. All films incorporating BMF were thicker than the neat PLA film, and this increase in thickness was due to the incorporated solid particles. The incorporation of BMF increased to 71 (P/3F), 57 (P/5F), 50 (P/8F), and 43% (P/10F), showing that film composition substantially affects thickness. The difference between each formulation may be due to differences in flour particle size, melt viscosity, and interactions and structural changes that establish different rearrangements during the film processing stage, influencing the thickness.
On the other hand, it was observed in the literature that the justification for a smaller thickness for some film formulations is due to a compact molecular structure[18] For films produced by flat-die extrusion, it was reported in the literature that the cooling roller rotational speed must be adjusted to be high enough to make the films thinner[19]. However, it is necessary to pay attention to this consideration, as the high rotation speeds of the rollers can make it difficult for the continuous formation of the film when it exits through the die slit. Consequently, films can tear or show many irregularities.
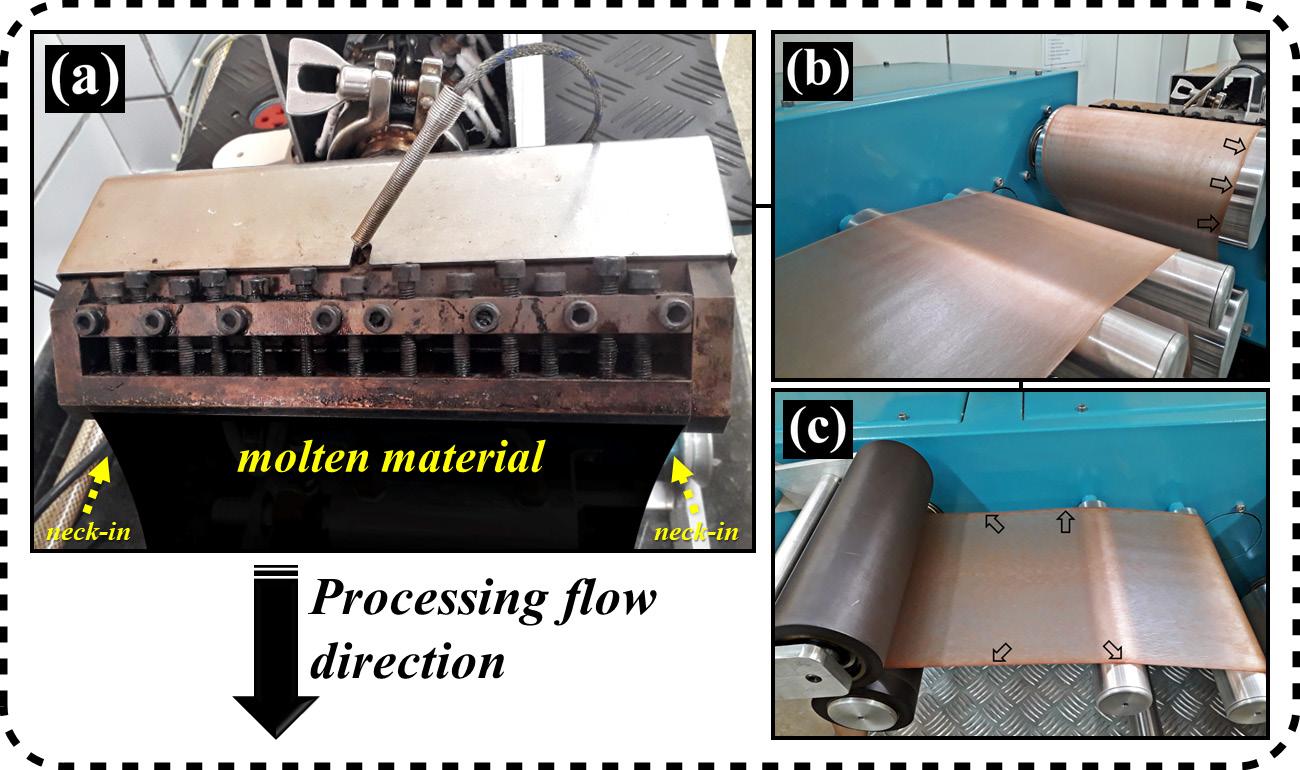
Polímeros, 34(1), e20240009, 2024 5/10
Development by extrusion of composite films based on Poly(Lactic Acid)/Babassu Mesocarp Flour
Figure 4. Average width of the films produced compared to flatdie width.
Figure 5. Scheme showing: (a) neck-in and (b‒c) film edge with flour particles.
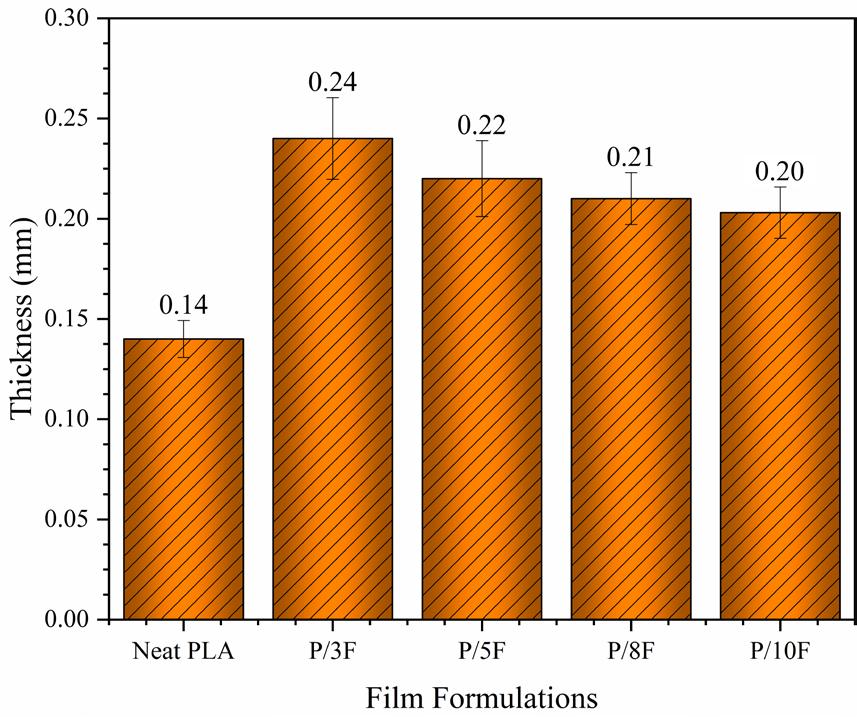
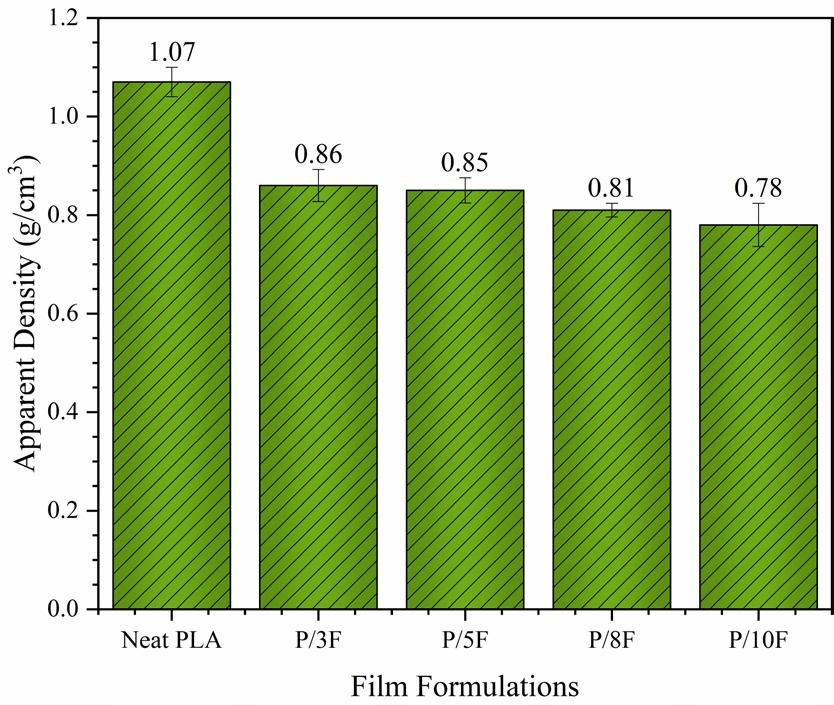
3.4 Apparent density (ρ)
The density measures the mass amount in a given volume. Thus, the density of the films produced was determined, and the result obtained is shown in Figure 7
The film produced based on neat PLA had a density of 1.07 ± 0.030 g/cm3, the highest value obtained concerning the density of films incorporated with BMF. The incorporation of BMF into the PLA caused a reduction in film density as the BMF content increased, resulting in a density < 1.0 g/cm3 for all composite films. The flour possibly acted, in this case, as a filler material, causing the particles to occupy space within the polymer matrix, increasing its volume without adding a significant mass amount. In percentage terms, the reduction suffered was 19.63 (P/3F), 20.56 (P/5F), 24.30 (P/8F), and 27.10% (P/10F) due to the low density of BMF particles. This variation observed in the density of the composite films and associated with the BMF content may also be associated with the level of porosity in the film structure[20]. The lower density of composite films makes them attractive materials, mainly for applications related to lightness and easy handling, such as food packaging.
3.5 Grammage
Grammage is an analysis widely used to compare papers of different types, such as common paper and cardboard, to investigate the influence of a coating on the paper applied as a packaging material. Thus, as shown in Figure 8, the grammage was determined to understand how the BMF particles interfere with this property.
The grammage of the neat PLA film was 168.34 ± 4.510 g/m2, the lowest value among the films produced. Incorporating BMF increased the film grammage for all incorporated contents into PLA. However, the grammage linearly reduced with the increase in flour content, namely: 255.31 ± 9.763 (P/3F) > 214.30 ± 5.346 (P/5F) > 189.45 ± 5.342 (P/8F) > 177.80 ± 7.322 g/m2 (P/10F). This reduction in grammage with increasing flour content occurred because the particles decreased the amount of polymer material in the film. The increase in the grammage of the composite films
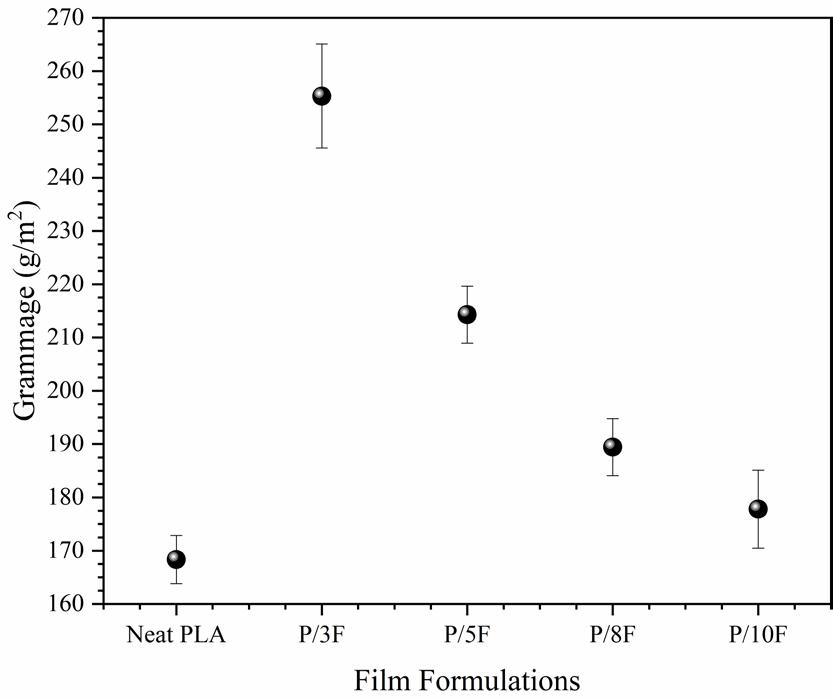
may have some relationship with filling the free volume “cavities” in the PLA with BMF particles. The incorporated particles can change the free volume[21]. The variation in grammage between the different formulations may be due to differences in composition, structure, thickness, and pore volume[22].
3.6 Optical Microscopy (OM)
The OM technique can investigate the distribution and dispersion of the material incorporated in the polymer matrix. Thus, in Figure 9, micrographs of the film surface are presented, which allowed the observation of the distribution and dispersion of the BMF incorporated into the PLA.
The micrograph of the neat PLA film showed a relatively homogeneous surface due to the absence of BMF particles (Figure 9a). In contrast, particles of different sizes on the surface of composite films were randomly distributed in the polymer matrix, representing a heterogeneous surface. The increase in BMF content caused the appearance of small agglomerates of particles, better visualized in Figures 9d and 9e, which is inevitable, as the particles do not melt and poor dispersion
Polímeros, 34(1), e20240009, 2024 6/10
Silva,
L. R. C., França, R. A., Silva, R. N., Alves, T. S., Barbosa, R., Rios, A. O., & Santana, R. M. C.
Figure 6. Average thickness of the films produced by flat-die extrusion.
Figure 7. Average apparent density value determined for the films.
Figure 8. Average grammage determined for films.
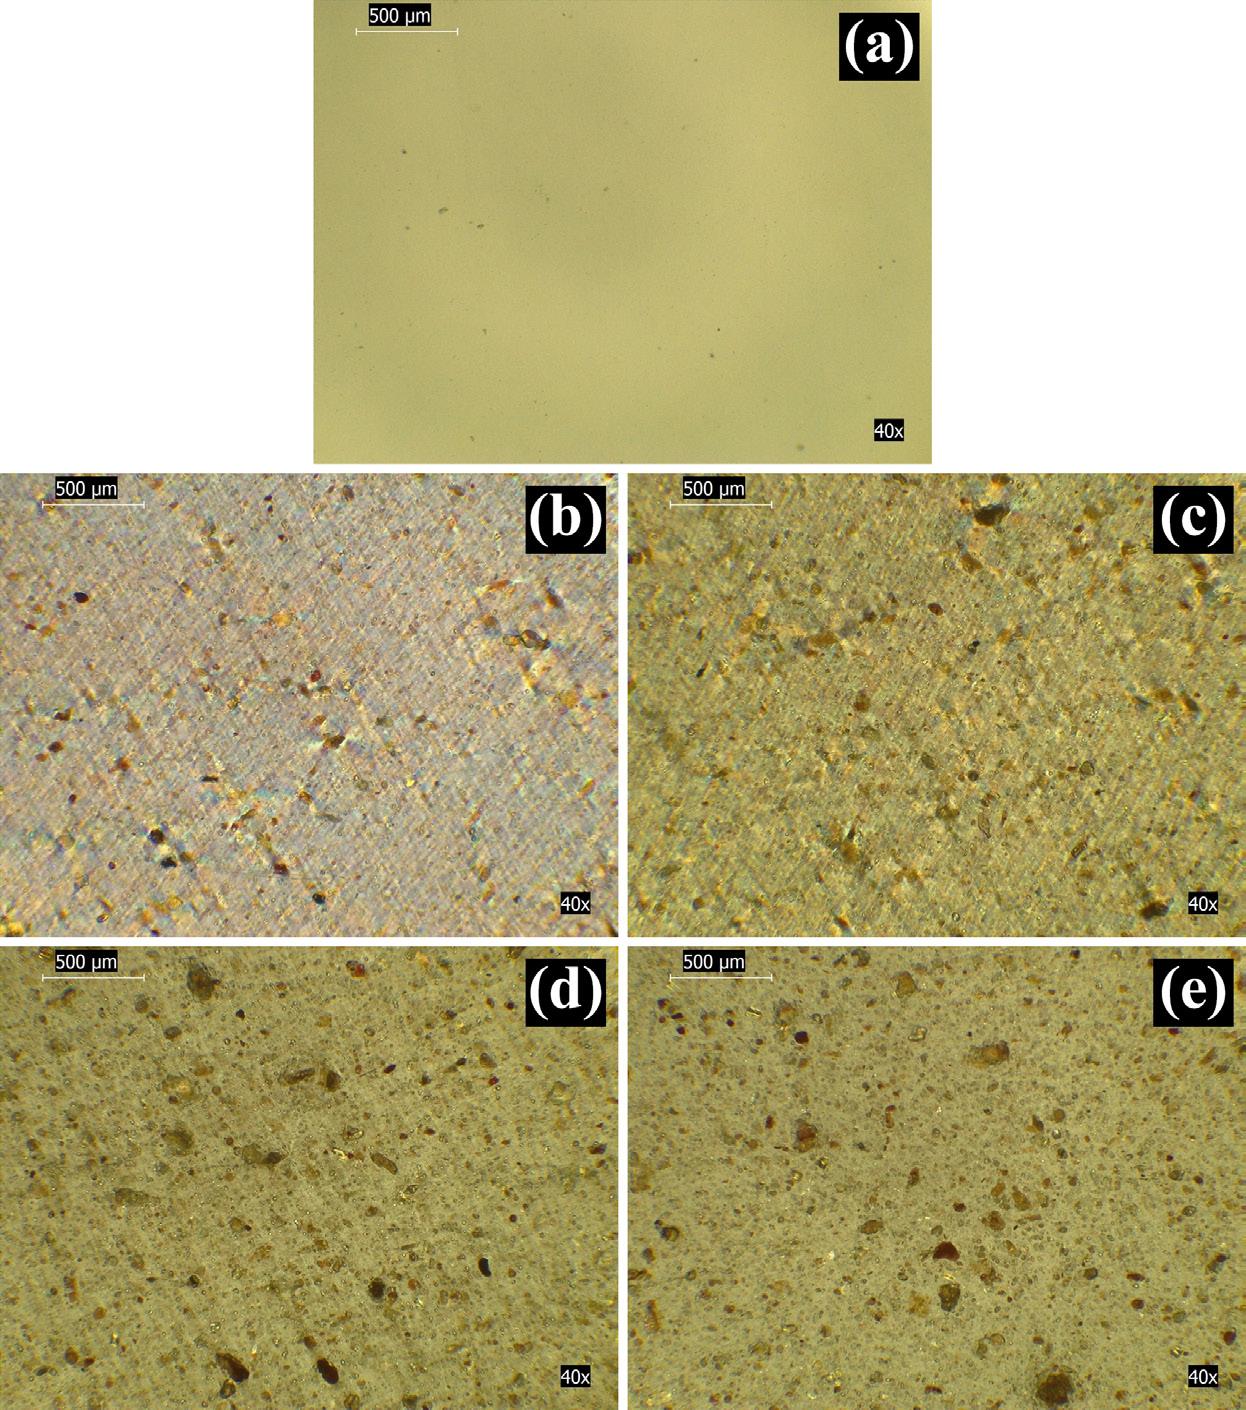
was present at some locations of the film. The observation of agglomerates is more visible at higher contents of BMF due to the increase in particle density, which results in the interaction between fine particles (cohesive forces) and, consequently, in forming these agglomerates. The minimal presence of large agglomerates in the films was mainly due to the mixing step between the PLA and the BMF in the internal mixer to produce the masterbatch.
3.7 Optical profilometry
Table 3 presents the topographic images in 2D and 3D (qualitative parameters) obtained by optical profilometry of the film surfaces. Table 4 presents the values of the quantitative parameters (RA, RP, and RV) obtained.
In general, all films presented a rough surface since, at first, the processing by flat-die extrusion influences this aspect. Surface roughness imposed by processing may be due to friction between the film, the flat-die, and the equipment rollers. For all images (2D and 3D), brightness and contrast correspond to the color palette next to the image[23]. The lowest height level in all cases refers to dark blue (valleys). In contrast, the highest level is given in red (peaks), suggesting that the film surface is asymmetrical and irregular. The neat PLA film showed the “smoothest” surface. Differently, for composite films, it was observed that
changes in roughness parameters were a function of flour content, with numerous randomly distributed valleys and peaks. The topographical differences between the composite films may demonstrate that the particles were not dispersed entirely in the polymer matrix (Figure 9).
The roughness parameters presented in Table 4 refer only to the profile in the vertical direction (valleys and peaks) and, therefore, do not provide information on the inclinations and shapes of the roughness nor the amount of existing roughness on the surface[24]. The fact that the neat PLA film presented a slightly higher RA value than the P/3F and P/5F film was due to the processing. This same film exhibited several surface lines due to the molten material flow during processing, which was most evident in its 3D topographic image. It is also worth mentioning that any impurity on the surface can influence the roughness parameters since no particles were incorporated intentionally for neat PLA film. Valleys are also called depressions associated with surface pores[25]. The dark regions observed in the 2D images can be related to these pores.
3.8 Contact angle (θ)
The contact angle characterizes the degree of wettability and can designate the hydrophilic or hydrophobic nature of the film surface. Generally, a contact angle less than 90° refers
Development by extrusion of composite films based on Poly(Lactic Acid)/Babassu Mesocarp Flour Polímeros, 34(1), e20240009, 2024 7/10
Figure 9. Optical micrographs: (a) Neat PLA, (b) P/3F, (c) P/5F, (d) P/8F, and (e) P/10F.
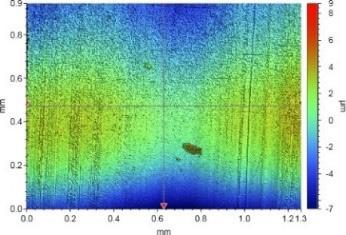
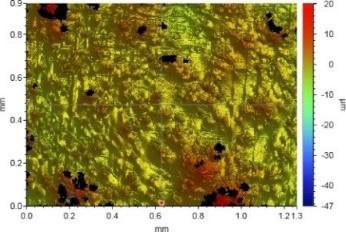
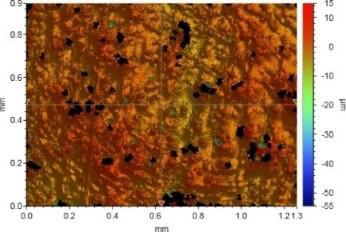
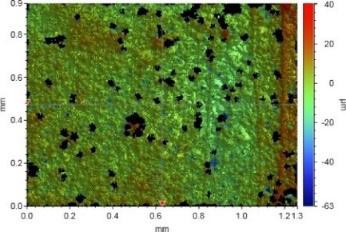
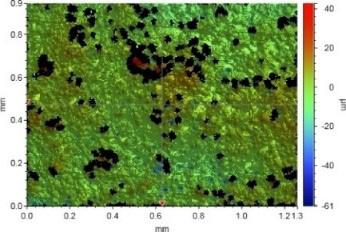
to a hydrophilic surface, while greater than 90° represents a hydrophobic surface[26]. Average values and representative images of the water droplet are shown in Table 5.
The contact angle of the neat PLA-based film was 80.76°, resulting in a hydrophilic surface. This result may be due to the hydroxyl and carbonyl groups (polar) present in the chemical structure of PLA. The incorporation of BMF slightly reduced the contact angle from 80.76° to values below 80° for composite films. The smaller the contact angle, the greater the surface affinity for the reference liquid, resulting in greater wettability. The angle reduction resulted in greater surface hydrophilicity of the composite films, related to the greater availability of hydroxyl groups from the starch in BMF. These groups can interact with water molecules on the film surface and reduce the contact angle.
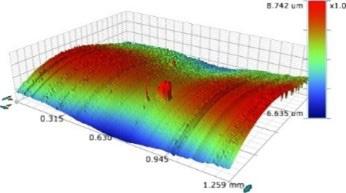
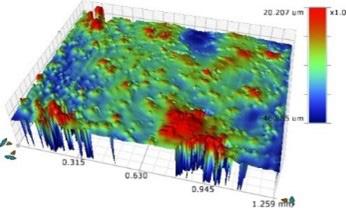
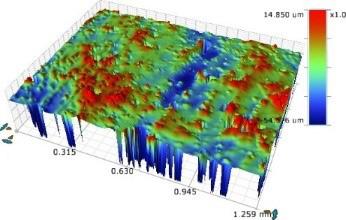
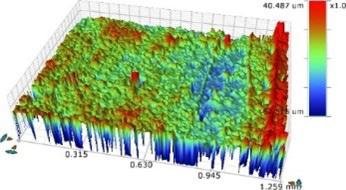
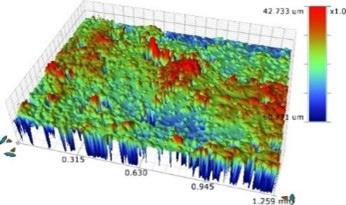
Caption: RA = average roughness; RP = maximum peak height; RV = maximum valley depth.
Although the composite films exhibited a hydrophilic character, the droplet remained stable on the film surface
Polímeros, 34(1), e20240009, 2024 8/10
Silva, L. R. C., França, R. A., Silva, R. N., Alves, T. S., Barbosa, R., Rios, A. O., & Santana, R. M. C.
Film Formulations Topographic Images 2D 3D
Table 3. Optical profilometry images showing the different topographic profiles.
Neat PLA
P/3F P/5F P/8F P/10F
Film Formulations Roughness Parameters (µm) RA RP RV Neat PLA 1.76 8.74 -6.64 P/3F 1.45 20.21 -46.89 P/5F 1.49 14.85 -54.58 P/8F 4.92 40.49 -62.52 P/10F 3.84 42.73 -60.77
Table 4. Surface roughness parameters values of the films produced.
Table 5. Contact angle value of the films and the representative image of the water droplet.
Neat PLA 80.76 ± 2.64
P/3F 79.40 ± 2.42
P/5F 76.73 ± 3.24
P/8F 79.62 ± 1.86
P/10F 78.22 ± 1.70
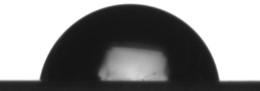


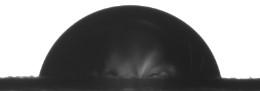
Data were expressed as mean ± standard deviation (n = 20).
without changes during the analysis, showing that the films are not hydrophilic enough to absorb the droplet. The images of the droplet did not reveal significant visual differences in its size, indicating minimal water absorption by the samples. Despite the surface roughness substantially influencing the contact angle value, there was no linear relationship between the analysis of the contact angle and the roughness results (Table 4). A less rough surface, that is, more homogeneous, provides a better droplet distribution on the surface, reducing the contact angle and, consequently, greater wettability. In contrast, the angle is greater for a rougher surface (more heterogeneous). Table 5 shows that the contact angle did not decrease linearly with the increase in flour content. This understanding is due to the surface heterogeneity caused by roughness that influences different contact angles in different parts of the same solid surface.
The result of the contact angle suggests that the application of the films should be directed, in principle, to low/intermediate moisture products, aiming at the structural integrity of the films. One of the essential properties of materials applied in packaging is the surface polarity, reflecting the interaction of the surface with the printing ink. So, higher polarity results in a more hydrophilic surface and better printability[27] This discussion is relevant because consumers consider the aesthetic presentation of the packaged product, which may be associated with the label printed on the package.
4. Conclusions
This manuscript highlighted a viable strategy to enhance and add value to BMF, an industrial by-product, through its incorporation into the PLA polymer matrix. The effect of different flour contents was investigated on the physical and surface properties of composite films produced by flat-die extrusion. The processing was satisfactory in producing continuous films, although some surface irregularities were observed. No chemical solvents were used, contributing to an
environmentally friendly production step. The research focused on the use of by-products incorporated into a polymer matrix for the development of composite materials is constantly growing, both in academia and industry, as they are materials that have many ecological advantages. Choosing the right package with the proper physical and surface properties is essential to ensure the safety and quality of packaged food. The films produced are good candidates for a potential application as a food packaging material, as the results showed interesting perspectives for such an application.
5. Author’s Contribution
• Conceptualization – Lucas Rafael Carneiro da Silva; Ruth Marlene Campomanes Santana.
• Data curation – Lucas Rafael Carneiro da Silva.
• Formal analysis – Lucas Rafael Carneiro da Silva.
• Funding acquisition – NA.
• Investigation – Lucas Rafael Carneiro da Silva; Ruth Marlene Campomanes Santana.
• Methodology – Lucas Rafael Carneiro da Silva; Railha Antunes de França; Raquel do Nascimento Silva; Ruth Marlene Campomanes Santana.
• Project administration – Ruth Marlene Campomanes Santana.
• Resources – Ruth Marlene Campomanes Santana; Renata Barbosa; Tatianny Soares Alves.
• Software – NA.
• Supervision – Ruth Marlene Campomanes Santana; Alessandro de Oliveira Rios.
• Validation – Lucas Rafael Carneiro da Silva; Ruth Marlene Campomanes Santana.
• Visualization – Lucas Rafael Carneiro da Silva.
• Writing – original draft – Lucas Rafael Carneiro da Silva.
• Writing – review & editing – Lucas Rafael Carneiro da Silva; Ruth Marlene Campomanes Santana; Alessandro de Oliveira Rios.
6. Acknowledgements
The authors want to acknowledge the Federal University of Rio Grande do Sul (UFRGS), Postgraduate Program in Mining, Metallurgical and Materials Engineering (PPGE3M), and National Council for Scientific and Technological Development (CNPq) [process number: 140519/2021-1]. We would also like to acknowledge the support of Daniel Eduardo Weibel, PhD, and Alexandra Aponte, scholarship holder (LAMAS/UFRGS).
7. References
1 Vidal, O. L., Santos, M. C. B., Batista, A. P., Andrigo, F. F., Baréa, B., Lecomte, J., Figueroa-Espinoza, M. C., Gontard, N., Villeneuve, P., Guillard, V., Rezende, C. M., BourlieuLacanal, C., & Ferreira, M. S. L. (2022). Active packaging films containing antioxidant extracts from green coffee oil by-products to prevent lipid oxidation. Journal of Food Engineering, 312, 110744 http://dx.doi.org/10.1016/j.jfoodeng.2021.110744
by extrusion of composite films based on Poly(Lactic
Polímeros, 34(1), e20240009, 2024 9/10
Development
Acid)/Babassu Mesocarp Flour
Film Formulations Contact Angle
Average Value Water Droplet Image
(°)
Silva, L. R. C., França, R. A., Silva, R. N., Alves, T. S., Barbosa, R., Rios, A. O., & Santana, R. M. C.
2 Flores-Silva, P. C., Hernández-Hernández, E., Sifuentes-Nieves, I., Lara-Sánchez, J. F., Ledezma-Pérez, A. S., Alvarado-Canché, C. N., & Ramírez-Vargas, E. (2023). Active mono-material films from natural and post-consumer recycled polymers with essential oils for food packaging applications. Journal of Polymers and the Environment, 31(12), 5198-5209 http:// dx.doi.org/10.1007/s10924-023-02943-6
3 United Nations Environment Programme. (2021). Annual Report 2021 Kenya: UNEP. Retrieved in 2023, December 21, from https://www.unep.org/annualreport/2021/index.php
4 Chen, C., Chen, W., Dai, F., Yang, F., & Xie, J. (2022). Development of packaging films with gas selective permeability based on Poly(butylene Adipate-co-terephthalate)/Poly(butylene Succinate) and its application in the storage of white mushroom (Agaricus bisporus). Food and Bioprocess Technology, 15(6), 1268-1283. http://dx.doi.org/10.1007/s11947-022-02794-4.
5 Raza, Z. A., & Anwar, F. (2018). Fabrication of poly(lactic acid) incorporated chitosan nanocomposites for enhanced functional polyester fabric. Polímeros: Ciência e Tecnologia, 28(2), 120-12 http://dx.doi.org/10.1590/0104-1428.11216
6. Bhagia, S., Bornani, K., Agrawal, R., Satlewal, A., Ďurkovič, J., Lagaňa, R., Bhagia, M., Yoo, C. G., Zhao, X., Kunc, V., Pu, Y., Ozcan, S., & Ragauskas, A. J. (2021). Critical review of FDM 3D printing of PLA biocomposites filled with biomass resources, characterization, biodegradability, upcycling and opportunities for biorefineries. Applied Materials Today, 24, 101078 http://dx.doi.org/10.1016/j.apmt.2021.101078
7 Barbosa, J. D. V., Azevedo, J. B., Araújo, E. M., Machado, B. A. S., Hodel, K. V. S., & Mélo, T. J. A. (2019). Bionanocomposites of PLA/PBAT/organophilic clay: preparation and characterization. Polímeros: Ciência e Tecnologia, 29(3), e2019045 http:// dx.doi.org/10.1590/0104-1428.09018.
8 Raj, S. S., Kannan, T. K., & Rajasekar, R. (2020). Influence of prosopis juliflora wood flour in poly lactic acid – developing a novel bio-wood plastic composite. Polímeros: Ciência e Tecnologia, 30(1), e2020012 http://dx.doi.org/10.1590/0104-1428.00120
9. Protásio, T. P., Trugilho, P. F., César, A. A. S., Napoli, A., Melo, I. C. N. A., & Silva, M. G. (2014). Babassu nut residues: potential for bioenergy use in the North and Northeast of Brazil. SpringerPlus, 3(1), 124 http://dx.doi.org/10.1186/2193-18013-124 PMid:24741469.
10. Yapuchura, E. R., Tartaglia, R. S., Cunha, A. G., Freitas, J. C. C., & Emmerich, F. G. (2019). Observation of the transformation of silica phytoliths into SiC and SiO2 particles in biomassderived carbons by using SEM/EDS, Raman spectroscopy, and XRD. Journal of Materials Science, 54(5), 3761-3777 http://dx.doi.org/10.1007/s10853-018-3130-6
11 Silva, L. R. C., Alves, T. S., Barbosa, R., Dal Pont Morisso, F., Rios, A. O., & Santana, R. M. C. (2023). Characterization of babassu mesocarp flour as potential bio-reinforcement for Poly (Lactic Acid). Journal of Food Industry, 7(1), 24-53 http://dx.doi.org/10.5296/jfi.v7i1.21066
12. Bernhardt, D. C., Pérez, C. D., Fissore, E. N., De’Nobili, M. D., & Rojas, A. M. (2017). Pectin-based composite film: effect of corn husk fiber concentration on their properties. Carbohydrate Polymers, 164, 13-22 http://dx.doi.org/10.1016/j. carbpol.2017.01.031 PMid:28325309.
13. Cao, C., Wang, Y., Zheng, S., Zhang, J., Li, W., Li, B., Guo, R., & Yu, J. (2020). Poly (butylene adipate-co-terephthalate)/ titanium dioxide/silver composite biofilms for food packaging application. Lebensmittel-Wissenschaft + Technologie, 132, 109874 http://dx.doi.org/10.1016/j.lwt.2020.109874
14 Rosato, D. V., Rosato, D. V., & Rosato, M. V. (2004). Plastic product material and process selection handbook. UK: Elsevier Advanced Technology http://dx.doi.org/10.1016/B978-185617-431-2.X5000-2
15 Giles, H. F., Jr., Mount, E. M., 3rd, & Wagner, J. R., Jr. (2004). Extrusion: the definitive processing guide and handbook. USA: William Andrew.
16 Dhadwal, R., Banik, S., Doshi, P., & Pol, H. (2017). Effect of viscoelastic relaxation modes on stability of extrusion film casting process modeled using multi-mode Phan-Thien-Tanner constitutive equation. Applied Mathematical Modelling, 47, 487-500 http://dx.doi.org/10.1016/j.apm.2017.03.010
17 Barlow, C. Y., & Morgan, D. C. (2013). Polymer film packaging for food: an environmental assessment. Resources, Conservation and Recycling , 78 , 74 - 80 . http://dx.doi.org/10.1016/j. resconrec.2013.07.003
18 Guimarães, B. M. R., Scatolino, M. V., Martins, M. A., Ferreira, S. R., Mendes, L. M., Lima, J. T., Guimarães, M., Jr., & Tonoli, G. H. D. (2022). Bio-based films/nanopapers from lignocellulosic wastes for production of added-value micro-/ nanomaterials. Environmental Science and Pollution Research International, 29(6), 8665-8683 http://dx.doi.org/10.1007/ s11356-021-16203-4. PMid:34490567.
19 Bechert, M. (2020). Non-Newtonian effects on draw resonance in film casting. Journal of Non-Newtonian Fluid Mechanics, 279, 104262 http://dx.doi.org/10.1016/j.jnnfm.2020.104262
20 Ahmed, S., & Ikram, S. (2016). Chitosan and gelatin based biodegradable packaging films with UV-light protection. Journal of Photochemistry and Photobiology. B, Biology, 163, 115-124 http://dx.doi.org/10.1016/j.jphotobiol.2016.08.023 PMid:27560490.
21 Harms, S., Rätzke, K., Faupel, F., Schneider, G. J., Willner, L., & Richter, D. (2010). Free volume of interphases in model nanocomposites studied by positron annihilation lifetime spectroscopy. Macromolecules, 43(24), 10505-10511. http:// dx.doi.org/10.1021/ma1022692
22 Bilck, A. P., Grossmann, M. V. E., & Yamashita, F. (2010). Biodegradable mulch films for strawberry production. Polymer Testing, 29(4), 471-476 http://dx.doi.org/10.1016/j. polymertesting.2010.02.007
23 Albuquerque, M. D. F., Bastos, D. C., Ţălu, Ş., Matos, R. S., Pires, M. A., Salerno, M., Fonseca Filho, H. D., & Simão, R. A. (2022). Vapor barrier properties of cold plasma treated corn starch films. Coatings, 12(7), 1006 http://dx.doi.org/10.3390/ coatings12071006
24 Bhushan , B. ( 2000 ). Surface roughness analysis and measurement techniques. In B. Bhushan (Ed.), Modern tribology handbook (pp. 79-150). USA: CRC Press http:// dx.doi.org/10.1201/9780849377877-10
25 Waduge, R. N., Xu, S., & Seetharaman, K. (2010). Iodine absorption properties and its effect on the crystallinity of developing wheat starch granules. Carbohydrate Polymers, 82(3), 786-794 http://dx.doi.org/10.1016/j.carbpol.2010.05.053
26. Kasai, D., Chougale, R., Masti, S., Chalannavar, R., Malabadi, R. B., Gani, R., & Gouripur, G. (2019). An investigation into the influence of filler piper nigrum leaves extract on physicochemical and antimicrobial properties of Chitosan/ Poly (Vinyl Alcohol) blend films. Journal of Polymers and the Environment, 27(3), 472-488 http://dx.doi.org/10.1007/ s10924-018-1353-x
27 Esmaeili, M., Pircheraghi, G., Bagheri, R., & Altstädt, V. (2019). Poly(lactic acid)/coplasticized thermoplastic starch blend: effect of plasticizer migration on rheological and mechanical properties. Polymers for Advanced Technologies, 30(4), 839-851 http://dx.doi.org/10.1002/pat.4517
Received: Dec. 21, 2023
Revised: Jan. 29, 2024
Accepted: Feb. 05, 2024
Polímeros,
10/10
34(1), e20240009, 2024
Bio-high density polyethylene films embedded with organoclay and zinc pyrithione
Priscylla Jordânia Pereira de Mesquita1 , Cristiano José de Farias Braz1 , Tatianny Soares Alves1 and Renata Barbosa1*
1Laboratório de Polímeros e Materiais Conjugados – LAPCON, Centro de Tecnologia, Universidade Federal do Piauí – UFPI, Teresina, PI, Brasil *rrenatabarbosa@yahoo.com
Obstract
Bio-high density polyethylene (BHDPE) films with organoclay and antimicrobial additives (zinc pyrithione) were evaluated. The composites were prepared in a single-screw extruder using the melt intercalation technique, and the films were obtained by flat extrusion. The diffractograms indicated the formation of an intercalated nanocomposite (BHDPE/6 wt% of clay). Infrared spectra suggested that the polymer predominates over the antimicrobial agent bands. Thermal stability was slightly reduced by up to 3°C. The clay and antimicrobial agent reduced the melting point and crystallinity of BHDPE by up to 12 °C and 13.3%, respectively. In addition, the presence of clay and antimicrobial agent significantly (p < 0.05) affected all mechanical properties. Proliferation of Staphylococcus aureus demonstrated that both evaluated additives did not significantly (p > 0.05) inhibit microbial growth. The results emphasize a promising application of the films for packaging that does not require antimicrobial control, with films highlighted by 6 wt% of clay.
Keywords: cloisite 20a®, flat films, microbial activity.
How to cite: Mesquita, P. J. P., Braz, C. J. F., Alves, T. S., & Barbosa, R. (2024). Bio-high density polyethylene films embedded with organoclay and zinc pyrithione. Polímeros: Ciência e Tecnologia, 34(1), e20240010. https://doi. org/10.1590/0104-1428.20230100
1. Introduction
The change in habits and the increase in consumerism in recent decades led to technological innovations and, consequently, to the greater production of consumer goods, which led to an increase in the production of packaging[1] . Current packages have specific functions and information to improve quality and food safety. They must increase shelf life and monitor the safety and quality of packaging products. Nanotechnology can extend the essential functions of packaging: containment, protection and preservation, and marketing[2] .
Among the innovations in the plastic packaging, those produced from green polyethylene or biopolyethylene (BPE)[2,3]. This material has less environmental impact during its synthesis, processing, or degradation than conventional polymers[3]. It has the same functions, characteristics, and applications as polyethylene (PE) derived from fossil resources. However, BPE uses 70% less fossil fuels and emits approximately 170% less greenhouse gases than PE derived from petroleum. In this way, it becomes a viable alternative to conventional polymers for packaging high-consumption products, such as food packaging[4] .
In this scenario, plastic packaging transformed to become more attractive. It now has known features like active packaging. These active packages have a system that predicts or estimates food quality and safety[5]. It also releases substances that prolong the shelf life of the product.
Among these innovations, antimicrobial packaging stands out for offering additional protection against microorganisms[6]
Generally, antimicrobial additives are divided into organic and inorganic systems. Organic materials include phenols, halogenated compounds[7], and quaternary ammonium salts[8]. Inorganic materials include metals[9], phosphates [10] , oxides[11], and organoclays[12,13] .
Metal complexes, including palladium[14], copper, nickel[15], silver, cadmium[15], present an alternative for incorporation antimicrobial agents. Zinc pyrithione (ZPT), a zinc complex, appears as an option because it is often used in personal care products, such as shampoos and soaps, due to its antifungal and antibacterial properties[16]
The ZPT has a melting point of 240 °C, which allows for easy processing with most thermoplastics and elastomers, demonstrating compatibility with PE when dispersed in an ethylene vinyl acetate (EVA) matrix[6]
It is pertinent to highlight that the European Cosmetics Regulation[17] classifies zinc pyrithione as having reproductive toxicity, making it banned in EU cosmetics since March 2022. On the other hand, the US Food and Drug Administration (FDA)[18] indicates ZPT as an antimicrobial agent to inhibit bacterial growth on the surface of films made of polyolefin and polyester.
Many studies have evaluated the antimicrobial action of low-density polyethylene (LDPE) films with ZnO[9,19] .
https://doi.org/10.1590/0104-1428.20230100 O O O O O O O O O O O O O O O Polímeros, 34(1), e20240010, 2024 ISSN 1678-5169 (Online) 1/9
P. J. P., Braz, C. J. F., Alves, T. S., & Barbosa, R.
Galli et al.[6] studied the effect of ZnO in the LDPE/ EVA blend, and Rokbani et al.[20] analyzed the effect of ZnO on LDPE compatibilized with maleic anhydride. Conversely, there are also studies examining the utilization of organoclay, such as Cloisite 15A, 20A, or 30B, as an antimicrobial agent incorporated into PE[21], LDPE[22] , and linear low-density polyethylene (LLDPE)[23]. These inquiries indicate that Cloisite 20A clay emerges as a promising alternative for imparting antimicrobial attributes to polymeric films.
Therefore, this study aimed to evaluate and compare the microbial activity of bio-high density polyethylene (BHDPE) films incorporated with organoclay (Cloisite 20A®)[21-23] and zinc pyrithione dispersed in EVA[6]. The films were produced by flat extrusion using the melt intercalation technique and characterized by X-ray diffraction (XRD), Fourier transform infrared spectroscopy (FTIR), thermogravimetry (TGA), differential scanning calorimetry (DSC), and tensile test. The antimicrobial activity was assessed against Staphylococcus aureus
2. Materials and Methods
2.1 Materials
Bio-high-density polyethylene (BHDPE), grade SGM9450F, contains at least 96% bio-based (ASTM D6866), melt flow rate of 0.33 g/10min (190 ºC/5.0kg -ASTM D1238), was used as received and supplied by BRASKEM (Camaçari, Brazil). The filler incorporated into the BHDPE matrix was Cloisite 20A®, provided by Southern Clay Products (Gonzales, Texas, USA). A commercial antimicrobial agent, marterbach zinc pyrithione dispersed in EVA, Sanitized® MB E 22-70 (Burgdorf, Switzerland), was used as received[24]
Strains of Staphylococcus aureus (ATCC 25923 - Grampositive) were cultured as target microorganism to evaluate antimicrobial activity. Brain Heart Infusion Broth (BHI) broth agar was used as a culture medium.
2.2 Preparation of nanocomposite films
Samples of BHDPE/Cloisite 20A® and BHDPE/ Sanitized® MB E 22-70 (Table 1) were extruded in a single screw extruder AX Plásticos AX-16 (Diadema, Brazil), operating with temperature zones (200, 205, and 210 °C) and screw speed at 50 rpm, as previously reported[25]. The films were prepared in the same single-screw extruder with the same temperature profile and screw speed of 60 rpm using a flat die of 220 mm width and cylindrical cooling rollers. The formulation of the samples are in Table 1.
2.3 Characterization of films
2.3.1 X-ray diffraction
The crystalline parameters of the films and organoclay were determined using a Shimadzu XRD 6000 (Kyoto, Japan) diffractometer operating in the angular range (2θ) from 5 to 50° using CuKα radiation (λ = 1.5418 Å).
2.3.2 Fourier transform infrared spectroscopy
Changes in the FTIR characteristic band evaluated the interaction between BHDPE, organoclay, and antimicrobial agent. Fourier transform infrared spectroscopy (FTIR) analyses were performed on a Perkin Elmer SPECTRUM 400 (FT-IR/FT-NIR) (Waltham, Massachusetts, USA) spectrometer scanning from 650 to 4000 cm-1 with resolution of 4 cm-1
2.3.3Thermal analysis
The thermal stability of the samples was analyzed by thermogravimetry (TGA/DTG) and the thermal behavior and crystallinity of the films were analyzed by differential scanning calorimetry (DSC) using a TA Instrument SDT Q600 V20.9 Build 20 (New Castle, Delaware, USA) equipment, operating at a heating rate of 10 °C.min-1 , from room temperature to 550 °C, under argon gas flow (100 mL.min-1). The degree of crystallinity (Xc) of the samples was calculated by Equation 1[26]:
cmm XH/1wH100%
where ΔH m is the measured heat of fusion, o m H∆ is the heat of fusion of 100% crystalline HDPE (293 J.g-1)[27], and w is the weight fraction of organoclay or antimicrobial agent in the polymer matrix. These thermal analyses provide crucial insights into the behaviors of materials in films, which are fundamental for evaluating their suitability in specific applications[28]
2.3.4 Tensile test
The mechanical behavior of the properties (elastic modulus, strength, and elongation at break) were evaluated according to ASTM D882-18[29] in a Shimadzu AGS-X universal testing machine with a speed of 20 mm.min-1 and a load cell of 5 kN. Five test specimens were analyzed for each composition in dimensions 120 x 25 mm2. Properties were reported in terms of mean ± standard deviation. Tukey’s test for post hoc comparisons evaluated the effect of compositions on each property, considering a significance level of 5% (p < 0.05).
Formulations expressed in wt% in relation to the polymeric matrix.
Polímeros, 34(1), e20240010, 2024 2/9
Mesquita,
(
{ } o
=∆−∆× (1)
)
Sample BHDPE Cloisite 20A® Sanitized® MB E 22-70 BHDPE 100.0 -PC3 97.0 3.0PC6 94.0 6.0PB1 99.5 - 0.5 PB2 99.0 - 1.0
Table 1. Formulation of the samples.
2.3.5 Antimicrobial
activity
Staphylococcus aureus (ATCC 25923 - Gram-positive) was used as the target microorganism to evaluate antimicrobial activity[12,13]. The strain was first cultured in brain heart infusion (BHI) agar and placed in an incubator BOD Lucadema Luca 161/01 (São José do Rio Preto, Brazil) at 37 ºC for 24 h. Subsequently, films incorporated with the antimicrobial agent were submerged in a suspension containing approximately 106 CFU.mL-1 of bacteria were used to contaminate the samples and 10 ml of BHI broth[30]. As a positive control, test tubes containing only BHI broth and bacterial suspension, and as a negative control, test tubes with BHI broth and BHDPE were used. All test tubes were incubated at 37°C for 4 h. Then, serial dilutions were performed, seeded in Petri dishes containing standard agar for counting and incubated at 37°C for 48 h. The test was performed in triplicate, and the results were expressed in colony-forming units per milliliter (CFU.mL-1). Antimicrobial activity was evaluated based on antimicrobial performance and sensitivity standards[30,31]. The effect of different compositions on antimicrobial activity was statistically evaluated by Tukey’s test for post hoc comparisons, considering a significant difference of 5%.
3. Results and Discussions
3.1 Structural characterization
XRD diffraction patterns of organoclay (Cloisite 20A®), pure BHDPE, and their films containing clay (PC3 and PC6) and antimicrobial additive (PB1 and PB2) are in Figure 1
Three crystalline peaks on BHDPE can be verified (Figure 1-a), the most intense in the angular range at 2θ = 21.5º corresponding to the (110) plane, the other two less intense at 2θ = 23.9º and 2θ = 36.4º corresponding to the (200) and (020) plans, respectively. These data corroborate the semicrystalline of BHDPE[25], and the peaks match the specific crystallographic planes. Cloisite 20A® has characteristic peak at 2θ = 3.40º corresponding to (001) plane associated with the galleries that are expanded by the presence of organic salt, as well as the peaks at 2θ equal to 7.06º corresponding to the (002) plane, corroborating the data reported in the literature[32].
The diffraction planes (position 2θ) were slightly shifted to smaller angles with basal distance d001 = 2.64 nm in organophilic clay to 2.63 nm and 2.97 nm in systems PC3 and PC6, respectively (Figure 1-b). This displacement suggests that there was even a partial interlacing of the polymeric chains between the clay layers. The formation of a possible intercalated/exfoliated nanocomposite in PC6 film, as previously reported[33]. Dias et al.[33] systematically examined the structural attributes of polyurethane nanocomposites containing inorganic particles, specifically synthetic talc and organophilic clay. At the same time, the plans incorporating the antimicrobial additive did not change the structure of the polymeric matrix. Similar results were found in different nanocomposites HDPE/chlorhexidine diacetate[34]
3.2 Infrared spectroscopy (FTIR)
Infrared spectra in the region of 500 to 4000 cm-1 of pure BHDPE, Cloisite 20A® clay, antimicrobial agent, and their films containing clay (PC3 and PC6) and antimicrobial additive (PB1 and PB2) are in Figure 2.
BHDPE infrared spectrum presents transmission bands close to 2900 and 1450 cm-1, which correspond to the axial and angular deformation movements of the C–H bonds, respectively, and close to 1380 cm-1, which corresponds to the symmetric angular deformation of the methyl group[35] . The band at 720 cm-1 refers to the C–H vibration of the –CH2– groups of the amorphous part[36] .
Cloisite 20A® clay spectrum has a considerable absorption at 1023cm-1 attributed to the extension of the Si-O band[37] Characteristic bands of BHDPE were maintained in the PB1 and PB2 systems and possibly overlapped those of the antimicrobial additive due to the low content. It detected a small band close to 1000 cm-1 in PC3 and PC6 films, referring to the Si-O bond[38] .
The bands at 3636 and 3395 cm-1 are attributed to O–H stretching from silicate and water, respectively. At 1639 cm-1 is related to O–H bending, and 1040 cm-1 is due to Si–O–Si stretching vibration from silicate[39] . According to Cervantes-Uc et al.[39], some bands in organoclay samples spectra which cannot exhibited in the sodium clays.
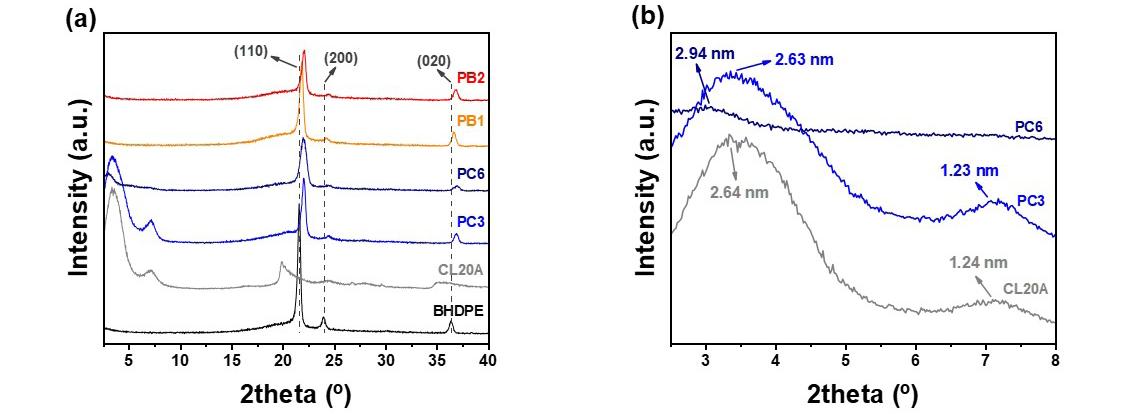
Polímeros, 34(1), e20240010, 2024 3/9
Bio-high density polyethylene films embedded with organoclay and zinc pyrithione
Figure 1. (a) X-ray diffraction patterns of BHDPE, clay, PC3, PC6, PB1 and PB2 systems, and (b) detail of the displacement of the characteristic clay peaks in the PC3 and PC6 systems.
P. J. P., Braz, C. J. F., Alves, T. S., & Barbosa, R.
These bands were attributed to C–H vibrations of asymmetric stretching, symmetric stretching and bending of the methylene groups located at 2924, 2842 and 1475 cm-1, respectively, in the chemical structure of the surfactant.
According to Zhang et al.[40], the powerful absorption at 1050 cm-1 may be assigned to the Si–O stretch. The 3000 and 1500 cm-1 regions which are attributed to C–H stretching and bending, respectively, from the organic portion of the organoclays. The characteristic peaks of alkylammonium can occur at 2926 and 2852 cm-1 and are assigned to asymmetric stretch vibration of –CH3 and –CH2, respectively. The band at 1470 cm-1 is attributed to the
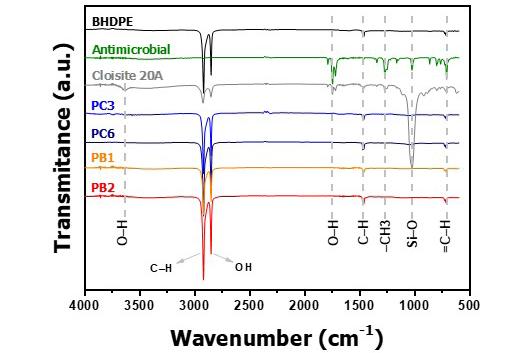
symmetrical stretching vibration of –CH2. Similar results for Closite 20A clay were reported by Naderi-Samani et al.[41] According to Pittol et al.[42], the pirithione structure is shown in the band at 763 cm-1, attributed to aromatic =C–H out-of-plane deformation vibrations.
3.3 Thermal stability
TGA/DTG thermograms of BHDPE and their films containing clay (PC3 and PC6) and antimicrobial additives (PB1 and PB2) are in Figure 3. Nanocomposite films exhibited thermal stability similar to the control film (pure BHDPE) (Figure 3a). The degradation initiation temperature (T10), referring to a 10% mass loss, the 50% mass loss (T50), the peak temperature decomposition (Tp) (DTG peak in Figure 3b) and the percentage of residue at 550ºC (R%) are reported in Table 2.
The T10 of BHDPE starts around 400ºC[25,43], and there was no variation for PB1, PB2, PC3, and PC6 systems, as shown in Figure 3 and Table 2. The clay and antimicrobial additive did not affect the film degradation temperatures (T10 and T50). Similar results were found in nanocomposites of LDPE/EVA/graphene oxide[43]
From T p values, it was verified that PC3 and PC6 presented a reduction of approximately 7ºC, PB2 of 3ºC, and PB1 maintained this temperature compared with BHDPE film. Thus, the clay decreased the degradation temperature, while the antimicrobial additive did not compromise the thermal stability, according to the percentage of residue at 550ºC (Table 2). The residue values at 550ºC were consistent with previously reported works using LDPE/EVA[25,42] and HDPE/clay[21,23]
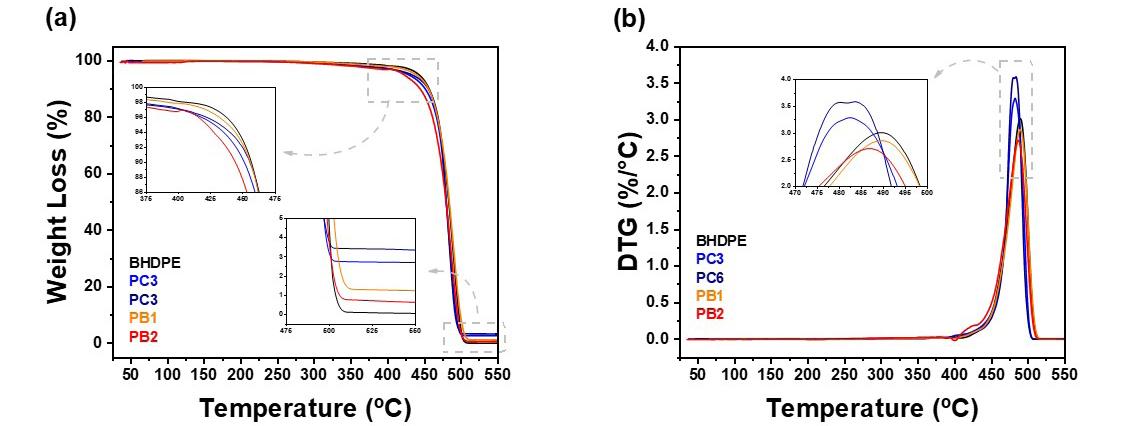
Polímeros, 34(1), e20240010, 2024 4/9
Mesquita,
T10 (ºC) T50 (°C) T p (°C) R% (at 550ºC) BHDPE 456.6 483.2 489.4 0.08 PC3 451.1 479.8 482.3 2.70 PC6 455.5 479.9 483.4 3.34 PB1 455.8 484.1 489.5 1.25 PB2 454.3 479.6 486.7 1.89
Table 2. Thermal decomposition of the BHDPE, PB1, PB2, PC3, and PC6 systems and its residue. Samples
Figure 2. Infrared spectra of the BHDPE, Cloisite 20A® clay, antimicrobial agent, PB1, PB2, PC3, and PC6 systems.
Figure 3. (a) TGA and (b) DTG of BHDPE, PB1, PB2, PC3, and PC6 systems.
3.4 Thermal behavior
Changes in the thermal transitions is verified through the results obtained by the DSC analyses. The thermal properties obtained: a melting temperature (Tm), heat of fusion (∆Hm), and degree of crystallinity (Xc) are in Table 3
The essential parameters for studying thermal properties were Tm and Xc. BHDPE had a Tm around 130°C[25,44,45] . Compositions with clay reduced of approximately 5°C for PC3 and 18°C for PC6 relative to BHDPE. Previous studies with HDPE and incorporation of 5 and 10 wt% of montmorillonite clay[44] indicated a reduction in thermal stability for samples with 5 wt% of clay and an improvement in strength for those with 10 wt% of clay. Films with antimicrobial additives (PB1 and PB2) also reduced 12°C, possibly due to the EVA matrix responsible for carrying the antimicrobial agent.
As shown in Table 3, the evaluated Xc was lower about BHDPE, to a lesser extent for films with clay and films with antimicrobial additives. This behavior suggests that the EVA that supports the antimicrobial agent acted in the plasticization of polyethylene. Previous studies with LDPE/EVA/graphene oxide nanocomposites [44] noted a decrease in Tm and Xc in systems containing only PE and EVA due to the partial miscibility of these two polymers.
3.5 Mechanical behavior
BHDPE films and their systems with additions of clay (PC3 and PC6) and antimicrobial additive (PB1 and PB2) were analyzed in uniaxial tensile tests, whose stress-strain curves are represented in Figure 4, and the mechanical properties (yield stress, tensile strength, strain at break, elastic modulus) are present in Table 4
Generally, the predominance of ductile behavior can be observed where the material presents elastic behavior at
low deformations. After a specific stress, the film plastically deforms up to the rupture stress[45]. The BHDPE films obtained a tensile strength of 58.8 ± 7.6 MPa, while the PC3 and PC6 films showed a reduction of 34.3% and an increase of 41.5%, respectively. The decrease in resistance for PC3 indicated the formation of agglomerates in the polymeric matrix, suggesting a microcomposite structure. The clay particle agglomerates acted as defects, altering the mechanical behavior[8]. This behavior has been reported in several previous studies with bamboo fiber and particulate coconut shell hybrid PVC composite[46] and polysulfone/ZnO composites[47]. Also, comparing the behavior of the PC3 film with the BHDPE, there is a minor deformation with an increase in the modulus of elasticity[48]
However, for PC6 films, an increase in tensile strength, deformation, and modulus of elasticity was observed, indicating that the clay in this composition was better dispersed[49] , corroborating the formation of a nanocomposite (Figure 1-b).
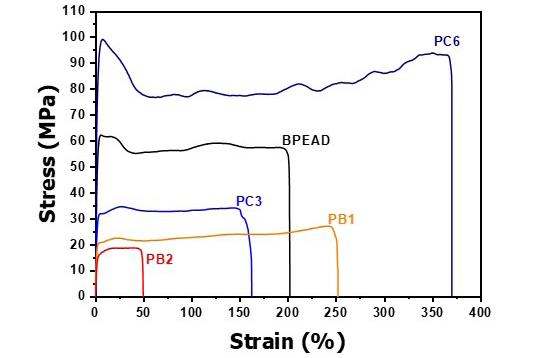
4. Representative stress-strain curves of BHDPE, PC3, PC6, PB1, and PB2 films.
Different letters (a-d) indicate a significant difference between the treatments by Tukey’s test (p < 0.05).
Bio-high density polyethylene films embedded with organoclay and zinc pyrithione Polímeros, 34(1), e20240010, 2024 5/9
Samples Tm (°C) ΔH m (J.g-1) Xc (%) BHDPE 139.2 134.7 46.0 PC3 134.1 115.6 39.5 PC6 121.3 119.4 40.8 PB1 127.4 96.4 32.9 PB2 127.2 95.8 32.7
Table 3. Thermal properties of BHDPE, PC3, PC6, PB1, and PB2 systems.
Material Yield Stress (MPa) Tensile Strength (MPa) Strain at Break (%) Elastic Modulus (MPa) BHDPE 58.2 ± 7.1b 58.8 ± 7.6b 291.4 ± 11.1b 1384.8 ± 38.6c PC3 33.1 ± 0.8c 38.6 ± 4.7c 231.7 ± 10.7c 2692.2 ± 25.9b PC6 91.5 ± 12.9a 83.2 ± 12.9a 335.1 ± 12.9a 5794.0 ± 82.1a PB1 25.7 ± 1.4c 29.3 ± 1.1cd 253.0 ± 4.8c 1366.2 ± 56.3c PB2 15.3 ± 2.0c 18.2 ± 2.0d 50.7 ± 6.4d 517.7 ± 38.0d
Table 4. Mechanical properties of BHDPE, PB1, PB2, PC3, and PC6 systems.
Figure
Mesquita, P. J. P., Braz, C. J. F., Alves, T. S., & Barbosa, R.
The mechanical properties are influenced by the aspect ratio of charge, degree of charge dispersion in the polymeric matrix, and charge adhesion at the matrix interface. Antagonistic results due to the increase in clay content have already been reported[26] as in aluminum oxide (Al2O3) nanoparticles[49]
The antimicrobial additive affected the tensile strength. This property was reduced by almost 50% and 70% for PB1 and PB3 films, respectively. However, the lowest content of the microbial agent (PB1) did not significantly affect (p < 0.05) the modulus of concerning the pure BHDPE film. Nevertheless, the PB2 films showed a drastically reduced elastic modulus value, a recorded reduction of 62.9%. This behavior is related to the presence of EVA, the masterbach matrix that contains the antimicrobial additive. The increase in EVA content implies a reduction in crystallinity[50], as already reported by the DSC analyses ( Table 3 ), and, consequently, may have promoted an increase in the mobility of the amorphous phases which causes a decrease in rigidity. Similar results were reported in previous studies due to the presence of EVA in PE/EVA/ZnO nanocomposites[6] and in the HDPE/EVA blend[50]
3.6 Antimicrobial activity
The antimicrobial activity behavior of BHDPE and its systems containing Cloisite 20A® and antimicrobial additives using the method of diffusion in liquid medium by Staphylococcus aureus bacteria is showen in Figure 5. Values for colony forming units ranged from 0.72 to 0.78 CFU.mL-1 and did not show significant difference (p > 0.05). Indicating that the presence of clay and commercial antimicrobial agent behaved similarly to pure polymer. Skoura et al.[13] found no significant difference in antimicrobial activity against S. aureus when comparing the poly(caprolactone) matrix with intercalated nanocomposites filled with saponite clay organophilically modified using dimethyldioctadecylammonium bromide.
Organically modified clays can present antimicrobial activity due to the quaternary ammonium compounds that act in the adsorption of the microbial cell surface, diffusion, and disruption of the cytoplasmic membrane, causing cell death[12,21,22]. The antimicrobial action of
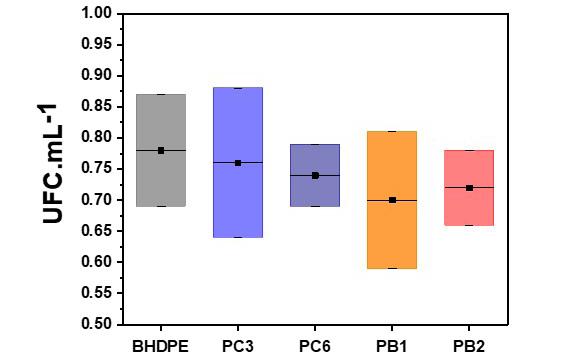
quaternary ammonium compounds depends on their chemical structure, and the more hydrophobic ones, such as those present in Cloiste 20A®, may not impact microbial communities due to their low availability in the aqueous phase[8]. On the other hand, the selected commercial antimicrobial agent, Sanitized® MB E 22-70, disrupts the cellular metabolic process of unwanted microorganisms like bacteria and fungi[24]
The results corroborate that the amount of colonyforming units for PC3, PC6, PB1, and PB2 were close to that of BHDPE, which was the negative control. Studies with 2-vinyl pyridine-styrene-divinylbenzene copolymers in contact with the bacteria Escherichia coli did not show bactericidal activity for any of the evaluated concentrations[50]. Similar behavior was reported in the study with reduced graphene oxide composites prepared by poly(3-(3’-thienyloxy)-propyltrimethyl-ammonium bromide) grafting[51]
The antibacterial capacity of polymers depends not only on the efficiency of the introduced bactericidal group but also on the content of these groups and their accessibility by the contaminated solution[21,22]. For packaging applications that require this antimicrobial control, it is necessary to develop polymeric supports with a physical-chemical structure that favors migration to the film surface and consequent diffusion in the medium.
The intercalated/exfoliated structure is characterized by the interaction between the barrier effect of clay particles and the catalytic effect of residual surfactant salts, which possibly impacted the predicted antimicrobial efficacy of organophilic clays[52]
4. Conclusions
In this work, BHDPE flat films and their films containing Cloisite 20A® organoclays (PC3 and PC6) and antimicrobial additive (zinc pyrithione dispersed in EVA) (PB1 and PB2) were developed evaluated. The addition of the antimicrobial additive did not promote changes in the crystalline structure of BHDPE. However, the addition of clay promoted displacement of the refraction peaks with increased in the basal interplanar distance, suggesting the formation of an intercalated/exfoliated nanocomposite. By FTIR spectra, it was noted the presence of clay into nanocomposites. Howerver, it was impossible to differenciate the characteristic bands of EVA since there may have been overlapping of the bands or because of the low content in the composition. The degradation temperature did not change for PB1, but there was a 3°C reduction for the other films compared to pure BHDPE. A melting temperature and crystallinity were reduced in all systems. Both additives significantly affect (p < 0,05) all mechanical properties, with better results for films with 6 wt% of clay (PC6), and the different content of additives did not significantly reduce (p > 0.05) the proliferation of Staphylococcus aureus bacteria. Finally, it believes that flat films with promising properties were developed for application in packages that do not require biological control.
Polímeros, 34(1), e20240010, 2024 6/9
Figure 5. Counting of seed colony forming units of Staphylococcus aureus. The means are not significantly different (p > 0.05).
5. Author’s Contribution
● Conceptualization – Renata Barbosa; Tatianny Soares Alves.
● Data curation – Priscylla Jordânia Pereira de Mesquita.
● Formal analysis – Priscylla Jordânia Pereira de Mesquita.
● Funding acquisition – Renata Barbosa.
● Investigation – Renata Barbosa; Tatianny Soares Alves; Priscylla Jordânia Pereira de Mesquita.
● Methodology – Priscylla Jordânia Pereira de Mesquita.
● Project administration – Renata Barbosa.
● Resources – Renata Barbosa; Tatianny Soares Alves.
● Software – Priscylla Jordânia Pereira de Mesquita; Cristiano José de Farias Braz.
● Supervision – Renata Barbosa; Tatianny Soares Alves.
● Validation – NA.
● Visualization – NA.
● Writing – original draft – Priscylla Jordânia Pereira de Mesquita; Cristiano José de Farias Braz.
● Writing – review & editing – Renata Barbosa; Tatianny Soares Alves.
6. Acknowledgements
The authors extend their appreciation to Universidade Federal do Piauí, Fundação de Amparo à Pesquisa do Estado do Piauí, and Conselho Nacional de Desenvolvimento Cientifico e Tecnológico (CNPq) for their valuable support. This research has been financially supported by CNPq [process number: 308446/2018-6] and [process number: 308309/2022-7].
7. References
1 Sima, V., Gheorghe, I. G., Subić, J., & Nancu, D. (2020). Influences of the Industry 4.0 revolution on the human capital development and consumer behavior: a systematic review. Sustainability (Basel), 12(10), 4035 http://dx.doi.org/10.3390/ su12104035
2 Angelopoulou, P., Giaouris, E., & Gardikis, K. (2022). Applications and prospects of nanotechnology in food and cosmetics preservation. Nanomaterials (Basel, Switzerland), 12 (7 ), 1196 http://dx.doi.org/10.3390/nano12071196 PMid:35407315.
3 Siracusa, V., & Blanco, I. (2020). Bio-Polyethylene (Bio-PE), Bio-Polypropylene (Bio-PP) and Bio-Poly(ethylene terephthalate) (Bio-PET): recent developments in bio-based polymers analogous to petroleum-derived ones for packaging and engineering applications. Polymers, 12(8), 1641 http://dx.doi.org/10.3390/ polym12081641 PMid:32718011.
4 Porta, R., Sabbah, M., & Di Pierro, P. (2020). Biopolymers as food packaging materials. International Journal of Molecular Sciences, 21(14), 4942 http://dx.doi.org/10.3390/ijms21144942 PMid:32668678.
5 Vilas, C., Mauricio-Iglesias, M., & García, M. R. (2020). Model-based design of smart active packaging systems with antimicrobial activity. Food Packaging and Shelf Life, 24, 100446 http://dx.doi.org/10.1016/j.fpsl.2019.100446
6 Galli, R., Hall, M. C., Breitenbach, E. R., Colpani, G. L., Zanetti, M., Mello, J. M. M., Silva, L. L., & Fiori, M. A. (2020). Antibacterial polyethylene - Ethylene vinyl acetate polymeric blend by incorporation of zinc oxide nanoparticles. Polymer Testing, 89, 106554 http://dx.doi.org/10.1016/j. polymertesting.2020.106554
7 Echeverria, C. A., Ozkan, J., Pahlevani, F., Willcox, M., & Sahajwalla, V. (2020). Multifunctional marine bio-additive with synergistic effect for non-toxic flame-retardancy and anti-microbial performance. Sustainable Materials and Technologies, 25, e00199 http://dx.doi.org/10.1016/j.susmat.2020.e00199
8 Li, Z., Wang, S., Yang, X., Liu, H., Shan, Y., Xu, X., Shang, S., & Song, Z. (2020). Antimicrobial and antifouling coating constructed using rosin acid-based quaternary ammonium salt and N-vinylpyrrolidone via RAFT polymerization. Applied Surface Science, 530, 147193 http://dx.doi.org/10.1016/j. apsusc.2020.147193
9 Scaffaro, R., Lopresti, F., Marino, A., & Nostro, A. (2018). Antimicrobial additives for poly(lactic acid) materials and their applications: current state and perspectives. Applied Microbiology and Biotechnology , 102 (18 ), 7739 -7756 http://dx.doi.org/10.1007/s00253-018-9220-1 PMid:30009322.
10. Furko, M., Balázsi, K., & Balázsi, C. (2023). Calcium phosphate loaded biopolymer composites - a comprehensive review on the most recent progress and promising trends. Coatings, 13(2), 360. http://dx.doi.org/10.3390/coatings13020360.
11 Dehghani, S., Peighambardoust, S. H., Peighambardoust, S. J., Hosseini, S. V., & Regenstein, J. M. (2019). Improved mechanical and antibacterial properties of active LDPE films prepared with combination of Ag, ZnO and CuO nanoparticles. Food Packaging and Shelf Life, 22, 100391 http://dx.doi. org/10.1016/j.fpsl.2019.100391
12 Bujdáková, H., Bujdáková, V., Májeková-Koščová, H., Gaálová, B., Bizovská, V., Boháč, P., & Bujdák, J. (2018). Antimicrobial activity of organoclays based on quaternary alkylammonium and alkylphosphonium surfactants and montmorillonite. Applied Clay Science, 158, 21-28 http://dx.doi.org/10.1016/j. clay.2018.03.010
13 Skoura, E., Boháč, P., Barlog, M., Pálková, H., Mautner, A., Bugyna, L., Bujdáková, H., & Bujdák, J. (2023). Structure, photoactivity, and antimicrobial properties of phloxine B / poly(caprolactone) nanocomposite thin films. Applied Clay Science, 242, 107037 http://dx.doi.org/10.1016/j.clay.2023.107037
14 Nasrollahzadeh, M., Shafiei, N., Baran, T., Pakzad, K., Tahsili, M. R., Baran, N. Y., & Shokouhimehr, M. (2021). Facile synthesis of Pd nanoparticles supported on a novel Schiff base modified chitosan-kaolin: antibacterial and catalytic activities in Sonogashira coupling reaction. Journal of Organometallic Chemistry, 945, 121849 http://dx.doi. org/10.1016/j.jorganchem.2021.121849
15 Nozha, S. G., Morgan, S. M., Ahmed, S. E. A., El-Mogazy, M. A., Diab, M. A., El-Sonbati, A. Z., & Abou-Dobara, M. I. (2021). Polymer complexes. LXXIV. Synthesis, characterization and antimicrobial activity studies of polymer complexes of some transition metals with bis-bidentate Schiff base. Journal of Molecular Structure, 1227, 129525 http://dx.doi.org/10.1016/j. molstruc.2020.129525
16 Li, W., Chen, M., Li, Y., Sun, J., Liu, Y., & Guo, H. (2020). Improving mildew resistance of soy meal by nano-Ag/TiO2, Zinc Pyrithione and 4-Cumylphenol. Polymers, 12(1), 169 http://dx.doi.org/10.3390/polym12010169 PMid:31936509.
Polímeros, 34(1), e20240010, 2024 7/9
Bio-high density polyethylene films embedded with organoclay and zinc pyrithione
Mesquita, P. J. P., Braz, C. J. F., Alves, T. S., & Barbosa, R.
17 Official Journal of the European Union. (2021). Commission Regulation (EU) 2021/1902 of 29 October 2021. Annexes II, III and V to Regulation (EC) No 1223/2009 of the European Parliament and of the Council as regards the use in cosmetic products of certain substances classified as carcinogenic, mutagenic or toxic for reproduction. Retrieved in 2023, November 13, from https://eur-lex.europa.eu/legal-content/ EN/TXT/PDF/?uri=CELEX:32021R1902&from=EN
18 Food and Drug Administration – FDA. (2023). Inventory of Effective Food Contact Substance (FCS) Notifications. Retrieved in 2023, November 13, from https://www.cfsanappsexternal.fda. gov/scripts/fdcc/index.cfm?set=FCN&id=2139&sort=FCN_No &order=DESC&startrow=1&type=basic&search=Pyrithione
19 Marcous, A., Rasouli, S., & Ardestani, F. (2017). Lowdensity polyethylene films loaded by titanium dioxide and zinc oxide nanoparticles as a new active packaging system against Escherichia coli O157:H7 in fresh calf minced meat. Packaging Technology & Science, 30(11), 693-701 http://dx.doi.org/10.1002/pts.2312
20 Rokbani, H., Daigle, F., & Ajji, A. (2019). Long- and shortterm antibacterial properties of low-density polyethylene-based films coated with zinc oxide nanoparticles for potential use in food packaging. Journal of Plastic Film & Sheeting, 35(2), 117-134. http://dx.doi.org/10.1177/8756087918822677.
21 Hong, S.-I., Wang, L.-F., & Rhim, J.-W. (2022). Preparation and characterization of nanoclays-incorporated polyethylene/ thermoplastic starch composite films with antimicrobial activity. Food Packaging and Shelf Life , 31 , 100784 http://dx.doi.org/10.1016/j.fpsl.2021.100784
22 Fasihnia, S. H., Peighambardoust, S. H., & Peighambardoust, S. J. (2018). Nanocomposite films containing organoclay nanoparticles as an antimicrobial (active) packaging for potential food application. Journal of Food Processing and Preservation, 42(2), e13488 http://dx.doi.org/10.1111/jfpp.13488
23 Peighambardoust, S. H., Beigmohammadi, F., & Peighambardoust, S. J. (2016). Application of organoclay nanoparticle in low-density polyethylene films for packaging of UF cheese. Packaging Technology & Science, 29(7), 355-363 http://dx.doi.org/10.1002/pts.2212
24 Sanitized®. (2013, May 24). MB PE 23-70 Protects thermoplastic polymers against Burgdorf, Switzerland: Sanitized®
25 Mesquita , P. J. P. , Alves , T. S. , & Barbosa , R. (2022 ). Development and characterization of green polyethylene/ clay/antimicrobial additive nanocomposites. Polímeros, 32(2), e2022022 http://dx.doi.org/10.1590/0104-1428.20210097
26 Tarani, E., Arvanitidis, I., Christofilos, D., Bikiaris, D. N., Chrissafis, K., & Vourlias, G. (2023). Calculation of the degree of crystallinity of HDPE/GNPs nanocomposites by using various experimental techniques: a comparative study. Journal of Materials Science, 58(4), 1621-1639 http://dx.doi. org/10.1007/s10853-022-08125-4
27 Wunderlich, B., & Czornyj, G. (1977). A study of equilibrium melting of polyethylene. Macromolecules, 10(5), 906-913 http://dx.doi.org/10.1021/ma60059a006
28. Nurazzi, N. M., Asyraf, M. R. M., Rayung, M., Norrrahim, M. N. F., Shazleen, S. S., Rani, M. S. A., Shafi, A. R., Aisyah, H. A., Radzi, M. H. M., Sabaruddin, F. A., Ilyas, R. A., Zainudin, E. S., & Abdan, K. (2021). Thermogravimetric analysis properties of cellulosic natural fiber polymer composites: a review on influence of chemical treatments. Polymers, 13(16), 2710 http://dx.doi.org/10.3390/polym13162710 PMid:34451248.
29 American Society for Testing and Materials – ASTM. (2018). ASTM D-882: Standard Test Method for Tensile Properties of Thin Plastic Sheeting Philadelphia, USA: ASTM International Retrieved in 2023, November 13, from https://www.astm.org/ d0882-18.html
30 Clinical and Laboratory Standards Institute – CSLI. (2023). M100: Performance Standards for Antimicrobial Susceptibility Testing. Malvern, Pennsylvania, USA: CSLI. Retrieved in 2023, November 13, from https://clsi.org/about/press-releases/ clsi-publishes-m100-performance-standards-for-antimicrobialsusceptibility-testing-33rd-edition/
31 Clinical and Laboratory Standards Institute – CSLI. (2018). M07: Methods for Dilution Antimicrobial Susceptibility Tests for Bacteria That Grow Aerobically Malvern, Pennsylvania, USA : CSLI . Retrieved in 2023, November 13, from https://clsi.org/media/1928/m07ed11_sample.pdf
32 Paiva, L. B., Morales, A. R., & Díaz, F. R. V. (2008). Organoclays: properties, preparation and applications. Applied Clay Science, 42(1-2), 8-24 http://dx.doi.org/10.1016/j.clay.2008.02.006
33 Dias, G., Prado, M., Ligabue, R., Poirier, M., Le Roux, C., Micoud, P., Martin, F., & Einloft, S. (2018). Hybrid PU/synthetic talc/organic clay ternary nanocomposites: thermal, mechanical and morphological properties. Polymers & Polymer Composites, 26(2), 127-140 http://dx.doi.org/10.1177/096739111802600201
34 Roy, A., Joshi, M., & Butola, B. S. (2019). Antimicrobial performance of polyethylene nanocomposite monofilaments reinforced with metal nanoparticles decorated montmorillonite. Colloids and Surfaces. B, Biointerfaces, 178, 87-93 http:// dx.doi.org/10.1016/j.colsurfb.2019.02.045 PMid:30844564.
35 Jung, M. R., Horgen, F. D., Orski, S. V., & Rodriguez, C. (2018). Validation of ATR FT-IR to identify polymers of plastic marine debris, including those ingested by marine organisms. Marine Pollution Bulletin, 127, 704-716. http://dx.doi.org/10.1016/j. marpolbul.2017.12.061 PMid:29475714.
36 Stark, N. M., & Matuana, L. M. (2004). Surface chemistry changes of weathered HDPE/wood-flour composites studied by XPS and FTIR spectroscopy. Polymer Degradation & Stability, 86(1), 1-9 http://dx.doi.org/10.1016/j.polymdegradstab.2003.11.002
37 Terui, Y., & Hirokawa, K. (1994). Fourier transform infrared emission spectra of poly(vinyl acetate) enhanced by the island structure of gold. Vibrational Spectroscopy, 6(3), 309-314 http://dx.doi.org/10.1016/0924-2031(93)E0065-A
38 Zhao, C., Qin, H., Gong, F., Feng, M., Zhang, S., & Yang, M. (2005). Mechanical, thermal and flammability properties of polyethylene/clay nanocomposites. Polymer Degradation & Stability, 87(1), 183-189 http://dx.doi.org/10.1016/j. polymdegradstab.2004.08.005
39 Cervantes-Uc, J. M., Cauich-Rodríguez, J. V., VázquezTorres, H., Garfias-Mesías, L. F., & Paul, D. R. (2007). Thermal degradation of commercially available organoclays studied by TGA–FTIR. Thermochimica Acta, 457(1), 92-102. http://dx.doi.org/10.1016/j.tca.2007.03.008
40 Zhang, J., Gupta, R. K., & Wilkie, C. A. (2006). Controlled silylation of montmorillonite and its polyethylene nanocomposites. Polymer, 47(13), 4537-4543 http://dx.doi.org/10.1016/j. polymer.2006.04.057
41 Naderi-Samani, H., Razavi, R. S., Loghman-Estarki, M. R., Ramazani, M., Barekat, M., Mishra, A. K., & Fattahi, H. (2019). The effects of Cloisite 20A content on the adhesion strength and corrosion behavior of poly (amide-imide)/cloisite 20A nanocomposite coatings. Composites. Part B, Engineering, 175, 107154. http://dx.doi.org/10.1016/j.compositesb.2019.107154.
42 Pittol, M., Tomacheski, D., Simões, D. N., Ribeiro, V. F., & Santana, R. M. C. (2017). Antimicrobial performance of thermoplastic elastomers containing zinc pyrithione and silver nanoparticles. Materials Research, 20(5), 1266-1273 http://dx.doi.org/10.1590/1980-5373-mr-2017-0137
43 Boronat, T., Fombuena, V., Garcia-Sanoguera, D., Sanchez-Nacher, L., & Balart, R. (2015). Development of a biocomposite based on green polyethylene biopolymer and eggshell. Materials & Design, 68, 177-185 http://dx.doi.org/10.1016/j.matdes.2014.12.027
Polímeros, 34(1), e20240010, 2024 8/9
Bio-high density polyethylene films embedded with organoclay and zinc pyrithione
44 Pu, S., Hao, Y.-B., Dai, X.-X., Zhang, P.-P., Zeng, J.-B., & Wang, M. (2017). Morphological, rheological, crystalline and mechanical properties of ethylene-vinyl acetate copolymer/ linear low-density polyethylene/amphiphilic graphene oxide nanocomposites. Polymer Testing, 63, 289-297 http://dx.doi. org/10.1016/j.polymertesting.2017.08.028
45 Vozniak, A., & Bartczak, Z. (2022). Plastic deformation of high density polyethylene with extended-chain crystal morphology. Polymers, 15(1), 66 http://dx.doi.org/10.3390/polym15010066 PMid:36616416.
46 Adediran, A. A., Akinwande, A. A., Balogun, O. A., Olasoju, O. S., & Adesina, O. S. (2021). Experimental evaluation of bamboo fiber/particulate coconut shell hybrid PVC composite. Scientific Reports, 11(1), 5465 http://dx.doi.org/10.1038/ s41598-021-85038-3 PMid:33750871.
47. Dadashov, S., Demirel, E., & Suvaci, E. (2022). Tailoring microstructure of polysulfone membranes via novel hexagonal ZnO particles to achieve improved filtration performance. Journal of Membrane Science, 651, 120462 http://dx.doi. org/10.1016/j.memsci.2022.120462
48 Santos, M. S., Montagna, L. S., Rezende, M. C., & Passador, F. R. (2019). A new use for glassy carbon: development of LDPE/glassy carbon composites for antistatic packaging
applications. Journal of Applied Polymer Science, 136(11), 47204 http://dx.doi.org/10.1002/app.47204
49 Sonia, P., Jain, J. K., Singhal, P., & Saxena, K. K. (2021). Performance evaluation of hybrid polymer nanocomposite. Materials Today: Proceedings, 44 (Part 1 ), 1659 -1663 . http://dx.doi.org/10.1016/j.matpr.2020.11.826
50 Savini, G., & Oréfice, R. L. (2021). Super ductility in HDPE/ EVA blends triggered by synthetic amorphous nanotalc. Journal of Polymer Research, 28(1), 19 http://dx.doi.org/10.1007/ s10965-020-02389-7.
51 Xiao, L., Sun, J., Liu, L., Hu, R., Lu, H., Cheng, C., Huang, Y., Wang, S., & Geng, J. (2017). Enhanced photothermal bactericidal activity of the reduced graphene oxide modified by cationic water-soluble conjugated polymer. ACS Applied Materials & Interfaces , 9 (6), 5382 -5391 http://dx.doi. org/10.1021/acsami.6b14473 PMid:28112908.
52 Worasith, N., & Goodman, B. A. (2023). Clay mineral products for improving environmental quality. Applied Clay Science, 242, 106980 http://dx.doi.org/10.1016/j.clay.2023.106980
Received: Nov. 13, 2023
Revised: Feb. 11, 2024
Accepted: Feb. 23, 2024
Polímeros, 34(1), e20240010, 2024 9/9
A methodology for determination the inlet velocity in injection molding simulations
Diego Alves de Miranda1* , Willian Kévin Rauber2 , Miguel Vaz Jr.2 and Paulo Sergio Berving Zdanski2
1Departamento de Engenharia Mecânica, Universidade da Região de Joinville – UNIVILLE, São Bento do Sul, SC, Brasil
2Programa de Pós-graduação em Ciência e Engenharia de Materiais, Departamento de Engenharia Mecânica, Universidade do Estado de Santa Catarina – UDESC, Joinville, SC, Brasil
*diegoalves_klx@hotmail.com
Obstract
The inlet velocity of thermoplastic in injection molds plays a crucial role in obtaining high-quality polymer parts and the final performance of the product. It is known that the way the polymer is injected into the mold can directly affect important properties, such as the distribution of internal stresses, the cooling rate and the formation of surface defects. However, there are injection molding machines that only control injection pressure and dosage, making it difficult to obtain the gate inlet velocity into the mold cavity. Besides, some molds have many injection channels as well as complex inlet geometries, which make a challenging task to identify the inlet velocity. This study presents numerical and experimental approaches on how to determine the entry velocity in thermoplastic injection molds. The main results showed that these methods are highly efficient and contribute to identifying the gate inlet velocity with good accuracy.
Keywords: inlet velocity, injection molds, numerical/experimental methodologies.
How to cite: Miranda, D. A., Rauber, W. K., Vaz Jr., M., & Zdanski, P. S. B. (2024). A methodology for determination the inlet velocity in injection molding simulations. Polímeros: Ciência e Tecnologia, 34(1), e20240011. https://doi. org/10.1590/0104-1428.20230099
1. Introduction
The adequate choice of parameters in injection molding processes is a topic of great interest nowadays, since many products are manufactured by this process, in special components and parts for the automotive and aerospace industries. The behavior of the polymer flow during the injection molding process can be affected by multiple variables, some of which can be controlled by efficient mold design and setting of correct machine parameters[1] .
One important variable that is able to change the mold injection process is the gate inlet velocity, that is the velocity of the molten polymer entering the mold cavity. This variable affects directly the quality of the injected parts and a proper control can prevent possible failures. The incorrect preset of the polymer velocity can produce defects, such as shrinkage and flow marks when using high velocities, whilst low velocities can lead to incomplete mold filling[2] . Furthermore, the gate inlet velocity also affects the cooling time (cooling rate) and polymer crystallization, influencing the molecular structure and final properties of products[3] Such issues highlight the importance of understanding the gate inlet velocity, once this parameter is essential in injection mold design[4], primarily to maintain efficient control of injection molding processes[5] and achieve high-quality polymer parts and high performance[6]
In order to finding the best gate inlet velocity, as well as other processing parameters such as melting temperature,
injection pressure and cycle time, numerical simulation plays a crucial role in injection molding processes[7] The simulation of thermoplastic products prior to mold construction is increasingly becoming a powerful tool to predict and optimize processing performance and product quality[8]. Moreover, the greatest advantage of applying current advanced computational methods is the virtual model visualization, which shows the behavior of molten polymers, offering valuable insights to designers and engineers[9]. For example, Morak et al.[10] carried out injection molding simulations using Moldflow® to determine the best orientation of the polymeric fibers as a function of the mold geometry and injection parameters to improve the mechanical behavior of the injected parts. Based on injection molding simulation, Onken et al.[11] developed a numerical algorithm able to predict the weld line in the molten polymer flow. Gruber and Miranda[12] used SolidWorks Plastics® to simulate the heat transfer between different cooling channels and mold wall, in the process of injecting polypropylene parts, aiming to optimize the cycle time of the parts and at increasing productivity. It is notable that numerical simulations help and contribute to the good performance of the thermoplastic injection process[13]. However, the design engineer must know how to properly set the polymer parameters and the injection process [14]. Some research works present
https://doi.org/10.1590/0104-1428.20230099 O O O O O O O O O O O O O O O Polímeros, 34(1), e20240011, 2024 ISSN 1678-5169 (Online) 1/9
D. A., Rauber, W. K., Vaz Jr., M., & Zdanski, P. S. B.
simulations under which the boundary conditions use inlet velocity and inlet temperature as input parameters, which are normally chosen arbitrarily[15]. For example, Young[16] applied the lattice Boltzmann method (LBM) to simulate and analyze the behavior of molten ABS and PS polymers using 1 100 mms as gate inlet velocity. When proposing a new numerical scheme to simulate molten polymers, Zdanski and Vaz[17] used a gate inlet velocity of 1 60 mms to simulate the POM polymer in geometries with abrupt expansions. Using the same analogy of abrupt expansions, Tutar and Karakus[18] applied three different inlet velocities to evaluate the thermophysical properties of the molten PP polymer, which were 1 10 mms , 1 30 mms and 1 60 mms . The authors numerically analyze the flow of molten PP polymer in a free rectangular cavity and a cavity with obstruction with the objective of comparing the position of the flow front. In other work, Gao[19] used as initial inlet velocities 1 100 mms , 1 200 mms , 1 400 mms and 1 2000 mms .
In an injection process, the flow of molten polymer is mainly controlled by the injection pressure, which in turn is established by the injection machine[20]. Molds may contain many inlet channels and gates prior to the mold cavity[21] This mold arrangement poses some difficulties in setting the cavity entry velocity, since injection of the molten polymer requires a high pressure for the flow to occur in the channels and fill all parts[22]. In most simulations of thermoplastic injection processes, the design engineer ignores the geometry of the injection channels and gate, as this only results in more computational time, in addition to running more risks of divergences in the simulations[23]. This procedure ties the accuracy of the results with the knowledge and experience of those who set up the simulations[24]. However, there are studies that prove that, in molten polymer injection processes, depending on the gate inlet velocity, the product may suffer injection failures[25,26]. Therefore, great care must be taken to properly insert the inlet injection velocity (when such boundary conditions are preset), in order to maintain the accuracy of the results and minimize post-processing errors[27]. All aforementioned examples show that many authors arbitrary define an initial flow velocity at the entrance of the cavity or, consequently, at the exit of the gate. This is due to the fact that, in most cases, velocity is controlled at the beginning of the screw, which constitutes a considerable distance from the cavity with several section variations.
Within this context, this study proposes both experimental and numerical methods to determine the inlet velocity of thermoplastic parts processed by injection molding that have injection channels followed by a gate. Both experimental and numerical methods consist of measuring the average displacement length of the molten ABS polymer, considering a fixed injection pressure and alternating different injection times. Simulations were performed using the Generalized Hele-Shaw Approach (GHS) to predict injection molding flow characteristics of a specimen experimentally validated.
2. Materials and Methods
The methodology applied in this work is divided in two parts. The first one comprises experimental injection tests with specimens injected in ABS to compare the displacement length of the molten polymer for different cavity filling times. In the second step, a numerical simulation of the injection molding process of the same specimen injected in ABS is developed using the Moldflow® software.
2.1 Experimental procedure
The component analized in this work is a test specimen injected in acrylonitrile-butadiene-styrene (ABS 750 from Kumho Petrochemical)[28]. In addition to its widespread use in industry, the ABS 750 was used in this work owing to the experimental and numerical validation of its rheological equations performed by the authors in previous studies[24,29] The volume of the test specimen is 3 8.297 cm , and the specific mass of ABS 750 is 3 1,033.40 gcm according to the material manufacturer[28], which leads to an average injected mass of 8.574 g . The ABS 750 was processed with an injection temperature of 235°C, a mold wall temperature of 10°C and an injection pressure of 25 MPa.
2.1.1 Injection process
The injection mold used in the present work was manufactured in P-20 steel with only one cavity and a symmetrical bifurcation, so that the molten polymer enters the mold cavity through the sides of the test piece, as shown in Figure 1. The injection machine used in this work is the Battenfeld, model 250 Plus.
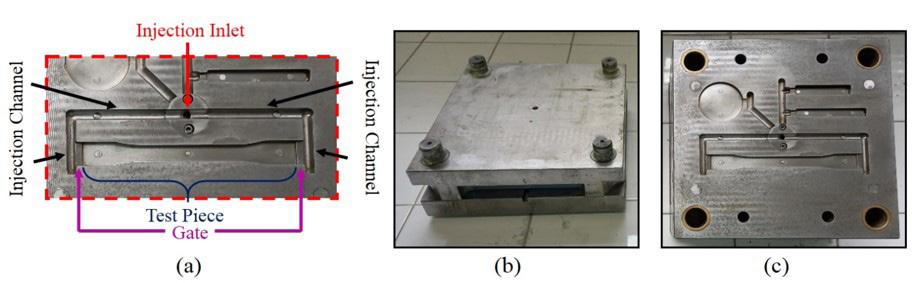
Polímeros, 34(1), e20240011, 2024 2/9
Miranda,
Figure 1. Details of the injection processing: (a) Close view of the superior Cavity; (b) Inferior cavity assemble, and (c) Superior cavity assemble.
2.2 Experimental determination of inlet velocity
The injection process is intermittent and composed of three main stages, namely filling, packaging and solidification, respectively. In this study, only the first stage of the injection cycle is addressed, both in experiments and simulations. Firstly, an injection pressure of 0 25 PMPa = was used as initial processing condition. However, it is known that the pressure drop in injection channels are relatively high[30] To ensure the accuracy of these results, the experimental method considered the injection of ten (10) different samples, which were taken from the first 0.30 ts∆= of injection. The displacement length of the molten polymer, referred here as filling lines ( xexp∆ ), are measured in five (5) locations along the partially injected part, from the gate, as shown in Figure 2.
From these measurements, the average length of the filling lines was determined, followed by computation of the mean velocity using Equation 1.
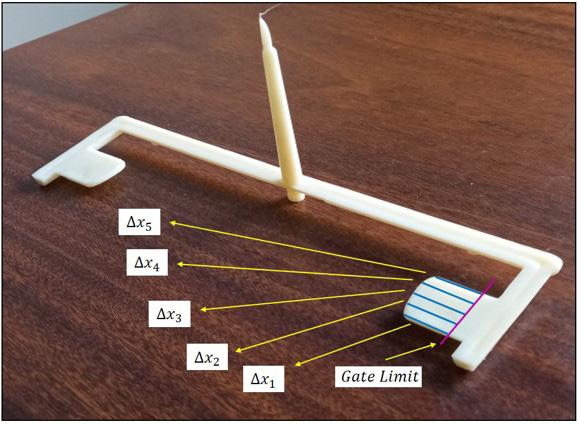
2.3 Determination of inlet velocity by numerical simulation
The numerical method was also used, in which the filling lines were captured through ABS polymer simulations. Figures 3a presents the locations of the the inlet and boundary conditions, whereas Figure 3b illustrates the filling lines. The Moldflow® Adviser software was used to simulate the molten polymer injection process. Moldflow® uses the generalized Hele-Shaw model (GHS) to calculate the non-Newtonian polymer flow[31]. The initial conditions were the same used in the experiments: 0 25 PMPa = , 0 235 T = ℃ and 10 Tw = ℃.
The filling lines were obtained for the same experimental distances, as indicated in Figure 3b. The numerical velocity based on the average filling lines are computed using Equation 2,
2.3.1 Generalized hele-shaw model
The Moldflow® Advisor software simulates the flow of the molten polymer considering a non-Newtonian and compressible fluid under non-isothermal conditions. For more detailed clarification on the governing equations for the conservation of mass, momentum and energy for molten polymer flow, the reader is referred to Kennedy’s work[31] for more details on the GHS mathematical approach and Miranda et al.[29] for further details of the thermophysical properties used in the simulations.
The interface description method for capturing the flow front used by the software is VOF (Volume of Fluid), and the method for time discretization uses an explicit Euler scheme with second-order precision. The VOF methodology is a method for capturing the boundary that can consider more than one phase. The software considers linear correlations to estimate the viscosity and density at the interface between the molten polymer and the air confined inside the mold[32]: The reader is referred to Hétu et al.[32] and Miranda et al.[29] for more details on the VOF methodology.
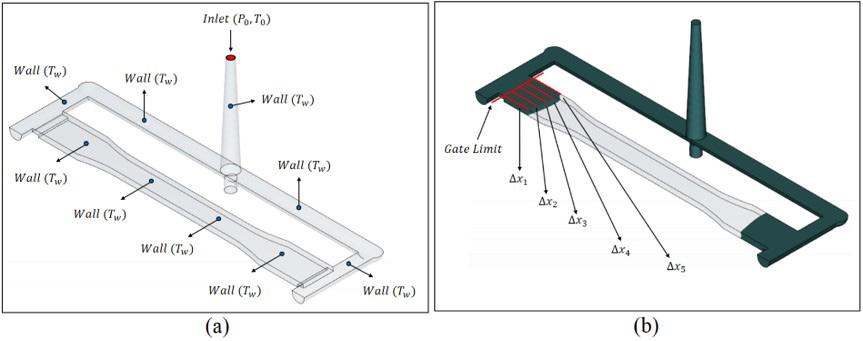
A methodology for determination the inlet velocity in injection molding simulations Polímeros, 34(1), e20240011, 2024 3/9
0 exp exp x U t ∆ = ∆ (1)
0 sim sim x U t ∆ = ∆ (2)
Figure 2. Experimental measurement process of the injected length ( xexp∆ ) at 0.3 ts∆=
Figure 3. Determination of the injected length at 0.3 ts∆= . (a) Boundary conditions of simulations with the Generalized Hele-Shaw model; (b) Simulated filling lines ( xsim∆ ).
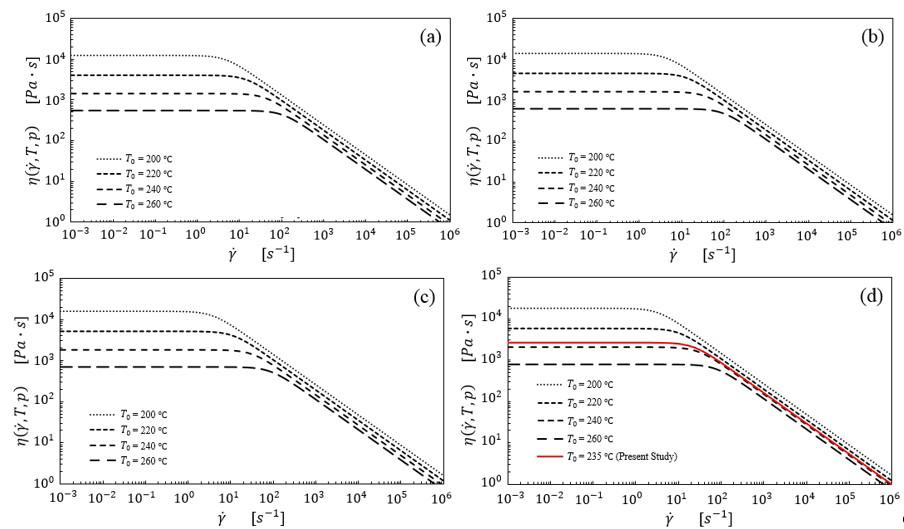
Figure 4. Viscosity versus shear rate in distinct injection conditions. (a) Injection pressure 10 Mpa; (b) Injection pressure 15 Mpa; (c) Injection pressure 20 Mpa; (d) Injection pressure 25 MPa.
2.3.2 Polymer rheology
The Moldflow® works with several viscosity models that can be used in simulations. The choice of a viscosity model must be done properly to ensure accuracy of the simulations. A previous study by Miranda et al.[29] compared several viscosity models, confronting numerical and experimental results. The authors demonstrated that the constitutive viscosity model known as Modified Arrhenius Carreau (MACa) better capture the non-Newtonian behavior of molten ABS. This model explicitly accounts for shear rate, temperature and pressure effects. For the sake of objectivity, the equations are omitted here and the reader is refeed to Miranda et al.[29] for further discussions on the effects of the rheological and processing parameters. An illustration of the effects of the shear rate, temperature and pressure in the viscosity for the molten ABS polymer is presented in Figure 4.
2.3.3 Numerical verification
In order to evaluate the accuracy of the ABS simulations while flowing inside the specimen cavity, a verification process was performed. Verification of transient flow proposed by Hétu et al.[32] was performed with the dimensions and boundary conditions of the domain shown in Figure 5.
Laminar flow is assumed at the inlet and no-slip boundary conditions are imposed on the cavity walls. Uniform melting temperature is set at inlet. The initial temperatures of the empty cavity and the mold wall are assumed to be the same. Finally, viscous dissipation effects were neglected. The viscosity model used by Hétu et al.[32] in the simulation is the modified Arrhenius Bird–Carreau model
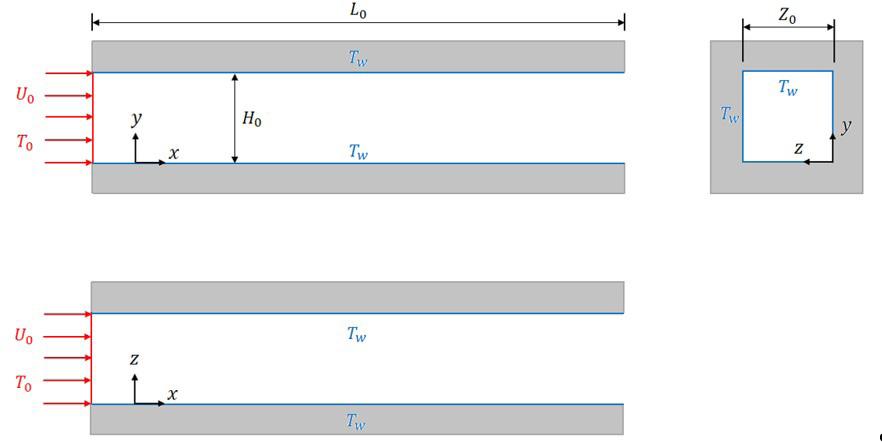
Figure 5. Boundary conditions of the fountain flow problem according to Hétu et al.[32]
The material used in the simulations is Thermoplastic Polyolefin (TPO) with boundary conditions indicated in Figure 5, and material properties of the casting and rheological model summarized in Table 1
In order to quantitatively validate these results, the following dimensionless variables are used:
Dimensionless time, velocity and temperature are also defined as
Polímeros, 34(1), e20240011, 2024 4/9
Miranda, D. A., Rauber, W. K., Vaz Jr., M., & Zdanski, P. S. B.
( ) ( ) 1 2 2 0 ,1 , n T Te α ηγηλγβ =+ (3)
.
*** 000 , , . xyz xyzHHZ === (4)
*** 0 000 , , w w U TT u ttuT HUTT === (5)
2.3.3.1
Convergence analysis
Initially, it is relevant to note that most published works using Moldflow® ignore the influence of mesh size. For example, Solanki et al.[33] and Saad et al.[34] recently presented studies addressing design and optimization of molds, respectively, using Moldflow®. Despite the importance of mesh size, mainly in optimization problems, the authors of both works did not discuss the effects of mesh refinement. The authors implicitly assumed that the mesh used in the simulations is refined enough not to significantly influence their results.
There are few examples of mesh size evaluation using Moldflow®. Trad et al.[35] addressed mesh independence by assessing the effect of mesh size in the mold filling time, and concluded that greater accuracy was obtained for refined meshes of size 0.6 mm . Miranda and Nogueira[36] experimentally compared the influence of the mesh size in relation to actual injected components, who indicated little variation in the simulated results for mesh sizes smaller than 1.25 mm . Marin et al.[37] compared the effect of mesh density in the injection pressure, reaching highest precision in a dual-domain mesh with sizes between 2.0 and 4.0 mm. It is worthy to note that the aforementioned mesh sizes are associated with the part or product sizes and shape, especially thickness variations and the presence of free-form shapes. Therefore, one must observe the relative mesh size in order to avoid defining over or under refined meshes. Therefore, the method based on the Richardson extrapolation is a simple tool which will help the mold designer to assess the accuracy of numerical results.
In complex and nonlinear problems, as injection molding, the discretization error (associated with mesh size) is not known a priori. In the present work, the Richardson extrapolation technique[38] is applied to estimate the magnitude and order of the discretization error. Richardson extrapolation is based on three progressively refined meshes with a constant refinement ratio. The method assumes that the exact solution for velocities and temperatures, * uexact and * Texact , can be estimated at any given point 3 i xR ∈ as
where * uh is the discrete solution, * u hε is the discretization error, h is the mesh size, α is a constant and ph is the error order. The discretization error and the error order are not known a priori. Thus, the Richardson error estimate for dimensionless velocity and temperature, * u and * T , establishes that the estimated local errors, * 1 u hε and * 1 T hε , and error orders, * 1 u ph and * 1 T ph , associated with mesh 1 are ( )
12 1 1
32 1 21 ** ** ** ** and 1 log /log , hh u exacth h p hh u h hh uu uu r uu pr uu ε =−≅
(8) ( ) * 12 1 1 * 32 1 21 ** ** ** ** and 1 log /log , hh T exacth h p hh T h hh
where 3221 // rhhhh == is the refinement ratio and üü << are the mesh sizes.
Richardson’s estimate[38] requires meshes with equal refinement rate. Thus, in the present work, the simulations were performed for meshes with a refinement ratio of 2 r = , ranging from 0.03125 ü = to 0.50 ü =
3. Results and Discussions
This section summarizes the verification study of the computational approach and presents the numerical and experimental comparative study for the filling velocity of the specimen. Firstly, the verification method described in section 2.3.3 for transient flow is presented.
3.1
Verification of transient flow
The verification procedure was performed according to the melt polymer transient flow problem proposed by Hétu et al.[32], who also obtained numerical results that will be discussed in this study. The velocity and temperature results at two different injection times were evaluated using the Richardson extrapolation technique[38] Tables 2 and 3 show the results for velocity and temperature, * u and * T , corresponding to dimensionless times * 6.0 t = and * 12.0 t = , respectively, for a point located at * 0.50 x = and * 0.50 y = for all meshes.
A methodology for determination the inlet velocity in injection molding simulations Polímeros, 34(1), e20240011, 2024 5/9
( ) ( ) ( ) ( ) * ** 1 * hh u exactihi h pp hi uxux uxhOh ε α + =+= ++ , (6) ( ) ( ) ( ) ( ) * ** 1 * hh T exactihih pp hi TxTx TxhOh ε α + =+= ++ , (7)
TT
TT
TT ε
= (9)
*
*
=
TT
r
pr
=
Geometric Properties Boundary Conditions Rheological Properties Parameter Value Unit Parameter Value Unit Parameter Value Unit H0 1 mm ρ0 810 kg∙m-3 η0 3,600 Pa∙s L0 10 mm Cp0 2,500 J∙kg-3∙K-1 λ 1.62 s Z0 10 mm k0 0.16 W∙m-1∙K-1 n 0.3 –U0 10 mm∙s-1 α 0.00931 K-1 T0 230 ℃ β 1 –TW 50 ℃
Table 1. Material Properties (TPO) and dimensions of Hétu et al.[32]
Miranda, D. A., Rauber, W. K., Vaz Jr., M., & Zdanski, P. S. B.
It is observed in Table 2 that the estimated error order * 1 u ph ranges from 1.6408 to 2.0739 for velocity, with an average value * 1.8027 u h p = The “exact” solution determined by Eq. (6) is also indicated in Table 2 as * 1.2088 uexact = , while in the study by Hétu et al.[32] is * 1.1670 u = . The estimated error order * 1 T ph ranging from 1.6407 to 2.0739 for temperature was also determined, with mean value * 1.8027 T h p = The “exact” solution was * 0.9126 Texact = , while in the study by Hétu et al.[32] is * 0.9050 T = .
Table 3 shows that, when the flow advances in time at * 12.0 t = , the estimated error order * 1 u ph also varies from 1.6408 to 2.0739 for the velocity, with mean value * 1.8027 u h p = with the “exact” solution being * 1.2413 uexact = , whereas in the study by Hétu et al.[32] is * 1.2035 u . The estimated error order for temperature * 1 T ph ranges from 1.6407 to 2.0738 , with the same mean value * 1.8027 T h p = The “exact” solution was * 0.8702 Texact = , whereas in the study by Hétu et al.[32] is * 0.8645 T =
Therefore, the present results obtained using the Moldflow® software indicate that the order of discretization error for both dimensionless velocity and temperature is approximately ** 1.8027 uT pphh== , close to the theoretical value of 2.0. Noticeably, this brief evaluation was performed for only one (1) point of the domain ( * 0.50 x = and * 0.50 y = ) and the effects of temporal discretization
were not considered. Notwithstanding, this work does not intend to present an in-depth error analysis of mathematical formulations. This “verification” aims to give the reader further quantifiable assurance that present numerical solutions are reliable when compared with the results available in the literature.
3.2 Simulated inlet velocity
After the verification step, simulations with Moldfow® software were applied to the specimen model (Figure 3) to capture the filling lines at three different times. The processing and material parameters for the ABS polymer adopted in this study is presented in Miranda et al.[29]. With the results of these lengths, they were applied in Equation 2, whose calculated values can be seen in Table 4.
The results of Table 4 indicate a good agreement in inlet values for velocities obtained in three distinct time steps. Performing an averaging process, the mean value for the inlet velocity obtained with numerical simulation was 1 0 50.2533 sim U mms =
3.3 Experimental inlet velocity
Under the same simulation conditions, experimental injection tests were performed to measure the flow front lines. The experimental strategy adopted to obtain the flow front was described in details in the work of Miranda et al.[24]
Table 3. Dimensionless velocity u* and temperature T* (t* = 12.0, x* = 0.50 and y* = 0.50).
[mm]
Table 4. Line measurements and calculated inlet velocity with the respective standard deviations in the simulated results.
Polímeros, 34(1), e20240011, 2024 6/9
h [mm] u* 1 u ph 1 u hε * uexact T* 1 * T ph 1 * T hε * Texact 0.50 1.2140 – – – 0.9179 – – –0.25 1.2101 – – – 0.9140 – – –0.125 1.2092 2.0739 -2.8857×10⁻⁴ 1.2089 0.9131 2.0739 -2.9218×10⁻⁴ 0.9128 0.0625 1.2089 1.6937 -1.2814×10⁻⁴ 1.2088 0.9127 1.6937 -1.2974×10⁻⁴ 0.9126 0.03125 1.2088 1.6408 -4.3354×10⁻⁵ 1.2088 0.9128 1.6407 -4.3896×10⁻⁵ 0.9126
Table 2. Dimensionless velocity u* and temperature T* (t* = 6.0, x* = 0.50 and y* = 0.50).
h
u* 1 * u ph 1 * u hε * uexact T* 1 * T ph 1 * T hε * Texact 0.50 1.2466 – – – 0.8755 – – –0.25 1.2426 – – – 0.8716 – – –0.125 1.2417 2.0739 -2.9401×10⁻⁴ 1.2414 0.8707 2.0738 -2.8670×10⁻⁴ 0.8704 0.0625 1.2414 1.6937 -1.3056×10⁻⁴ 1.2413 0.8704 1.6937 -1.2731×10⁻⁴ 0.8702 0.03125 1.2413 1.6408 -4.4170×10⁻⁵ 1.2412 0.8703 1.6407 -4.3072×10⁻⁵ 0.8702
Lines Δt = 0.10 s Δt = 0.20 s Δt = 0.30 s Δx1 (mm) 4.89 9.76 14.56 Δx2 (mm) 5.03 10.04 14.98 Δx3 (mm) 5.06 10.10 15.07 Δx4 (mm) 5.13 10.23 15.27 Δx5 (mm) 5.10 10.17 15.18 x∆ (mm) 5.042 ± 0.0931 10.060 ± 0.1823 15.012 ± 0.2754 Calculated
0 sim U (mm∙s-1) 50.42 ± 0.9311 50.30 ± 0.9117 50.04 ± 0.9182
Velocities
Table 5. Line measurements and calculated initial velocity with the
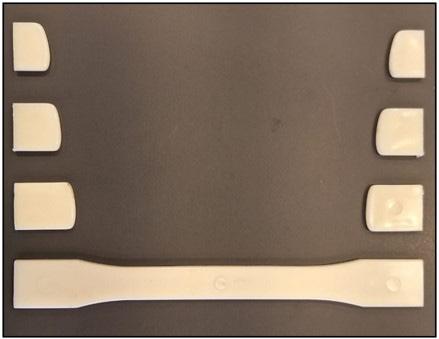
Figure 6. Advancement of the flow front during filling stage in the experimental process with an interval of 0.1 ts∆= , 0.2 ts∆= , 0.3 ts∆= and the cavity is completely filled.
Noticeably, the inertia of the injection screw was not accounted for explicitly; however, its effects are included in the measurements of the flow front at the injected part. The development of the flow front after solidification can be seen in Figure 6
Figure 6 illustrates that, in the beginning of the filling front, the inlet velocity of the molten polymer is non-linear and asymmetrical, that is, due to the injection channel being displaced and flowing on only one side before reaching the cavity. This displacement causes the molten polymer to pass the gate with a greater velocity on one side of the cavity than on the other. The length values shown in Table 5 represent an average of ten injection samples at each instant of time for performing the calculations.
The values collected experimentally in Table 5 indicate that an average injection velocity of 1 0 50.1289 exp U mms = is sufficiently favourable. In summary, although the experimentally calculated inlet velocity reached a value lower than the simulated one, the difference between the values is approximately 1 0.1244 mms (less than 1%), which is considerably small considering an injection problem.
4. Conclusions
Proper control of the gate inlet velocity in thermoplastic injection molds is essential to obtain products with desired
characteristics, avoiding defects and ensuring process efficiency. This work presents a numerical and experimental approaches on how to determine the entry velocity in thermoplastic injection molds and a mesh convergence study using the Moldflow® simulation software. The following points highlight the discussions:
• Verification of the GHS numerical model was performed based on the injection mold problem proposed by Hétu et al.[32]. The error magnitude and order were found acceptable, with error order for velocity and temperature around 1.8, close to the theoretical value of 2.0;
• Experimental and numerical methodologies for capturing the gate inlet velocity directly in the cavities of injection molds were addressed. Assessment of the inlet velocity based on both strategies shows differences smaller than 1%;
• The proposed strategy to determine the gate inlet velocity makes it possible to simulate the injection molding processes without including the injection channel, thereby reducing the simulation time.
It is relevant to note that the design engineer who is able to understand and anticipate the gate inlet velocity in the simulations will be able to optimize simulations in thermoplastic injection molds of parts with complex geometries, thereby guaranteeing the production of high-quality polymer parts, with good dimensional accuracy, strength and suitable surface finish.
5. Author’s Contribution
• Conceptualization – Diego Alves de Miranda.
• Data curation – Diego Alves de Miranda; Willian Kévin Rauber.
• Formal analysis – Diego Alves de Miranda; Willian Kévin Rauber.
• Funding acquisition – NA.
• Investigation – Diego Alves de Miranda; Willian Kévin Rauber; Paulo Sergio Berving Zdanski; Miguel Vaz Jr.
• Methodology – Diego Alves de Miranda; Willian Kévin Rauber; Paulo Sergio Berving Zdanski; Miguel Vaz Jr.
• Project administration – Paulo Sergio Berving Zdanski.
A methodology for determination the inlet velocity in injection molding simulations Polímeros, 34(1), e20240011, 2024 7/9
standard
Lines Δt = 0.10 s Δt = 0.20 s Δt = 0.30 s Δx1 (mm) 4.95 9.88 14.75 Δx2 (mm) 5.01 10.01 14.94 Δx3 (mm) 5.03 10.03 14.97 Δ
5.09 10.16 15.16 Δx5 (mm) 5.06 10.10 15.07 x∆ (mm) 5.028 ± 0.0531 10.036 ± 0.1055 14.978 ± 0.1542 Calculated Velocities 0 sim
50.28
0.5310 50.18 ± 0.5275 49.9267
0.5139
respective
deviations in the experimental results.
x4 (mm)
U (mm∙s-1)
±
±
Miranda, D. A., Rauber, W. K., Vaz Jr., M., & Zdanski, P. S. B.
• Resources – NA.
• Software – Diego Alves de Miranda; Willian Kévin Rauber.
• Supervision – Paulo Sergio Berving Zdanski; Miguel Vaz Jr.
• Validation – Diego Alves de Miranda; Miguel Vaz Jr.
• Visualization – Diego Alves de Miranda; Willian Kévin Rauber.
• Writing – original draft – Diego Alves de Miranda; Willian Kévin Rauber; Miguel Vaz Jr; Paulo Sergio Berving Zdanski.
• Writing – review & editing – Diego Alves de Miranda; Willian Kévin Rauber; Miguel Vaz Jr; Paulo Sergio Berving Zdanski.
6. Acknowledgements
The second author thanks the “State University of Santa Catarina (UDESC) – Program for Postgraduate Tutoring Scholarship (PROMOP)”. The second, third, fourth and last authors acknowledge the “Research and Innovation Support Foundation of the State of Santa Catarina (FAPESC)”, Finance Code 2023TR000563, and the last author thanks the financial support provided by the Brazilian “National Council for Scientific and Technological Development (CNPq)” under grant 306821/2021-4.
7. References
1 Krantz, J., Nieduzak, Z., Kazmer, E., Licata, J., Ferki, O., Gao, P., Sobkowicz, M. J., & Masato, D. (2023). Investigation of pressure-controlled injection molding on the mechanical properties and embodied energy of recycled high-density polyethylene. Sustainable Materials and Technologies, 36, e00651 http://dx.doi.org/10.1016/j.susmat.2023.e00651
2 Tsou, H.-H., Huang, C.-C., Zhao, T.-W., & Wang, Z.-H. (2022). Design and validation of sensor installation for online injection molding sidewall deformation monitoring. Measurement, 205, 112200 http://dx.doi.org/10.1016/j.measurement.2022.112200
3 Bianchi, M. F., Gameros, A. A., Axinte, D. A., Lowth, S., Cendrowicz, A. M., & Welch, S. T. (2021). Regional temperature control in ceramic injection moulding: an approach based on cooling rate optimization. Journal of Manufacturing Processes, 68, 1767-1783 http://dx.doi.org/10.1016/j.jmapro.2021.06.069
4 Fu, J., Zhang, X., Quan, L., & Ma, Y. (2022). Concurrent structural topology and injection gate location optimization for injection molding multi-material parts. Advances in Engineering Software, 165, 103088 http://dx.doi.org/10.1016/j. advengsoft.2022.103088
5 He, H., Xing, Y., Wang, R., Lu, Y., Zhang, L., & Li, F. (2023). Optimization design of cooling system for injection molding mold of non-pneumatic tire. Thermal Science and Engineering Progress, 42, 101866 http://dx.doi.org/10.1016/j.tsep.2023.101866
6 Marques, S., Souza, A. F., Miranda, J., & Yadroitsau, I. (2015). Design of conformal cooling for plastic injection moulding by heat transfer simulation. Polímeros: Ciência e Tecnologia, 25(6), 564-574 http://dx.doi.org/10.1590/0104-1428.2047
7 Baum, M., Jasser, F., Stricker, M., Anders, D., & Lake, S. (2022). Numerical simulation of the mold filling process and its experimental validation. International Journal of Advanced Manufacturing Technology, 120(5), 3065-3076 http://dx.doi. org/10.1007/s00170-022-08888-9
8 Chai, B. X., Eisenbart, B., Nikzad, M., Fox, B., Blythe, A., Blanchard, P., & Dahl, J. (2021). Simulation-based optimisation for injection configuration design of liquid composite moulding processes: a review. Composites. Part A, Applied Science and Manufacturing, 149, 106540 http://dx.doi.org/10.1016/j. compositesa.2021.106540
9 Zhang, Y., Liu, F., Huang, Z., Xie, X., Shan, B., & Zhou, H. (2015). Dispersed phase deformation modeling of immiscible polymer blends in injection molding. Advances in Polymer Technology, 34(4), 21515. http://dx.doi.org/10.1002/adv.21515.
10 Morak , M. , Tscharnuter, D. , Lucyshyn , T. , Hahn , W. , Göttlinger, M., Kummer, M., Steinberger, R., & Gross, T. (2018). Optimization of fiber prediction model coefficients in injection molding simulation based on micro computed tomography. Polymer Engineering and Science, 52(2), 152-160 http://dx.doi.org/10.1002/pen.25013
11. Onken, J., Verwaayen, S., & Hopmann, C. (2020). Evaluation of healing models to predict the weld line strength of the amorphous thermoplastic polystyrene by injection molding simulation. Polymer Engineering and Science, 61(3), 754-766 http://dx.doi.org/10.1002/pen.25614.
12 Gruber, P. A. , & Miranda , D. A. (2020 ). Heat transfer simulation for decision making in plastic injection mold design. Polímeros: Ciência e Tecnologia, 30(1), e2020005 http://dx.doi.org/10.1590/0104-1428.08319
13 Cao, W., Shen, Y., Wang, P., Yang, H., Zhao, S., & Shen, C. (2019). Viscoelastic modeling and simulation for polymer melt flow in injection/compression molding. Journal of Non-Newtonian Fluid Mechanics, 274, 104186 http://dx.doi. org/10.1016/j.jnnfm.2019.104186
14 Xu, X., & Yu, P. (2017). Modeling and simulation of injection molding process of polymer melt by a robust SPH method. Applied Mathematical Modelling, 48, 384-409 http://dx.doi. org/10.1016/j.apm.2017.04.007
15. Marion, S., Sardo, L., Joffre, T., & Pigeonneau, F. (2023). First steps of the melting of an amorphous polymer through a hot-end of a material extrusion additive manufacturing. Additive Manufacturing, 65, 103435 http://dx.doi.org/10.1016/j. addma.2023.103435.
16 Young, W.-B. (2017). Lattice Boltzmann simulation of polymer melt flow with a low Reynolds number. International Journal of Heat and Mass Transfer, 115, 784-792 http://dx.doi. org/10.1016/j.ijheatmasstransfer.2017.08.080
17 Zdanski, P. S. B., & Vaz, M., Jr. (2011). A numerical method for simulation of incompressible three-dimensional newtonian and non-newtonian flows. Numerical Heat Transfer Part B , 59 (5), 360-380 http://dx.doi.org/10.1080/10407790.20 11.572727
18 Tutar, M., & Karakus, A. (2014). Numerical study of polymer melt flow in a three-dimensional sudden expansion: viscous dissipation effects. Journal of Polymer Engineering, 34(8), 755-764 http://dx.doi.org/10.1515/polyeng-2013-0273
19. Gao, P. (2022). Three dimensional finite element computation of the non-isothermal polymer filling process by the phase field model. Advances in Engineering Software, 172, 103207 http://dx.doi.org/10.1016/j.advengsoft.2022.103207
20 Fernandes, C., Pontes, A. J., Viana, J. C., & Gaspar-Cunha, A. (2016). Modeling and optimization of the injection-molding process: a review. Advances in Polymer Technology, 37(2), 429-449 http://dx.doi.org/10.1002/adv.21683
21 Liao, T., Zhao, X., Yang, X., Whiteside, B., Coates, P., Jiang, Z., & Men, Y. (2019). Predicting the location of weld line in microinjection‐molded polyethylene via molecular orientation distribution. Journal of Polymer Science. Part B, Polymer Physics , 57 (24), 1705-1715 http://dx.doi.org/10.1002/ polb.24905
Polímeros, 34(1), e20240011, 2024 8/9
A methodology for determination the inlet velocity in injection molding simulations
22 Mourya, A., Nanda, A., Parashar, K., Sushant, & Kumar, R. (2022). An explanatory study on defects in plastic molding parts caused by machine parameters in injection molding process. Materials Today: Proceedings, 78(Pt 3), 656-661 http://dx.doi.org/10.1016/j.matpr.2022.12.070
23 Corazza, E. J., Sacchelli, C. M., & Marangoni, C. (2012). Cycle time reduction of thermoplastic injection using nitriding treatment surface molds. Información Tecnológica, 23(3), 5158. http://dx.doi.org/10.4067/S0718-07642012000300007.
24 Miranda, D. A., Rauber, W. K., Vaz, M., Jr., Alves, M. V. C., Lafratta, F. H., Nogueira, A. L., & Zdanski, P. S. B. (2023). Analysis of numerical modeling strategies to improve the accuracy of polymer injection molding simulations. Journal of Non-Newtonian Fluid Mechanics, 315, 105033 http://dx.doi. org/10.1016/j.jnnfm.2023.105033
25 Gim, J., & Turng, L.-S. (2022). A review of current advancements in high surface quality injection molding: measurement, influencing factors, prediction, and control. Polymer Testing, 115, 107718 http://dx.doi.org/10.1016/j.polymertesting.2022.107718
26 Hentati, F., Hadriche, I., Masmoudi, N., & Bradai, C. (2020). Experimental design to enhance the surface appearance, the internal structure, and the shear stresses of injected and metallized polycarbonate/acrylonitrile–butadiene-styrene parts. Journal of Applied Polymer Science, 137(7), 48384 http://dx.doi.org/10.1002/app.48384
27 Yu, S., Kong, W., Xu, L., Zou, J., Han, W., Liu, Z., Luo, J., Xie, Z., Wu, H., & Zhou, H. (2023). Cellular distribution and warpage deformation in double-sided in-mold decoration combined with microcellular injection molding process. Journal of Materials Processing Technology, 317, 117982 http://dx.doi.org/10.1016/j.jmatprotec.2023.117982
28 Acrylonitrile Butadiene Styrene – ABS. (2010). ABS –750Data Sheet of Acrylonitrile Butadiene Styrene South Korea: Kumho Petrochemical
29 Miranda, D. A., Rauber, W. K., Vaz, M., Jr., Nogueira, A. L., Bom, R. P., & Zdanski, P. S. B. (2023). Evaluation of the predictive capacity of viscosity models in polymer melt filling simulations. Journal of Materials Engineering and Performance, 32(4), 1707-1720 http://dx.doi.org/10.1007/s11665-022-07200-w
30 Marin, F., Souza, A. F., Ahrens, C. H., & Lacalle, L. N. L. (2021). A new hybrid process combining machining and selective laser melting to manufacture an advanced concept of conformal cooling channels for plastic injection molds. International Journal of Advanced Manufacturing Technology, 113(5), 1561-1576 http://dx.doi.org/10.1007/s00170-021-06720-4
31 Kennedy, P. K. (2008). Practical and scientific aspects of injection molding simulation (Doctoral thesis). Technische Universiteit Eindhoven, Eindhoven, Netherlands http://dx.doi. org/10.6100/IR634914
32. Hétu, J.-F., Gao, D. M., Garcia-Rejon, A., & Salloum, G. (1998). 3D finite element method for the simulation of the filling stage in injection molding. Polymer Engineering and Science , 38 ( 2 ), 223 - 236 http://dx.doi.org/10.1002/ pen.10183
33. Solanki, B. S., Singh, H., & Sheorey, T. (2022). Towards an accurate pressure estimation in injection molding simulation using surrogate modeling. International Journal on Interactive Design and Manufacturing, 16(4), 1615-1632. http://dx.doi. org/10.1007/s12008-022-00887-0
34 Saad, S., Sinha, A., Cruz, C., Régnier, G., & Ammar, A. (2022). Towards an accurate pressure estimation in injection molding simulation using surrogate modeling. International Journal of Material Forming, 15(6), 72 http://dx.doi.org/10.1007/ s12289-022-01717-0
35 Trad, M. A. B. , Demers , V., Côté, R., Sardarian , M., & Dufresne, L. (2020). Numerical simulation and experimental investigation of mold filling and segregation in low-pressure powder injection molding of metallic feedstock. Advanced Powder Technology , 31 ( 3 ), 1349 - 1358 http://dx.doi. org/10.1016/j.apt.2020.01.018
36. Miranda, D. A., & Nogueira, A. L. (2019). Simulation of an injection process using a CAE tool: assessment of operational conditions and mold design on the process efficiency. Materials Research, 22(2), e20180564. http://dx.doi.org/10.1590/19805373-mr-2018-0564
37 Marin, F., Souza, A. F., Pabst, R. G., & Ahrens, C. H. (2019). Influences of the mesh in the CAE simulation for plastic injection molding. Polímeros, 29(3), e2019043 http://dx.doi. org/10.1590/0104-1428.05019
38 Richardson, L. F. (1911). The approximate arithmetical solution by finite differences of physical problems involving differential equations with an application to the stresses in a masonary dam. Philosophical Transactions of the Royal Society of London. Series A, Containing Papers of a Mathematical or Physical Character, 210(459-470), 307-357 http://dx.doi. org/10.1098/rsta.1911.0009
Received: Nov. 13, 2023
Revised: Feb. 26, 2024
Accepted: Mar. 05, 2024
Polímeros, 34(1), e20240011, 2024 9/9
All-polymer-based ammonia gas sensor: applying insights from the morphology-driven ac electrical performance
Ana Carolina Kelmer1 , Cleidinéia Cavalcante da Costa2* and Rodrigo Fernando Bianchi2
1Courage and Khazaka Electronic, Cologne, Germany
2Laboratório de Polímeros e de Propriedades Eletrônicas de Materiais, Departamento de Física, Universidade Federal de Ouro Preto – UFOP, Ouro Preto, MG, Brasil
*cleidineiastm@gmail.com
Obstract
This paper investigates the electrical, morphological, and mechanical behavior of ultrathin layer-by-layer polyaniline/ poly(vinyl sulfonic acid) (PANI/PVS) ultrathin films for ammonia gas sensing. Atomic force microscopy shows that the PANI/PVS surface’s roughness increases almost linearly with the number of PANI/PVS bilayers, while the surface morphology varies from a rod-like structure to a film-like architecture. Impedance measurements and their representation by a Cole-Cole model confirm this transition at ~15 bilayers. The designed sensor shows low response time (< 1 min), an optimal operating frequency range (1–100 Hz), high stability and sensibility to ammonia (~ 98 kΩ/ppm), and low sensibility to strain (~ 3.6 kΩ/%). This study suggests that hopping carriers’ concentration remains constant, and hopping carriers’ mobility changes with the number of bilayers. The simultaneous analysis of morphology with complex impedance measurements is a strategy for enhancing the electrical performance of low-cost and flexible organic sensing devices.
Keywords: conductivity, printed devices, sensing devices, strain gauges, topology.
How to cite: Kelmer, A. C., Costa, C. C., & Bianchi, R. F. (2024). All-polymer-based ammonia gas sensor: applying insights from the morphology-driven ac electrical performance. Polímeros: Ciência e Tecnologia, 34(1), e20240012. https://doi.org/10.1590/0104-1428.20230070
1. Introduction
There has been substantial interest in the manufacture of flexible electronic materials and device innovations, including flexible displays[1], wearable health monitoring[2] , and gas detection technologies[3]. Furthermore, conjugated polymers have attracted the attention of industries due to their excellent characteristics for sensing applications, such as the possibility of tuning chemical and physical properties using different substituents, as mentioned in the literature review[4]. However, this field’s main challenge is still achieving high-performance devices with ultra-sensitive detection, fast response, low consumption, reproducibility, easy fabrication, mechanical and electrical stabilities, and good portability and flexibility[5-8]. In fact, a comprehensive understanding of the physical principles underlying surface morphology, electrical behavior, and mechanical properties are desired for the design of high-performance flexible devices using solution-processable components on flexible substrates[9-13] This is the case for polyaniline (PANI)-based devices used to detect harmful gases which response depends on the type (dc or ac) electrical measurements to characterize the gas under examination[13-20]. This situation leads to measurement-tomeasurement variations[21,22]. Many studies have focused on the electrical field frequency-dependent impedance characteristics of ultrathin semiconducting polymer-based sensors as a practical solution to avoid sensor instability effects[13,23-27]
This paper highlights the importance of simultaneously exploring the morphology and complex impedance measurements
to provide a powerful methodology for enhancing the electrical performance of promising polymer-based flexible ultrathin films for sensor technology development.
2. Materials and Methods
2.1 Ultrathin layer-by-layer (LBL) films
Ultrathin layer-by-layer (LBL) films formed by alternating layers of positively charged PANI and negatively charged poly(vinyl sulfonic acid) (PVS) were prepared on flexible polystyrene (PS) substrate (thickness of ~200 µm and area of ~600 mm2) according to the procedures described by Santos et al.[26] PANI/PVS adsorption was monitored by ultraviolet-visible (UV-Vis) spectroscopy with a Shimadzu UV-1650PC spectrophotometer. Finally, an estimation for a single PANI/PVS bilayer thickness, ~ (4 ± 1) nm, was obtained by measuring the thickness of a 40 bilayers film using a DekTak 6 M Stylus Profiler from Veeco Instruments Inc. More details can be found in our previous paper[26] . The morphological surface properties of the PANI/PVS/ PS films were studied by atomic force microscopy (AFM, Park System XE7-Series SPM Controller) operating in non-contact mode with NSC35/Al BS cantilevers, which allowed us to characterize the surface of the bilayers on the flexible (i.e. polystyrene) substrate. More details of AFM image analysis can be found in our previous paper[28]
https://doi.org/10.1590/0104-1428.20230070 O O O O O O O O O O O O O O O Polímeros, 34(1), e20240012, 2024 ISSN 1678-5169 (Online) 1/7
Kelmer, A. C., Costa, C. C., & Bianchi, R. F.
2.2 PANI/PVS ammonia gas sensor results
Figure 1 shows a schematic illustration of the fabrication process of semiconducting polymer PANI/PVS-based flexible devices. The ultrathin LBL films were obtained by alternating layers of positively charged PANI and negatively charged PVS on flexible PS using the same procedure described by Santos et al.[26] shown in Figure 1a Figure 1b shows the representation of the PANI/PVS films on the PS substrate. A parallel pair of solution-processed silver electrodes (thickness of ~3 µm) on the PANI/PVS surface was obtained from a screen-printing technique that uses CI-1001 ECM silver ink and a screen mask (polyester stencil screen) with well-defined windows, as shown in Figure 1c. A mechanical cutting process (Figure 1d) was used to establish single sensors (Figure 1e). An image of the ammonia gas sensors using PANI/PVS films on the PS substrate is shown in Figure 1f.
2.3 Electrical characterization
Complex impedance measurements, Z*(f) = Z’(f)iZ’’(f), of the PANI/PVS sensors, were carried out using a 1260 Solartron frequency response analyzer in the 1 to 106 Hz frequency range, with a voltage amplitude equal to 1.5 V. All electrical measurements were carried out in a homemade gas chamber at room temperature. More details can be found in[26,27,29]. The ammonia-air mixture was injected into the chamber at a 1 ppm/min rate, which was continuously recorded during the electrical measurements using a high-performance electrochemical diffusion ammonia sensor (Instrutherm DG-200). Uniaxial tensile experiments were carried out for mechanical testing using an EMIC DL2000 Universal Testing Machine from 0 to 250 N (or 0 to 25\% strain) with a 500 kgf load cell and simultaneously
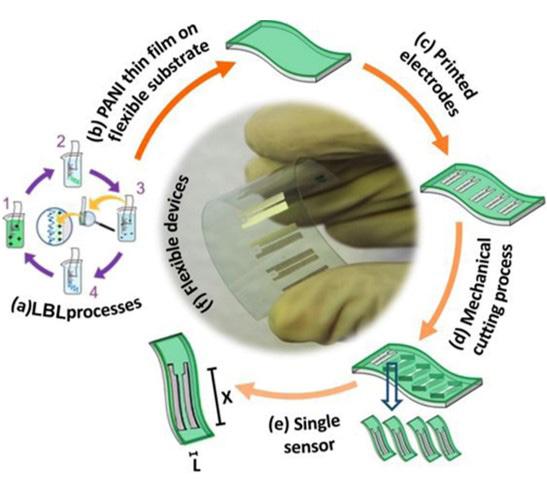
Figure 1. Schematic illustration of the fabrication process of the PANI/PVS-based flexible devices. (a) Ultrathin LBL films formed from alternating layers of PANI/PVS on a PS substrate; (b) Representation of the PANI/PVS films and (c) a parallel pair of printed electrodes (thickness of ~3 µm, length (X) of 10 mm and distance (L) of 600 µm). (d) Mechanical cutting process to (e) establish a single sensor (area of 0.5 cm2); (f) Image of ammonia gas sensors using ultrathin PANI/PVS films on the PS substrate.
for the complex impedance measurements using the same procedure as described elsewhere[13]
Finally, to confirm the reproducibility, stability, and operating range of the sensor, repeated ten cycles of electrical measurements were made using three films from the same batch.
3. Results and Discussions
Figure 2 shows the multilayer film growth and morphological characterization of the PANI/PVS ultrathin films grown by LBL deposition on the PS substrate from 0 to 25 bilayers (n). UV-Vis absorption spectroscopy (Figure 2a) showed that the multilayer LBL films can be grown in a controlled way in terms of thickness at the nanometre scale, indicating that the same amount of material was adsorbed in each deposition step[30]. The inset in Figure 2a shows the linear dependence of the PANI/PVS thickness on n. This linear dependence was obtained from the UV-Vis absorption spectra at 900 nm. Figure 2b shows the AFM images obtained from n equal to 0, 1, 15, and 25. For n varying from 1 to 15, the AFM images suggest that the film growth results from PANI/PVS particles’ nucleation on the surface, where the height growth rate is higher compared to their growth laterally. However, a transition is observed in film grown at n ~ 15. In this case, when n varies from 15 to 25, the lateral growth rate is higher compared to their growth in height. For n ≥ 15, this result suggests that the morphology of PANI/PVS on PS varied from a rod-like structure to a film-like architecture, becoming more uniform gradually thickness-homogeneous films for a further improvement in device performance over n to obtain. This rod-like to film-like transition is consistent with the previous studies of Santos et al.[31] and Lobo et al.[32], where 25 bilayers of PANI/ PVS films on a glass substrate were more homogeneous than films with n < 15, resulting in a smooth surface morphology, which is highly desirable to ensure a uniform electrical field distribution along with the polymer sensor. Furthermore, the advantage of the architecture over the rod structure for device performance is important to optimize the performance of the semiconductor thin film by the density of hopping carriers proportionally with n. This growth process is represented in Figure 2c, where the evolution of UV-Vis absorption at 900 nm and average roughness of PANI/PVS shows a behavior transition at n = 15[31]. The self‐nucleation of PANI/ PVS particles is represented in Figure 2d with increasing bilayers in the PS substrate to which linear fitting obtained corresponds (4.8 ± 0.6).
Figure 3 shows how the Z’(f) and Z’’(f) components (Bode and Nyquist plots) of the flexible PANI/PVS-based sensors vary with n from 5 to 25 (Figure 3a), and also for n = 25 varying the ammonia gas concentration (Figure 3b) and strain (Figure 3c) from 0 at 25 ppm and from 0 at 25%, respectively. According to Lobo et al.[32], in the LBL technique the increase in the number of bilayers results from by compaction of the semiconductor polymer molecules. The result in Figure 3a demonstrates that the molecular aggregation favors the reduction of the value of Z’(f) from dc regime (f → 0) which would increase electrical conductivity. Therefore, we choose n = 25 to investigate
Polímeros, 34(1), e20240012, 2024 2/7
All-polymer-based ammonia gas sensor: applying insights from the morphology-driven ac electrical performance
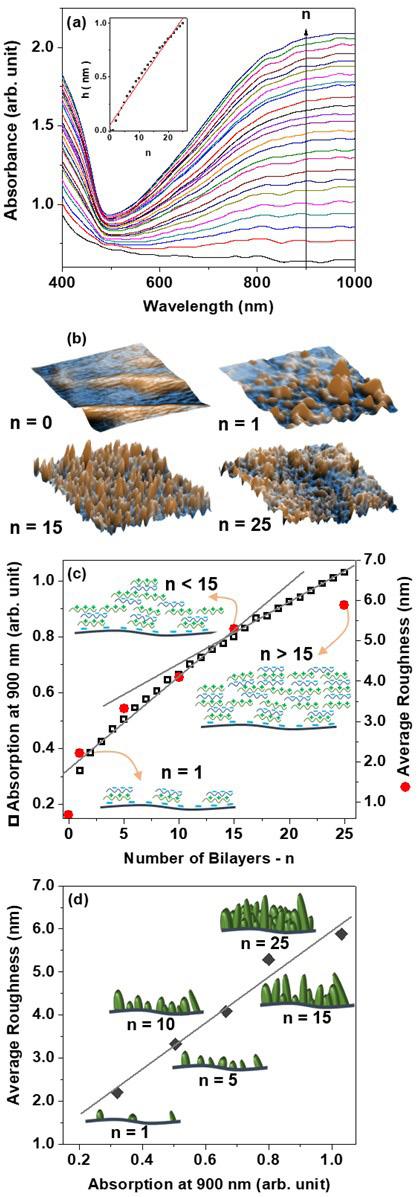
Figure 2. Multilayer film growth and morphological characterisation of PANI/PVS ultrathin films grown by LBL deposition on the PS substrate. (a) UV–Vis absorption spectra of PANI/PVS films for n = 1–25. The insert shows the linear dependence of PANI/ PVS thickness on n; (b) AFM images (2.5 × 2.5 µm2) of n onto PS substrate; (c) UV–Vis absorption at 900 nm and the average roughness according to n, showing a schematic representation of the growth transition at n = ~15; (d) Linear correlation of PANI absorption at 900 nm and average roughness associated with the PANI/PVS growth mechanism changing from a rod-like structure (n < 15) to a film-like architecture (n ≥ 15).
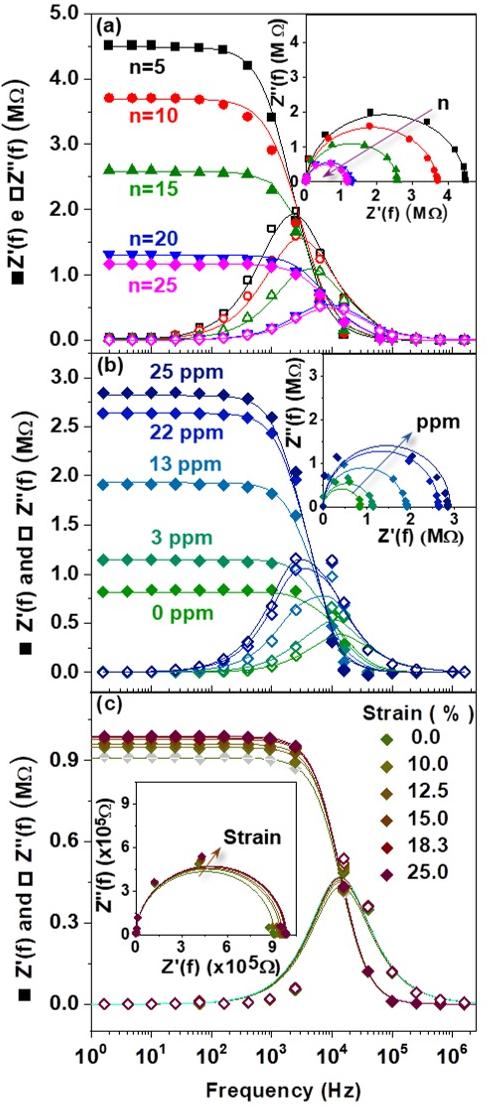
Figure 3. Real, Z’(f), and imaginary, Z’’ (f), components of the complex impedance, Argand diagram [Z’(f) vs. Z’’(f)] and the experimental-theoretical fittings using the Cole-Cole model represented by the full lines. (a) PANI/PVS films with n from 5 to 25. The inset shows an illustration of a Ag electrode pair and its contact area with the film; (b) A PANI/PVS flexible device (made from 25 bilayers of PANI/PVS) exposed to 0, 3, 13, 22 and 25 ppm of ammonia gas levels; (c) PANI/PVS flexible device under tensile stress varying the initial length from 0 to 3 mm. The inset shows the PANI/PVS device with initial length L0 and under stress T with varying the length L1 (0–3 mm).
device performance under ammonia to guarantee a film-like architecture for the PANI/PVS films.
Figure 3 shows the quasi-Debye dispersion patterns to all Z’(f) and Z’’(f). These behaviours allow the representation of complex impedance by the Cole-Cole relaxation model,
Polímeros, 34(1), e20240012, 2024 3/7
Kelmer, A. C., Costa, C. C., & Bianchi, R. F.
Equation 1, in which a parallel resistor-capacitor circuit to model the store/dissipated charge effects is used to represent the symmetric parameter (0 < α < 1) related to the relaxation peaks of the PANI/PVS films[13]
for a flexible ammonia sensor with high mechanical stability. In this figure, S is the sensitivity coefficient of the device for n (S = 0.6 ± 0.3 MΩ/n), [NH3] (S = 98 ± 2 kΩ/ppm) and strain (S = 3.6 ± 0.5 kΩ/%).
Table 1 shows the parameters obtained from the fitting of Z’(f) and Z’’(f) using Equation 1) for a flexible PANI/PVSbased sensor for different n values, ammonia concentrations ([NH3]) and strain values. The results show that the electrical resistance (R) of the PANI/PVS films decreases with n and increases with ammonia concentration and strain. At the same time, the capacitance (≈ 10-11 F) and the parameter (α = 0.99) are almost independent of n, [NH3], and strain. The α < 1 and the dielectric constant k ≈ 105, obtained by C = kε0Xh/L (using X = 10 mm), h = 100 nm for n = 25 and L = 600 µm), supporting the establishment of mesoscopic metallic regions from the increasing percent crystallinity, the size of crystalline regions, and/or polymer chain alignment in the disordered regions of PANI-based films[33]. This is in good agreement with ref[30]. Moreover, the value of k is typical of PANI[32], and Z’(f) = R in the 1 to 100 Hz frequency range, the sensibility of the sensor for n, [NH3], and strain are ~1.8 MΩ/unit, 98 kΩ/ppm, and 3.6 kΩ%, respectively.
From Figure 4, we can observe the linear variation of normalized resistance (R/R0) obtained from the fittings of Z’(f) and Z’’(f) using Equation 1 as a function of n (Figure 4a), [NH3] (Figure 4b) and strain (Figure 4c). In this figure, R0 is the resistance value obtained when n = 5, [NH3] = 0 ppm and zero strain. Taken together, these findings highlight that the PANI/PVS films act as a resistive sensor for ammonia in which the operating frequency range is 1 to 100 Hz and show low strain sensing behavior, thereby fulfilling the requirements
Table 1. Data for fitting using Equation 1 for samples with different n, doping (ppm) and tensile stress (%) varying from 5 to 25 bilayers, 0 to 25 ppm and 0 to 25%, respectively. The parameter α = 0.99 was obtained for all experimental-theoretical fittings.
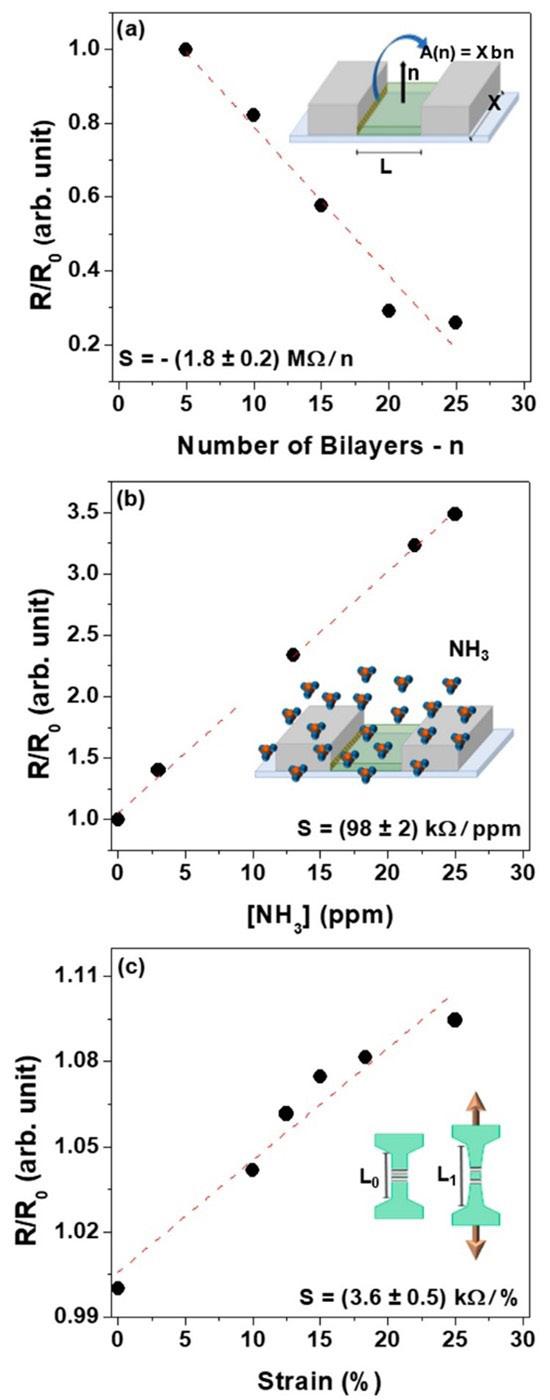
[NH3] = 0
Figure 4. Sensitivity of flexible PANI/PVS devices by correlating the electrical resistance quotient using the initial value R/R0 and (a) n = 0–25; (b) the ammonia gas concentration level ranging from 0 to 25 ppm and (c) the stretching of the flexible PANI/PVS devices ranging from 0 to 25% of the initial size L0. The standard error of the curves ~ 20%.
Polímeros, 34(1), e20240012, 2024 4/7
( ) ( ) * / 1 2 ZfRifRC α =+ (1)
R (MΩ) C (10-11F) n (unit) 5 4.49 1.50 [NH
Strain = 0 10 3.70 1.45 15 2.59 1.44 20 1.31 1.41 25 1.17 1.39 n
25 0 0.85 1.40
0 3 1.10 1.43 13 1.85 1.46 22 2.64 1.49 25 2.90 1.51 n = 25 0 0.91 1.24
3]=0
=
[NH3] (ppm) Strain =
Strain (%) 12 0.95 1.20 15 0.97 1.19 18 0.98 1.17 25 0.99 1.16
All-polymer-based ammonia gas sensor: applying insights from the morphology-driven ac electrical performance
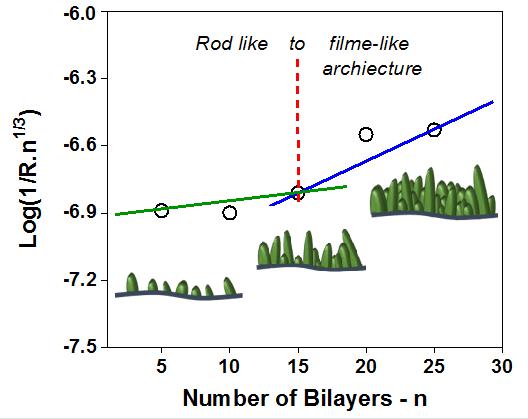
Figure 5. Log 1/(R.n1/3) vs. n1/3 using Equation 2 and the parameters R and n from Table 1 . Standard error for 5 ≤ n ≤ 15 and of 15 ≤ n ≤ 25 regions are lower than 10 %.
For the study of the conduction process of ultrathin PANI/ PVS sensors, we assume that the admittance (1/R) is directly proportional to both electrical current and the nucleation of PANI/PVS particles induced by n (or the film growth) through the electronic hopping process described[25,33-35], and in agreement with both the establishment of mesoscopic metallic regions (conductive islands)[33] and the AFM results shown in Figure 2b. For this case, we expected the following dependence of the dc conductivity, represented here by 1/ Rn1/3 and that the concentration of hopping carriers remains constant independent of n[25,34] according to the expression:
) 1/1/3 1/3
It indicates that the mobility of hopping carriers may changes with the number of bilayers, while the concentration of hopping carriers remains constant. These effects are similar to those observed due to the doping level in polyaniline[32] .
Figure 5 shows the Log 1/(R.n1/3) vs. n curve obtained through Equation 2. From the results shown in Figure 5, it is concluded that the mobility of hopping carriers changes with n. In contrast, the concentration of hopping carriers remains constant, as expected for moderately doped PANI[25,33,34] Furthermore, n = 15 represents a region of rod-like transition to film-like architecture, as seen in Figure 2b
In this equation, ω is the angular frequency obtained by ω = 2πf, R is the dc electrical resistance, C is the electrical capacitance, and α is a parameter of dielectric relaxation that can assume values between 0 and 1; this shows that the distribution of relaxation times was highly.
4. Conclusions
We have explored the AC electrical, morphological, and mechanical behavior of ultrathin PANI/PVS films by combining AC, morphology, ammonia concentration and tensile stress-strain measurements for improving flexible device performance. We employed the complex impedance technique for the proper adjustment of the
operating frequency of the device. This approach has the potential features to effectively distinguish the resistive and capacitive contributions of the PANI-based sensor in a wide frequency range. Consequently, it establishes an operating frequency range from 10 to 100 Hz and response time (< 1 min) of the solution-processed sensor. The empirical Cole-Cole relaxation function was chosen to investigate the ultrathin polymer film-based flexible films. The Cole-Cole dielectric response provided the same dielectric parameter (α < 1) to all cases. This suggests that the distribution of the circuit elements on the bulk of the material is almost homogeneous. The distribution of relaxation times depends on the LBL process, the chemical doping, or the mechanical deformation. Meanwhile, the surface morphology varies from a rod-like structure to a film-like architecture, and the mobility of hopping carriers changes with n while the concentration of hopping carriers remains constant. The uniform and homogeneous surface of PANI/PVS films improve device performance avoiding electrode effects, as shown in ref.,[30] and the rod-like structure. Finally, our study provides an extensive analysis of polymer-based flexible devices from impedance spectroscopy measurements in a wide frequency range. Our results demonstrated that PANI/PVS ultra-thin films have electrical sensitivity for mechanical strain varying from 0 to 25%. In addition to all this, it highlights the importance of simultaneously exploring the morphology and complex impedance measurements to provide a powerful methodology for enhancing polymers’ electrical performance for sensor technology development.
5. Author’s Contribution
• Conceptualization – Rodrigo Fernando Bianchi; Ana Carolina Kelmer; Cleidinéia Cavalcante da Costa.
• Data curation – Rodrigo Fernando Bianchi; Ana Carolina Kelmer; Cleidinéia Cavalcante da Costa.
• Formal analysis – Rodrigo Fernando Bianchi; Ana Carolina Kelmer.
• Funding acquisition – Rodrigo Fernando Bianchi.
• Investigation – Rodrigo Fernando Bianchi; Ana Carolina Kelmer; Cleidinéia Cavalcante da Costa.
• Methodology – Rodrigo Fernando Bianchi; Ana Carolina Kelmer; Cleidinéia Cavalcante da Costa.
• Project administration – Rodrigo Fernando Bianchi; Ana Carolina Kelmer; Cleidinéia Cavalcante da Costa.
• Resources – Rodrigo Fernando Bianchi; Ana Carolina Kelmer; Cleidinéia Cavalcante da Costa.
• Software – Rodrigo Fernando Bianchi; Ana Carolina Kelmer; Cleidinéia Cavalcante da Costa.
• Supervision – Rodrigo Fernando Bianchi.
• Validation – Rodrigo Fernando Bianchi; Ana Carolina Kelmer; Cleidinéia Cavalcante da Costa.
• Visualization – Rodrigo Fernando Bianchi; Ana Carolina Kelmer; Cleidinéia Cavalcante da Costa.
• Writing – original draft – Rodrigo Fernando Bianchi; Ana Carolina Kelmer; Cleidinéia Cavalcante da Costa.
Polímeros, 34(1), e20240012, 2024 5/7
(
LogRnn ≈ (2)
Kelmer, A. C., Costa, C. C., & Bianchi, R. F.
• Writing – review & editing – Rodrigo Fernando Bianchi; Ana Carolina Kelmer; Cleidinéia Cavalcante da Costa.
6. Acknowledgements
This work was supported by INEO, FAPEMIG (APQ03165-17), CNPq (308185/2016-1) and CAPES (001).
7. References
1 Zhang, D., Huang, T., & Duan, L. (2020). Emerging selfemissive technologies for flexible displays. Advanced Materials, 32(15), 1902391. http://dx.doi.org/10.1002/adma.201902391. PMid:31595613.
2 Wang, L. , Lou, Z. , Jiang, K. , & Shen, G. (2019). Bio‐multifunctional smart wearable sensors for medical devices. Advanced Intelligent Systems, 1(5), 1900040 http://dx.doi. org/10.1002/aisy.201900040
3 Feng, S., Farha, F., Li, Q., Wan, Y., Xu, Y., Zhang, T., & Ning, H. (2019). Review on smart gas sensing technology. Sensors (Basel), 19(17), 3760 http://dx.doi.org/10.3390/s19173760 PMid:31480359.
4 Wang, Y., Liu, A., Han, Y., & Li, T. (2020). Sensors based on conductive polymers and their composites: a review. Polymer International, 69(1), 7-17 http://dx.doi.org/10.1002/pi.5907
5 Bandodkar, A. J., Jeerapan, I., & Wang, J. (2016). Wearable chemical sensors: present challenges and future prospects. ACS Sensors , 1 (5), 464-482 http://dx.doi.org/10.1021/ acssensors.6b00250.
6 Hussain, A. M., Ghoneim, M. T., Rojas, J. P., & Fahad, H. (2019). Flexible and/or stretchable sensor systems. Journal of Sensors, 2019, 1828394 http://dx.doi.org/10.1155/2019/1828394
7 Dahiya, R., Yogeswaran, N., Liu, F., Manjakkal, L., Burdet, E., Hayward, V., & Jorntell, H. (2019). Large-area soft e-skin: the challenges beyond sensor designs. Proceedings of the IEEE, 107(10), 2016-2033 http://dx.doi.org/10.1109/ JPROC.2019.2941366
8 Kumar, K. S., Chen, P.-Y., & Ren, H. (2019). A review of printable flexible and stretchable tactile sensors. Research, 2019, 3018568 http://dx.doi.org/10.34133/2019/3018568
9 Bach-Toledo, L., Hryniewicz, B. M., Marchesi, L. F., Dall’Antonia, L. H., Vidotti, M., & Wolfart, F. (2020). Conducting polymers and composites nanowires for energy devices: a brief review. Materials Science for Energy Technologies, 3, 78-90 http:// dx.doi.org/10.1016/j.mset.2019.09.006.
10 Haneef, H. F., Zeidell, A. M., & Jurchescu, O. D. (2020). Charge carrier traps in organic semiconductors: a review on the underlying physics and impact on electronic devices. Journal of Materials Chemistry. C, Materials for Optical and Electronic Devices, 8(3), 759-787. http://dx.doi.org/10.1039/ C9TC05695E
11 McBride, M., Liu, A., Reichmanis, E., & Grover, M. A. (2020). Toward data-enabled process optimization of deformable electronic polymer-based devices. Current Opinion in Chemical Engineering, 27, 72-80 http://dx.doi.org/10.1016/j. coche.2019.11.009.
12 Mapa, L. M., Golin, A. F., Costa, C. C., & Bianchi, R. F. (2019). The use of complex impedance spectroscopy measurements for improving strain sensor performance. Sensors and Actuators. A, Physical , 293 , 101-107 http://dx.doi.org/10.1016/j. sna.2019.02.001.
14 Alrammouz, R., Podlecki, J., Abboud, P., Sorli, B., & Habchi, R. (2018). A review on flexible gas sensors: from materials to devices. Sensors and Actuators. A, Physical, 284, 209-231 http://dx.doi.org/10.1016/j.sna.2018.10.036.
15 Zhang, W., Wu, Z., Hu, J., Cao, Y., Guo, J., Long, M., Duan, H., & Jia, D. (2020). Flexible chemiresistive sensor of polyaniline coated filter paper prepared by spraying for fast and non-contact detection of nitroaromatic explosives. Sensors and Actuators. B, Chemical, 304, 127233 http:// dx.doi.org/10.1016/j.snb.2019.127233
16 Fratoddi, I., Venditti, I., Cametti, C., & Russo, M. V. (2015). Chemiresistive polyaniline-based gas sensors: a mini review. Sensors and Actuators. B, Chemical, 220, 534-548 http:// dx.doi.org/10.1016/j.snb.2015.05.107
17 Nagare, A. B., Harale, N. S., Mali, S. S., Nikam, S. S., Patil, P. S., Hong, C. K., & Moholkar, A. V. (2019). Chemiresistive ammonia gas sensor based on branched nanofibrous polyaniline thin films. Journal of Materials Science Materials in Electronics, 30(13), 11878-11887 http://dx.doi.org/10.1007/s10854-01901514-7
18 Zhang, T., Qi, H., Liao, Z., Horev, Y. D., Panes-Ruiz, L. A., Petkov, P. S., Zhang, Z., Shivhare, R., Zhang, P., Liu, K., Bezugly, V., Liu, S., Zheng, Z., Mannsfeld, S., Heine, T., Cuniberti, G., Haick, H., Zschech, E., Kaiser, U., Dong, R., & Feng, X. (2019). Engineering crystalline quasi-two-dimensional polyaniline thin film with enhanced electrical and chemiresistive sensing performances. Nature Communications, 10(1), 4225 http:// dx.doi.org/10.1038/s41467-019-11921-3 PMid:31548543.
19 Song, E., & Choi, J.-W. (2013). Conducting polyaniline nanowire and its applications in chemiresistive sensing. Nanomaterials (Basel, Switzerland), 3(3), 498-523. http://dx.doi.org/10.3390/ nano3030498. PMid:28348347.
20 Souza, N. C., Silva, J. R., Pereira-Da-Silva, M. A., Raposo, M., Faria, R. M., Giacometti, J. A., & Oliveira, O. N. (2004). Dynamic scale theory for characterizing surface morphology of layer-by-layer films of poly(o-Methoxyaniline). Journal of Nanoscience and Nanotechnology, 4(5), 548-552 http://dx.doi. org/10.1166/jnn.2004.084 PMid:15503441.
21 Bao, Q., Braun, S., Wang, C., Liu, X., & Fahlman, M. (2019). Interfaces of (Ultra)thin polymer films in organic electronics. Advanced Materials Interfaces, 6(1), 1800897 http://dx.doi. org/10.1002/admi.201800897
22. Ramgir, N. S. (2013). Electronic nose based on nanomaterials: issues, challenges, and prospects. ISRN Nanomaterials, 2013, 941581 http://dx.doi.org/10.1155/2013/941581
23 Couto, J. D., Santos, M. C., & Bianchi, R. F. (2019). Exploring the universality of the alternating conductivity of disordered materials using gaussian distribution of activation energies. Materials Research Express, 6(4), 046302 http://dx.doi. org/10.1088/2053-1591/aad1ce
24 Wong, Y. C., Ang, B. C., Haseeb, A. S. M. A., Baharuddin, A. A., & Wong, Y. H. (2020). Conducting polymers as chemiresistive gas sensing materials: a review. Journal of the Electrochemical Society, 167(3), 037503 http://dx.doi. org/10.1149/2.0032003JES
25. Calheiro, D. S., & Bianchi, R. F. (2019). Tuning the detection limit in hybrid organic-inorganic materials for improving electrical performance of sensing devices. Sensors and Actuators. A, Physical, 298, 111480 http://dx.doi.org/10.1016/j. sna.2019.07.005
26 Santos, M. C., Bianchi, A. G. C., Ushizima, D. M., Pavinatto, F. J., & Bianchi, R. F. (2017). Ammonia gas sensor based on the frequency-dependent impedance characteristics of ultrathin
13 Santos, M. C., Hamdan, O. H. C., Valverde, S. A., Guerra, E. M., & Bianchi, R. F. (2019). Synthesis and characterization of v2o5/pani thin films for application in amperometric ammonia gas sensors. Organic Electronics, 65, 116-120 http://dx.doi. org/10.1016/j.orgel.2018.11.013
Polímeros, 34(1), e20240012, 2024 6/7
All-polymer-based ammonia gas sensor: applying insights from the morphology-driven ac electrical performance
polyaniline films. Sensors and Actuators. A, Physical, 253, 156-164 http://dx.doi.org/10.1016/j.sna.2016.08.005
27. Diniz, M. O., Golin, A. F., Santos, M. C., Bianchi, R. F., & Guerra, E. M. (2019). Improving performance of polymerbased ammonia gas sensor using POMA/V2O5 hybrid films. Organic Electronics, 67, 215-221 http://dx.doi.org/10.1016/j. orgel.2019.01.039
28 Faria, A. M. A., Miranda, M. A., Gonçalves, G. E., Bianchi, R. F., Bianchi, A. G. C., Cuba, C., Neves, B. R. A., & Pinto, E. S. (2020). Partially ordered porous structures on layer-bylayer Polyaniline/Poly(Vinyl Sulfate Sodium) ultrathin films: easy fabrication of robust submicroscopic patterning. Journal of Applied Polymer Science, 137(17), 48597 http://dx.doi. org/10.1002/app.48597
29 Santos, M. C., Santos, F. A., Teixeira, F. P., Gonçalves, G. E., Bianchi, A. G. C., & Bianchi, R. F. (2007). Caracterização elétrica de filmes ultrafinos de PANI/PVS: material potencial para detecção de amônia em galpões de criação avícola. Polímeros: Ciência e Tecnologia, 20(3), 107-111 http://dx.doi. org/10.1590/S0104-14282010005000018
30. Ferreira, M., Fiorito, P. A., Oliveira, O. N., Jr., & Torresi, S. I. C. (2004). Enzyme-mediated amperometric biosensors prepared with the Layer-by-Layer (LbL) adsorption technique. Biosensors & Bioelectronics, 19(12), 1611-1615 http://dx.doi. org/10.1016/j.bios.2003.12.025 PMid:15142594.
32. Lobo, R. F. M., Pereira-da-Silva, M. A., Raposo, M., Faria, R. M., & Oliveira, O. N., Jr. (2003). The morphology of layerby-layer films of Polymer/Polyelectrolyte studied by atomic force microscopy. Nanotechnology, 14(1), 101-108 http:// dx.doi.org/10.1088/0957-4484/14/1/322
33. Bianchi, R. F., Ferreira, G. F. L., Lepienski, C. M., & Faria, R. M. (1999). Alternating electrical conductivity of polyaniline. The Journal of Chemical Physics, 110(9), 4602-4607 http:// dx.doi.org/10.1063/1.478341
34 Neto, J. M. G., Ferreira, G. F. L., Santos, J. R., Jr., Cunha, H. N., Dantas, I. F., & Bianchi, R. F. (2003). Complex conductance of Carnauba Wax/Polyaniline composites II experimental procedure experimental results. Brazilian Journal of Physics, 33(2), 371375 http://dx.doi.org/10.1590/S0103-97332003000200040
35 Bianchi, R. F., Cunha, H. N., Faria, R. M., Ferreira, G. F. L., & Neto, J. M. G. (2005). Electrical studies on the doping dependence and electrode effect of Metal-PANI-Metal structures. Journal of Physics. D, Applied Physics, 38(9), 1437-1443 http://dx.doi.org/10.1088/0022-3727/38/9/017
Received: Aug. 01, 2023
Revised: Nov. 05, 2023
Accepted: Jan. 07, 2024
31. Santos, M. C., Munford, M. L., & Bianchi, R. F. (2012). Influence of NiCr/Au electrodes and multilayer thickness on the electrical properties of PANI/PVS ultrathin film grown by Lbl deposition. Materials Science and Engineering B, 177(4), 359-366 http://dx.doi.org/10.1016/j.mseb.2011.12.039
Polímeros, 34(1), e20240012, 2024 7/7
HITACHI - TM4000Plus II
Microscópios Eletrônicos de Varredura/Transmissão
OXFORD - RMN XPulse
Ressonância Magnética Nuclear
SYMPATEC - QICPIC
Analisador de Formato e Tamanho de Partículas
HITACHI - TG-DTA-DSC / DMA / TMA
Análise Térmica


RIGAKU - NEX CG II+
Espectrômetro de Fluorescência de Raio-X
PSL RHEOTEK
Viscosímetro Automatizado
GÖTTFERT
Reômetro Capilar


COLORSPEC - DS-36D
Espectrofotômetro para Medição de Cor
FDGS
Gerador de Nitrogênio Gasoso


dpunion.com.br / info@dpunion.com.br Inovação tecnológica é nosso compromisso R. Monsenhor Basílio Pereira, 50 - Jabaquara, São Paulo - SP, 04343-090 | Tel.: (11)5079-8411
São Paulo 994 St. São Carlos, SP, Brazil, 13560-340 Phone: +55 16 3374-3949
Email: abpol@abpol.org.br 2021 2024
