Prof. Ailton de Souza Gomez
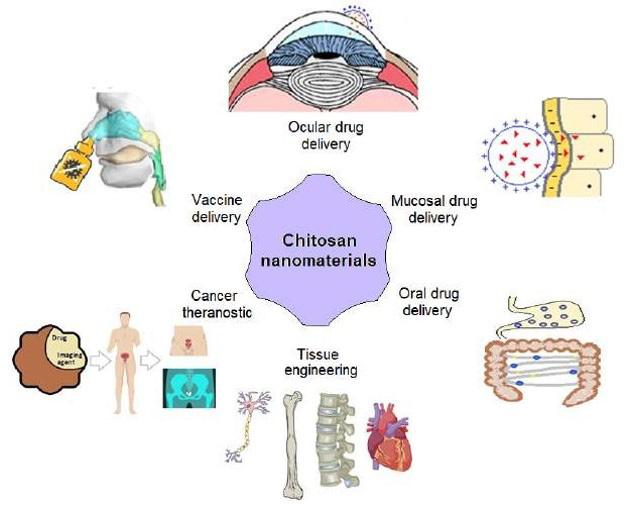
Biomedical applications of chitosan nanomaterials.

Volume XXXIII - Issue I - Jan./Mar., 2023
Emeritus Professor, IMA/UFRJ

P olímero S - I SS ue I - V olume XXXIII - 2023
I ndexed I n : “C hem IC al a bstra C ts ” — “ ra P ra a bstra C ts ” — “a ll - r uss I an I nst I tute of s CI en C e and t e C hn IC al I nformat I on ” — “ l at I ndex ” — “W eb of s CI en C e ”
P olímero S
e d I tor I al C ou NCI l
Antonio Aprigio S. Curvelo (USP/IQSC) - President
m ember S
Ailton S. Gomes (UFRJ/IMA), Rio de Janeiro, RJ (in memoriam)
Alain Dufresne (Grenoble INP/Pagora)
Bluma G. Soares (UFRJ/IMA)
César Liberato Petzhold (UFRGS/IQ)
Cristina T. Andrade (UFRJ/IQ)
Edson R. Simielli (Simielli - Soluções em Polímeros)
Edvani Curti Muniz (UEM/DQI)
Elias Hage Jr. (UFSCar/DEMa)
José Alexandrino de Sousa (UFSCar/DEMa)
José António C. Gomes Covas (UMinho/IPC)
José Carlos C. S. Pinto (UFRJ/COPPE)
Júlio Harada (Harada Hajime Machado Consutoria Ltda)
Luiz Antonio Pessan (UFSCar/DEMa)
Luiz Henrique C. Mattoso (EMBRAPA)
Marcelo Silveira Rabello (UFCG/UAEMa)
Marco Aurelio De Paoli (UNICAMP/IQ)
Osvaldo N. Oliveira Jr. (USP/IFSC)
Paula Moldenaers (KU Leuven/CIT)
Raquel S. Mauler (UFRGS/IQ)
Regina Célia R. Nunes (UFRJ/IMA)
Richard G. Weiss (GU/DeptChemistry)
Rodrigo Lambert Oréfice (UFMG/DEMET)
Sebastião V. Canevarolo Jr. (UFSCar/DEMa)
Silvio Manrich (UFSCar/DEMa)
e d I tor I al C omm I ttee
Sebastião V. Canevarolo Jr. – Editor-in-Chief a SS o CI ate e d I tor S
Alain Dufresne
Bluma G. Soares
César Liberato Petzhold
José António C. Gomes Covas
José Carlos C. S. Pinto
Paula Moldenaers
Richard G. Weiss
Rodrigo Lambert Oréfice
www.editoracubo.com.br
“Polímeros” is a publication of the Associação Brasileira de Polímeros
São Paulo 994 St. São Carlos, SP, Brazil, 13560-340
Phone: +55 16 3374-3949
emails: abpol@abpol.org.br / revista@abpol.org.br
http://www.abpol.org.br
Date of publication: January 2023
Financial support:
Available online at: www.scielo.br
Polímeros / Associação Brasileira de Polímeros. vol. 1, nº 1 (1991)
-.- São Carlos: ABPol, 1991-

Quarterly v. 33, nº 1 (January 2023)

ISSN 0104-1428
ISSN 1678-5169 (electronic version)
1. Polímeros. l. Associação Brasileira de Polímeros.
Website of the “Polímeros”: www.revistapolimeros.org.br
ISSN 0104-1428 (printed)
)
ISSN 1678-5169 (online
d e S kto P P ubl IS h IN g
Polímeros, 33(1), 2023 E1 E E
E
E E E E E
E E E E E E
r e VI ew a rt IC le
Poly(methyl methacrylate) modified Starch: their preparations, properties and applications
Anjana Dhar, Jayanta Barman, Hrishikesh Talukdar, Dhruba Jyoti Haloi ....................................................................................... e20230001
Chitosan: an overview of its multiple advantages for creating sustainable development poles
Cristóbal Lárez-Velásquez
Effect of coupling agents on properties of vegetable fiber polymeric composites: review
Dielen Marin, Luana Marcele Chiarello, Vinicyus Rodolfo Wiggers, Amanda Dantas de Oliveira and Vanderleia Botton
o r I g IN al a rt IC le
Effects of replacing Carbon Black with Wood Fibers in wood-rubber composites
e20230005
e20230012
Renan Zunta Raia, Setsuo Iwakiri, Rosilani Trianoski, Alan Sulato de Andrade, Edemir Luiz Kowalski, Aldo Eloizo Job and Fábio Friol Guedes de Paiva e20230002
Optimization of the ultrasonic treatment for Tara gum using response surface methodology
Barbara da Silva Soares, Carlos Wanderlei Piler de Carvalho, Edwin Elard Garcia-Rojas
Electrospun PHBV nanofiber containing Tea Tree Oil: physicochemical and antimicrobial activity
e20230003
Verônica Ribeiro dos Santos, Samara Domingues Vera, Gabrielle Lupeti de Cena, Adrielle de Paula Silva, Ana Paula Lemes, Kátia da Conceição, Dayane Batista Tada, Alexandre Luiz Souto Borges and Eliandra de Sousa Trichês e20230004
Crystallization and fusion kinetics of Poly(butylene terephthalate)/Titanium Dioxide
José Vinícius Melo Barreto, Antônio Anderson da Silva Gomes, Amanda Meneses Araújo, Andreas Ries, Janetty Jany Pereira Barros and Renate Maria Ramos Wellen e20230006
Influence of carbon fibre layers on the strength of thermally modified laminated veneer lumber
Osman Perçin and Onur Ülker e20230007
Ternary segmented polyurethanes: morphology and kinetics of the crystallization
André Sanches Bevilacqua, Rafael Bergamo Trinca and Maria Isabel Felisberti e20230008
Phenoxazine and diketopyrrolopyrrole based donor-acceptor conjugated polymers: synthesis and optical properties
Thao Thanh Bui, Tam Huu Nguyen, Bao Kim Doan, Le-Thu Thi Nguyen, Chau Duc Tran and Ha Tran Nguyen
Effect of hybridisation and nano reinforcement on repairing cracked pipeline
e20230009
Payman Sahbah Ahmed ...................................................................................................................................................................... e20230010
Structural characterization of polymeric nanofibers of polyvinylidene fluoride (PVDF)
José Augusto Souza Gomes da Silva, Walace Rodrigues da Silva Júnior, Ana Neilde Rodrigues da Silva, Roseli Künzel, José Roberto Ribeiro Bortoleto, Emanuel Benedito de Melo, Carina Ulsen and Neilo Marcos Trindade e20230011
e d I tor I al S e C t I o N News E4 Agenda ................................................................................................................................................................................................ E5 Funding Institutions E6
E2 Polímeros, 33(1), 2023 E I E E
I
Solvay Launches First ISCC Plus Certified Sulfone Polymers
Solvay accelerates carbon footprint reduction of Udel PSU & Radel PPSU at Marietta, Ohio with certified circular feedstock
Solvay has successfully earned independent third-party mass balance (MB) chain of custody accreditation under the widely recognized International Sustainability and Carbon Certification (ISCC-Plus) scheme for its Marietta, Ohio (USA) site, producing Udel PSU (polysulfone) and Radel PPSU (polyphenylsulfone), said to be the first ISCC-Plus mass balance compliant sulfone materials in the market and now commercially available, worldwide.
Solvay’s mass balance certified sulfone portfolio is based on monomers produced at the company’s Augusta, Georgia site, which received ISCC Plus accreditation in 2022. The global availability of certified circular sulfone polymers will be supported by a major investment program at Marietta, significantly expanding Solvay’s overall capacity alone for PSU by 25% until 2024.
To manufacture the new portfolio of certified products, Solvay measures, tracks, and allocates the quantities of fossil-derived resources replaced with certified circular feedstocks using the mass balance approach, which translates into a potential carbon footprint reduction of the certified products compared to traditional fossilbased grades. Due to their biological inertness, Solvay’s Radel PPSU compounds are widely used in medical, food service and plumbing applications, often replacing metals to save weight and eliminate corrosion. Udel PSU resins are particularly characterized by low levels of extractables and solubles, which has made them a preferred material choice in water treatment, healthcare and bioprocessing, including components for membrane filtration and renal dialysis.
Said sustainability global marketing manager Claire Guerrero, “The commercialization of our mass balanced sulfone grades is just another step as we continue to pioneer and innovate the high-performance materials market with responsible sourcing and production. Additional certified circular polymers to be introduced soon will include grades of Ryton PPS and Amodel PPA.”
Source: Plastics Technology – ptonline.com/news
New standard specification supports non-metallic FRP rebar
ASTM International standard D8505 enables further integration of FRP rebar into infrastructure applications.
ASTM International’s (Conshohocken, Pa., U.S.) composite materials committee (D30) has developed a new standard specification for the latest generation of fiber-reinforced polymer (FRP) rebar.
FRP rebar is used as internal concrete reinforcement. According to ASTM International member Francisco De Caso, this new standard (D8505) is a milestone after several decades of collaboration to further integrate these composite materials into infrastructure.
“The higher performance specified for bars, results in a significant improvement of design and construction of concrete structures reinforced with non-metallic FRP bars,” says De Caso, principal scientist at the University of Miami (Fla., U.S.). “This translates into more efficient and sustainable design of concrete structures.“
De Caso notes that the specification contains critical contributions such as the inclusion of basalt fiberreinforced rebar to existing glass fiber-reinforced rebar, as well as higher-performance rebar. He also says that the standard could be useful across the concrete construction value chain.
This effort directly relates to United Nations Sustainable Development Goals #6, 9, 11 and 12 on clean water and sanitation, industry, sustainable cities and responsible production/consumption, respectively.
Source: Composites World – compositesworld.com/news
N E W S E4 Polímeros, 33(1), 2023
June
Gordon Research Seminar — Polymers
Date: June 3-4, 2023
Location: South Hadley, Massachusetts, United State of America
Website: www.grc.org/polymers-grs-conference/2023/
Gordon Research Conference — Polymers
Date: June 4-9, 2023
Location: South Hadley, Massachusetts, United State of America
Website: www.grc.org/polymers-conference/2023/
Polymer Testing World Expo Europe – 2023
Date: June 14-15, 2023
Location: Messe Essen, Germany
Website: eu.polymertestingexpo.com/
Fluoropolymer 2023
Date: June 18-21, 2023
Location: Denver, Colorado, United State of America
Website: www.polyacs.net/23fluoropolymer
10th International Conference on Polymer Science and Polymer Chemistry
Date: June 19-20, 2023
Location: Rome, Italy
Website: polymer.conferenceseries.com/
Chemical Recycling - 2023
Date: June 26-28, 2023
Location: Frankfurt, Germany
Website: www.ami-events.com/event/7aa8d789-efda-4178-bf363321aa5caca1/summary?RefId=AMI%20Website
August
9th Edition of International Conference on Polymer Science and Technology
Date: August 28-29, 2023
Location: London, United Kingdom
Website: polymerscience.annualcongress.com/
September
14th International Workshop on Polymer Reaction Engineering
Date: September 5-8, 2023
Location: Fraunhofer-IAP, Potsdam, Germany
Website: dechema.de/en/PRE2023.html
Performance Polyamides Europe - 2023
Date: September 12-13, 2023
Location: Cologne, Germany
Website: go.ami.international/pa-register-interest-2023/?_ ga=2.161659068.1873836536.16697322131689573348.1669732213
8th International FAPS Polymer Congress
Date: September 12-14, 2023
Location: Istanbul, Turkey
Website: www.faps2023.com
11th European Symposium on Biopolymers
Date: September 13-15, 2023
Location: Brno, Czech Republic
Website: esbp2023.com/
October
Polyolefin Additives - 2023
Date: October 3-4, 2023
Location: Barcelona, Spain
Website: www.ami-events.com/event/3217a2fe-22bf-4751-b2415e15ad488df5/summary?RefId=Website_AMI
Plastics Recycling Technology
Date: October 10-12, 2023
Location: Vienna, Austria
Website: www.ami-events.com/event/04194add-97e5-4a3b-a5a410e937775a9f/summary?RefId=Website_AMI
Sustainable Polymers
Date: October 15-18, 2023
Location: Safety Harbor, Florida, United State of America
Website: www.polyacs.net/23sustainablepolymers
7th Global Summit on Polymer Chemistry
Date: October 18-19, 2023
Location: Paris, France
Website: polymerchemistry.annualcongress.com/
17th Brazilian Polymer Congress
Date: October 29 - November 2, 2023
Location: Joinville, Brazil
Website: www.cbpol.com.br/
November
Controlled Radical Polymerization
Date: November 12-15, 2023
Location: Charleston, South Carolina, United State of America
Website: www.polyacs.net/crp2023
Polymer Testing World Expo: North American
Date: November 15-16, 2023
Location: Cleveland, Ohio, United State of America
Website: na.polymertestingexpo.com/
Asia Australia Regional Meeting of Polymer Processing Society, PPS-2023
Date: November 29 - December 2, 2023
Location: Kovalam, Trivandrum, Kerala, India
Website: pps2023india.com/
December
18th Pacific Polymer Conference - PPC 18
Date: December 3-7, 2023
Location: Puerto Vallarta, Mexico
Website: www.ppc18.com.mx/index.html
Polymers in Footwear
Date: December 5-6, 2023
Location: Nuremberg, Germany
Website: www.ami-events.com/event/ecf39069-81fa-414d-b1f800b020542568/summary?RefId=Website_AMI
Polymer Engineering for Energy
Date: December 5-6, 2023
Location: London, United Kingdom
Website: www.ami-events.com/event/ac4c147b-82c7-454090eb-f2fa9a2d4333/summary?RefId=Website_AMI
Polymers in Hydrogen and CCUS Infrastructure
Date: December 7, 2023
Location: London, United Kingdom
Website: www.ami-events.com/event/6a43b95c-4d3c-48fa-aed85448c37dbccd/summary?RefId=Website_AMI
2024
February
Polyethylene Films
Date: February 12-14, 2024
Location: Tampa, Florida, United State of America
Website: www.ami-events.com/event/3605e8c6-3e644ed6-9a13-2c11444ca907/summary?RefId=website_ AMI&rt=ZJWqCFC1sUuPSrZfsYSo5A
38th Australasian Polymer Symposium
Date: February 18-21, 2024
Location: Auckland, New Zealand
Website: www.auspolymersymposium.org.au/
May
39th International Conference of the Polymer Processing Society - PPS-39
Date: May 19-23, 2024
Location: Cartagena de Indias, Colombia
Website: pps39.uniandes.edu.co/
A G E N D A Polímeros,
E5
33(1), 2023
2023
Sponsoring Partners

Polímeros, 33(1), 2023 ABPol Associates
E6
Poly(methyl methacrylate) modified Starch: their preparations, properties and applications
Anjana Dhar1 , Jayanta Barman2 , Hrishikesh Talukdar2 , Dhruba Jyoti Haloi3*
1Department of Chemistry, Bodoland University, Kokrajhar, Assam, India
2Department of Physics, Anandaram Dhekial Phookan College, Nagaon, Assam, India
3Department of Applied Sciences, Tezpur University, Tezpur, Assam, India
*dhruba2k3@gmail.com
Rbstract
Plastic wastes are generally not easily degradable under the action of environmental components. They are very much resistant to microbial attack too. These non-biodegradable plastics accumulate over a longer period of time on earth leading to environmental pollution. However, this may be avoided by using biodegradable polymers. Thus the demand for the preparation of biodegradable polymers has grown up. In recent years, researchers have developed a few biodegradable polymers from renewable sources; those find a large application in the field of packaging, agriculture, and biomedical fields. Starch is one such biopolymer, modification of which may lead to a semi-synthetic polymer with good properties with an edge of biodegradability. Poly(methyl methacrylate) is a good modifying agent for such modification as revealed by the literature search. This review report summarizes the preparation of such poly(methyl methacrylate) grafted starch polymers via different physical and chemical methods, their properties, and their applications.
Keywords: biopolymer, mechanical properties, poly(methyl methacrylate), starch.
How to cite: Dhar, A., Barman, J., Talukdar, H., & Haloi, D. J. (2023). Poly(methyl methacrylate) modified Starch: Their preparations, properties and applications. Polímeros: Ciência e Tecnologia, 33(1), e20230001. https://doi.org/10.1590/0104-1428.20220068
1. Introduction
Synthetic polymers have become an invaluable gift to the mankind due to its importance[1]. They have wide range of applications in almost every field of human activities like medical field, automotive, agriculture, food industry, packaging, etc[2-4]. Among the various synthetic polymers, the demand for plastic is very high which has been used to manufacture millions of products. Its application as a packaging material has also been increasing day by day.
About more than 180 million tons of packaging materials are now being produced globally per year[5]. Plastic materials are inexpensive and very much resistant to chemicals and other corrosive ingredients. Being non-biodegradable, they usually take up longer time to degrade under the influences of environmental components and hence possess serious threat to environment[6,7]. The disposal process for the plastic waste is now a global concern. Therefore, a shift of strategy has been noticed in recent years. The number of publications of the keywords of the subject from 2012 to 2022 is shown in the Figure 1. All datas are taken from Google Scholar.
The industries are trying to minimize the production of plastic material from the petroleum resources[8] rather working to develop a new material from the existing ones to incorporate biodegradable characteristics in it[2,9] Another strategy, which has also been adopted to solve this problem, is the recycling of waste. As per a published
R R R R R R R R R R R R R
report, the developed country like Japan is struggling to control the plastic waste. The Japanese Govt. has made a strategy to reduce 25% for single-use plastic waste and the reuse/recycling of 60% for plastic containers and packaging by 2030[10]. So, there is an intense need for the development of materials, those will have comparable properties with the present day’s polymeric materials and will be cheap and biodegradable in nature[11,12]. This drives the idea to develop biopolymers from renewable resources which would degrade under the action of environment into smaller molecules (methane, CO2 etc) and most importantly sooner than the traditional plastics[12]. In past few years, scientists have successfully developed a few such biodegradable polymers from renewable sources like Chitosan, Cellulose, Guar gum, Chitin and Starch[1,6-9,13-18]. These biodegradable polymers are now used in various applications including medical, industries and agriculture[6,9]. However, high cost and low performance limit their wide use. Therefore, the development of new biodegradable polymers with enhanced properties and low costs have drawn interest of scientists and industries nowadays. Starch is a cheap and one of the most abundant biopolymers originated in nature. This material is greatly available for synthesis or fabrication to yield Starch-based polymeric materials for various potential applications[1,17]. This review reports the salient features of methyl methacrylate modified Starch with special emphasis
https://doi.org/10.1590/0104-1428.20220068
Polímeros, 33(1), e20230001, 2023 ISSN 1678-5169 (Online) 1/13
on their preparations, characterizations, properties and applications.
2. Starch
Among all the naturally occurring biopolymers, Starch is the second most abundant[19], renewable and cheap raw biomaterial[7,17,19]. It is a polysaccharide with general formula (C6H10O5)n[20,21]. It consists of a mixture of two polyglucans[21], amylose [linear poly(1,4-α-D-glucopyranose)] and amylopectin [poly(1,4-α-D-glucopyranose) with (1,6-α-D-glucopyranose) as branching chains][21] (Figure S1). The shape of Starch granules can be spherical, oval, polygonal, dome-shaped, elongated-rod and their diameters vary from submicron to few 100 microns (Table 1)[17,21,31]. Based on the chain length of amylopectin, the crystallinity of Starch granules varies and they exhibit A-, B- and C-type of X-ray pattern[32] The crystallinity of the native Starch varies in the range of 15% to 45%, implying that on an average 70% Starch is an amorphous material[32]. Botanical originality of the Starch granules also defines its crystallinity, morphology, susceptibility to both chemical and enzymatic reactions. It is found that the variation of such properties as well structure is due to the variation in structure of amylose and amylopectin which are synthesized by different plants in different organs and at different stages of their development[32-34]. Native Starch exists

in granular form having microscopic diameter ranging from 2-100 μm[32,33,35], comprising of macromolecules arranged in polycrystalline form[32,33]. However, native Starch does not find much application due to its poor physico-mechanical property, poor water-resistance property, poor solubility and poor dimensional stability[13,34,36]. Therefore, attempts have been made to modify Starch enzymatically, physically or chemically to enhance the scope of its applicability[20,34]. Among the various ways of chemical modifications, grafting, cross-linking, esterification, etherification, oxidation are the few used very frequently for the modification of starch.
It is also possible to alter the physiochemical properties like biodegradability, biocompatibility, non-toxicity etc. via chemical modification[23]. The hydroxyl groups present in the Starch molecule may be used for this purpose[35]. Being biodegradable, biocompatible and non-toxic in nature, Starch has gained a lot of attention from the researchers[24,37,38] Starch can be treated with plasticizers to avoid the brittleness in the films and make it shatter resistant[39,40]. However, the presence of plasticizer is not sufficient enough for application in packaging as Starch is hydrophilic in nature, therefore it is very much necessary to incorporate a hydrophobic group into it[39,40]. Microorganisms such as fungi and bacteria consume Starch allowing easy degradation Starch-based polymer[28] .
3. Methyl Methacrylate (MMA)
MMA is an interesting monomer and can be easily polymerized to form resins and polymers. Among the different methacrylate monomers, methyl methacrylate (MMA) is the most commercially used monomer. It is capable to undergo polymerization by different polymerization methods[41,42] The homopolymer of MMA, poly(methyl methacrylate) (PMMA) finds many applications in various fields e.g., in drug delivery[42], bone cement[43], tissue engineering[44], as electrolytes[45], in molecule separation[46], in conductive polymer matrix[47,48], in photonic devices[49], in solar devices[47]. These diverse applications of PMMA are mainly due to its excellent optical transparency, biostability, processing
Polímeros, 33(1), e20230001, 2023 2/13
Dhar, A., Barman, J., Talukdar, H., & Haloi, D. J.
Figure 1. The number of publications in last 11 years based on the keywords search made of the subject.
Starch Diameter (µm) Shapes Amylose (%) large canna Starch[22,23] 62 – 94 B-type, oval-shaped granules 38.7 medium canna Starch[22,23] oval and elliptical small canna Starch[22,23] 14-35 round and polygonal 29.2 small wheat Starch[24] 2–8 bimodal spherical shaped B-granules 23.0 large wheat Starch[24] 12-20 bimodal disc shaped A-granule 30.0 small potato granules[25] 5–20 spherical or ellipsoidal 212.5 medium potato granules[25] 25–40 ellipsoidal to irregular 250.8 large potato granules[25] 40–85 cuboidal 274.6 rice granules[26] 4.46-7.2 polygonal 29.7 Blackgram[27] 12.8-14.4 Round, elliptical, oval shaped 32.9-34.3 kidney bean[27] 15.5–60.5 Kidney shaped 35.9 large chick pea[27,28] 17 - 29 Spherical, oval shaped 30.2 small chick pea[28] 6 - 7 oval shaped 25.6 large maize granules[29] 5–20 spherical shaped 26.4 small maize granules[29] >5 Angular-shaped 21.7 large barley Starch[30] 15-32 bimodal with large disk- shaped 24~29 small barley Starch[30] 2-3 bimodal 23 ~ 25
Table 1. Size and shape of Starch granules with the amylose contents (%)
Poly(methyl methacrylate) modified Starch: their preparations, properties and applications
ability, very good weather resistance and good mechanical properties[50]. Apart from these, MMA and PMMA are also used to modify the surface of fillers like Cellulose and Starch via grafting reaction.
4. Chemical Modification of Starch
4.1. Modification via conventional free radical polymerization
There have been many reports on the preparation of Starch graft copolymers. In most cases, conventional free radical polymerization (FRP) has been used for this purpose. For example, Çelik and Saçak [ 36 ] described the azobisisobutyronitrile (AIBN)-initiated graft copolymerization of methyl methacrylate (MMA) with Starch. It was found that the grafting rate and grafting yield increased with increasing temperature[36]. Shaikh and Lonikar[16] reported the synthesis of Starch graft copolymer with a series of acrylic monomers- acrylic acid (AA), methacrylic acid (MA), and methyl methacrylate (MMA) by ceric ion initiation method for site-specific drug delivery. They reported that the efficiency of grafting increased initially, but later decreased with increase in the concentration of monomer except for MMA. They also studied the rate of release of paracetamol from a polymer blend and the grafted copolymer at two different pH, 1.2 and 7.4 respectively. They proposed that the prepared graft copolymer of Starch may be used for colon-targeted drug delivery. Sangramsingh et al.[51] reported the preparation of Starch-g-PMMA using Ce (IV)–glucose as an initiator and the reaction mechanism is shown in the Scheme S1. They studied the effect of initiator concentration, amount of Starch, amount of monomer, temperature, time on the percentage of grafting. The activation energy calculated for this polymerization was also reported. The prepared graft copolymer was analyzed by differential scanning calorimetry (DSC) and thermogravimetric analysis (TGA) to evaluate their thermal properties. Pereira et al.[52] detailed the graft co-polymerization of MMA and/or AA monomer with a blend of corn Starch/cellulose acetate by free radical polymerization. These monomers were polymerized at low temperature using benzoyl peroxide (BPO)/4-dimethlyaminobenzyl alcohol redox initiator system to obtain the Starch/cellulose acetate based biodegradable hydrogel. Physical, mechanical and thermal properties of the prepared hydrogel were analyzed to check its applicability as an alternative material for bone cement or drug-delivery carrier in the biomedical field. In addition, they reported that the system follows Fickian-type diffusion but with an exception when AA is used in large amount. The mechanical properties of the hydrogel were found to be in the range of PMMA bone cements. Thus, they demonstrated the successful preparation of a degradable cement hydrogel with reasonably good mechanical behavior. Pimpan and Thothong[53] reported the preparation of a PMMA grafted Starch copolymer in aqueous medium at 80 °C using benzoyl peroxide (BPO) as an initiator. The proposed mechanism for the polymerization is shown in Scheme S2. They also studied the effect of reaction time, amount of initiator, monomer and Starch on the grafting characteristics to obtain the optimum conditions for the best grafting result. Fourier transform infrared (FTIR) spectroscopy was used to study the grafting of Starch and
they tried to correlate these results with the morphological changes happened to the grafted Starch due to grafting using the Scanning Electron Microscope (SEM) analysis. Emulsion polymerization is one of the mostly employed polymerization technique for grafting of synthetic polymer onto biopolymers[17]. It is also called as seeded polymerization since it allows the polymerization with larger size of molecules. There have been many reports on the preparation of Starch graft copolymer via emulsion polymerization using different kind of initiators. The mostly used initiators are ceric ammonium nitrate (CAN), ammonium persulfate (APS) and potassium persulfate (KPS). For example, Qudsieh et al.[18] reported graft copolymerization of MMA onto sago Starch in emulsion using ceric ammonium nitrate (CAN) and potassium persulfate (KPS) as redox initiators as shown in Scheme S3[17] . The grafting percentage was found to be maximized for CAN than KPS. Using the same initiator CAN, Li et al.[54] detailed a classical study reporting the highest graft percentage (GP) of MMA onto Starch for the composition containing the maximum amount of MMA by weight. The group also reported the activation energy of thermal decomposition, crystallization behavior, thermal properties, morphology and biodegradation for the graft copolymers with different amount of grafting percentage. Horowitz Metzger and Broido methods were used to study the kinetics of thermal decomposition. Similarly, Ulu et al.[19] described the synthesis of a Starch-based biodegradable and biocompatible (P(MAAco -MMA)-Starch composite) carrier matrix for the immobilization of L-asparaginase (L-ASNase) using Starch as a doping particle. They prepared different compositions of P(MAA-co-MMA) copolymer using KPS as initiator. Different percentage of Starch (1, 3, 5 and 10 wt%) were doped in a particular copolymer composition and the enzyme L-ASNase was tried to immobilize. They confirmed the immobilization of L-ASNase by SEM, Energy Dispersive X-Ray (EDX) and Atomic Force Microscope (AFM)-mapping and determined the pH and thermal stability of both the L-ASNase and the immobilized L-ASNase. Mukherjee et al. [55] detailed the synthesis of MMA grafted Starch copolymer in emulsion using KMnO4-oxalic acid pair as redox initiator. They studied the effect of reaction time, reaction temperature and monomer concentration on the grafting of Starch. The highest percentage of grafting (49%) was reported at 50 °C for 3.72 cc concentration of monomer. The resultant grafted polymers were characterized by FT-IR, SEM, EDX and TGA analyses. Furthermore, they calculated the value of biodegradability and also studied the flammability of the prepared material by measuring the limiting oxygen index (LOI). In a similar manner, Ghosh and Paul[56] reported the grafting of MMA onto Starch in methanol-water medium using potassium pervanadate as initiator under visible light. They studied the effect of reaction time, concentration of initiator and monomer, Starch contents and methanol-water ratios (v/v) on the grafting reaction. With this kind of variation, they achieved very good grafting results: percentage of grafting (95%), grafting efficiency (90%) and conversion (85%). Shi et al.[15] prepared Starch-based graft polymers with four different methacrylate monomers: methyl, ethyl, butyl, and hexyl metha crylates and studied the variation of thermo plasticity and grafting parameters with increasing chain length of the alkyl ester groups. They confirmed the
Polímeros, 33(1), e20230001, 2023 3/13
successful preparation of Starch graft copolymers by 1H Nuclear Magnetic Resonance (NMR), TGA and DSC analyses and reported that butyl methacylate (BMA) grafted Starch gave the best thermoplastic film and exhibited better tensile properties. In a similar vein, Kisku and Swain[57] described the synthesis of a biodegradable poly(methylmethacrylate)/Starch composite (PMMA/S). The prepared graft material exhibited good flame-retardant property. With Starch loading, they also observed a reduction of oxygen permeability through this composite, which enabled them to predict the potential applicability of this material in packaging industry. Qudsieh et al.[31] employed the same initiator KPS and obtained the maximum graft percentage (90%) at an optimized reaction conditions with respect to monomer, reaction temperature, anhydroglucose units (AGU), potassium persulfate (PPS) and reaction period, which is shown in Scheme S4. They also calculated the viscosity average molecular weight of the grated material by Huggin’s and Mark Houwink’s equations. Gao et al.[58] detailed the graft copolymerization of MMA onto canna-Starch initiated by manganese pyrophosphate. They confirmed the grafting by FT-IR, SEM and XRD methods. They further reported the influence of concentrations of initiator, monomer, Starch, reaction time and temperature on the grafting percentage, grafting efficiency and grafting rate. From the experimental results, they established the rate equation which was equivalent to the equation derived from the proposed reaction mechanism (Scheme S5)[58]. Imoto et al. [59] reported the copolymerization of MMA with Starch in presence of Cu (II) ion of CuC12. Cu (II) ion forms complex with the Starch and water and it was confirmed by the measurement of difference spectrum and electric conductance of the Starch solution keeping CuC12 as the reference. In addition, they concluded with results that the polymerization proceeds in the hydrophobic phase that is micelle as formed by the Starch. Taghizadeh and Khosravy[60] reported the graft polymerization of three different vinyl monomers such as acryl amide (AAm), acrylic acid (AA) and methyl methacrylate (MMA) onto Starch (S) using the redox initiator, potassium dichromate. They studied the effects of monomer, Starch, reaction temperature and initiator concentration on graft yield to obtain optimum conditions for the reaction. Bromometry titration was used to evaluate the kinetics data of grafting process. They obtained similar activation energies for the preparation of Starch-g-PAAm Starch-g-PAA and Starch-g-PMMA. Li et al.[54] reported the synthesis of a biocomposite by compounding PMMA grafted Starch with styrene-butadiene rubber (SBR). MMA and Starch were initially copolymerized via emulsion polymerization to prepare Starch-g-PMMA. The grafted copolymer was then compounded with SBR to obtain the composite. They studied the mechanical, morphological, biodegradable, swelling and water absorption properties of the prepared composite. The composites with Starch-g-PMMA loading at 10 and 30 phr exhibited good mechanical property. FE-SEM analysis and swelling test data supported this finding. The experimental results were found to be best fit in Halpin-Tsai model rather than Guth-Gold model they applied. The biodegradability of the biocomposite varies with immersion time and the Starch concentration as reported by them. Sekar et al.[61] reported a comparative study of
physicochemical and mechanical properties of sheets of sago Starch (SGS) and MMA grafted Starch copolymer. The sago Starch (SGS) sheets were prepared in an aqueous medium containing ethylene glycol. The graft copolymer sheets were also prepared in the same media initiated by initiator potassium persulfate and sodium metabisulfite at 60 °C. The prepared sheets were characterized by FT-IR, SEM and EDX analyses. The tearing strength of SGS-g-PMMA sheets was found to be inferior than sago Starch sheets but tensile strength with elongation at break were comparable. The analysis of water absorption properties of SGS-g-PMMA sheets revealed that the sheet can be used for coating purpose as the sheet absorbed less water and so avoids further corrosion. The modification of Starch by conventional free radical polymerization as summary is shown in Table S1.
5. Modification Via Reversible-deactivation Radical Polymerization (RDRP)
5.1. Modification of Starch via its hydroxyl groups
Starch can be modified physically, chemically or enzymatically depending on the requirement as well as the end use. Chemical modification enables the addition of a functional group in the Starch moiety replacing its hydroxyl group. Due to this, Starch becomes an important material in industries[62] Chemically it can be modified by different chemical reactions such as esterification, etherification and oxidation[34]. However, during modification of Starch, its granule form is maintained and only few hydroxyl groups are transformed to yield its ethers or esters[63]. These hydroxyl groups of Starch can be modified to incorporate an initiating site for reversible-deactivation radical polymerizations (RDRP). For example, hydroxyl groups of Starch may be converted to groups containing an active halide bond which eventually may be used for grafting of monomers via atom transfer radical polymerization. In this case, the resulted modified Starch may be termed as macroinitiator. There have been several reports on the modification of Starch as a macroinitiator for a further modification or grafting process. The different chemical reagents used and the degree of substitution reported in this process are tabulated in Table 2
6. Modification Starch as Macroinitiator
6.1. Via ATRP
In recent years, there are several reports on the Starchinitiated polymerization of different monomers by different RDRP among which atom transfer radical polymerization (ATRP) is mostly employed[41]. ATRP is a well-controlled radical polymerization which allows copolymerization with controlled architecture[34]. Bansal et al.[20] prepared copolymers of MMA and styrene by SI-ATRP and AGET-ATRP using expanded corn Starch (ECS) as a support. They first converted the corn Starch into expanded corn Starch (ECS) then carried out SI-ATRP of MMA from the Starch surface. For this, Starch was modified as a macro-initiator (ECS-Br) by reacting few of its -OH groups with 2-bromoisobutyryl bromide (BiBB). This ECS-Br was used for activator generated by electron transfer (AGET-ATRP) of MMA. ECS-Br was also used to prepare copolymers of MMA and styrene via SI-ATRP. They further determined the degree of substitution by NMR
Polímeros, 33(1), e20230001, 2023 4/13
Dhar, A., Barman, J., Talukdar, H., & Haloi, D. J.
Poly(methyl methacrylate) modified Starch: their preparations, properties and applications
Preparation of macroinitiator
condition
spectroscopy and found to be 0.06 and also characterized the polymers by SEM, FT-IR and 1H NMR analyses. Wang et al.[34] reported the synthesis of Starch-based copolymers (Starch-gPS and Starch-g-PMMA) with styrene and MMA via ATRP. Starch was used as a macroinitiator in this grafting reaction. The Starch macroinitiator was prepared by esterification reaction with 2-bromoisobutyryl bromide (BiBB) in a solution of ionic liquid 1-allyl-3-methylimidazolium chloride ([AMIM]Cl) and dimethylformamide (DMF). They further studied the effects of molar ratio of monomer to solvent, ligand, initiator and temperature on the graft polymerization. The prepared macroinitiator and the grafted copolymers were characterized by1H NMR, FT-IR and TGA analyses. Similarly, Nurmi et al.[64] also reported the synthesis of Starch grafted copolymer of MMA with acetylated Starch via ATRP. Starch was used as a macroinitiator with varying densities and lengths in a controlled manner. They prepared it with different degree of substitution by the reaction of 2-bromoisobutyryl groups with the hydroxyl group of acetylated Starch. The graft polymerization was carried out in bulk as well as in tetrahydrofuran (THF) using CuBr/bpy as catalyst system. Furthermore, they studied the hydrophobicity of the prepared copolymer using contact angle measurements. In a similar vein, Handayani et al.[65] modified amylopectin using tert-butylα-bromoisobutyrate (TBBiB) to yield an efficient macroinitiator, Ap-TBBiB. This initiator was used to prepare amylopectin-g-PMMA through ATRP. The grafted copolymers had well-defined structure, as evident by different characterization techniques[65]
6.2. Modification via NMP
Nitroxide mediated polymerization (NMP) can also be used for grafting from naturally occurring biopolymers. One of the advantages of this method is that there are no additional
steps required for the purification of polymer to remove metal catalyst, color or odor unlike polymerization methods like ATRP and RAFT[62]. Cazotti et al.[62] reported PMMA grafted Starch nanoparticles (SNPs) via NMP. The SNPs based macroinitiator was first prepared by modification with 4-vinylbenzyl chloride and an alkoxyamine. The monomer (MMA) was then grafted from the SNPs-macroinitiator via NMP. The successful synthesis of macroinitiator and the grafted SNPs were characterized by TGA and different spectroscopic techniques like FT-IR, 1H NMR and elemental analysis (EA) (CHN mode)[62]
6.3. Modification via
other routes
Blending is a technique by which a new polymeric material may be developed from two or more different polymers. There are few reports on the development of such Starch-based polymer blends and also Starch based composite with the involvement of MMA as a component. Espigares et al.[66] developed a partially biodegradable acrylic bone cement based on blend of Starch and cellulose acetate (SCA). Copolymer of MMA and AA was prepared via FRP to be used as bone cement for this purpose. They incorporated different percentages of hydroxyapatite to input the character of bone-bonding to the prepared bone cement and evaluated their curing characteristics, mechanical property, bioactivity, degree of hydration and degradation. Byun et al.[67] reported a biodegradable film from corn Starch, polyvinyl alcohol (PVA), nano-sized poly(acrylamide-co-methyl methacrylate) (PAAm-co-MMA) and TiO2/PAAm-co-MMA nanocomposite. They investigated the physical properties of the prepared films which also exhibited good photocatalytic degradability. Thakore et al.[68] detailed the complete classical study of PMMA and Starch cinnamate (SCN) blends prepared in
Polímeros, 33(1), e20230001, 2023 5/13
Table 2. Synthesis of Starch macroinitiator and polymerization by different techniques of ATRP.
Polymerization
Type of Starch Reagents Mole ratio in the Reactiona Degree of substitutionb (macroinitiator) Technique Temperature of reaction (oC) Technique Acetylated Starch[64] 2-bromoisobutyryl bromide 0.02 0.3 Substitution of hydroxyl group 70 ATRP 0.09 1.0 0.76 3.9 Expanded corn Starch[20] Ethyl 2-bromoisobutyrate 0.06 Substitution of hydroxyl group 70 SI-ATRP AGET-ATRP orn Starch[13] 2-Bromoisobutyryl bromide 1.1 0.56 Esterification 70 & 80 ATRP 1.3 0.72 1.5 0.83 1.7 1.11 1.9 1.22 1.5 1.06 1.5 1.20 1.5 1.53 1.5 0.12 1.5 0.83 1.5 0.93 1.5 1.36 Amylopectin[65] Tert-butyl α-bromoisobutyrate 1:3 1.04 Substitution of hydroxyl group 20 ATRP 1:3 1.08 1:3 0.98
different solvents. The prepared blends were found to be compatible with the solvents they used. The biodegradability study showed about 13% weight loss when SCN content was 30% in the blend. There are some reports which reported that the poly(methyl methacrylate) grafted Starch blended with natural rubber latex enhances the tensile strength of the blend[24,69]. Baishya and Maji[70] reported the synthesis of a bio-based composite of Starch and wood flour. Starch was modified first via grafting with MMA in water for this purpose and then mixed with pre-treated wood flour. They studied the effects of three cross-linkers glutaraldehyde (GA), dimethyloldihydroxyethyleneurea (DMDHEU), and N-methylol acrylamide (NMA) on the various properties of wood/Starch-g-PMMA composite. They concluded from their observations that the cross-linker DMDHEU with greater number of functional groups showed maximum interaction with wood and composite and here was an enhancement in the overall properties recorded for this cross-linker as compared to the other two GA and NMA. Boesel et al.[71] fabricated a Starch-based bone cements using a hydrophilic matrix (a mixture of Starch/cellulose acetate blend and a copolymer of MMA and AA) and bioactive glass, MgO-SiO2-3CaO.P2O5 as filler. The prepared material is partially degradable, bioactive and has good mechanical properties and hydrophilicity. Nakason et al.[72] reported the grafting of PMMA with natural rubber (NR). The resultant graft copolymer (NR-g-PMMA) was then blended with cassava Starch (CS) and natural rubber air dry sheet (ADS) to prepare NR-g-PMMA/cassava Starch and NR-g-PMMA/ ADS/cassava Starch blends. They studied the scorch time and cure time of the two-blend compound and reported that NR-g-PMMA–cassava Starch has longer scorch time and cure time compared to NR-g-PMMA–ADS–cassava Starch. Interestingly, for the blend containing more amount of CS showed an increment in torque, hardness and cure rate index, while the tensile strength, elongation at break and tear strength decreased, which is an evident that the Starch particles cannot support the stress transferred from a rigid cassava Starch–rubber interface and elastomeric phase. Maiti et al.[73] reported the preparation of a resorcinolformaldehyde cross-linked corn starch matrix based green composite reinforced with Saccharum spontaneum L grafted copolymers (with MMA, AAm, AN and AA). Thermal analysis of this composite showed an improvement in its stability. It was also found that the composites exhibited better physico-chemical and mechanical properties than the matrix. FTIR and NMR analyses supported the complete biodegradation of matrix and the composites. Among the different reinforced composites, Starch-g-PMMA based composite exhibited better tensile strength but Starch-gpoly (MMA + AA) based composite exhibited maximum compressive strength.
7. Characterization and Properties
The Starch-g-PMMA, prepared by different ways as explained in the above sections are characterized by various analytical techniques for structural elucidation and also to evaluate their thermal, physical and mechanical properties, morphological and biodegradable characteristics. This section focuses on some techniques those are often used for the
investigation of properties of poly(methyl methacrylate) grafted Starch. Among them, many are very much specific for the study of a particular property. Few such properties are also discussed in this section.
7.1. Study of chemical structure
The most commonly followed techniques to study the chemical structure of polymers are FTIR, 1H NMR and 13C NMR. These spectroscopic techniques are generally used with specific motive to evaluate chemical structure and to know the presence of some special kind of interactions. A FT-IR spectrum is usually used to prove the formation of graft copolymer of Starch (Starch-g-PMMA). The major peak at around 3449 cm-1 (varying with different samples in the range of 3300-3600 cm-1) is attributed to the stretching vibrations of -OH bonds of Starch and the bands at 1736 cm-1 (varying with different samples in the range of 1735-1750 cm-1) and 2952 cm-1 (varying with different samples in the range of 2652-2972 cm-1) are attributed to the C=O and >OCH3 groups of PMMA part. If modification on Starch is not happened at all, all -OH groups of Starch will exist and characteristic peaks for PMMA will be absent. The FT-IR spectrum also helps to conclude the presence of Starch backbone in the grafted copolymer. Like Qudsieh et al.[18] compared the FTIR spectrum of the Starch-g-PMMA with the native Starch and native PMMA spectra for the confirmation of successful grafting of PMMA. The presence of the major peak at 3449.78 cm-1 is attributed to the stretching frequency of hydroxyl groups. The peak at 1736.70 cm-1is assigned for C=O stretching. The peaks at 842.32 and 751.33 cm-1 are due to the -CH2CH2- group and peaks at 3000.84 and 2952.95 cm-1 are due to the >OCH3 group of PMMA and >CH- part of the grafted PMMA.
FTIR spectroscopy also may be used for the confirmation of the preparation of Starch macroinitiator and Starch graft copolymer, when the grafting polymerization is carried out via ATRP or any of its modified versions. In ATRP, the Starch based macroinitiator is prepared first, and then this macroinitiator is used for the preparation of Starch-gPMMA. In general, the modification of Starch is carried out via different chemical reactions e.g., esterification, etherification etc. The FTIR spectrum of macroinitiator shows a peak for C=O group of the initiator part in the range of 1900 to 1600 cm-1 and shift in the band for O-H vibration (shifting varies with the type chemical reaction used for the modification of Starch) as a confirmation of successful preparation of macroinitiator via esterification. The presence of characteristic peaks for PMMA and Starch in the same FTIR spectrum confirms the successful preparation of the graft copolymer. Like Wang et al.[34] confirmed the successful synthesis of Starch macroinitiator via an esterification reaction by FTIR analysis. In the FTIR spectrum of Starch macroinitiator, the intense peak at 1740 cm-1 due to the C=O group and a shift in the peak from 3381 cm-1 to 3433 cm-1 for O-H vibration confirms the successful modification of Starch via an esterification reaction. Again, the presence of peaks at 3435 cm-1,1731 cm-1 and 1384 cm-1 in the FTIR spectrum of Starch-g-PMMA indicate the successful synthesis of PMMA grafted Starch copolymer[14]. While FTIR confirms the formation of graft copolymer, 1H NMR and 13C NMR gives information about the structure. The 1H NMR and 13C NMR
Polímeros, 33(1), e20230001, 2023 6/13
Dhar, A., Barman, J., Talukdar, H., & Haloi, D. J.
Poly(methyl methacrylate) modified Starch: their preparations, properties and applications
spectroscopy are considered to be an effective technique for the characterization of grafted copolymers prepared by different RDRPs. For instance, Zhao et al.[14] utilized NMR spectroscopy for the structural analysis of PMMA grafted onto Starch as well as the Starch macroinitiator. In the 1H NMR spectra of Starch macroinitiator, the main peaks appeared in the range of 3.7–6.2 ppm and 1.7–2.2 ppm assigned to bromoisobutyryl group (BiB) (varying with different samples depending on the chemical used for Starch modification) as well as anhydroglucose unit of Starch. However, in 13C NMR spectra, they observed shift in the peaks from 100 ppm to 96 ppm and 60 ppm to 65 ppm after esterification confirming the preparation of macroinitiator. They also analyzed Starch-g-PMMA using the 1H NMR spectrum. They obtained peaks in the ranges 0.6–1.0 ppm, 1.6–2.1 ppm and 3.4–3.8 ppm for –CH3, –CH2– and –OCH3 in PMMA chains. For an incomplete polymerization, the peaks for monomer will appear in the NMR spectrogram.
7.2. Study of microstructure and morphology
TEM and SEM are the two powerful microscopic techniques commonly employed to study the morphology of Starch grafted copolymer. SEM is a type of electron microscope which is used for studying the solid surface directly. It produces image by scanning the surface with focused beam of electrons. It gives information about the surface composition and topography. SEM technique is utilized by different researcher to study the morphology of surfaces at different stages to know the changes. For instance, as reported by Çelik and Saçak et al.[36] the granular structure of Starch changes after graft copolymerization, which can be inferred from the SEM images. Similarly, Wang et al. [34] also reported that the morphology changes from bulk to macroporous on modification of Starch to prepare Starch macroinitiator by esterification reaction. High resolution SEM
(FE-SEM) is also employed by some researchers to obtain clear image of the polymer surface with higher resolution. FE-SEM is a powerful technique which uses field emission gun for electron source and an in-lens detector provides the surface image with greater energy range. Li et al.[17] studied the dispersion state of PMMA modified Starch in the SBR matrix using FE-SEM. They observed that in Starch/SBR biocomposites (MMA 0 phr), the size of the Starch remained same due to re-crystallization and re-gathering characteristics but with increasing concentration of MMA, the size reduced and also very clear tensile fracture surface was obtained. But with variation of the Starch concentration, different observations were obtained. It was reported that an increase of Starch concentration, Starch starts to agglomerate on the surface with particle size 1-10 µm and deteriorates the mechanical properties.
7.3. Thermal properties
The thermal property of PMMA grafted onto Starch is studied by TGA, DTA and DSC analyses. This study helps us to determine the thermal stability of the prepared graft copolymer. In Thermogravimetric analysis (TGA), the loss of weight versus increase in temperature is measured over time. While the other thermal properties, like fusion, crystallization and glass transition temperature, etc. are studied by Differential Scanning Calorimetry. For convenience, the values of reported thermal properties of Starch grafted copolymers are shown in Table 3. In general, the insertion of Starch in to PMMA results in the enhancement of thermal stability of the composites[57]. The virgin Starch and the PMMA in general, degrades at lower temperature, however upon grafting, the degradation temperature of the Starch grafted copolymer is improved[36].
Polímeros, 33(1), e20230001, 2023 7/13
Starch grafted copolymer Polymerization method TGA data Reference Decomposition Temperature in ˚C at different stages Weight loss in % corresponding to decomposition Temperature (˚C) at different stages 1st 2nd 3rd 4th 1st 2nd 3rd 4th Starch 35 165 420 11.6 64.2 78 [74] PMMA 203 297 400 12 16 64 [75] Starch-gPMMA Solution FRP 300 600 80 [11] Starch-g-PMMA Solution ATRP 150 [18] Starch-g-PMMA Emulsion FRP 144 273 301 503 20 40 60 80 [19] Starch -g- MMA (Crosslinked with wood flour by GA) 233 299 360 490 20 40 60 80 Starch -g – MMA (Crosslinked with wood flour by NMA) 244 320 387 526 20 40 60 80 Starch -g- MMA (Crosslinked with wood flour by DMDHEU) 286 338 391 558 20 40 60 80 Starch -g-PMMA Emulsion FRP 600 54.5 89.2 [50]
Table 3. Thermal properties of Starch grafted copolymers.
For instance, Sangramsingh et al.[51] reported that the PMMA grafted Starch (30% PMMA) has better thermal stability than un-grafted Starch. This also indicates the successful preparation of PMMA grafted Starch[19]. In some cases, the thermal stability of the grafted polymer does not show much difference with the Starch macroinitiator prepared or with the pristine Starch. This has also been observed that Starch-g-PMMA prepared via ATRP shows a three-stage thermal degradation, where the first degradation is due to the degradation of Starch-Br, while the other two are due to the PMMA part[14]
7.4. Physico-mechanical properties
Since one of the primary reasons for grafting MMA onto Starch is to improve the mechanical performance of Starch, thus the mechanical properties are most concerned. It becomes important to optimize a balanced property between the toughness, strength and stiffness. The mechanical properties are characterized from different viewpoint. Several techniques are utilized to evaluate the graft copolymer for tensile strength, flexural strength, impact strength, fracture toughness, hardness, and so forth.
Tensile test is one of the most common methods carried out to learn about the mechanical strength of the Starch graft copolymer. The parameters tensile strength, Young ̍s modulus and elongation at break are obtained from the tensile test. These parameters vary with the amount of Starch, along with the other factors like the method of Starch grafting or method of addition of Starch to the polymerization system, etc. Further, Compressive strength and wear resistance are also used to study the mechanical strength of the graft polymer. Baishya and Maji[70] compared flexural and tensile strength of Starch grafted polymer composites containing different cross-linker (Table 4) and found that composites containing cross-linker DMDHEU exhibited highest flexural as well as tensile values. Yoon et al.[4] reported an interesting fact about
the tensile strength of the Starch/PVA-PMMA-co-AM film prepared by Casting method. The tensile strength increased with increasing content of PMMA-co-AM nanoparticles but % of elongation was decreased. The films were prepared using different additives, but it was also observed in all the films that with increasing mole ratio of MMA in PMMA-co-AAm tensile strength is increased but % of elongation is decreased. However, the property of the film deteriorates when Starch, PVA, and only PMMA nanoparticle was used in the film. Shi et al.[15], reported the tensile strength (Table 5) of films of grafted Starch with PMMA. On addition of 50% PMMA, the strength of the films varied from the earlier trend and was found to be increased by 10 times. However, the films had the highest strength with 100% addition of PMMA.
There are very few reports on the Hardness and Limiting Oxygen Index properties of PMMA grafted Starch copolymer. The crosslinkers which are used in the preparation of Starch based composite also enhances the hardness of the material. The wood Starch composite as explained in the above section was prepared by using three different crosslinkers namely GA, NMA and DMDHEU. The wood composite treated with DMDHEU showed maximum hardness followed by NMA- and GA-treated composites (Table 6).
The flame-retardant properties of polymer may be studied by the measurement of their Limiting oxygen index (LOI) value. LOI is the minimum concentration of oxygen in a mixture of N2 and O2, expressed as a percentage that will just support in combustion. This is a very important quantitative measurement of relative flammability of plastics used in aviation. Table 6 shows a considerable increase in LOI (from 44 to 56.5) when the crosslinker DMDHHEU was used for the preparation of the composite.
This change suggested that incorporating DMDHEU which acted as a binder as well as nitrogen provider significantly promoted the flame retardance of the composite[70]. The flameretardant characteristics of Starch/PMMA composite have
Polímeros, 33(1), e20230001, 2023 8/13
Dhar, A., Barman, J., Talukdar, H., & Haloi, D. J.
Starch grafted polymer Flexural strength Tensile strength (MPa) Strength (MPa) Modulus (MPa) Starch -g- MMA (Crosslinked with wood flour by GA)[70] 30.8 2152 13.6 Starch -g – MMA (Crosslinked with wood flour by NMA)[71] 427 4369 14.8 Starch -g- MMA[70] (Crosslinked with wood flour by DMDHEU) 44.7 5011 15.6
Table 4. Mechanical properties of few PMMA grafted Starch copolymers.
% homo polymer (PMMA) Dry (breaking stress, MPa) Wet (breaking stress, MPa) Reference 0 0.23 ± 0.04 0 [15] 25 0.45 ± 0.01 0 [15] 50 2.9 ± 0.6 0 [15] 75 4.1 ± 0.5 0 [15] 100 12.8 ± 1.0 5.0±1.2 [15]
Table 5. The tensile strength of both dry and wet Starch films grafted with PMMA[15]
Starch Composite Hardness (shore D) LOI (%) Reference Starch -g- MMA (Crosslinked with wood flour by GA) 64.1 (±1) 44.5 [70] Starch -g- MMA (Crosslinked with wood flour by NMA) 66.3 (±0.5) 50 [70] Starch -g- MMA (Crosslinked with wood flour by DMDHEU) 72.0 (±1) 56.5 [70]
Table 6. Hardness and LOI properties of composites prepared using different crosslinkers[70]
Poly(methyl methacrylate) modified Starch: their preparations, properties and applications
Table 7. Properties and potential applications of Starch-g-PMMA.
Starch grafted copolymer systems Polymerization methods
-latex
(Crosslinked with wood flour by GA, NMAand DMDHEU)
also been reported[57]. As per the report, an improvement in LOI was observed with the increase of Starch content in the Starch/PMMA composites. The LOI value of the composite gradually increased (from 28 to 47%) with increase in addition of Starch (upto 4%). This may be due to the reduction in heat release rate (HRR) and also, the chemical interaction between the OH group of Starch and the acrylic monomer MMA that greatly enhances the flammability.
8. Applications
The grafting of PMMA onto Starch not only alters the physical, mechanical and rheological properties but also incorporates some important and unique properties in the resultant grafted copolymer. The synthesis of common plastic with incorporation of biomaterial into it finds tremendous practical applications in medical field[61], as films[20,34], as plastics[18],in packaging material[7], in industrial applications including paper coatings, adhesives, paints[62], thermoplastic product[20], latex[76] etc. In a recent development, scientists have reported a PMMA grafted Starch polymer which exhibits better properties than the commercially available bone cements[66]. Preparation of Starch-based biodegradable hydrogels of MMA has also been reported which exhibits property similar to the property of PMMA bone cements[61] Not only as bone cements, Starch-based biodegradable graft polymers of MMA were also developed for other applications like carrier matrix for immobilization of the enzyme L-asparaginase[19], material for wound dressing which is not degraded in water etc. PMMA grafted Starch also exhibits good flame retardant property and less oxygen permeability[57]. Majority of plastic waste comprises of packaging materials which are mostly non-biodegradable synthetic polymers. In order to reduce such waste in environment, attempts have already been made to prepare Starch-based biodegradable polymers. There have been several reports on the preparation of Starch-based biodegradable polymers. Preparation of Starch-based biodegradable films of MMA with good physical and mechanical property was reported aiming to use the material in packaging[7]. Starch-based biodegradable films of MMA was also prepared which
possesses good water stability and tensile properties[17]. Even nanoparticles like nano-sized P(MMA-co-AAm) and TiO2/P(MMA-co-AAm) were employed to develop such biodegradable films with good physical, mechanical and water resistance properties[34]. In addition, rubber was also blended with Starch-based nanoparticle to enhance the property of the prepared biodegradable films [69] . The applications and properties of PMMA grafted Starch are summarized in the Table 7
9. Summary and Outlook
The PMMA grafted Starch copolymers exhibits good physical and mechanical properties. This copolymer has the potential to replace synthetic polymers from their traditional hold. Furthermore, Starch is a highly abundant and low cost naturally available biopolymer. Therefore, the resultant product will also be of low cost and will be beneficial for the consumers. The environmental pollution due the use of synthetic polymers also will be reduced to great extent with the use of such Starch based polymers in near future. Researchers are now focusing more to prepare biopolymer-based materials with the aim of complete replacement of the synthetic polymers. Many researchers have already reported the preparation of PMMA grafted Starch polymers with some good properties but there is always a scope for further improvement. Research in this line is under progress.
10.
Author’s Contribution
• Conceptualization – Dhruba Jyoti Haloi.
• Data curation – Dhruba Jyoti Haloi; Anjana Dhar.
• Formal analysis – Dhruba Jyoti Haloi; Anjana Dhar; Jayanta Barman; Hrishikesh Talukdar.
• Funding acquisition – DST SERB.
• Investigation – Dhruba Jyoti Haloi.
• Methodology – Dhruba Jyoti Haloi; Anjana Dhar.
• Project administration – Dhruba Jyoti Haloi.
Polímeros, 33(1), e20230001, 2023 9/13
Properties and Applications References Starch -g-PMMA-Br SI-ATRP Commodity plastic [20] Starch-g-PMMA ATRP Good thermally stability [34] Starch -g-PMMA FRP Thermoplastic film exhibits good tensile properties, termal and water stability [15] Starch-g-PMMA FRP Enhanced thermal stability [36] Starch-g- PMMA FRP then Compounding Exhibited good mechanical properties [54] Starch-g- PMMA-SBR Composites Enhanced water absorption and biodegrability Starch-g-PMMA FRP Surface coating agents for corrosion prevention [61] Starch nanoparticle-g-P(MMA-co-S) NMP Paper coatings, adhesives, and paints. [62] Starch-g-PMMA-latex FRP Enhanced tensile strength [69] Starch-g-P(MMA-co-BMA)
Starch-g-P(MMA-co-MA)-latex Starch -g-PMMA
FRP then crosslinking Good thermally stability [70] Enhanced mechanical and
properties,
flame-retardant property
viscoelastic
and water uptake resistances Improved
Dhar, A., Barman, J., Talukdar, H., & Haloi, D. J.
• Resources – NA.
• Software –NA.
• Supervision – Dhruba Jyoti Haloi.
• Validation – Dhruba Jyoti Haloi.
• Visualization – Dhruba Jyoti Haloi; Anjana Dhar.
• Writing – original draft – Dhruba Jyoti Haloi; Anjana Dhar.
• Writing – review & editing – Dhruba Jyoti Haloi; Jayanta Barman; Hrishikesh Talukdar.
11. Acknowledgements
The Financial support from Science and Engineering Research Board (DST-SERB) (Grant no ECR/2015/000075), Govt. of India is greatly appreciated.
12. References
1 Yun, Y.-H., Hwang, K.-J., Wee, Y.-J., & Yoon, S.-D. (2011). Synthesis, physical properties, and characterization of starchbased blend films by adding nano-sized TiO2/poly(methyl methacrylate-co-acrylamide). Journal of Applied Polymer Science, 120(3), 1850-1858. http://dx.doi.org/10.1002/app.33408.
2 Chen, T., Li, Y., Yang, S.-Y., Wang, C.-F., & Chen, S. (2016). Synthesis of versatile poly(PMMA-b-VI) macromonomer-based hydrogels via infrared laser ignited frontal polymerization. Journal of Polymer Science. Part A, Polymer Chemistry, 54(9), 1210-1221 http://dx.doi.org/10.1002/pola.27961
3 Gong, J. P., Kurokawa, T., Narita, T., Kagata, G., Osada, Y., Nishimura, G., & Kinjo, M. (2001). Synthesis of hydrogels with extremely low surface friction. Journal of the American Chemical Society, 123(23), 5582-5583 http://dx.doi.org/10.1021/ ja003794q PMid:11389644.
4 Yoon, S.-D., Park, M.-K., & Byun, H.-S. (2012). Mechanical and water barrier properties of starch/PVA composite films by adding nano-sized poly(methyl methacrylate-co-acrylamide) particles. Carbohydrate Polymers, 87(1), 676-686 http://dx.doi. org/10.1016/j.carbpol.2011.08.046 PMid:34663020.
5 Raheem, D. (2012). Application of plastics and paper as food packaging materials – An overview. Emirates Journal of Food and Agriculture, 25(3), 177-188. http://dx.doi.org/10.9755/ ejfa.v25i3.11509
6 Qin, C., Li, J., Wang, W., & Li, W. (2022). Improving mechanical strength and water barrier properties of pulp molded product by wet-end added polyamide epichlorohydrin/cationic starch. ACS Omega, 7(26), 22173-22180 http://dx.doi.org/10.1021/ acsomega.1c07369. PMid:35811868.
7 Parvin, F., Rahman, M. A., Islam, J. M. M., Khan, M. A., & Saadat, A. H. M. (2010). Preparation and characterization of starch/PVA blend for biodegradable packaging material. Advanced Materials Research, 123-125, 351-354 http://dx.doi. org/10.4028/www.scientific.net/AMR.123-125.351
8 . Arfat, Y. A., Ejaz, M., Jacob, H., & Ahmed, J. (2017). Deciphering the potential of guar gum/Ag-Cu nanocomposite films asan active food packaging material. Carbohydrate Polymers, 157, 65-71 http://dx.doi.org/10.1016/j.carbpol.2016.09.069 PMid:27987974.
9 Sullad, A. G., Manjeshwar, L. S., & Aminabhavi, T. M. (2010). Novel pH-sensitive hydrogels prepared from the blends of poly(vinyl alcohol) with acrylic acid-graft-guar gum matrixes for isoniazid delivery. Industrial & Engineering Chemistry Research, 49(16), 7323-7329 http://dx.doi.org/10.1021/ ie100389v
10 Nakatani, J., Maruyama, T., & Moriguchi, Y. (2020). Revealing the intersectoral material flow of plastic containers and packaging in Japan. Proceedings of the National Academy of Sciences of the United States of America, 117(33), 19844-19853 http:// dx.doi.org/10.1073/pnas.2001379117 PMid:32747531.
11. Râpă, M., Popa, M. E., Cinelli, P., Lazzeri, A., Burnichi, R., Mitelut, A., & Grosu, E. (2011). Biodegradable alternative to plastics for agriculture application. Romanian Biotechnological Letters, 16(6), 59-64. Retrieved in 2022, July 30, from https:// www.rombio.eu/rbl6vol16Supplement/8%20Rapa.pdf
12 Song, J. H., Murphy, R. J., Narayan, R., & Davies, G. B. H. (2009). Biodegradable and compostable alternatives to conventional plastics. Philosophical Transactions of the Royal Society of London. Series B, Biological Sciences, 364(1526), 2127-2139 http://dx.doi.org/10.1098/rstb.2008.0289 PMid:19528060.
13 Bansal, A., Ray, S. S., & Chatterjee, A. K. (2015). Expanded corn starch a novel material as macroinitiator/solid support in SI and AGET ATRP: GMA polymerization. Journal of Polymer Research, 22(2), 23 http://dx.doi.org/10.1007/s10965-0150668-8
14 Zhao, N., Al Bitar, H., Zhu, Y., Xu, Y., & Shi, Z. (2020). Synthesis of polymer grafted starches and their flocculation properties in clay suspension. Minerals (Basel), 10(12), 10541066 http://dx.doi.org/10.3390/min10121054
15 Shi, Z., Reddy, N., Shen, L., Hou, X., & Yang, Y. (2014). Effects of monomers and homopolymer contents on the dry and wet tensile roperties of starch films grafted with various methacrylates. Journal of Agricultural and Food Chemistry, 62(20), 4668-4676 http://dx.doi.org/10.1021/jf5013709 PMid:24821283.
16 Shaikh, M. M., & Lonikar, S. V. (2009). Starch–acrylics graft copolymers and blends: synthesis, characterization, and applications as matrix for drug delivery. Journal of Applied Polymer Science, 114(5), 2893-2900 http://dx.doi.org/10.1002/ app.30870
17 Li, M.-C., Ge, X., & Cho, U. R. (2013). Mechanical performance, water absorption behavior and biodegradability of poly(methyl methacrylate)-modified starch/SBR biocomposites. Macromolecular Research, 21(7), 793-800. http://dx.doi.org/10.1007/s13233013-1088-4
18 Qudsieh, I. Y. M., Yunus, W. M. Z. W., Fakhru’l-Razi, A., Ahmad, M. B., & Rahman, M. Z. A. (2001). Graft copolymerization of methyl methacrylate onto sago starch using ceric ammonium nitrate and potassium persulfate as redox initiator systems. Journal of Applied Polymer Science, 83(10), 2275-2275 http:// dx.doi.org/10.1002/app.2325
19 Ulu, A., Koytepe, S., & Ates, B. (2016). Design of starch functionalized biodegradable P(MAA-co-MMA) as carrier matrix for L-asparaginase immobilization. Carbohydrate Polymers, 153, 559-572. http://dx.doi.org/10.1016/j.carbpol.2016.08.019. PMid:27561529.
20 Bansal, A., Kumar, A., Latha, P. P., Ray, S. S., & Chatterjee, A. K. (2015). Expanded Corn Starch as a versatile material in atom transfer radical polymerization (ATRP) of styrene and methyl methacrylate. Carbohydrate Polymers, 130, 290-298 http:// dx.doi.org/10.1016/j.carbpol.2015.05.009 PMid:26076629.
21. Bertoft, E. (2017). Understanding starch structure: recent progress. Agronomy (Basel), 7(3), 56 http://dx.doi.org/10.3390/ agronomy7030056
22 Chuenkamol, B., Puttanlek, C., Rungsardthong, V., & Uttapap, D. (2007). Characterization of low-substituted hydroxypropylated canna starch. Food Hydrocolloids, 21(7), 1123-1132 http:// dx.doi.org/10.1016/j.foodhyd.2006.08.013
23. Kasemwong, K., Piyachomkwan, K., Wansuksri, R., & Sriroth, K. (2008). Granule sizes of canna (canna edulis) starches and their reactivity toward hydration, enzyme hydrolysis and
Polímeros, 33(1), e20230001, 2023 10/13
Poly(methyl methacrylate) modified Starch: their preparations, properties and applications
chemical substitution. Stärke, 60(11), 624-633 http://dx.doi. org/10.1002/star.200800229
24 Waduge, R. N., Kalinga, D. N., Bertoft, E., & Seetharaman, K. (2014). Molecular structure and organization of starch granules from developing wheat endosperm. Cereal Chemistry, 91(6), 578-586 http://dx.doi.org/10.1094/CCHEM-02-14-0020-R
25 Noda, T., Takigawa, S., Matsuura-Endo, C., Kim, S.-J., Hashimoto, N., Yamauchi, H., Hanashiro, I., & Takeda, Y. (2005). Physicochemical properties and amylopectin structures of large, small, and extremely small potato starch granules. Carbohydrate Polymers, 60 (2 ), 245-251 http://dx.doi. org/10.1016/j.carbpol.2005.01.015
26 Singh, N., Nakaura, Y., Inouchi, N., & Nishinari, K. (2008). Structure and viscoelastic properties of starches separated from different legume. Stärke, 60(7), 349-357. http://dx.doi. org/10.1002/star.200800689
27 Yoshida, T., Jones, L. E., Ellner, S. P., Fussmann, G. F., & Hairston, N. G., Jr. (2003). Rapid evolution drives ecological dynamics in a predator–prey system. Nature, 424(6946), 303306 http://dx.doi.org/10.1038/nature01767 PMid:12867979.
28 Huang, J., Schols, H. A., Jin, Z., Sulmann, E., & Voragen, A. G. J. (2007). Characterization of differently sized granule fractions of yellow pea, cowpea and chickpea starches after modification with acetic anhydride and vinyl acetate. Carbohydrate Polymers, 67(1), 11-20 http://dx.doi.org/10.1016/j.carbpol.2006.04.011
29 Pan, D. D., & Jane, J.-L. (2000). Internal structure of normal maize starch granules revealed by chemical surface gelatinization. Biomacromolecules, 1(1), 126-132 http://dx.doi.org/10.1021/ bm990016l PMid:11709834.
30 Hung, P. V., & Morita, N. (2005). Physicochemical properties of hydroxypropylated and cross-linked starches from A-type and B-type wheat starch granules. Carbohydrate Polymers, 59(2), 239-246. http://dx.doi.org/10.1016/j.carbpol.2004.09.016.
31 Qudsieh, I. Y. M., Fakhru’l-Razi, A., Muyibi, S. A., Ahmad, M. B., Rahman, M. Z. A., & Yunus, W. M. Z. W. (2004). Preparation and characterization of poly(methyl methacrylate) grafted sago starch using potassium persulfate as redox initiator. Journal of Applied Polymer Science, 94(5), 1891-1897 http:// dx.doi.org/10.1002/app.20883
32 Jane, J.-L. (2006). Current study on starch granule structures. Journal of Applied Glycoscience, 53(3), 205-213. http://dx.doi. org/10.5458/jag.53.205.
33 Kaith, B. S., Jindal, R., Jana, A. K., & Maiti, M. (2010). Development of corn starch based green composites reinforced with Saccharum spontaneum L fiber and graft copolymers – Evaluation of thermal, physico-chemical and mechanical properties. Bioresource Technology, 101(17), 6843-6851 http:// dx.doi.org/10.1016/j.biortech.2010.03.113 PMid:20395134.
34 Wang, L., Shen, J., Men, Y., Wu, Y., Peng, Q., Wang, X., Yang, R., Mahmood, K., & Liu, Z. (2015). Corn starch-based graft copolymers prepared via ATRP at the molecular level. Polymer Chemistry, 6(18), 3480-3488 http://dx.doi.org/10.1039/ C5PY00184F
35 Wang, X., Yang, R., Huang, L., Li, J., & Liu, Z. (2019). Preparation of starch-graft-poly(methyl methacrylate) via SET-LRP at molecular level and its self-assembly. Polymer, 173, 11-19 http://dx.doi.org/10.1016/j.polymer.2019.04.018
36 Çelik, M., & Saçak, M. (2002). Synthesis and characterization of starch-poly(methyl methacrylate) graft copolymers. Journal of Applied Polymer Science, 86(1), 53-57. http://dx.doi. org/10.1002/app.10902
37 Apriyanto, A., Compart, J., & Fettke, J. (2022). A review of starch, a unique biopolymer – Structure, metabolism and in planta modifications. Plant Science, 318, 111223 http://dx.doi. org/10.1016/j.plantsci.2022.111223 PMid:35351303.
38 Hamaker, B. R. (2021). Current and future challenges in starch research. Current Opinion in Food Science, 40, 46-50 http:// dx.doi.org/10.1016/j.cofs.2021.01.003.
39 Jiang, T., Duan, Q., Zhu, J., Liu, H., & Yu, L. (2020). Starchbased biodegradable materials: challenges and opportunities. Advanced Industrial and Engineering Polymer Research, 3(1), 8-18 http://dx.doi.org/10.1016/j.aiepr.2019.11.003
40 Ojogbo, E., Ogunsona, E. O., & Mekonnen, T. H. (2020). Chemical and physical modifications of starch for renewable polymeric materials. Materials Today Sustainability, 7–8, 100028 http://dx.doi.org/10.1016/j.mtsust.2019.100028
41 Dhar, A., Koiry, B. P., & Haloi, D. J. (2018). Synthesis of poly(methylmethacrylate) via ARGET-ATRP and study of the effect of solvents and temperatures on its polymerization kinetics. International Journal of Chemical Kinetics, 50(10), 757-763 http://dx.doi.org/10.1002/kin.21210
42. Nien, Y.-H., Lin, S.-W., & Hsu, Y.-N. (2013). Preparation and characterization of acrylic bone cement with high drug release. Materials Science and Engineering C, 33(2), 974-978 http:// dx.doi.org/10.1016/j.msec.2012.11.032 PMid:25427513.
43 Itokawa, H., Hiraide, T., Moriya, M., Fujimoto, M., Nagashima, G., Suzuki, R., & Fujimoto, T. (2007). A 12 month in vivo study on the response of bone to a hydroxyapatite–polymethylmethacrylate cranioplasty composite. Biomaterials, 28(33), 4922-4927. http:// dx.doi.org/10.1016/j.biomaterials.2007.08.001 PMid:17707904.
44 Shi, M., Kretlow, J. D., Spicer, P. P., Tabata, Y., Demian, N., Wong, M. E., Kasper, F. K., & Mikos, A. G. (2011). Antibioticreleasing porous polymethyl methacrylate/gelatin/antibiotic constructs for craniofacial tissue engineering. Journal of Controlled Release, 152(1), 196-205 http://dx.doi.org/10.1016/j. jconrel.2011.01.029 PMid:21295086.
45 Deng, Y., He, Z., Cao, Q., Jing, B., Wang, X., & Peng, X. (2017). A novel high-performance electrospun thermoplastic polyurethane/poly(vinylidene fluoride)/polystyrene gel polymer electrolyte for lithium batteries. Acta Chimica Slovenica, 64(1), 95-101 http://dx.doi.org/10.17344/acsi.2016.2894 PMid:28380221.
46 Tai, Y., Wang, L., Gao, J., Amer, W. A., Ding, W., & Yu, H. (2011). Synthesis of Fe3O4@poly(methylmethacrylate-codivinylbenzene) magnetic porous microspheres and their application in the separation of phenol from aqueous solutions. Journal of Colloid and Interface Science, 360(2), 731-738 http://dx.doi.org/10.1016/j.jcis.2011.04.096 PMid:21601864.
47 Liu, X., Krückel, J., Zheng, G., & Schubert, D. W. (2013). Mapping the electrical conductivity of poly (methyl methacrylate)/ carbon black composites prior to and after shear. ACS Applied Materials & Interfaces, 5(18), 8857-8860 http://dx.doi. org/10.1021/am4031517 PMid:24015768.
48 Krückel, J., Starý, Z., Triebel, C., Schubert, D. W., & Münstedt, H. (2012). Conductivity of polymethylmethacrylate filled with carbon black or carbonfibres under oscillatory shear. Polymer, 53(2), 395-402 http://dx.doi.org/10.1016/j.polymer.2011.11.041
49. Martinez, A., Uchida, S., Song, Y.-W., Ishigure, T., & Yamashita, S. (2008). Fabrication of Carbon nanotube–poly-methylmethacrylate composites for nonlinear photonic devices. Optics Express, 16(15), 11337-11343 http://dx.doi.org/10.1364/ OE.16.011337. PMid:18648452.
50 Nassier, L. F., & Shinen, M. H. (2022). Study of the optical properties of poly (methyl methacrylate) (PMMA) by using spin coating method. Materials Today: Proceedings, 60(Pt 3), 1660-1664 http://dx.doi.org/10.1016/j.matpr.2021.12.213
51 Sangramsingh, N. M., Patra, B. N., Singh, B. C., & Patra, C. M. (2004). Graft copolymerization of methyl methacrylate onto starch using a Ce(IV)–glucose initiator system. Journal of Applied Polymer Science, 91(2), 981-990 http://dx.doi. org/10.1002/app.13202
Polímeros, 33(1), e20230001, 2023 11/13
Dhar, A., Barman, J., Talukdar, H., & Haloi, D. J.
52 Pereira, C. S., Cunha, A. M., Reis, R. L., Vázquez, B., & San Román, J. (1998). New starch-based thermoplastic hydrogels for use as bone cements or drug-delivery carriers. Journal of Materials Science. Materials in Medicine, 9(12), 825-833 http://dx.doi.org/10.1023/A:1008944127971 PMid:15348948.
53 Pimpan, V., & Thothong, P. (2006). Synthesis of cassava starch-g-poly(methyl methacrylate) copolymers with benzoyl peroxide as an initiator. Journal of Applied Polymer Science, 101(6), 4083-4089 http://dx.doi.org/10.1002/app.23352
54 Li, M.-C., Lee, J. K., & Cho, U. R. (2012). Synthesis, characterization, and enzymatic degradation of starch-grafted poly(methyl methacrylate) copolymer films. Journal of Applied Polymer Science, 125(1), 405-414 http://dx.doi.org/10.1002/ app.35620
55 Mukherjee, A., Datta, D., & Halder, G. (2019). Synthesis and characterisation of rice-straw based grafted polymer composite by free radical copolymerization. Indian Chemical Engineering, 61(2), 105-119 http://dx.doi.org/10.1080/00194506.2018.14 90930
56 Ghosh, P., & Paul, S. K. (1983). Photograft copolymerization of methyl methacrylate on potato starch using potassium pervanadate as initiator. Journal of Macromolecular Science. Chemistry, 20(2), 261-269 http://dx.doi.org/10.1080/00222338308069965
57 Kisku, S. K., & Swain, S. K. (2012). Study of oxygen permeability and flame retardancy properties of biodegradable polymethyl methacrylate/starch composites. Polymer Composites, 33(1), 79-84 http://dx.doi.org/10.1002/pc.21240
58 Gao, J.-P., Tian, R.-C., Yu, J.-G., & Duan, M.-L. (1994). Graft copolymers of methy methacrylate onto canna starch using manganic pyrophosphate as an initiator. Journal of Applied Polymer Science, 53(8), 1091-1021 http://dx.doi.org/10.1002/ app.1994.070530811
59 Imoto, M., Morita, E., & Ouchi, T. (1980). Vinyl Polymerization, CCCLXXVIII. Radical polymerization of methyl methacrylate with starch in aqueous solution Of Cu(I1) ion. Journal of Polymer Science: Polymer Symposia, 68(1), 1-11 http://dx.doi. org/10.1002/polc.5070680103
60. Taghizadeh, M. T., & Khosravy, M. (2003). Kinetics and mechanism of graft copolymerization of vinyl monomers (acrylamide, acrylic acid, and methacrylate) onto starch by potassium dichromate as redox initiator. Iranian Polymer Journal, 12(6), 497-505
61 Sekar, S., Ojha, K. M., Sankar, S., & Sastry, T. P. (2015). Preparation and partial characterization of sago starch based graft co-polymers. International Journal of Pharmacy and Pharmaceutical Research, 4(2), 385-395. Retrieved in 2022, July 30, from https://ijppr.humanjournals.com/9-2/
62 Cazotti, J. C., Fritz, A. T., Garcia-Valdez, O., Smeets, N. M. B., Dubé, M. A., & Cunningham, M. F. (2019). Grafting from starch nanoparticles with synthetic polymers via nitroxide-mediated polymerization. Macromolecular Rapid Communications, 40(10), e1800834 http://dx.doi.org/10.1002/marc.201800834 PMid:30663157.
63 Han, T. L., Kumar, R. N., Rozman, H. D., & Noor, M. A. M. (2003). GMA grafted sago starch as a reactive component in ultra violet radiation curable coatings. Carbohydrate Polymers, 54(4), 509-516 http://dx.doi.org/10.1016/j.carbpol.2003.08.001
64 Nurmi, L., Holappa, S., Mikkonen, H., & Seppälä, J. (2007). Controlled grafting of acetylated starch by atom transfer radical polymerization of MMA. European Polymer Journal, 43(4), 1372-1382 http://dx.doi.org/10.1016/j.eurpolymj.2007.01.038
65. Handayani, A. S., Purwaningsih, I. S., Chalid, M., Budianto, E., & Priadi, D. (2014). Synthesis of amylopectin macroinitiator for graft copolymerization of amylopectin-g-poly
(Methyl Methacrylate) by ATRP (Atom TransferRadical Polymerization). Materials Science Forum, 827, 306-310 http://dx.doi.org/10.4028/www.scientific.net/MSF.827.306
66 Espigares, I., Elvira, C., Mano, J. F., Vázquez, B., San, R. J., & Reis, R. L. (2002). New partially degradable and bioactive acrylic bone cements based on starch blends and ceramic fillers. Biomaterials, 23(8), 1883-1895 http://dx.doi.org/10.1016/ S0142-9612(01)00315-5. PMid:11950059.
67 Byun, H.-S., Park, M.-H., Lim, G.-T., & Yoon, S.-D. (2011). Physical properties and characterization of biodegradable films using nano-sized TiO2/poly(acrylamide-co-methyl methacrylate) composite. Journal of Nanoscience and Nanotechnology , 11(2), 1701-1705 http://dx.doi.org/10.1166/jnn.2011.3331 PMid:21456271.
68 Thakore, I. M., Desai, S., & Devi, S. (2001). Compatibility and biodegradability of PMMA–Starch cinnamate blends in various solvents. Journal of Applied Polymer Science, 79(3), 488-496 http://dx.doi.org/10.1002/1097-4628(20010118)79:3<488::AIDAPP120>3.0.CO;2-F
69 Zhang, Q. L., Tian, X. H., Sun, J. Y., Yuan, Y. Z., & Zhang, K. T. (2017). Preparation of starch-g-PMMA, starch-g-P(MMA/ BMA) and starch-g-P(MMA/MA) nanoparticles and their reinforcing effect on natural rubber by latex blending: a comparative study. Polymer Science, Series A, 59(5), 708-717 http://dx.doi.org/10.1134/S0965545X17050200
70 Baishya, P., & Maji, T. K. (2014). Studies on effects of different cross-linkers on the properties of starch-based wood composites. ACS Sustainable Chemistry & Engineering, 2(7), 1760-1768 http://dx.doi.org/10.1021/sc5002325
71 Boesel, L. F., Fernandes, M. H. V., & Reis, R. L. (2004). The behavior of novel hydrophilic composite bone cements in simulated body fluids. Journal of Biomedical Materials Research. Part B, Applied Biomaterials, 70(2), 368-377 http:// dx.doi.org/10.1002/jbm.b.30055. PMid:15264321.
72 Nakason, C., Kaesaman, A., & Eardrod, K. (2005). Cure and mechanical properties of natural rubber-g-poly(methyl methacrylate)–cassava starch compounds. Materials Letters, 59(29-30), 4020-4025 http://dx.doi.org/10.1016/j. matlet.2005.07.057
73 Maiti, M., Kaith, B. S., Jindal, R., & Jana, A. K. (2010). Synthesis and characterization of corn starch based green composites reinforced with Saccharum spontaneum L graft copolymers prepared under micro-wave and their effect on thermal, physio-chemical and mechanical properties. Polymer Degradation & Stability, 95(9), 1694-1703 http://dx.doi. org/10.1016/j.polymdegradstab.2010.05.024
74 Noordergraaf, I.-W., Fourie, T. K., & Raffa, P. (2018). Free-radical graft polymerization onto starch as a tool to tune properties in relation to potential applications. A review. Processes (Basel, Switzerland), 6(4), 31 http://dx.doi.org/10.3390/pr6040031
75. Gałka , P. , Kowalonek , J. , & Kaczmarek , H. ( 2014 ). Thermogravimetric analysis of thermal stability of poly(methyl methacrylate) films modified with photoinitiators. Journal of Thermal Analysis and Calorimetry, 115(2), 1387-1394. http:// dx.doi.org/10.1007/s10973-013-3446-z
76 Polyakova, E. A., Korotneva, I. S., Turov, B. S., Danilova, A. S., & Komin, A. V. (2014). Biodegradable composite of starch and carboxylated latex for arts and crafts. Russian Journal of Applied Chemistry, 87(7), 998-1001 http://dx.doi.org/10.1134/ S107042721407026X.
Received: July 30, 2022
Revised: Jan. 27, 2023
Accepted: Feb. 14, 2023
Polímeros, 33(1), e20230001, 2023 12/13
Poly(methyl methacrylate) modified Starch: their preparations, properties and applications
Supplementary Material
Supplementary material accompanies this paper.
Figure S1. Structure of Starch.
Scheme S1. Schematic representation of polymerization reaction initiated by CAN initiator.
Scheme S2. Schematic representation of a) homopolymerization and b) graft copolymerization reaction initiated by BPO initiator.
Scheme S3. Schematic representation of copolymerization reaction of MMA and Starch initiated by CAN initiator.
Scheme S4. Sequence of steps involved in the graft copolymerization of MMA onto sago Starch initiated by KPS.
Scheme S5. Schematic representation of the proposed mechanism of complex formation among Cu(II) ion, water, MMA and Starch.
Table S1. Summary of modification of Starch via conventional free radical polymerization. This material is available as part of the online article from https://doi.org/10.1590/0104-1428.20220068
Polímeros, 33(1), e20230001, 2023 13/13
Chitosan: an overview of its multiple advantages for creating sustainable development poles
Cristóbal Lárez-Velásquez1*
1Grupo de Polímeros, Departamento de Química, Facultad de Ciencias, Universidad de Los Andes, Mérida, Venezuela
*clarez@ula.ve
Rbstract
An overview perspective of the potential of chitin and chitosan biopolymers to promote economically and environmentally sustainable development poles, which could be exploited especially in developing countries, is presented. Their following advantages have been considered and briefly outlined: (i) the natural sources of chitin have a wide distribution on the entire planet and are usually accessible as inexpensive waste materials; (ii) the great versatility of these materials, with applications in diverse fields such as agriculture, water treatments, food industry, environment, petroleum, healthcare, energy, technology, etc., with some trials conducted even off-planet; (iii) the production and use of these materials could promote advances in the endogenous capacity of some countries to create own technologies and generate products and applications, basic and advanced, in sensitive sectors, i.e., health services, food, water treatments, etc., in addition to promoting the necessary integration of the academic sector with other sectors such as industry and business.
Keywords: sustainable growth poles, renewable sources, endogenous development, nanotechnology.
How to cite: Lárez-Velásquez, C. (2023). Chitosan: an overview of its multiple advantages for creating sustainable development poles. Polímeros: Ciência e Tecnologia, 33(1), e20230005. https://doi.org/10.1590/0104-1428.20220103
1. Introduction
It is difficult to find materials that offer such varied possibilities for the development of useful product lines, in so many fields of human activity, such as chitin and its main derivative, chitosan. But if this is not motivation enough, enthusiasm can be increased by the great diversity of easily accessible natural sources that allow them to be obtained sustainably, at relatively low costs from waste, as well as without the use of renewable resources traditionally employed to produce food for humans and animals. Other factors that can promote its use are related to the economic feasibility of its preparation[1] and the technological viability for the development of its applications in many industrial sectors[2] As vivid examples of some of the fields of application in nanotechnology, the following can be briefly mentioned: the production of biodiesel using enzymes encapsulated in nanoparticles, which provide protection to bioactive species and extend the reusability of biocatalysts[3]; the use of nano-biocomposites for the preparation of active food packaging[4]; the use of chitosan nanoparticles as effective antimicrobial agents, especially due to the increasing resistance to traditional drugs developed by different pathogens[5]; the manufacture of nano-biocomposites with graphene and metal oxides, which have shown hopeful performances in hyperthermic magnetic therapy for cancer treatment[6]; etc.
On the other hand, there is little information on chitosanbased growth poles promoted by the public sector, although there are many private biotechnological companies specialized in the production and the commercial exploitation of diverse
R R R R R R R R R R R R R
products based on this biomaterial (see Table 1 with a brief list of them), which would point to the fact that this type of entrepreneurship can be economically sustainable.
This article presents an overview of the potential applications of chitosan in sensitive areas for the development of a country, for instance, through the creation of local development poles (see Figure 1) capable of transforming local resources into value-added goods to be used to meet domestic and external demand. It is intended to stimulate research on them as well as their use for the generation of proprietary technologies that contribute to the growth of related industrial and technological sectors, particularly those able to launch sustainable growth pathways.
2. Chitin and Chitosan Sources
The natural sources containing chitin are very varied, including the exoskeleton of insects as abundant as cockroaches[7] and crickets[8], continuing with the cell walls of fungi such as Mucor rouxii[9] and finding in the shells of a variety of crustaceans the traditional source for its current production[10]. Furthermore, the scales of some fish have been recently added to the extensive list of potential sources of chitin[11], which opens new horizons for using these resources. On the other hand, the controlled cultivation of microorganisms, such as microalgae[12] and fungi[13], has also been explored, with increasing conviction, in search of materials whose physicochemical properties do not show
https://doi.org/10.1590/0104-1428.20220103
Polímeros, 33(1), e20230005, 2023 ISSN 1678-5169 (Online) 1/15
Table 1. Some specialized companies in the production and commercial exploitation of chitosan-based products.
Company Products Website
Alpha Chitin Chitin and chitosan from Hermetia illucens larvae, fungi, or krill http://alpha-chitin.com
Chibio Biotech Chitin-glucan, Agaricus bisporus chitosan, Aspergillus niger chitosan, Oyster nushroom chitosan, Carboxymethyl chitosan
ChitoLytic Crustacean chitosans, Mushroom chitosans, Chitosan lactate, Trimethyl chitosan, Chitin
https://www.chibiotech.com
https://chitolytic.com
Polymar Crustacean chitosan powder, Poly Floc (flocculant), Poly Protec (fungicide) https://www.polymar.com.br
ISF Chitin & Marine Products LLP Chitin and chitosan from marine product processing wastes, Carboxymethyl chitosan
Chitosanlab Chitosan from crustacean shells and squid pens, Micronized chitin and chitosan, Chitosan nanoparticles, Chitosan quaternary ammonium
https://www.isfchitin.com
https://chitosanlab.com
variations dependent on factors such as the stage of growth of the different species used for their traditional production, or the seasonality of their captures. Additionally, this type of material should have better qualities regarding allergen and metal contents[14].
The origin of the chitin used in the production of chitosan is a key factor to consider in its applications. For instance, β-chitin (obtained from squid feathers and possessing fibrils made up of parallel-oriented polymer chains) is easier to hydrolyze than α-chitin (obtained usually from crustacean shells, fibrils made up of polymer chains in anti-parallel orientation)[15] Table 2 summarizes the main natural sources that have been assayed and used to obtain chitin.
3. Some Suggested Sectors for the Development of Chitosan-Based Applications

3.1 Agriculture
Applications of chitinous materials in agriculture can cover each of the stages involved in the production of vegetables and even expand outside the planet, since NASA began in 1997 the development of aeroponic to produce food in space, achieving chitosan-based formulations for such purposes, such as BEYONDTM from AgriHouse[40] A few examples of proven agricultural applications for these materials are shown below.
- Soil conditioning and bioremediation: chitin has been studied in the amendment and remediation of the soil where a certain crop will settle[41]. Similarly, chitosan has been investigated in the remediation of soils contaminated with metals[42]. Additionally, chitin has also shown nematocidal activity when applied by spraying/irrigation or added directly to the soil[43]
- Seed preservation and bio-stimulation: chitosan-based coatings have notorious beneficial effects on seeds[44] which are not limited to protection due to their recognized fungicidal activity[15,45], or as a germination stimulant[46,47], but additionally these can serve as vehicles for the controlled release of other agrochemicals[48]. Another interesting application for these biopolymers could be the preparation of artificial or synthetic seeds (hydrated or dehydrated explants, naked or covered with a protective polymeric bead)[49]
- Inducer of resistance to diseases caused by phytopathogens: chitosan is a potent stimulant of the acquired resistance system to pathogens in plants[50], especially for the induction of defense mechanisms against fungi[51] such as suberization during the wound healing process in potato tubers[52], stimulation of the production of secondary metabolites, including phytoalexins[53], lignin[54], phenolic compounds[55], callose[56], etc., whose deposition plays an important role in limiting the spread of pathogens[57] and seems to be controlled by the molecular weight and the
Lárez-Velásquez, C. Polímeros, 33(1), e20230005, 2023 2/15
Figure 1. Tentative characteristics of prospective local development poles based on chitosan.
Chitosan: an overview of its multiple advantages for creating sustainable development poles
Table 2. Main natural sources already explored to obtain chitin and chitosan.
Source Specific examples
Arthropods
- Insects - Cockroaches[7], crickets[8], beetles[16], flies[17], bees[18]
- Arachnids - Spiders[19], scorpions[20]
- Crustaceans - Crabs[21], shrimps[22], lobsters[23], prawns[24], krill[25], spider crabs[26]
- Myriapods - Millipedes[27] and centipedes[28].
Mollusks - Squids[29], cuttlefish[30], clams[31]
Fishes - Tilapia[32], rohu[11], bocachico[33]
Fungi
- Basidiomycota - Lactarius vellereus (yeast)[34], Agaricus bisporus (common mushroom)[35]
- Zygomycota - Mucor rouxii[9] , Rhizopus oryzae[13]
- Ascomycota - Aspergillus niger[36] , Penicillium chrysogenum[37] , Penicillium camembertii[38]
Algaes
- Diatoms Thalassiosira fluviatilis[39], Cyclotella sp[12]
- Green algae Pithophora oedogonia, Chlorella vulgaris[39]
degree of acetylation of the applied chitosan[58]. Among the numerous crops where elicitation by chitosan has been verified are tomato[59], peach[60], strawberry[61], table grape[62], etc.
- Growth biostimulant: chitosan is one of the most explored biostimulants in agriculture, with many successful applications[63], i.e., its effect on root development in maize plants is notorious, especially in crop conditions under water deficiency[64]. Similarly, chitosan notably increases the production of some secondary metabolites in plants, as noted for the menthol production in mint crops[65]. Furthermore, the foliar treatment of tomato crops under salt stress with chitosan solutions prepared using citric or ascorbic acids increases the production of some metabolites, including osmolyte substances, which help to reactivate their development[66]
Postharvest protection: chitosan applications are profuse[67] because these biomaterials can simultaneously fulfill multiple functions such as an antimicrobial agent, elicitor, and physical isolation given their ability to form semi-permeable films[68]. Among the trends observed for these applications is the mixture with other natural materials to improve the effectiveness of these treatments, i.e., chitosan/Aloe vera gels to delay the post-harvest decay of mango fruits[69] and chitosan/carnauba wax/ oregano oil to protect cucumber[70]. Likewise, research on the development of edible films by combining chitosan with other natural materials is copious and with striking results, highlighting the emblematic case of strawberries[71].
3.2 Water treatments
The use of chitosan in processes related to water treatment is quite common today[72,73], and a wide range of commercial products based on these biomaterials can be found on the market, such as Tidal-Clear, HaloKlear, Cesco FC-100, Crystal Lagoon, etc. The following is a summary of the applications of these biomaterials in related processes.
- Coagulation/flocculation: chitosan has been proposed as a possible candidate to replace widely used coagulants such as aluminum sulfate and ferric chloride in a more environmentally friendly way[74]. Several mechanisms have been outlined to explain the coagulating/flocculant action of these biopolymers[75]: (a) neutralization of the negative surface charges of the suspended particles by electrostatic interaction; (b) the simultaneous formation of a bridge between the particles; (c) formation of charge neutralization patches. Reported studies include the separation of clay suspensions[76], mill effluents treatment during oil palm processing[77], the harvest of microalgae[78], protein recovery from fishmeal manufacturing wastewater[79], textile industry wastewater treatments[80], etc.
- Adsorption: chitosan has been extensively studied as a bio-adsorbent in various water treatments[81]. In addition, its derivatives can be used in a variety of ways[82]: powder, hydrogel spheres, films, fibers, etc. The functional groups present in its structure, and those introduced through chemical modification reactions, allow it to act as an adsorbent both for organics (dyes[83,84], drugs[85], oils[86], etc.) and inorganics (heavy metals[87], anions such as phosphates and nitrates[88], ammonium and other nitrogen-containing salts[81], etc.). Various biocomposites based on chitosan and other natural materials have also been prepared and tested as adsorbents[89]
- Filtration: chitosan-based membranes have also been extensively studied, with numerous reports on the removal of pollutants, e.g. pressure filtration of aqueous solutions for the removal of Cu(II)[90]; nanofiltration of effluents from the textile industry for the removal of dyes[91]; adsorptive filtration for the removal of anionic and cationic species[92], etc.
3.3 Food sector
Chitosan has been approved some years ago for use as a food additive in different countries, such as Japan in 1983 and Korea in 1995[93]. Chitosan obtained from A. niger has been evaluated without objection by the Food and Drug Administration (FDA) of the United States in 2011 as a direct secondary ingredient in the production of alcoholic beverages[94] and approved by the Food Standards Agency of Australia and New Zealand in 2013 as a processing aid in the production of alcoholic beverages[95]. Also, chitosan from white button mushrooms (A. bisporus) was recently added by the FDA as a “generally recognized as safe” (GRAS) material for use in foods and beverages[96]. A summary of studies on its applications in this sector is presented below.
- Preserver agent: chitosan applications as a food preservation additive may take advantage of consumer preferences for natural products[97]. Proposals on this topic include its use in meat[98], fish[99], milk[100], cheeses[101], sauces[102], freshly cut fruit coatings[103,104], fruit juices[105], etc. Furthermore, numerous studies have also been carried out on its applications in wine production[106] and to prevent its spoilage[107]
- Clarifying agent: due to its cationic nature, chitosan can interact with anions through electrostatic interactions, as well as via hydrogen bonds and van der Waals forces,
33(1), e20230005, 2023 3/15
Polímeros,
-
with other types of molecules, such as proline-rich proteins, polyphenols, polysaccharides, metals, etc[108] Thus, chitosan has been studied as a clarifying agent for various beverages, such as fruit juices[109], beers[110], wines[111], tea green[112], etc.
- Emulsion stabilizing agent: chitosan has a stabilizing effect in classic emulsions[113], which seems to be related to the increase of the continuous phase viscosity, auguring its potential applications in the food industry[114] Emulsion stabilization with chitosan can be adjusted by varying parameters such as its concentration, molecular weight, degree of deacetylation[115], etc. Additionally, chitosan-based systems have shown promising results for the stabilization of Pickering emulsions[116], i.e., a fish oil-enriched mayonnaise[117]
- Films and packaging: the use of chitosan films for food protection has expanded rapidly due to the ability of it to form blends with good antibacterial and barrier properties, which can be achieved by simple methods, i.e., evaporation of solvent from solutions, coating of products with biopolymer solutions by spraying or dipping, layer-by-layer assembly[118-120], etc. Table 3 shows some agricultural commodities reported to be effectively protected by chitosan-containing films.
3.4 Environment
Due to its low cost, waste from seafood processing industries was the first chitinous materials to be evaluated as adsorbents[131]. These materials have been tested and commercialized as an alternative to chemical amendments to provide nitrogen and to control diseases associated with soil-borne pathogens[41] because their decomposition presumably generates a volatile fraction having fungistatic effects[51]. However, it is now possible to obtain chitosan-based materials with better control for specific applications such as the removal of nutrients[132] and soil contaminants such
as dyes (gentian violet, naphthol green and yellow 6)[133], pesticides (Butachlor)[134], heavy metal cations (Pb2+, Cu2+, Cd2+, Fe2+, Cr6+)[135], etc. These materials can be also used as smart carriers, allowing a more rational dosage along with better environmental protection[136]
Other interesting applications of chitosan in this area involve the fabrication of electrochemical sensors[137], including nanometer-sized systems[138] and nano biosensors[139], which stand out for having great potential to determine organic[140] and inorganic[141] pollutants. Some applications for chitosan-based nanofibers have also been proposed in air pollution control, either for industrial processes or for personal protection[142,143], and in clean energy production, such as so-called microbial fuel cells, where chitosan can be used as a material for the fabrication of proton exchange membranes and bioelectrodes[135] Some of the reported applications for chitosan, including those related to environmental protection, are shown in Figure 2
3.5 Energy
The search for biodegradable materials to replace synthetic polymers has driven the testing of a variety of biopolymers, such as cellulose derivatives, dextran, starch, etc., including chitosan, which has been mainly proven in the preparation of electrochemical double-layer capacitors or supercapacitors[144], the fabrication of membranes and electrodes for fuel cells[61], the manufacture of lithium batteries[145] and solar cells[146], etc. The preparation of these materials takes advantage of the ability of chitosan to form films from its aqueous solutions, in which ionic compounds are also added to obtain the species responsible for the movement of electrical charges, such as MgCl2[144]. Thus, the solvent evaporation technique yields chitosan films bearing the ionic elements.
3.6 Petroleum
Chitosan can potentially be used in the different phases of oil exploitation and research in this field has been growing
Table 3. Some agricultural commodities whose postharvest protection with chitosan-containing formulations has been reported.
Products Assays
Avocado Biocomposites of chitosan and pepper essential oil were applied on avocado fruits infected with Colletotrichum gloeosporioides with successful infection control[121]
Apricot Coatings based on Alyssum homalocarpum gum seed and chitosan produce beneficial effects during fruit storage[122].
Banana Coatings with different concentrations of chitosan were assayed on postharvest losses and the shelf life of bananas. The 1% chitosan showed the best performance[123]
Pumpkin (slices) A combined chitosan/vacuum packaging treatment maintained color, micro-biological load, and β-carotene content during storage at low temperatures[103]
Strawberry The coating using a 61 kDa chitosan showed significant preservation of fruit qualities during storage at 4 °C[124]
Guava The effect of chitosan coatings added with lemongrass oil on guava quality during storage at 12 °C maintained the postharvest fruit quality for up to 10 days[125]
Papaya Immersion of fruits in hot water followed by coating with chitosan solutions delayed ripening symptoms without negative effects on sensory traits during storage[126]
Mango (slices) Slices were immersed for 30 min in water at 50 °C and then coated with chitosan; fruit firmness and color were maintained during storage for 9 days at 6 °C[127]
Cucumber Postharvest application of salicylic acid-grafted chitosan coatings reduced chilling injury and preserved cucumber quality during cold storage[128]
Pineapple Coatings based on Aloe vera, chitosan, and ZnO nanoparticles succeeded in reducing weight loss, delayed ripening, and oxidative spoilage of freshly harvested fruits[129]
Tomato Active packaging using chitosan films loaded with TiO2 nanoparticles delayed the ripening process and quality changes of tomatoes[130]
Lárez-Velásquez, C. Polímeros, 33(1), e20230005, 2023 4/15
Chitosan: an overview of its multiple advantages for creating sustainable development poles
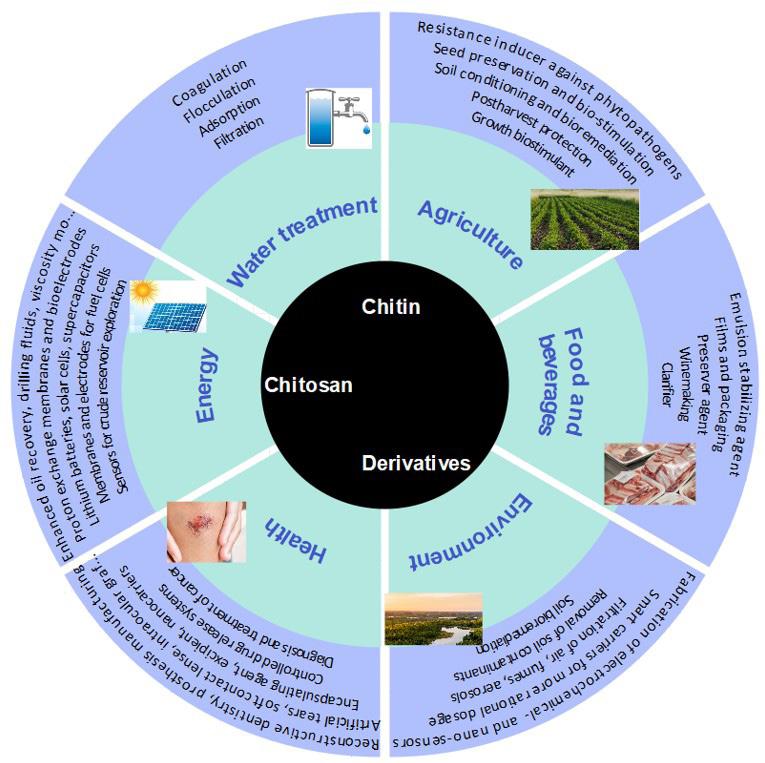
in recent years[147]. Some potential applications that have been initiated or could be initiated in the short term are mentioned below.
- Reservoir exploration and characterization: there is a lot of information on the fabrication of increasingly smaller and smarter sensors, such as the so-called nanorobots, which can allow the determination of the composition of the different strata and fluids of a reservoir, as well as monitoring its physicochemical conditions[148] Many of the systems already investigated could be easily prepared using chitosan. Likewise, micro- and nano-motors prepared with chitosan and alginate have been proposed as active agents for environmental microcleaning and as sensors[149], constituting interesting systems that could be modified for applications in crude oil reservoirs.
- Drilling fluids: selected chitosan derivatives have been proposed as additives in the preparation of aqueous drilling fluids[150], some of which can simultaneously play multiple functions, such as reactive clay inhibitors, rheology modifiers, and filtrate loss reducers, with the added advantage of using a single biodegradable product to replace several additives[151]. The use of chitosan as a removal agent for metal ions such as Cr(II), Zn(II), Pb(II), and Cd(II) in drilling fluid waste has also been addressed[152]
- Enhanced oil recovery (EOR): includes processes such as thermal and chemical injection[147], with partially hydrolyzed polyacrylamide being one of the most widely used synthetic polymers to modulate the
properties of injected fluids, despite its problematic[153] and environmentally unfriendly nature. Some chitosan derivatives that have been synthesized for testing in EOR have shown good performances, i.e., chitosan copolymers grafted with comonomers such as acrylamide, acrylates, acryl-amide-dodecyl-sulphonate[147,154]. Similarly, the interest in nano-materials in EOR has increased, perhaps due to the better performances observed during studies with Fe3O4/chitosan nanocomposites[155]
- Other applications: viscosity modifiers (surfactants that facilitate the extraction and transportation of heavy and extra-heavy crudes) obtained from o-carboxy-methylchitosan have been tested successfully[156]. Further applications to be developed include the preparation of biocorrosion inhibitors for steel pipes used in well acidizing, emulsifiers for bitumen, oil spill treatments, encapsulation of microorganisms for the degradation of hydrocarbons, treatment of wastewater contaminated with hydrocarbons, etc.
3.7 Health
Chitinous materials have recognized antitumor, antioxidant, and antimicrobial activities[157]. Some of its attractive properties, such as bioactivity, healing, and interaction with microorganisms, have recently been reviewed from the molecular structure point of view, considering the degree of deacetylation (GDA), molecular weight, and polymer chain configurations[158]. A few applications already tested or in the process of being developed for commercialization are listed below:
Polímeros, 33(1), e20230005, 2023 5/15
Figure 2. Several of the numerous applications of chitosan.
- Pharmaceutical industry: the use of chitosan as an excipient[159] as well as in the preparation of controlled drug release systems[160] has been explored, including the preparation of nanocarriers[161]. Moreover, chitosan has been studied in the encapsulation of various bioactive species, including live cells and microorganisms[162], genes, vaccines, proteins, drugs, etc[163]. This strategy allows for the protection of the active agent during its transit through adverse environments and improves its residence time, thus increasing its performance[164]. In the case of COVID-19, for example, it could be inferred that the administration of chitosan-coated curcumin could favor the control of cytokine storm[165]
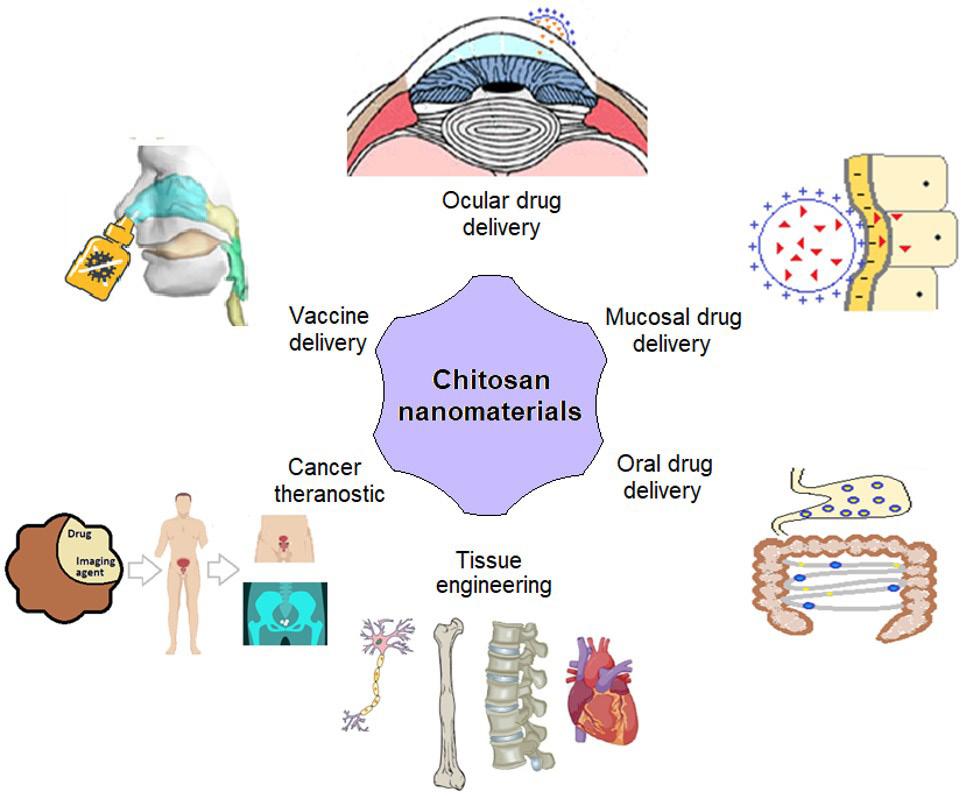
- Medicine: the use of chitosan acetate dressings for the treatment of uncontrolled external bleeding is among the most developed applications of chitosan in the medical area, obtaining materials with better performance than traditional gauze dressings[166]. Among the systems that have shown greater effectiveness is the one used by North American soldiers (HemConTM), whose high attributes were proven during military operations in Iraq and Afghanistan[167]. Likewise, a series of chitosanbased materials have been developed, including powder preparations, solutions, aerosols, hydrogels, films, etc., for the treatment of burns and the healing of wounds and lacerations[168]. On the other hand, the preparation of chitosan-based nanosystems has focused on the development of smart drug delivery systems for the diagnosis and treatment of cancer[169]. Regarding the COVID-19 pandemic, chitosan has played a key role in clarifying some mechanisms of the infective action of SARS-CoV-2. Moreover, some specific chitosan derivatives have shown remarkable antiviral activity, standing out the ones generically called N-[(2-hydroxy3-trimethyl-ammonium)-propyl]-chitosan halides, which
have demonstrated a high ability to block the SARSCoV-2 spike proteins and prevent their interactions with the angiotensin II converting enzyme (ACE2) and other cellular receptors[170]. Likewise, some chitosan/glucan complexes obtained from the cell walls of the fungus Gongronella butleri[171] could be interesting candidates against SARS-CoV-2 due to the determinant role that glycoproteins seem to play in this fight[172]
- Dentistry: the use of chitosan in this sector has been increasing in recent years, with applications in practically all its areas of action. Thus, it is possible to find applications in preventive and reconstructive dentistry, prosthesis manufacturing, endodontics, periodontics, etc.,[173] with many commercial products now available. Among the multiple studies reported, the following can be mentioned: the development of mouthwashes based entirely on biomaterials, i.e., combinations of bio-surfactants, chitosan, and peppermint essential oil to achieve products more environmentally friendly[174]; ionomeric dental adhesives with improved antibacterial properties for restorative dentistry[175]; improvement of root canal treatments, taking advantage of the bactericidal properties of chitosan, especially when its solutions in aqueous citric acid are used[176].
- Ophthalmology: chitosan has been commonly used as a drug carrier and as a dosing system to maintain a controlled release of administered drugs. Its advantages in these applications are closely related to its mucoadhesivity and the different forms of application that can be used, i.e., films, hydrogels, solutions, etc. Additionally, chitosan has been employed to formulate artificial tears[177] and to prepare soft contact lenses[178] and intraocular grafts[179] Figure 3 shows a few of the interesting biomedical applications of chitosan nanomaterials currently under study.
Lárez-Velásquez, C. Polímeros, 33(1), e20230005, 2023 6/15
Figure 3. Some of the interesting biomedical applications of chitosan nanomaterials currently under study.
Chitosan: an overview of its multiple advantages for creating sustainable development poles
Table 4. A few examples of feasible development using chitinous materials by application area.
Area Products
Agriculture Crustacean shells or chitin-based soil amendments; solutions for seed preservation and/or fungicide treatments; sprays for foliar antifungal treatments.
Water Filtration membranes; selective adsorbents, i.e., molecularly imprinted adsorbents; recovery of proteins during the manufacture of fishmeal.
Foods Clarifying agents for juices and wines; emulsion stabilizers (Pickering) used in sauces and mayonnaise; post-harvest fruit preservers.
Environment Hydrogels for the removal of pollutants; nano-biosensors for the determination of contaminants; air filtration systems for industrial and personal protection.
Energy Preparation of elements for solar cells; preparation of ionic polyelectrolytes for batteries; supercapacitors.
Petroleum Nanobots for crude well exploration; preparation of viscosity modifiers; bio-corrosion inhibitors for pipes used in crude well acidification.
Health Hydrogels for wound healing and burn treatment; formulation of mouthwashes using only biomaterials; films for the treatment of burns and wound healing.
Technology Solvent purification; microorganisms’ encapsulation for crude oil degradation; nanosystems for carrying active molecules in cancer treatment/diagnosis.
4. Limitations Overcome by Chitosan
There are a few practical limitations to the more widespread use of chitin and chitosan. Regarding chitin, the main limitation has to do with its insolubility in the usual aqueous media and most organic solvents; however, its dissolution has been achieved in some aqueous systems (solutions of mineral acids, inorganic salts, and alkaline species) as well as in non-aqueous systems (the dimethylformamide-LiCl mixture, methanol saturated with CaCl2•2H2O, ionic liquids, deep eutectic solvents, protic organic solvents, etc.)[180] Furthermore, some salts of lithium halides acidified with HCl effectively convert chitin into N-acetylglucosamine and other water-soluble oligomeric species[181], opening new routes to produce water-soluble chitin oligomers.
On the other hand, chitosan shows a greater versatility due to its easy dissolution in acidic aqueous media, although it is unable to dissolve in alkaline aqueous solutions. However, chitosan solutions prepared in acidic aqueous media could cause certain toxic effects, for example in plants, which have been usually attributed to the acid component[182]; these negative effects could be avoided by using water-soluble oligo-chitosans. Besides, chitosan chemical modifications have become increasingly specific and routine, yielding derivatives that dissolve over a wide pH range, such as their classic quaternary ammonium salts[183] and carboxy-methyl-chitosans[184]. In addition to solubility, other interesting properties of chitosan may be favored by some derivatization processes, such as antimicrobial activity[185] and muco-adhesiveness[164]. Thus, in the current fight against coronaviruses, some of these derivatives have shown antiviral activities that can be optimized by varying the physicochemical properties of the starting chitosan[170]
It is important to note the need to eliminate, for pharmaceutical and biomedical applications, the allergens that may be present in chitosan obtained from marine sources, which could cause intoxication in sensitive individuals; this limitation has been overcome by obtaining fungal chitosans, with further benefits of avoiding dependence on the seasonality and variability of traditional sources[186]
5. Concluding Remarks
Chitin and chitosan may play a prominent role in the care of the planet due to the diversity of biochemical activities they possess and the variety of inexpensive sources from which can be sustainably obtained. As it can be inferred from this very summarized overview, some of the developments are in the initial studies phase, but many others are in advanced stages, especially those related to clinical studies for biomedical applications[187] However, for some applications, urgent progress must be made in long-term studies of the resistance mechanisms of microorganisms to these biomolecules, i.e., as biocidal agents. Similarly, nanosystems could be considered as a coin with two very different sides: the good one for their beneficial effects, i.e., as antimicrobial treatment, and the bad one for the cytotoxic effects that could hypothetically be generated during its application[188]
Finally, and within the context of this work, it is important to appreciate that many of the products and applications that can be developed by using these biomaterials could lead to the satisfaction of a significant part of the basic needs of a population (see Table 4 for a few examples). Thus, the use of these materials could contribute to the development of own technologies for the generation of products and applications, both basic and advanced, in sensitive areas, as briefly discussed above. An additional benefit of the exploitation of these materials is that the necessary integration between the academic sector and other sectors such as industry, business, etc., could be effectively achieved, a situation that is not very usual in developing countries.
6. Acknowledgements
The author is grateful for the review and enrichment of the material by doctors Zormi Correa (Instituto Politécnico Nacional, México), Silvia Bautista Baños (Centro de Desarrollo de Productos Bióticos, México), Gianfranco Romanazzi (Marche Polytechnic University, Italia), José Vega-Baudrit (Centro Nacional de Tecnología, Costa Rica) and Enrique Millán (ULA, Venezuela)
Polímeros, 33(1), e20230005, 2023 7/15
7. References
1 Moreno de la Cruz, J. (2019). Estudios de viabilidad de una planta de producción de quitosano (Master’s thesis). Escuela Técnica Superior de Ingenieros Industriales, Universidad Politécnica de Madrid, España
2 Aranaz, I., Mengíbar, M., Acosta, N., & Heras, A. (2015). Chitosan: a natural polymer with potential industrial applications. Science Vision, 21(1-2), 41-50. Retrieved in 2022, November 23, from http://www.sciencevision.org.pk/CurrentIssue/ Vol21No1&2/05_Chitosan_Aranaz.pdf
3 Thakur, M., Kushwaha, R., & Verma, M. L. (2020). Role of chitosan nanotechnology in biofuel production. In M. L. Verna (Ed.), Nanobiotechnology for sustainable bioenergy and biofuel production (pp. 89-123). USA: CRC Press http:// dx.doi.org/10.1201/9780429023194-4
4. Cheba, B. A. (2020). Chitosan: properties, modifications and food nanobiotechnology. Procedia Manufacturing, 46, 652658 http://dx.doi.org/10.1016/j.promfg.2020.03.093
5. Koilparambil, D., Varghese, S., & Shaikmoideen, J. M. (2020). Chitosan nanoparticles a novel antimicrobial agent. In M. Rai, M. Razzaghi-Abyaneh & A. Ingle (Eds.), Nanobiotechnology in diagnosis, drug delivery, and treatment (pp. 197-215). UK: John Wiley & Sons. http://dx.doi.org/10.1002/9781119671732. ch10.
6 Barra, A., Alves, Z., Ferreira, N. M., Martins, M. A., Oliveira, H., Ferreira, L. P., Cruz, M. M., Carvalho, M. D., Neumayer, S. M., Rodríguez, B. J., Nunes, C., & Ferreira, P. (2020). Biocompatible chitosan-based composites with properties suitable for hyperthermia therapy. Journal of Materials Chemistry. B, Materials for Biology and Medicine, 8(6), 1256-1265. http:// dx.doi.org/10.1039/C9TB02067E. PMid:31960003.
7 Shahraki, H., Basseri, H. R., Mirahmadi, H., Bafghi, M. F., Mehravarn, A., Heidarian, P., & Esboei, B. R. (2018). Evaluation of antibacterial and antifungal activity of chitosan in integument of cockroaches. International Journal of Basic Science in Medicine, 3(3), 104-108 http://dx.doi.org/10.15171/ ijbsm.2018.19
8 Ibitoye, E. B., Lokman, I. H., Hezmee, M. N. M., Goh, Y. M., Zuki, A. B. Z., & Jimoh, A. A. (2018). Extraction and physicochemical characterization of chitin and chitosan isolated from house cricket. Biomedical Materials, 13(2), 025009 http:// dx.doi.org/10.1088/1748-605X/aa9dde PMid:29182521.
9 Azlan, N. S., Edinur, H. A., Ghafar, N. A., & Rasudin, N. S. (2020). Optimization and characterization of chitosan extracted from Mucor rouxii IOP Conference Series: Earth and Environmental Science , 596, 012030 http://dx.doi. org/10.1088/1755-1315/596/1/012030
10 Kou, S. G., Peters, L. M., & Mucalo, M. R. (2021). Chitosan: a review of sources and preparation methods. International Journal of Biological Macromolecules, 169, 85-94 http:// dx.doi.org/10.1016/j.ijbiomac.2020.12.005 PMid:33279563.
11 Kumari, S., & Rath, P. K. (2014). Extraction and characterization of chitin and chitosan from (Labeo rohit) fish scales. Procedia Materials Science, 6, 482-489 http://dx.doi.org/10.1016/j. mspro.2014.07.062
12 Chiriboga, O., & Rorrer, G. L. (2019). Phosphate addition strategies for enhancing the co-production of lipid and chitin nanofibers during fed-batch cultivation of the diatom Cyclotella sp. Algal Research, 38, 101403 http://dx.doi.org/10.1016/j. algal.2018.101403
13 Gachhi, D. B., & Hungund, B. S. (2018). Two-phase extraction, characterization, and biological evaluation of chitin and chitosan from Rhizopus oryzae. Journal of Applied Pharmaceutical Science, 8(11), 116-122 http://dx.doi.org/10.7324/JAPS.2018.81117
14 Sebastian, J., Rouissi, T., & Brar, S. K. (2020). Fungal chitosan: prospects and challenges. In S. Gopi, S. Thomas & A. Pius (Eds.), Handbook of chitin and chitosan (pp. 419-452). Netherlands: Elsevier http://dx.doi.org/10.1016/B978-0-12817970-3.00014-6
15 Lárez-Velásquez, C., & Rojas-Avelizapa, L. I. (2020). A review on the physico-chemical and biological aspects of the chitosan antifungal activity in agricultural applications. Journal of Research Updates in Polymer Science, 9, 70-79 http://dx.doi.org/10.6000/1929-5995.2020.09.07
16. Shin, C.-S., Kim, D.-Y., & Shin, W.-S. (2019). Characterization of chitosan extracted from Mealworm Beetle ( Tenebrio molitor, Zophobas morio) and Rhinoceros Beetle (Allomyrina dichotomy) and their antibacterial activities. International Journal of Biological Macromolecules, 125, 72-77 http:// dx.doi.org/10.1016/j.ijbiomac.2018.11.242 PMid:30500507.
17 Soetemans, L., Uyttebroek, M., & Bastiaens, L. (2020). Characteristics of chitin extracted from black soldier fly in different life stages. International Journal of Biological Macromolecules , 165 (Pt B ), 3206 -3214 http://dx.doi. org/10.1016/j.ijbiomac.2020.11.041 PMid:33181213.
18 Ixtiyarova, G. A., Hazratova, D. A., Umarov, B. N. O., & Seytnazarova, O. M. (2020). Extraction of chitosan from died honeybee Apis melífera Chemical Technology, Control and Management, 2020(2), 3. Retrieved in 2022, November 23, from https://uzjournals.edu.uz/ijctcm/vol20 20/iss2/3
19. Machałowski, T., Amemiya, C., & Jesionowski, T. (2020). Chitin of Araneae origin: structural features and biomimetic applications: a review. Applied Physics. A, Materials Science & Processing, 126(9), 678 http://dx.doi.org/10.1007/s00339020-03867-x
20 Kaya, M., Asan-Ozusaglam, M., & Erdogan, S. (2016). Comparison of antimicrobial activities of newly obtained low molecular weight scorpion chitosan and medium molecular weight commercial chitosan. Journal of Bioscience and Bioengineering, 121(6), 678-684 http://dx.doi.org/10.1016/j. jbiosc.2015.11.005 PMid:26702952.
21 Bernabé, P., Becherán, L., Barjas-Cabrera, G., Nesic, A., Alburquenque, C., Tapia, C. V., Taboada, E., Alderete, J., & De Los Ríos, P. (2020). Chilean crab (Aegla cholchol) as a new source of chitin and chitosan with antifungal properties against Candida spp. International Journal of Biological Macromolecules, 149, 962-975 http://dx.doi.org/10.1016/j. ijbiomac.2020.01.126. PMid:32006582.
22 Trung, T. S., Tram, L. H., van Tan, N., van Hoa, N., Minh, N. C., Loc, P. T., & Stevens, W. F. (2020). Improved method for production of chitin and chitosan from shrimp shells. Carbohydrate Research, 489, 107913. http://dx.doi.org/10.1016/j. carres.2020.107913 PMid:32007692.
23 Hong, S., Yuan, Y., Yang, Q., Zhu, P., & Lian, H. (2018). Versatile acid base sustainable solvent for fast extraction of various molecular weight chitin from lobster shell. Carbohydrate Polymers, 201, 211-217 http://dx.doi.org/10.1016/j.carbpol.2018.08.059 PMid:30241813.
24 Devi, R., & Dhamodharan, R. (2018). Pretreatment in hot glycerol for facile and green separation of chitin from prawn shell waste. ACS Sustainable Chemistry & Engineering, 6(1), 846-853 http://dx.doi.org/10.1021/acssuschemeng.7b03195
25 Yu, Y., Liu, X., Miao, J., & Leng, K. (2020). Chitin from Antarctic krill shell: eco-preparation, detection, and characterization. International Journal of Biological Macromolecules , 164, 4125-4137 http://dx.doi.org/10.1016/j.ijbiomac.2020.08.244 PMid:32890560.
26 Barriada, J. L., Herrero, R., Prada-Rodríguez, D., & Vicente, M. E. S. (2006). Waste spider crab shell and derived chitin as low-cost materials for cadmium and lead removal. Journal of
Lárez-Velásquez, C. Polímeros, 33(1), e20230005, 2023 8/15
Chitosan: an overview of its multiple advantages for creating sustainable development poles
Chemical Technology and Biotechnology (Oxford, Oxfordshire), 82(1), 39-46 http://dx.doi.org/10.1002/jctb.1633
27 Ambarish, C. N., & Sridha, K. R. (2015). Isolation and characterization of chitin from exoskeleton of pill-millipedes. Trends in Biomaterials & Artificial Organs, 29(2), 155-159 Retrieved in 2022, November 23, from https://www.biomaterials. org.in/tibao/index.php/tibao/article/view/142
28. Bulut, E., Sargin, I., Arslan, O., Odabasi, M., Akyuz, B., & Kaya, M. (2017). In situ chitin isolation from body parts of a centipede and lysozyme adsorption studies. Materials Science and Engineering C, 70(Pt 1), 552-563. http://dx.doi. org/10.1016/j.msec.2016.08.048. PMid:27770928.
29 Cuong, H. N., Minh, N. C., van Hoa, N., & Trung, T. S. (2016). Preparation and characterization of high purity β-chitin from squid pens (Loligo chenisis). International Journal of Biological Macromolecules, 93(Pt A), 442-447 http://dx.doi.org/10.1016/j. ijbiomac.2016.08.085
30 Arrouze, F., Desbrieres, J., Hassani, S. L., & Tolaimate, A. (2021). Investigation of β-chitin extracted from cuttlefish: comparison with squid β-chitin. Polymer Bulletin, 78(12), 7219-7239 http://dx.doi.org/10.1007/s00289-020-03466-z
31 Majekodunmi, S. O., Olorunsola, E. O., & Uzoaganobi, C. C. (2017). Comparative physicochemical characterization of chitosan from shells of two bivalved mollusks from two different continents. American Journal of Political Science, 7(1), 15-22 http://dx.doi.org/10.5923/j.ajps.20170701.03
32 Boarin-Alcalde, L., & Graciano-Fonseca, G. (2016). Alkali process for chitin extraction and chitosan production from Nile tilapia (Oreochromis niloticus) scales. Latin American Journal of Aquatic Research, 44(4), 683-688. http://dx.doi. org/10.3856/vol44-issue4-fulltext-3.
33 Molina-Ramírez, C., Mazo, P., Zuluaga, R., Gañán, P., & Álvarez-Caballero, J. (2021). Characterization of chitosan extracted from fish scales of the Colombian endemic species Prochilodus magdalenae as a novel source for antibacterial starch-based films. Polymers, 13(13), 2079 http://dx.doi. org/10.3390/polym13132079 PMid:34202687.
34 Erdogan, S., Kaya, M., & Akata, I. (2017). Chitin extraction and chitosan production from cell wall of two mushroom species ( Lactarius vellereus and Phyllophora ribis). AIP Conference Proceedings, 1809(1), 020012 http://dx.doi. org/10.1063/1.4975427
35 Hassainia, A., Satha, H., & Boufi, S. (2018). Chitin from Agaricus bisporus: extraction and characterization. International Journal of Biological Macromolecules, 117, 1334-1342 http:// dx.doi.org/10.1016/j.ijbiomac.2017.11.172 PMid:29197571.
36 Cabrera-Barjas, G., Gallardo, F., Nesic, A., Taboada, E., Marican, A., Mirabal-Gallardo, Y., Avila-Salas, F., Delgado, N., Armas-Ricard, M., & Valdes, O. (2020). Utilization of industrial by-product fungal biomass from Aspergillus niger and Fusarium culmorum to obtain bio-sorbents for removal of pesticide and metal ions from aqueous solutions. Journal of Environmental Chemical Engineering, 8(5), 104355. http:// dx.doi.org/10.1016/j.jece.2020.104355.
37 El-Far, N. A., Shetaia, Y. M., Ahmed, M. A., Amin, R. M., & Abdou, D. A. (2021). Statistical optimization of chitosan production using marine-derived Penicillium chrysogenum MZ723110 in Egypt. Egyptian Journal of Aquatic Biology and Fisheries, 25(5), 799-819 http://dx.doi.org/10.21608/ ejabf.2021.206881
38 Aili, D., Adour, L., Houali, K., & Amrane, A. (2019). Effect of temperature in Chitin and Chitosan production by solid culture of Penicillium camembertii on YPG médium. International Journal of Biological Macromolecules, 133, 998-1007 http:// dx.doi.org/10.1016/j.ijbiomac.2019.04.116 PMid:31004649.
39 Trincone , A. (Ed.). (2019). Enzymatic technologies for marine polysaccharides USA: CRC Press http://dx.doi. org/10.1201/9780429058653.
40 National Aeronautics and Space Administration – NASA (2006). Spinof: environmental and agricultural resources USA: NASA
41 Andreo-Jimenez, B., Schilder, M. T., Nijhuis, E. H., te Beest, D. E., Bloem, J., Visser, J. H. M., van Os, G., Brolsma, K., Boer, W., & Postma, J. (2021). Chitin- and Keratin-rich Soil amendments suppress Rhizoctonia solani disease via changes to the soil microbial community. Applied and Environmental Microbiology, 87(11), e00318-e00321 http://dx.doi.org/10.1128/ AEM.00318-21 PMid:33771785.
42 Yi, N., Wu, Y., Fan, L., & Hu, S. (2019). Remediating Cdcontaminated soils using natural and chitosan-introduced zeolite, bentonite, and activated carbon. Polish Journal of Environmental Studies, 28(3), 1461-1468. http://dx.doi. org/10.15244/pjoes/89577
43 Shamshina, J. L., Kelly, A., Oldham, T., & Rogers, R. D. (2020). Agricultural uses of chitin polymers. Environmental Chemistry Letters, 18(1), 53-60 http://dx.doi.org/10.1007/ s10311-019-00934-5
44 Freepons, D. (1997). Enhancing food production with chitosan seed-coating technology. In M. F. A. Goosen (Ed.), Applications of chitin and chitosan (pp. 128-139). USA: CRC Press
45 Chookhongkha, N., Sopondilok, T., & Photchanachai, S. (2013). Effect of chitosan and chitosan nanoparticles on fungal growth and chilli seed quality. Acta Horticulturae, (973), 231-237 http://dx.doi.org/10.17660/ActaHortic.2013.973.32
46 Lárez-Velásquez, C. J., Chirinos, A., Tacoronte, M., & Mora, A. A. (2012). Chitosan oligomers as bio-stimulants to zucchini (Cucurbita pepo) seeds germination. Agriculture, 58(3), 113119. Retrieved in 2022, November 23, from https://www. agriculture.sk/fileadmin/agriculture/Velasquez_SC.pdf
47 Khaptsev, Z., Lugovitskaya, T., Shipovskaya, A., & Shipenok, K. (2021). Biological activity of chitosan aspartate and its effect on germination of test seeds. IOP Conference Series: Earth and Environmental Science, 723, 022074 http://dx.doi. org/10.1088/1755-1315/723/2/022074
48 Godínez-Garrido, N. A., Ramírez-Pimentel, J. G., CovarrubiasPrieto, J., Cervantes-Ortiz, F., Pérez-López, A., & AguirreMancilla, C. L. (2021). Chitosan coating on bean and maize seeds: release of agrochemical fungicide and post-storage condition. Journal of Seed Science, 43, e202143036 http:// dx.doi.org/10.1590/2317-1545v43254286
49 Kulus, D. (2019). Application of synthetic seeds in propagation, storage, and preservation of Asteraceae plant species. In M. Faisal & A. Alatar (Eds.), Synthetic seeds: germplasm regeneration, preservation and prospects (pp. 155-179). Switzerland: Springer http://dx.doi.org/10.1007/978-3-030-24631-0_6
50 Xing, K., Zhu, X., Peng, X., & Qin, S. (2015). Chitosan antimicrobial and eliciting properties for pest control in agriculture: a review. Agronomy for Sustainable Development, 35(2), 569-588 http://dx.doi.org/10.1007/s13593-014-0252-3
51 Lárez-Velásquez, C., Rojas-Pirela, M., Chirinos, A., & RojasAvelizapa, L. (2019). Nuevos retos en agricultura para los biopolìmeros de quitina y quitosano. Parte 1: efectos beneficiosos para los cultivos. Revista Iberoamericana de Polímeros y Materiales, 20(3), 118-136. Retrieved in 2022, November 23, from https://reviberpol.files.wordpress.com/2019/06/2019-203-118-136-larez-y-col-1.pdf
52 Liu, J., Zhang, X., Kennedy, J. F., Jiang, M., Cai, Q., & Wu, X. (2019). Chitosan induces resistance to tuber rot in stored potato caused by Alternaria tenuissima. International Journal of Biological Macromolecules, 140, 851-857 http://dx.doi. org/10.1016/j.ijbiomac.2019.08.227 PMid:31470051.
Polímeros, 33(1), e20230005, 2023 9/15
53 Eilenberg, H., Pnini-Cohen, S., Rahamim, Y., Sionov, E., Segal, E., Carmeli, S., & Zilberstein, A. (2010). Induced production of antifungal naphthoquinones in the pitchers of the carnivorous plant Nepenthes khasiana Journal of Experimental Botany, 61(3), 911-922 http://dx.doi.org/10.1093/jxb/erp359 PMid:20018905.
54 Ali, A., Zahid, N., Manickam, S., Siddiqui, Y., Alderson, P. G., & Maqbool, M. (2014). Induction of lignin and pathogenesis related proteins in dragon fruit plants in response to submicron chitosan dispersions. Crop Protection, 63, 83-88 http://dx.doi. org/10.1016/j.cropro.2014.05.009
55. Acemi, A., Polat, E. G., Çakir, M., Demiryürek, E., Yavuz, B., & Fazıl, Ö. (2021). Molecular weight and concentration of chitosan affect plant development and phenolic substance pattern in arugula. Notulae Botanicae Horti Agrobotanici Cluj-Napoca, 49(2), 12296 http://dx.doi.org/10.15835/nbha49212296
56 Kuyyogsuy, A., Deenamo, N., Khompatara, K., Ekchaweng, K., & Churngchow, N. (2018). Chitosan enhances resistance in rubber tree (Hevea brasiliensis), through the induction of abscisic acid (ABA). Physiological and Molecular Plant Pathology, 102, 67-78 http://dx.doi.org/10.1016/j.pmpp.2017.12.001
57 Kloth, K. J., & Kormelink, R. (2020). Defenses against virus and vector: a phloem-biological perspective on RTM-and SLI1mediated resistance to potyviruses and aphids. Viruses, 12(2), 129 http://dx.doi.org/10.3390/v12020129 PMid:31979012.
58 Hua, C., Li, Y., Wang, X., Kai, K., Su, M., Shi, W., Zhang, D., & Liu, Y. (2019). The effect of low and high molecular weight chitosan on the control of gray mold (Botrytis cinerea) on kiwifruit and host response. Scientia Horticulturae, 246, 700-709 http://dx.doi.org/10.1016/j.scienta.2018.11.038
59. Czékus, Z., Iqbal, N., Pollák, B., Martics, A., Ördög, A., & Poór, P. (2021). Role of ethylene and light in chitosan-induced local and systemic defence responses of tomato plants. Journal of Plant Physiology, 263, 153461 http://dx.doi.org/10.1016/j. jplph.2021.153461 PMid:34217837.
60 Ma, J., & Sahai, Y. (2013). Chitosan biopolymer for fuel cell applications. Carbohydrate Polymers, 92(2), 955-975 http:// dx.doi.org/10.1016/j.carbpol.2012.10.015 PMid:23399116.
61 Peian, Z., Haifeng, J., Peijie, G., Sadeghnezhad, E., Qianqian, P., Tianyu, D., Teng, L., Huanchun, J., & Jinggui, F. (2021). Chitosan induces jasmonic acid production leading to resistance of ripened fruit against Botrytis cinerea infection. Food Chemistry, 337, 127772 http://dx.doi.org/10.1016/j. foodchem.2020.127772 PMid:32777571.
62 Hu, W., Godana, E. A., Xu, M., Yang, Q., Dhanasekaran, S., & Zhang, H. (2021). Transcriptome characterization and expression profiles of disease defense-related genes of table grapes in response to Pichia anomala induced with chitosan. Foods, 10(7), 1451 http://dx.doi.org/10.3390/foods10071451 PMid:34206622.
63. Shahrajabian, M. H., Chaski, C., Polyzos, N., Tzortzakis, N., & Petropoulos, S. A. (2021). Sustainable agriculture systems in vegetable production using chitin and chitosan as plant biostimulants. Biomolecules, 11(6), 819. http://dx.doi. org/10.3390/biom11060819. PMid:34072781.
64 Almeida, L. G., Silva, E. M., Magalhaes, P. C., Karam, D., Reis, C. O., Gomes Júnior, C. C., & Marques, D. M. (2020). Root system of maize plants cultivated under water deficit conditions with application of chitosan. Revista Brasileira de Milho e Sorgo, 19, e1131 http://dx.doi.org/10.18512/19806477/rbms.v19n1p11
65 Goudarzian, A., Pirbalouti, A. G., & Hossaynzadeh, M. (2020). Menthol, balance of menthol/menthone, and essential oil contents of Mentha × Piperita L. under foliar-applied chitosan and inoculation of arbuscular mycorrhizal fungi. Journal of
Essential Oil-Bearing Plants, 23(5), 1012-1021 http://dx.doi. org/10.1080/0972060X.2020.1828177
66 Attia, M. S., Osman, M. S., Mohamed, A. S., Mahgoub, H. A., Garada, M. O., Abdelmouty, E. S., & Latef, A. A. H. A. (2021). Impact of foliar application of chitosan dissolved in different organic acids on isozymes, protein patterns and physio-biochemical characteristics of tomato grown under salinity stress. Plants, 10(2), 388 http://dx.doi.org/10.3390/ plants10020388 PMid:33670511.
67 Bautista-Baños, S., Romanazzi, G., & Jiménez-Aparicio, A. (Eds.). (2016). Chitosan in the preservation of agricultural commodities USA: Academic Press http://dx.doi.org/10.1016/ C2014-0-03033-X
68 Romanazzi, G., Feliziani, E., & Sivakumar, D. (2018). Chitosan, a biopolymer with triple action on postharvest decay of fruit and vegetables: Eliciting, antimicrobial and film-forming properties. Frontiers in Microbiology, 9, 2745 http://dx.doi. org/10.3389/fmicb.2018.02745 PMid:30564200.
69. Shah, S., & Hashmi, M. S. (2020). Chitosan–aloe vera gel coating delays postharvest decay of mango fruit. Horticulture, Environment and Biotechnology, 61(2), 279-289 http://dx.doi. org/10.1007/s13580-019-00224-7
70. Gutiérrez-Pacheco, M. M., Ortega-Ramírez, L. A., SilvaEspinoza, B. A., Cruz-Valenzuela, M. R., González-Aguilar, G. A., Lizardi-Mendoza, J., Miranda, R., & Ayala-Zavala, J. F. (2020). Individual and combined coatings of chitosan and carnauba wax with oregano essential oil to avoid water loss and microbial decay of fresh cucumber. Coatings, 10(7), 614 http://dx.doi.org/10.3390/coatings10070614
71 Pavinatto, A., Mattos, A. A., Malpass, A. C. G., Okura, M. H., Balogh, D., & Sanfelice, R. C. (2020). Coating with chitosan-based edible films for mechanical/biological protection of strawberries. International Journal of Biological Macromolecules, 151, 1004-1011 http://dx.doi.org/10.1016/j. ijbiomac.2019.11.076 PMid:31726134.
72 Yang, R., Li, H., Huang, M., Yang, H., & Li, A. (2016). A review on chitosan-based flocculants and their applications in water treatment. Water Research, 95, 59-89 http://dx.doi. org/10.1016/j.watres.2016.02.068 PMid:26986497.
73 Sudha, P. N., Aisverya, S., Gomathi, T., Vijayalakshmi, K., Saranya, M., Sangeetha, K., Latha, S., & Thomas, S. (2017). Applications of chitin/chitosan and its derivatives as adsorbents, coagulants and flocculants. In S. Ahmed & S. Ikram (Eds.), Chitosan: derivatives, composites and applications (pp. 453-487). USA: Scrivener Publishing http://dx.doi. org/10.1002/9781119364849.ch17
74. Genena, A. K., Ferrari, C. T. R. R., & Lenhard, D. C. (2020). Natural coagulants replacing ferric chloride for wastewater slaughterhouses treatment. International Journal of Advanced Engineering Research and Science, 7(7), 568-583 http://dx.doi. org/10.22161/ijaers.77.64
75 Bhalkaran, S., & Wilson, L. D. (2016). Investigation of selfassembly processes for chitosan-based coagulant-flocculant systems: a mini-review. International Journal of Molecular Sciences, 17(10), 1662 http://dx.doi.org/10.3390/ijms17101662 PMid:27706052.
76 Borchert, K. B. L., Steinbach, C., Schwarz, S., & Schwarz, D. (2021). A comparative study on the flocculation of silica and china clay with chitosan and synthetic polyelectrolytes. Marine Drugs, 19(2), 102 http://dx.doi.org/10.3390/md19020102 PMid:33578846.
77 Lee, M. D., & Lee, P. S. (2020). Performance of chitosan as natural coagulant in oil palm mill effluent treatment. In I. Ahmed & J. K. Summers (Eds.), Promising techniques for wastewater treatment and water quality assessment Croatia: IntechOpen http://dx.doi.org/10.5772/intechopen.94330
Polímeros, 33(1), e20230005, 2023 10/15
Lárez-Velásquez, C.
Chitosan: an overview of its multiple advantages for creating sustainable development poles
78 Yang, Z., Hou, J., & Miao, L. (2021). Harvesting freshwater microalgae with natural polymer flocculants. Algal Research, 57, 102358. http://dx.doi.org/10.1016/j.algal.2021.102358.
79 Nguyen, T. T., Luo, X., Su, P., Balakrishnan, B., & Zhang, W. (2020). Highly efficient recovery of nutritional proteins from Australian Rock Lobster heads (Jasus edwardsii) by integrating ultrasonic extraction and chitosan co-precipitation. Innovative Food Science & Emerging Technologies, 60, 102308 http:// dx.doi.org/10.1016/j.ifset.2020.102308
80 Hassan, M. A. A., Li, T. P., & Noor, Z. Z. (2009). Coagulation and flocculation treatment of wastewater in textile industry using chitosan. Journal of Chemical and Natural Resources and Engineering, 4(1), 43-53. Retrieved in 2022, November 23, from http://eprints.utm.my/id/eprint/ 6569/1/MohdAriffinAbu2009_ CoagulationandFlocculationTreatment.pdf
81 Keshvardoostchokami, M., Majidi, M., Zamani, A., & Liu, B. (2021). A review on the use of chitosan and chitosan derivatives as the bio-adsorbents for the water treatment: removal of nitrogen-containing pollutants. Carbohydrate Polymers, 273, 118625 http://dx.doi.org/10.1016/j.carbpol.2021.118625
82 Liu, X.-Q., Zhao, X.-X., Liu, Y., & Zhang, T.-A. (2021). Review on preparation and adsorption properties of chitosan and chitosan composites. Polymer Bulletin, 79(4), 2633-2655. http://dx.doi.org/10.1007/s00289-021-03626-9
83 Vakili, M., Rafatullah, M., Salamatinia, B., Abdullah, A. Z., Ibrahim, M. H., Tan, K. B., Gholami, Z., & Amouzgar, P. (2014). Application of chitosan and its derivatives as adsorbents for dye removal from water and wastewater: A review. Carbohydrate Polymers, 113, 115-130 http://dx.doi. org/10.1016/j.carbpol.2014.07.007 PMid:25256466.
84. Huang, Z. H., Zou, Y., Yuan, F., Li, W. J., & Pu, X. (2012). Adsorption of dyes from acidic wastewater by crosslinked chitosan resin. Advanced Materials Research, 399-401, 1363-1366 http://dx.doi.org/10.4028/www.scientific.net/ AMR.399-401.1363
85 Karimi-Maleh, H., Ayati, A., Davoodi, R., Tanhaei, B., Karimi, F., Malekmohammadi, S., Orooji, Y., Fu, L., & Sillanpää, M. (2021). Recent advances in using of chitosan-based adsorbents for removal of pharmaceutical contaminants: a review. Journal of Cleaner Production, 291, 125880 http://dx.doi.org/10.1016/j. jclepro.2021.125880
86 Doshi, B., Repo, E., Heiskanen, J. P., Sirviö, J. A., & Sillanpää, M. (2018). Sodium salt of oleoyl carboxymethyl chitosan: a sustainable adsorbent in the oil spill treatment. Journal of Cleaner Production, 170, 339-350 http://dx.doi.org/10.1016/j. jclepro.2017.09.163
87. Upadhyay, U., Sreedhar, I., Singh, S. A., Patel, C. M., & Anitha, K. L. (2021). Recent advances in heavy metal removal by chitosan based adsorbents. Carbohydrate Polymers, 251, 117000 http://dx.doi.org/10.1016/j.carbpol.2020.117000 PMid:33142569.
88 Eltaweil, A. S., Omer, A. M., El-Aqapa, H. G., Gaber, N. M., Attia, N. F., El-Subruiti, G. M., Mohy-Eldin, M. S., & El-Monaem, E. M. A. (2021). Chitosan based adsorbents for the removal of phosphate and nitrate: a critical review. Carbohydrate Polymers, 274, 118671. http://dx.doi.org/10.1016/j. carbpol.2021.118671 PMid:34702487.
89 Liu, C., Yu, J., You, J., Wang, Z., Zhang, M., Shi, L., & Zhuang, X. (2021). Cellulose/chitosan composite sponge for efficient protein adsorption. Industrial & Engineering Chemistry Research, 60(25), 9159-9166 http://dx.doi.org/10.1021/acs. iecr.1c01133
90 Marques, J. S., Pereira, M. R., Sotto, A., & Arsuaga, J. M. (2019). Removal of aqueous copper (II) by using crosslinked chitosan films. Reactive & Functional Polymers, 134, 31-39 http://dx.doi.org/10.1016/j.reactfunctpolym.2018.10.009
91 Long, Q., Zhang, Z., Qi, G., Wang, Z., Chen, Y., & Liu, Z.Q. (2020). Fabrication of chitosan nanofiltration membranes by the film casting strategy for effective removal of dyes/ salts in textile wastewater. ACS Sustainable Chemistry & Engineering, 8(6), 2512-2522 http://dx.doi.org/10.1021/ acssuschemeng.9b07026
92. Zhao, J., Liu, H., Xue, P., Tian, S., Sun, S., & Lv, X. (2021). Highly-efficient PVDF adsorptive membrane filtration based on chitosan@CNTs-COOH simultaneous removal of anionic and cationic dyes. Carbohydrate Polymers, 274, 118664 http:// dx.doi.org/10.1016/j.carbpol.2021.118664 PMid:34702483.
93 No, H. K., Meyers, S. P., Prinyawiwatkul, W., & Xu, Z. (2007). Applications of chitosan for improvement of quality and shelf life of foods: a review. Journal of Food Science, 72(5), R87-R100. http://dx.doi.org/10.1111/j.1750-3841.2007.00383.x. PMid:17995743.
94 U.S. Food and Drug Administration – FDA. (2021, March 3). GRAS Notice (GRN) No. 997: GRAS notice for the use of fiber extracted from white button mushrooms as an antimicrobial ingredient in food and beverage products. USA: FDA. Retrieved in 2022, November 23, from https://www.fda.gov/media/154923/ download
95. Food Standard Australia New Zeland (2013). Application A1077: fungal chitosan as a processing aid. Australia: Food Standards Australia New Zealand. Retrieved in 2022, November 23, from https://www.foodstandards.gov.au/code/applications/ Documents/A1077-ChitosanAppR.pdf
96 U.S. Food and Drug Administration – FDA. (2021, July 21). Amendment to GRN 997: gras status of fiber extracted from white button mushrooms (Agaricus bisporus) USA: FDA Retrieved in 2022, November 23, from https://www.fda.gov/ media/159513/download
97 Amit, S. K., Uddin, M. M., Rahman, R., Islam, S. M., & Khan, M. S. (2017). A review on mechanisms and commercial aspects of food preservation and processing. Agriculture & Food Security, 6(1), 51 http://dx.doi.org/10.1186/s40066017-0130-8
98 Ozaki, M. M., Munekata, P. E. S., Lopes, A. S., Nascimento, M. S., Pateiro, M., Lorenzo, J. M., & Pollonio, M. A. R. (2020). Using chitosan and radish powder to improve stability of fermented cooked sausages. Meat Science, 167, 108165 http:// dx.doi.org/10.1016/j.meatsci.2020.108165 PMid:32413692.
99 Savitri, I. K. E., Sianreshy, P., Sormin, R. B. D., & Limon, G. V. (2021). Nanochitosan application on the production of less salt dried fish. IOP Conference Series: Earth and Environmental Science , 805 , 012024 http://dx.doi.org/10.1088/17551315/805/1/012024
100 Alfaifi, M. Y., Alkabli, J., & Elshaarawy, R. F. M. (2020). Suppressing of milk-borne pathogenic using new watersoluble chitosan-azidopropanoic acid conjugate: targeting milk-preservation quality improvement. International Journal of Biological Macromolecules, 164, 1519-1526. http://dx.doi. org/10.1016/j.ijbiomac.2020.07.200 PMid:32731003.
101 Elsaied, B. E., & Tayel, A. A. (2022). Chitosan-based nanoparticles and their applications in food industry. In J. Parameswaranpillai, R. E. Krishnankutty, A. Jayakumar, S. M. Rangappa & S. Siengchin (Eds.), Nanotechnology-enhanced food packaging (pp. 87-128). Germany: Wiley-VCH GmbH http://dx.doi.org/10.1002/9783527827718.ch5
102 Garcia, M., Silva, Y., & Casariego, A. (2014). Development of a mayonnaise with chitosan as natural antioxidant. Emirates Journal of Food and Agriculture, 26(10), 833-835 http:// dx.doi.org/10.9755/ejfa.v26i10.17867
103 Yüksel, Ç., Atalay, D., & Erge, H. S. (2022). The effects of chitosan coating and vacuum packaging on quality of fresh‐cut pumpkin slices during storage. Journal of Food Processing
Polímeros, 33(1), e20230005, 2023 11/15
and Preservation, 46(3), e16365 http://dx.doi.org/10.1111/ jfpp.16365
104 Ghosh, T., & Katiyar, V. (2019). Chitosan-based edible coating: a customise practice for food protection. In V. Katiyar, R. Gupta & T. Ghosh (Eds.), Advances in sustainable polymers: processing and applications (pp. 167-182). Singapore: Springer Nature Singapore Pte Ltd http://dx.doi.org/10.1007/978-98132-9804-0_8
105 Ewis, A., Ghany, A. A., Saber, R. A., Sharaf, A., & Sitohy, M. (2021). Evaluation of chitosan as a new natural preservative in orange juice. Journal of Productivity & Development, 26(4), 737-754 http://dx.doi.org/10.21608/jpd.2021.203483
106 Castro Marín, A., Colangelo, D., Lambri, M., Riponi, C., & Chinnici, F. (2021). Relevance and perspectives of the use of chitosan in winemaking: a review. Critical Reviews in Food Science and Nutrition, 61(20), 3450-3464 http://dx.doi.org/ 10.1080/10408398.2020.1798871 PMid:32723113.
107 Valera, M. J., Sainz, F., Mas, A., & Torija, M. J. (2017). Effect of chitosan and SO2 on viability of Acetobacter strains in wine. International Journal of Food Microbiology, 246, 1-4. http:// dx.doi.org/10.1016/j.ijfoodmicro.2017.01.022 PMid:28187326.
108 Rocha, M. A. M., Coimbra, M. A., & Nunes, C. (2017). Applications of chitosan and their derivatives in beverages: a critical review. Current Opinion in Food Science, 15, 61-69 http://dx.doi.org/10.1016/j.cofs.2017.06.008
109. Sharmin, S., Hossain, M. S., & Abdullah, I. (2020). Comparative characteristics of chitosan extracted from shrimp and crab shell and its application for clarification of pineapple juice. Journal of the Bangladesh Agricultural University, 18(1), 131-137 http://dx.doi.org/10.3329/jbau.v13i1.28729
110 Gassara, F., Antzak, C., Ajila, C. M., Sarma, S. J., Brar, S. K., & Verma, M. (2015). Chitin and chitosan as natural flocculants for beer clarification. Journal of Food Engineering, 166, 8085 http://dx.doi.org/10.1016/j.jfoodeng.2015.05.028
111. Vendramin, V., Spinato, G., & Vincenzi, S. (2021). Shellfish chitosan potential in wine clarification. Applied Sciences, 11(10), 4417 http://dx.doi.org/10.3390/app11104417
112 Cosme, F., & Vilela, A. (2021). Chitin and chitosan in the alcoholic and non-alcoholic beverage industry: an overview. Applied Sciences, 11(23), 11427 http://dx.doi.org/10.3390/ app112311427.
113 Wang, X.-Y., & Heuzey, M.-C. (2016). Chitosan-based conventional and Pickering emulsions with long-term stability. Langmuir, 32(4), 929-936 http://dx.doi.org/10.1021/acs. langmuir.5b03556 PMid:26743171.
114 Chang, C., Gao, Y., Su, Y., Gu, L., Li, J., & Yang, Y. (2021). Influence of chitosan on the emulsifying properties of egg yolk hydrolysates: study on creaming, thermal and oxidative stability. Journal of the Science of Food and Agriculture, 101(11), 4691-4698 http://dx.doi.org/10.1002/jsfa.11114 PMid:33537985.
115 Sharkawy, A., Barreiro, M. F., & Rodrigues, A. E. (2020). Chitosan-based Pickering emulsions and their applications: a review. Carbohydrate Polymers, 250, 116885 http://dx.doi. org/10.1016/j.carbpol.2020.116885 PMid:33049878.
116 Xia , T. , Xue , C. , & Wei , Z. ( 2021 ). Physicochemical characteristics, applications and research trends of edible Pickering emulsions. Trends in Food Science & Technology, 107, 1-15 http://dx.doi.org/10.1016/j.tifs.2020.11.019
117 Hosseini, R. S., & Rajaei, A. (2020). Potential Pickering emulsion stabilized with chitosan-stearic acid nanogels incorporating clove essential oil to produce fish-oil-enriched mayonnaise. Carbohydrate Polymers, 241, 116340 http:// dx.doi.org/10.1016/j.carbpol.2020.116340 PMid:32507214.
118 Kittur, F. S., Kumar, K. R., & Tharanathan, R. N. (1998). Functional packaging properties of chitosan films. Zeitschrift
für Lebensmittelunter-such-ung und-Forschung A, 206(1), 44-47 http://dx.doi.org/10.1007/s002170050211
119 van den Broek, L. A. M., Knoop, R. J. I., Kappen, F. H. J., & Boeriu, C. G. (2015). Chitosan films and blends for packaging material. Carbohydrate Polymers, 116, 237-242 http://dx.doi. org/10.1016/j.carbpol.2014.07.039 PMid:25458295.
120 Mujtaba, M., Morsi, R. E., Kerch, G., Elsabee, M. Z., Kaya, M., Labidi, J., & Khawar, K. M. (2019). Current advancements in chitosan-based film production for food technology; A review. International Journal of Biological Macromolecules, 121, 889-904. http://dx.doi.org/10.1016/j.ijbiomac.2018.10.109. PMid:30340012.
121 Chávez-Magdaleno, M. E., Luque-Alcaraz, A. G., GutiérrezMartínez, P., Cortez-Rocha, M. O., Burgos-Hernández, A., Lizardi-Mendoza, J., & Plascencia-Jatomea, M. (2018). Effect of chitosan-pepper tree (Schinus molle) essential oil biocomposite on the growth kinetics, viability and membrane integrity of Colletotrichum gloeosporioides. Revista Mexicana de Ingeniería Química, 17(1), 29-45. http://dx.doi.org/10.24275/ uam/izt/dcbi/revmexingquim/2018v17n1/Chavez
122 Marvdashti, L. M., Ayatollahi, S. A., Salehi, B., Sharifi‐Rad, J., Abdolshahi, A., Sharifi-Rad, R., & Maggi, F. (2020). Optimization of edible Alyssum homalocarpum seed gum-chitosan coating formulation to improve the postharvest storage potential and quality of apricot (Prunus armeniaca L.). Journal of Food Safety, 40(4), e12805 http://dx.doi.org/10.1111/jfs.12805
123.Sikder, M. B. H., & Islam, M. M. (2019). Effect of shrimp chitosan coating on physico-chemical properties and shelf life extension of banana. International Journal of Engineering Technology and Science, 6(1), 41-54 http://dx.doi.org/10.15282/ ijets.v6i1.1390
124 Jiang, Y., Yu, L., Hu, Y., Zhu, Z., Zhuang, C., Zhao, Y., & Zhong, Y. (2020). The preservation performance of chitosan coating with different molecular weight on strawberry using electrostatic spraying technique. International Journal of Biological Macromolecules, 151, 278-285 http://dx.doi. org/10.1016/j.ijbiomac.2020.02.169 PMid:32081757.
125 Oliveira, L. I. G., Oliveira, K. Á. R., Medeiros, E. S., Batista, A. U. D., Madruga, M. S., Lima, M. S., Souza, E. L., & Magnani, M. (2020). Characterization and efficacy of a composite coating containing chitosan and lemongrass essential oil on postharvest quality of guava. Innovative Food Science & Emerging Technologies, 66, 102506 http://dx.doi. org/10.1016/j.ifset.2020.102506.
126 Vilaplana, R., Chicaiza, G., Vaca, C., & Valencia-Chamorro, S. (2020). Combination of hot water treatment and chitosan coating to control anthracnose in papaya (Carica papaya L.) during the postharvest period. Crop Protection (Guildford, Surrey), 128, 105007 http://dx.doi.org/10.1016/j.cropro.2019.105007
127 Djioua, T., Charles, F., Freire, M., Jr., Filgueiras, H., Ducamp‐Collin, M.-N., & Sallanon, H. (2010). Combined effects of postharvest heat treatment and chitosan coating on quality of fresh‐cut mangoes (Mangifera indica L.). International Journal of Food Science & Technology, 45(4), 849-855 http://dx.doi. org/10.1111/j.1365-2621.2010.02209.x
128.Zhang, Y., Zhang, M., & Yang, H. (2015). Postharvest chitosan-g-salicylic acid application alleviates chilling injury and preserves cucumber fruit quality during cold storage. Food Chemistry, 174, 558-563 http://dx.doi.org/10.1016/j. foodchem.2014.11.106. PMid:25529719.
129 Basumatary, I. B., Mukherjee, A., Katiyar, V., Kumar, S., & Dutta, J. (2021). Chitosan-based antimicrobial coating for improving postharvest shelf life of pineapple. Coatings, 11(11), 1366. http://dx.doi.org/10.3390/coatings11111366.
130 Kaewklin, P., Siripatrawan, U., Suwanagul, A., & Lee, Y. S. (2018). Active packaging from chitosan-titanium dioxide
Polímeros, 33(1), e20230005, 2023 12/15
Lárez-Velásquez, C.
Chitosan: an overview of its multiple advantages for creating sustainable development poles
nanocomposite film for prolonging storage life of tomato fruit. International Journal of Biological Macromolecules, 112, 523-529. http://dx.doi.org/10.1016/j.ijbiomac.2018.01.124. PMid:29410369.
131 Kim, D. S. (2003). The removal by crab shell of mixed heavy metal ions in aqueous solution. Bioresource Technology, 87(3), 355-357. http://dx.doi.org/10.1016/S0960-8524(02)00259-6. PMid:12507879.
132 Jóźwiak, T., Mielcarek, A., Janczukowicz, W., Rodziewicz, J., Majkowska-Gadomska, J., & Chojnowska, M. (2018). Hydrogel chitosan sorbent application for nutrient removal from soilless plant cultivation wastewater. Environmental Science and Pollution Research International, 25(19), 18484-18497 http://dx.doi.org/10.1007/s11356-018-2078-z PMid:29696546.
133.Goncalves, J. O., Santos, J. P., Rios, E. C., Crispim, M. M., Dotto, G. L., & Pinto, L. A. A. (2017). Development of chitosan based hybrid hydrogels for dyes removal from aqueous binary system. Journal of Molecular Liquids, 225, 265-270 http:// dx.doi.org/10.1016/j.molliq.2016.11.067.
134 Kaur, R., Goyal, D., & Agnihotri, S. (2021). Chitosan/PVA silver nanocomposite for butachlor removal: fabrication, characterization, adsorption mechanism and isotherms. Carbohydrate Polymers, 262, 117906. http://dx.doi.org/10.1016/j. carbpol.2021.117906 PMid:33838794.
135 Nangia, S., Warkar, S., & Katyal, D. (2019). A review on environmental applications of chitosan biopolymeric hydrogel based composites. Journal of Macromolecular Science, Part A: Pure and Applied Chemistry, 55(11-12), 747-763 http:// dx.doi.org/10.1080/10601325.2018.1526041
136 Michalik, R., & Wandzik, I. (2020). A mini-review on chitosanbased hydrogels with potential for sustainable agricultural applications. Polymers, 12(10), 2425 http://dx.doi.org/10.3390/ polym12102425 PMid:33096639.
137 Pandey, A., & Raja, A. N. (2020). Recent development in chitosan-based electrochemical sensors and its sensing application. International Journal of Biological Macromolecules, 164, 4231-4244 http://dx.doi.org/10.1016/j.ijbiomac.2020.09.012 PMid:32918960.
138.Yong, S. K., Shrivastava, M., Srivastava, P., Kunhikrishnan, A., & Bolan, N. (2015). Environmental applications of chitosan and its derivatives. In D. M. Whitacre (Ed.), Reviews of environmental contamination and toxicology (pp. 1-43). Switzerland: Springer http://dx.doi.org/10.1007/978-3-31910479-9_1
139 Karami, R., Mohsenifar, A., Namini, S. M. M. N., Kamelipour, N., Rahmani-Cherati, T., Shojaei, T. R., & Tabatabaei, M. (2016). A novel nanobiosensor for the detection of paraoxon using chitosan-embedded organophosphorus hydrolase immobilized on Au nanoparticles. Preparative Biochemistry & Biotechnology, 46(6), 559-566 http://dx.doi.org/10.1080/ 10826068.2015.1084930 PMid:26503886.
140 Zhang, L., Guo, Y., Hao, R., Shi, Y., You, H., Nan, H., Dai, Y., Liu, D., Lei, D., & Fang, J. (2021). Ultra-rapid and highly efficient enrichment of organic pollutants via magnetic nanoparticles/ mesoporous nanosponge compounds for ultrasensitive nanosensor. Nature Communications, 12(1), 6849. http:// dx.doi.org/10.1038/s41467-021-27100-2 PMid:34824226.
141 Parchegani, F., Amani, S., & Zendehdel, M. (2021). Ecofriendly chitosan Schiff base as an efficient sensor for trace anion detection. Spectrochimica Acta. Part A: Molecular and Biomolecular Spectroscopy, 255, 119714 http://dx.doi. org/10.1016/j.saa.2021.119714 PMid:33774417.
142 Mohraz, M. H., Golbabaei, F., Yu, I. J., Mansournia, M. A., Zadeh, A. S., & Dehghan, S. F. (2019). Preparation and optimization of multifunctional electrospun polyurethane/ chitosan nanofibers for air pollution control applications.
International Journal of Environmental Science and Technology, 16(2), 681-694 http://dx.doi.org/10.1007/s13762-018-1649-3
143 Wang, I.-J., Chen, Y.-C., Su, C., Tsai, M.-H., Shen, W.-T., Bai, C.-H., & Yu, K.-P. (2021). Effectiveness of the nanosilver/ TiO2-chitosan antiviral filter on the removal of viral aerosols. Journal of Aerosol Medicine and Pulmonary Drug Delivery, 34(5), 293-302 http://dx.doi.org/10.1089/jamp.2020.1607 PMid:33761275.
144 Hamsan, M. H., Aziz, S. B., Nofal, M. M., Brza, M. A., Abdulwahid, R. T., Hadi, J. M., Karim, W. O., & Kadir, M. F. Z. (2020). Characteristics of EDLC device fabricated from plasticized chitosan: MgCl2 based polymer electrolyte. Journal of Materials Research and Technology, 9(5), 10635-10646 http://dx.doi.org/10.1016/j.jmrt.2020.07.096.
145 Chai, L., Qu, Q., Zhang, L., Shen, M., Zhang, L., & Zheng, H. (2013). Chitosan, a new and environmental benign electrode binder for use with graphite anode in lithium-ion batteries. Electrochimica Acta, 105, 378-383 http://dx.doi.org/10.1016/j. electacta.2013.05.009
146 Zhang, K., Xu, R., Ge, W., Qi, M., Zhang, G., Xu, Q.-H., Huang, F., Cao, Y., & Wang, X. (2017). Electrostatically selfassembled chitosan derivatives working as efficient cathode interlayers for organic solar cells. Nano Energy, 34, 164-171 http://dx.doi.org/10.1016/j.nanoen.2017.02.022
147 Negi, H., Verma, P., & Singh, R. K. (2021). A comprehensive review on the applications of functionalized chitosan in petroleum industry. Carbohydrate Polymers, 266, 118125 http://dx.doi. org/10.1016/j.carbpol.2021.118125. PMid:34044941.
148 Agista, M. N., Guo, K., & Yu, Z. (2018). A state-of-the-art review of nanoparticles application in petroleum with a focus on enhanced oil recovery. Applied Sciences, 8(6), 871 http:// dx.doi.org/10.3390/app8060871
149 Parmar, J., Vilela, D., Villa, K., Wang, J., & Sanchez, S. (2018). Micro- and nanomotors as active environmental microcleaners and sensors. Journal of the American Chemical Society, 140(30), 9317-9331 http://dx.doi.org/10.1021/jacs.8b05762 PMid:29969903.
150 Lei, M., Huang, W., Sun, J., Shao, Z., Zhao, L., Zheng, K., & Fang, Y. (2021). Synthesis and characterization of thermoresponsive polymer based on carboxymethyl chitosan and its potential application in water-based drilling fluid. Colloids and Surfaces. A, Physicochemical and Engineering Aspects, 629, 127478 http://dx.doi.org/10.1016/j.colsurfa.2021.127478
151 Lopes, G., Oliveira, T. C. C., Pérez-Gramatges, A., Silva, J. F. M., & Nascimento, R. S. V. (2014). Cationic and hydrophobically modified chitosans as additives for water-based drilling fluids. Journal of Applied Polymer Science, 131(11), 40300 http:// dx.doi.org/10.1002/app.40300
152 Wasag, H., & Kujawska, J. (2021). Application of chitosan for the removal of heavy metals from drilling fluids wastewaters. Journal of Physics: Conference Series, 1736, 012023 http:// dx.doi.org/10.1088/1742-6596/1736/1/012023
153.Alfazazi, U., AlAmeri, W., & Hashmet, M. R. (2018). Screening of new HPAM base polymers for applications in high temperature and high salinity carbonate reservoirs. In Abu Dhabi International Petroleum Exhibition & Conference (SPE-192805-MS). Abu Dhabi: OnePetro. http://dx.doi. org/10.2118/192805-MS
154 Yu, J., Gou, S., Li, Q., Peng, C., Zhou, L., Liu, L., Tang, L., He, Y., & Duan, M. (2021). A graft-modification of chitosan with twin-tail hydrophobic association polymer for enhance oil recovery. Chemical Physics Letters, 763, 138164 http:// dx.doi.org/10.1016/j.cplett.2020.138164
155.Rezvani, H., Riazi, M., Tabaei, M., Kazemzadeh, Y., & Sharifi, M. (2018). Experimental investigation of interfacial properties in the EOR mechanisms by the novel synthesized
Polímeros, 33(1), e20230005, 2023 13/15
Fe3O4@Chitosan nanocomposites. Colloids and Surfaces. A, Physicochemical and Engineering Aspects, 544, 15-27 http:// dx.doi.org/10.1016/j.colsurfa.2018.02.012
156 Negi, H., Faujdar, E., Saleheen, R., & Singh, R. K. (2020). Viscosity modification of heavy crude oil by using a chitosanbased cationic surfactant. Energy & Fuels, 34(4), 4474-4483 http://dx.doi.org/10.1021/acs.energyfuels.0c00296
157 Zhao, D., Yu, S., Sun, B., Gao, S., Guo, S., & Zhao, K. (2018). Biomedical applications of chitosan and its derivative nanoparticles. Polymers, 10(4), 462 http://dx.doi.org/10.3390/ polym10040462 PMid:30966497.
158. Kou, S. G., Peters, L., & Mucalo, M. (2022). Chitosan: a review of molecular structure, bioactivities and interactions with the human body and micro-organisms. Carbohydrate Polymers, 282, 119132 http://dx.doi.org/10.1016/j.carbpol.2022.119132
PMid:35123764.
159 Patil, S., Pandit, A., Godbole, A., Dandekar, P., & Jain, R. (2021). Chitosan based co-processed excipient for improved tableting. Carbohydrate Polymer Technology & Applications, 2, 100071 http://dx.doi.org/10.1016/j.carpta.2021.100071
160 Safdar, R., Omar, A. A., Arunagiri, A., Regupathi, I., & Thanabalan, M. (2019). Potential of Chitosan and its derivatives for controlled drug release applications: a review. Journal of Drug Delivery Science and Technology, 49, 642-659 http:// dx.doi.org/10.1016/j.jddst.2018.10.020
161 Pramanik, S., & Sali, V. (2021). Connecting the dots in drug delivery: a tour d’horizon of chitosan-based nanocarriers system. International Journal of Biological Macromolecules, 169, 103-121 http://dx.doi.org/10.1016/j.ijbiomac.2020.12.083
PMid:33338522.
162 Pirela, M. R., Rojas, V., Pérez, E. P., & Velásquez, C. L. (2021). Cell encapsulation using chitosan: chemical aspects and applications. Avances en Química, 16(3), 89-103. Retrieved in 2022, November 23, from http://erevistas.saber.ula.ve/index. php/avancesenquimica/article/download/17665/21921928894
163 Velásquez, C. L. (2018). Chitosan-based nanomaterials on controlled bioactive agents delivery: a review. Journal of Analytical & Pharmaceutical Research, 7(4), 484-489. http:// dx.doi.org/10.15406/japlr.2018.07.00271
164 Ways, T. M. M., Lau, W. M., & Khutoryanskiy, V. V. (2018). Chitosan and its derivatives for application in mucoadhesive drug delivery systems. Polymers, 10(3), 267 http://dx.doi. org/10.3390/polym10030267 PMid:30966302.
165 Velásquez, C. L., & Pirela, M. R. (2020). Los quitosanos y la lucha contra los coronavírus. Avances en Química, 15(1), 23-34. Retrieved in 2022, November 23, from http:// erevistas.saber.ula.ve/index.php/avancesenquimica/article/ download/16198/21921927346
166 Gustafson, S. B., Fulkerson, P., Bildfell, R., Aguilera, L., & Hazzard, T. M. (2007). Chitosan dressing provides hemostasis in swine femoral arterial injury model. Prehospital Emergency Care, 11(2), 172-178 http://dx.doi.org/10.1080/10903120701205893 PMid:17454803.
167.Wedmore, I., McManus, J., Pusateri, A. E., & Holcomb, J. B. (2006). A special report on the chitosan-based hemostatic dressing: experience in current combat operations. The Journal of Trauma, 60(3), 655-658 http://dx.doi.org/10.1097/01. ta.0000199392.91772.44. PMid:16531872.
168 Dai, T., Tanaka, M., Huang, Y.-Y., & Hamblin, M. R. (2011). Chitosan preparations for wounds and burns: antimicrobial and wound-healing effects. Expert Review of Anti-Infective Therapy, 9(7), 857-879 http://dx.doi.org/10.1586/eri.11.59
PMid:21810057.
169.Dubey, S. K., Bhatt, T., Agrawal, M., Saha, R. N., Saraf, S., Saraf, S., & Alexander, A. (2022). Application of chitosan modified nanocarriers in breast cancer. International Journal
of Biological Macromolecules, 194, 521-538 http://dx.doi. org/10.1016/j.ijbiomac.2021.11.095 PMid:34822820.
170 Milewska, A., Chi, Y., Szczepanski, A., Barreto-Duran, E., Dabrowska, A., Botwina, P., Obloza, M., Liu, K., Liu, D., Guo, X., Ge, Y., Li, J., Cui, L., Ochman, M., Urlik, M., RodziewiczMotowidlo, S., Zhu, F., Szczubialka, K., Nowakowska, M., & Pyrc, K. (2021). HTCC as a polymeric inhibitor of ASRSCoV-2 and MERS-CoV. Journal of Virology, 95(4), e01622-e20 http://dx.doi.org/10.1128/JVI.01622-20 PMid:33219167.
171 Nwe, N., Stevens, W. F., Tokura, S., & Tamura, H. (2008). Characterization of chitosan and chitosan–glucan complex extracted from the cell wall of fungus Gongronella butleri USDB 0201 by enzymatic method. Enzyme and Microbial Technology, 42(3), 242-251 http://dx.doi.org/10.1016/j. enzmictec.2007.10.001
172 Lardone, R. D., Garay, Y. C., Parodi, P., de la Fuente, S., Angeloni, G., Bravo, E. O., Schmider, A. K., & Irazoqui, F. J. (2021). How glycobiology can help us treat and beat the COVID-19 pandemic. The Journal of Biological Chemistry, 296, 100375 http://dx.doi.org/10.1016/j.jbc.2021.100375 PMid:33548227.
173 Zhang, C., Hui, D., Du, C., Sun, H., Peng, W., Pu, X., Li, Z., Sun, J., & Zhou, C. (2021). Preparation and application of chitosan biomaterials in dentistry. International Journal of Biological Macromolecules, 167, 1198-1210 http://dx.doi. org/10.1016/j.ijbiomac.2020.11.073 PMid:33202273.
174.Farias, J. M., Stamford, T. C. M., Resende, A. H. M., Aguiar, J. S., Rufino, R. D., Luna, J. M., & Sarubbo, L. A. (2019). Mouthwash containing a biosurfactant and chitosan: an ecosustainable option for the control of cariogenic microorganisms. International Journal of Biological Macromolecules, 129, 853-860. http://dx.doi.org/10.1016/j.ijbiomac.2019.02.090. PMid:30776443.
175 Ibrahim, M. A., Priyadarshini, B. M., Neo, J., & Fawzy, A. S. (2017). Characterization of chitosan/TiO2 nano-powder modified glass-ionomer cement for restorative dental applications. Journal of Esthetic and Restorative Dentistry, 29(2), 146-156 http://dx.doi.org/10.1111/jerd.12282 PMid:28190299.
176 Suzuki, S., Masuda, Y., Morisaki, H., Yamada, Y., Kuwata, H., & Miyazaki, T. (2014). The study of chitosan-citrate solution as a root canal irrigant: a preliminary report. Journal of Oral Hygiene & Health, 2(142), 2332-0702 http://dx.doi. org/10.4172/2332-0702.1000142
177 Nepp, J., Knoetzl, W., Prinz, A., Hoeller, S., & Prinz, M. (2020). Management of moderate-to-severe dry eye disease using chitosan-N-acetylcysteine (Lacrimera®) eye drops: a retrospective case series. International Ophthalmology, 40(6), 1547-1552 http://dx.doi.org/10.1007/s10792-020-01324-5 PMid:32124131.
178 Zamboulis, A., Nanaki, S., Michailidou, G., Koumentakou, I., Lazaridou, M., Ainali, N. M., Xanthopoulou, E., & Bikiaris, D. N. (2020). Chitosan and its derivatives for ocular delivery formulations: recent advances and developments. Polymers, 12(7), 1519 http://dx.doi.org/10.3390/polym12071519 PMid:32650536.
179 Franca, J. R., Foureaux, G., Fuscaldi, L. L., Ribeiro, T. G., Castilho, R. O., Yoshida, M. I., Cardoso, V. N., Fernandes, S. O. A., Cronemberger, S., Nogueira, J. C., Ferreira, A. J., & Faraco, A. A. G. (2019). Chitosan/hydroxyethyl cellulose inserts for sustained-release of dorzolamide for glaucoma treatment: in vitro and in vivo evaluation. International Journal of Pharmaceutics, 570, 118662 http://dx.doi.org/10.1016/j. ijpharm.2019.118662 PMid:31491481.
180 Zhong, Y., Cai, J., & Zhang, L.-N. (2020). A review of chitin solvents and their dissolution mechanisms. Chinese Journal of
Polímeros, 33(1), e20230005, 2023 14/15
Lárez-Velásquez, C.
Chitosan: an overview of its multiple advantages for creating sustainable development poles
Polymer Science, 38(10), 1047-1060 http://dx.doi.org/10.1007/ s10118-020-2459-x
181 Gözaydın, G., Song, S., & Yan, N. (2020). Chitin hydrolysis in acidified molten salt hydrates. Green Chemistry, 22(15), 5096-5104 http://dx.doi.org/10.1039/D0GC01464H
182 Ahmed, K. B. M., Khan, M. M. A., Siddiqui, H., & Jahan, A. (2020). Chitosan and its oligosaccharides: a promising option for sustainable crop production: a review. Carbohydrate Polymers, 227, 115331 http://dx.doi.org/10.1016/j.carbpol.2019.115331 PMid:31590878.
183.Andreica, B.-I., Cheng, X., & Marin, L. (2020). Quaternary ammonium salts of chitosan: a critical overview on the synthesis and properties generated by quaternization. European Polymer Journal, 139, 110016 http://dx.doi.org/10.1016/j. eurpolymj.2020.110016
184 Shariatinia, Z. (2018). Carboxymethyl chitosan: properties and biomedical applications. International Journal of Biological Macromolecules , 120 (Pt B ), 1406 -1419 http://dx.doi. org/10.1016/j.ijbiomac.2018.09.131 PMid:30267813.
185 Sahariah, P., & Másson, M. (2017). Antimicrobial chitosan and chitosan derivatives: a review of the structure–activity
relationship. Biomacromolecules, 18(11), 3846-3868 http:// dx.doi.org/10.1021/acs.biomac.7b01058 PMid:28933147.
186 Crognale, S., Russo, C., Petruccioli, M., & D’annibale, A. (2022). Chitosan production by fungi: current state of knowledge, future opportunities and constraints. Fermentation, 8(2), 76. http://dx.doi.org/10.3390/fermentation8020076
187 Heppe Medical Chitosan GmbH. (2022). Current clinical studies with chitosan. Germany: Heppe Medical Chitosan GmbH . Retrieved in 2022, November 23, from https:// www.gmpchitosan.com/en/news/scientific-news-publications/676-current-clinical-studies-with-chitosan.html
188 Rajaraman, V., Rajeshkumar, S., Nallawamy, D., & Ganapathy, D. (2020). Cytotoxic effect and antimicrobial activity of chitosan nanoparticles and hafnium metal based composite: two sides of the same coin: an in vitro study. Journal of Pharmaceutical Research International, 32(19), 122-131 http://dx.doi.org/10.9734/jpri/2020/v32i1930718
Received: Nov. 23, 2022
Revised: Jan. 09, 2023
Accepted: Feb. 19, 2023
Polímeros, 33(1), e20230005, 2023 15/15
Effect of coupling agents on properties of vegetable fiber polymeric composites: review
Dielen Marin1
, Luana Marcele Chiarello1 , Vinicyus Rodolfo Wiggers1 , Amanda Dantas de Oliveira2 and Vanderleia Botton1*
1Laboratório de Desenvolvimento de Processos, Departamento de Engenharia Química, Universidade Regional de Blumenau – FURB, Blumenau, SC, Brasil
2Departamento de Engenharia de Materiais, Centro de Desenvolvimento Tecnológico, Universidade Federal de Pelotas – UFPel, Pelotas, RS, Brasil *vanderleiabotton@furb.br
Rbstract
Using natural fibers in composites presents a wide range of applications, from furniture to airplanes. In polymeric composite, the use of fiber is to boost strength and stiffness. However, this material presents low mechanical properties compared to virgin polymers due to hydrophilic nature of the fiber and hydrophobic nature of the polymer. It can result in weak bonding matrix/fiber which may cause incompatibility problem in bonding fibers with most of the polymer matrices. To achieve compatibility between surfaces there is a need to modify them, and one alternative is using coupling agents. Maleated coupling agents stand out as option, but their source is petroleum-derived polyolefin. Researchers have been seeking for more environmentally friendly alternatives to replace these materials. Therefore, this work aims to bring a comprehensive review of the mechanical behavior of maleated and ecological coupling agents. Based on the literature, resistance, flexural, and tensile strength were properties discussed.
Keywords: composite, coupling agent, mechanical properties, natural fiber, polymer.
How to cite: Marin, D., Chiarello, L. M., Wiggers, V. R., Oliveira, A. D., & Botton, V. (2023). Effect of coupling agents on properties of vegetable fiber polymeric composites: review. Polímeros: Ciência e Tecnologia, 33(1), e20230012. https://doi.org/10.1590/0104-1428.20220118
1. Introduction
Industrial segments have been using composite materials with different natural fiber and polymeric matrices[1], with emphasis on automotive[2], furniture[3], civil construction[4], and aeronautic[5] segments. Composite materials are widely used, and their primary purpose is to obtain a final material with superior structural performance compared to the characteristics of each material. Therefore, in polymeric composites, the role of fiber is to boost the strength and rigidity of the final composite[6]
In Brazil, a substantial amount of waste is produced annually. In 2018, approximately 52 million tons of solid waste was generated (residue of vegetable origin); being 36.9 million tons (70.9%) of those were generated in forest activity, mostly bark, branches, and leaves. At the same time, approximately 15.1 million tons is industrial waste, with 29.1% being chip, sawdust, and black liquor[7] In terms of plastic production, in 2018, 359 million tons of polymers (include thermoplastics, polyurethanes, thermosets, elastomers, adhesives, coatings and PP fibers) and 366 million processed plastics (products that can be manufactured with plastic) were produced worldwide. In Brazil, were produced 8.3 million of polymers (including the polymers mentioned above) in the same year, and 7.2 million tons were processed plastics[8]
R R R R R R R R R R R R
The potential use of natural fibers as reinforcement in composites can be rendered unfeasible due to their low interfacial interaction and adhesion, which can result in a composite material with low mechanical properties[9]. Such behavior was observed by Chen and Porter[10], Bosenbecker et al.[11] and Xiao et al.[12]. In the work of Chen and Porter[10] was studied the thermal stability and the mechanical behavior of composite materials with 12, 44 and 57% (volume fraction) kenaf fibers using polyethylene (PE) as matrix. The authors reported that these fibers could improve PE stiffness; however, through the kinetic study, they observed that an interfacial interaction between kenaf and PE was disadvantageous. They also suggested that future studies should focus on improving the interfacial bonding of composites containing natural fibers. This improvement could be achieved by studies incorporating polar groups into polyolefin molecules.
Currently, there are solutions to improve the adhesion between fibers and matrices. These are the chemical treatment of fibers, which include, for example, alkaline treatment[11,13-16], silane treatment[14-16], acetylation of natural fibers[14,15,17], benzoylation treatment[14,15], acrylation[14,18], acrylonitrile grafting[14], permanganate treatment[14,18], peroxide treatment[14,15], isocyanate treatment[14,15], etherification of natural fibers[14], plasma treatment[19], sodium chlorite treatment of natural fibers[20] and maleated coupling agents[14,21].
https://doi.org/10.1590/0104-1428.20220118
Polímeros, 33(1), e20230012, 2023 ISSN 1678-5169 (Online) 1/11
R
Maleated coupling agents (MCAs) are very popular, especially due to their fast production[22]. MCAs act in the interfacial region, exemplified in red (Figure 1), to improve the mechanical properties of the composites presented by the chemical interaction with the composite, this interaction between polymer and fiber with the addition of coupling agents is exemplified in blue.

Chemical treatments are carried out through chemical modifications on the natural fibers. These treatments decreases the hydrophilic behavior of the fibers and improves compatibility with non-polar polymer matrices. In alkaline treatment, for example, modification of the cellulosic molecular structure of the natural fibers is performed using sodium hydroxide (NaOH). This modification leads to
disruption of hydrogen bonding in the network structure, thereby increasing surface roughness. Therefore, the number of hydrophilic OH groups decreases, the resistance of the fiber to moisture increases[14,21,23]. The chemical reaction of the fiber with NaOH is shown in the Equation 1[14]. Another chemical treatment that can also reduce the number of hydroxyl groups in cellulose is silane treatment, which forms a chemical link between the fiber surface and the matrix via a siloxane bridge[23]. In the presence of moisture, silanols are formed from hydrolyzable alkoxy groups; the next step would be the reaction of the silanol with the OH group of the fiber, forming stable covalent bonds to the cell wall[14,23]
Marin, D.,
L. M.,
Polímeros, 33(1), e20230012, 2023 2/11
Chiarello,
Wiggers, V. R., Oliveira, A. D., & Botton, V.
2 FiberOHNaOHFiberONaHO −+→−−+ (1)
Figure 1. Representation of weak interfacial agent (in red) between matrix polymer (left) and natural fiber strong chemical interaction (in blue) between polymer and fiber with the addition of coupling agents (right) from synthetic or natural coupling agents at the interface with their respective examples: (a) styrene-ethylene/butylenes-styrene (SEBS-MA); (b) maleated polypropylene (MAPP); (c) studied maleated natural rubber (MANR); (d) maleic anhydride grafted on PVC (PVC-g-MA); (e) ecological coco oil coupling agent (COCA); (f) eco-friendly coupling agent (EFCA); (g) starch gum; and (h) natural oil.
Effect of coupling agents on properties of vegetable fiber polymeric composites: review
Studies indicate using natural materials as a source to promote better interfacial interaction between polymeric matrices and natural fibers[24-26]. Nonetheless, the processes to produce commercial coupling agents can generate environmental impacts and have a high cost. Natural resources, in turn, although they renew relatively quickly when they are extracted, their overexploitation is creating a huge deficit. 20% more resources are consumed annually in relation to the amount regenerated[27]. Therefore, within this context, the main goal of this work is to present, discuss and analyze the mechanical behavior of more environmentally friendly coupling agents and maleated polymeric coupling agents when associated with natural fibers and polymer composites (NFPCs).
2. Natural Fibers
Natural fibers have become one of the most promising materials to be used as reinforcement in composite materials due to their high availability, low cost, and low density[25] In addition, natural fibers are a renewable resource. These materials involve a low-risk manufacturing process, with low emission of toxic smoke when subjected to heat, and cause less abrasive damage to processing equipment than synthetic fibers[28,29]. These materials can act as reinforcement to improve the strength and stiffness of the final composites[6] The most widely used natural fibers are jute[30], cotton[31], sugar cane bagasse[32], and sisal[33]
Natural fibers are materials of animal, mineral, or vegetable origin. Vegetable fibers can be divided into wood or non-woody fibers. Non-woody fibers can be subdivided into fibers, capillaries, or seeds, while wood fibers are subdivided into long fibers and short fibers. Regardless of the classification the basic structure are the same, with the main components: cellulose, hemicellulose, and lignin. It is also found pectins and extractives (fats, proteins, and minerals) in their composition, however these components concentration may vary according to the fiber source, growth conditions, plant age, and digestion process[34-37]
Cellulose is the major component of fibers, with around 40 to 90% of the fiber weight, acting as a resistance supplier for its high degree of polymerization and molecular orientation. It is a crystalline polymer formed by β-4-D-glycopyronase units[38]. The amount of hemicellulose in the fibers is between 1 and 30% of their weight. Hemicellulose is highly hydrophobic, soluble in alkalis, and easily hydrolyzed in water. In addition, it presents a group of polysaccharides with derivatives of sugar groups with 5 and 6 carbon rings, responsible for biodegradation, moisture, and thermal degradation of the fiber. Finally, hemicellulose presents a variety of complex, amorphous molecules, and β-D-xylose, β-D-mannose, β-D-glucose, α-L-arabinose, and β-D-glucuronic acid units[38]. Lignin is the second largest macromolecule found in nature, 20-30%, being the first cellulose. Lignin is a highly hydrophobic and complex non-polysaccharide amorphous polyphenolic matrix. It is formed by condensation reactions between p-hydroxycinnamic alcohol derivatives and varying degrees of methoxylation, coumaryl (non-methoxylated), coniferyl (monomethoxylated), and synaphyl (dimethoxylated) alcohols. In the three-dimensional structure of lignin, there are p-hydroxyphenyl (H), guaiacila (G), and syringyl (S) units, respectively[37]
The use of cellulose as reinforcement to polymeric matrices has several advantages. It is natural and lighter, providing greater resistance when compared with inorganic reinforcements. Bosenbecker et al.[11] obtained cellulose from rice husk and used it as reinforcement in a high-density polyethylene matrix. Composites with 5, 10, and 15 wt% cellulose were prepared. The authors observed a very significant increase in the elastic modulus of the composites when compared to the polymeric matrix, and this increase was more pronounced with 15% cellulose. Reichert et al.[13] developed biodegradable composites from corn starch-based films and cellulose extracted from pineapple crowns. The authors verified an increase of 377.76% in the elastic modulus of the biocomposites prepared with 15% cellulose when compared with the starch matrix.
Recognizing the composition of the fibers is of extreme importance since such fibers influence the characteristics of the composite as well as the choice of the appropriate chemical treatment. In this context, physical properties are determined according to the proportion of each of the components[39,40]
The mechanical properties of natural fibers used as reinforcement in composite materials can vary according to the species. According to Xu et al.[41], the use of different fibers in composites improve the properties of tensile strength e Young modulus, according to each specie (Table 1). However, growth conditions and location are also known factors that can influence the properties of composites[42] In addition to these factors, cellulose has a geometry that is also responsible for determining the mechanical properties of fibers[43]
Fibers contain a complex structure with microfibrils with different orientations responsible for resistance related to different applied loads[44]. The different orientations of the microfibrils influence the elongation at break and tensile modulus when the material undergoes tensile loading. According to Lau et al.[44], the elongation at break increases with the microfibrillar angle and traction module of the NFPCs, and it is greater when all the microfibrils are aligned along the fiber direction, where the traction load is connected.
3. Polymer Matrix
The matrix plays an important role in the formulation of a composite material reinforced with natural fibers, as it aims to prevent the entry of moisture and different solvents and, mainly, to enable the fibers (reinforcement) to receive the loads that are applied along the surface of the composite[45] The polymeric matrix of the composite can be found in three ways: polymeric matrix with a virgin polymer, biopolymer, and recycled polymeric matrix.
The most common materials of composite matrices with natural fibers are based on petrochemical sources and are divided into thermoplastic and thermoset polymers. The difference between these two classifications concerns the formation of crosslinks (thermosets) and how polymers behave when reprocessed. The thermoplastic polymer do not form crosslinks, melts completely when a specific
Polímeros, 33(1), e20230012, 2023 3/11
temperature is applied and are recyclable, while the thermoset resins are low-molecular-weight molecules, which form crosslinks in the curing process, promoting chemical bonding between macromolecular chains and creating a three-dimensional network, the cure process is irreversible and thermoset cannot be recycled by thermal action[46-48]. Among the thermoplastic polymers used as matrix, polyethylene (PE)[49], polypropylene (PP)[50], polyvinyl chloride (PVC)[51], and polystyrene (PS)[52] stand out. Among the thermoset polymers, polyurethane (PU)[53] , epoxies[54], and polyesters[55] are commonly used.
Biopolymers are a promising alternative to obtaining a polymeric composite with natural fiber. Among them are
thermoplastic starch (TPS)[56], polycaprolactone (PCL)[57] , polybultadiene succinate (PBS)[58], polylactic acid (PLA)[59] PLA has been the most studied biopolymer associated with the addition of natural fibers. However, although these biopolymers represent a reduction in dependence on petroleum, they may have a limited shelf life. Some biopolymers show a lower performance factor than petroleum-based plastics, and their production involves higher manufacturing costs[60] Table 1 presents a comparison between pure polymers, their composites with natural fibers, and composites together with synthetic or natural coupling agents described in the literature[24,25,41,61-68]. These data are further discussed in topics 3, 6, and 7.
Table 1. Mechanical properties of different polymers (pure), fibers, and coupling agents, conditions with their individual results from tensile strength (TS), Young’s modulus (YM), elongation at break (EB), and impact from the literature.
GPa. b Jm -2 (Izod method). POLYMERS: LDPE = low-density polyethylene; LLDPE/PVOH = linear low-density polyethylene and poly(vinyl alcohol); HDPE = high-density polyethylene; PP = polypropylene; PS = polystyrene; PVC = polyvinyl chloride; PLA = poly lactic acid.
FIBERS: PKS = palm kernel shell; CPH = cocoa pod husk; OHF = olive husk flour. COUPLING AGENTS: COCA = coconut oil coupling agent; MAPP G-3015 and MAPP HC5 = commercial maleated polypropylene; EFCA = eco-friendly coupling agent; MAPE = maleated polyethylene; GCA = green coupling agent; SG = starch gum; SMA = poly(styrene-co-maleic anhydride); PVC-g-MA = maleic anhydride grafted on polyvinyl chloride; SEBS-MA = styrene-ethylene/butylenes-styrene.
Polímeros, 33(1), e20230012, 2023 4/11
Marin, D., Chiarello, L. M., Wiggers, V. R., Oliveira, A. D., & Botton, V.
Polymer Fiber Coupling agent TS (MPa) YM (MPa) EB (%) IMPACT (J m-1) References LDPE - - 13.0 390.0 25.0 - [62] PKS (10 - 40%) - 16.0 - 19.0 500.0 - 780.0 12. 5 - 22.5PKS (10 - 40%) COCA (3 php) 22.0 - 27.0 950.0 - 1580.0 6.0 - 11.0- - 12.2 655.4 5.6 - [63] Green coconut - 13.4 742.3 4.4Green coconut MAPP (5 phr) 17.1 955.3 3.6LLDPE/PVOH - - 9.3 666.4 7.5 - [24] Kenaf (10 - 40%) - 7.0 - 8.6 796.5 - 1169.0 3.0 - 6.5Kenaf (10 - 40%) EFCA (3%) 7.8 - 9.2 921.3 - 1397.0 2.2 - 5.5HDPE Jute - 27.2 - - 51.3 [64] Jute MAPE (0.3 - 2%) 32.0 - 40.1 - - 54.0 - 65.7 PP - - 17.8 - - 23.2 [65] Short sisal - 29.2 - - 51.8 Short sisal MAPP G-3015 (1%) 43.7 - - 68.7 Short sisal MAPP HC5 (1%) 43.8 - - 81.6 - 24.0 750.0 450.0 - [66] CPH (10 - 40 phr) - 16.0 - 20.0 800.0 - 1200.0 14.0 - 30.0CPH (10 - 40 phr) GCA (0.5 phr) 18.0 - 22.0 900.0 - 1300.0 22.0 - 40.0- - 34.0 1200.0 - - [25] Wood flour - 15.0 790.0 -Wood flour SG (3 and 5%) 13.0 and 17.0 950.0 and 1300.0 -Wood flour MAPP (3%) 24.0 1400.0 -PS - - 44.0 3600 - 140.0 [67] Cotton (10 and 20%) - 45.0 and 52.0 4600.0 and 6000.0 - 180.0 and 250.0 Cotton (10 and 20%) SMA (2 phr) 46.0 and 54.0 4550.0 and 6900.0 - 160.0 and 170.0 PVC - - 26.0 120.0 200.0 - [68] OHF (10 - 30%) - 17.0 - 22.5 300.0 - 490.0 20.0 - 55.0OHF (10 - 30%) PVC-g-MA (5%) 18.0 - 23 295.0 - 385.0 28.0 - 60.0- - 20.0 3.0 a - 2500 b [41] Bagasse - 30.0 4.8 a - 1400 b Bagasse SEBS-MA (2.5 and 5%) 33.0 and 35.0 3.6 and 4.5 a - 1300 and 1500 b Rice husk - 26.0 4.4 a - 1400 b Rice husk SEBS-MA (2.5 and 5%) 33.0 and 34.0 4.0 and 4.1 a - 1500 and 1700 b Pine - 32.0 4.4 a - 1200 b Pine SEBS-MA (2.5 and 5%) 28.0 and 35.0 4.4 e 4.7 a - 1800 - 2100 b PLA - - 54.4 2478.0 4.2 - [61] Corn cob (10 - 40 php) - 28.7 - 44.1 3090.0 - 3677.0 0.9 - 1.8Corn cob (10 - 40 php) COCA (3%) 37.7 - 45.4 3357.0 - 3958.0 1.1 - 1.9 -
a
Effect of coupling agents on properties of vegetable fiber polymeric composites: review
The use of NFPCs made from recycled polymeric matrices represents an ecologically friendlier and economically viable alternative for the sustainable generation of valuable products through a more efficient collection. In addition, the adequate separation of plastic waste may lead to gathering plastics that have properties similar to virgin plastics[69]. Among the most common ones are PE[70], PP[71], PVC[72], and PS[73], and their performance can show different results according to their source, exposure, reprocessing conditions, and level of degradation[74]. Table 2 presents the same properties shown in Table 1; however, the studies used recycled polymer polymers[25,26,75-79]. Data are discussed in topics 6 and 7.
4. Fiber-matrix Interface
The interfacial bond between fiber and matrix plays an essential role in determining the mechanical properties of composites due to the load applied to the material to be transferred between the matrix and the fiber through the interface[29]. In addition, when using a composite with natural fibers and polymeric matrix, the high moisture absorption by natural fibers is a worrying factor, since the presence of moisture results in composite materials with weak compatibility between the matrix and the fibers. However, in most cases, this absorption affects mostly fibers, and some polymers also absorb high amounts of water, such as polyamide 6[80]. To solve this, both the fiber and the matrix need to be modified to increase adhesion and, therefore, improve mechanical properties such as strength (tensile strength and Young modulus) and stiffness (impact)[23].
The interfacial bonding can occur in three ways: mechanical bonding, in which any contraction of the matrix onto a fiber would result in a anchoring of the fiber by the matrix; physical
bonding, which involves any weak binding forces, such as van der Waals forces (or secondary), dipolar interactions, and hydrogen bonding, whose energy is usually comprised between 8 and 16 kJ/mol; and chemical bonding, which involves a chemical bond and compound formation may occur at the interface, resulting in an interfacial reaction between the fiber and the matrix, leading the interface to have a certain thickness; the forces of interfacial bonding involves primary forces, i. e., covalent, ionic or metallic bonds[81]. Therefore, to solve the problem of low adhesion between natural fiber and polymeric matrix, numerous studies have been conducted to find alternatives to minimize this problem. The chemical modification of fibers, the graft of monomers, and the use of coupling agents can be viable alternatives to promote an efficient transfer of tensions through the interface[39]
5. Chemical and Physical Fiber Treatment and Modification
Due to its incompatibility and low adhesion between a natural fiber and a polymeric matrix, different treatments and modifications of the fibers are addressed, whose objective is to reduce hydrophilic sites and improve adhesion. Techniques for treating fiber modification can include physical, chemical, and biological modifications[82,83]. Physical modifications do not alter the structure of fibers. However, they modify their properties through an improved mechanical bond with the polymeric matrix. Physical treatments include stretching, plasma treatment, electrical discharge, and thermo-treatments[83]
Among them, plasma has high benefits, as it promotes an improvement in adhesion through its ability to remove contaminants and makes the fiber surface rougher, which, in turn, allows mechanical anchoring between fiber and matrix[84]
akJ m-2 (Charpy method). bJm-2 (Izod method). POLYMERS: R-LDPE = recycled low-density polyethylene; R-HDPE/NR = recycled high density polyethylene and natural rubber; R-PP = recycled polypropylene; R-EPS = recycled expanded polystyrene. COUPLING AGENTS: MAPE = maleated polyethylene; SEBS-MA = styrene-ethylene/butylenes-styrene; MANR = maleated natural rubber; MAPP = commercial maleated polypropylene; SG = starch gum; SMA = poly(styrene-co-maleic anhydride).
Polímeros, 33(1), e20230012, 2023 5/11
Polymer Fiber Coupling agent TS (MPa) YM (MPa) EB (%) IMPACT (J m-1) References R-LDPE - - 11.8 152.5 558.2 - [75] Pine wood waste (1.5 - 30%) MAPE (2.5%) 10.2 - 12.3 164.2 - 857.5 26.9 - 346.6Wood flour - 14.0 1800.0 4.3 19.0 a [76] Wood flour SEBS-MA (2 - 10%) 14.5 - 17.0 1000.0 - 1300.0 7.0 - 11.5 32.0 - 45.0 a R-HDPE/ NR Kenaf (10 - 40 phr) - 11.0 - 12.0 580.0 - 700.0 20.0 - 125.0 - [77] Kenaf (10 - 40 phr) MANR (5%) 12.0 - 13.0 585.0 - 740.0 20.0 - 215.0R-PP Bagasse (paper pulp) - 15.0 - - 800.0 b [26] Bagasse (paper pulp) MAPP (2%) 21.0 - - 1250.0 b Bagasse (paper pulp) Lignin (1 - 5%) 16.0 - 22.0 - - 986.0 - 1293.0 b Bagasse (paper pulp) Modified lignin (1-5%) 17.0 - 25.0 - - 1132.0 - 1425.0 b - - 16.0 750.0 - - [25] Wood flour - 8.0 580.0 -Wood flour SG (3 and 5%) 8.0 and 8.5 800.0 and 1000.0 -Wood flour MAPP (3%) 11.0 800.0 -R-EPS Pineapple crown Sodium hydroxide (5 and 7%) 31.8 and 30.9 708.9 and 730.7 - [79] Wood flour (10 - 40%) - 33.0 - 36.5 3580.0 - 5600.0 - 72.0 - 98.0 [78] Wood flour (10 - 40%) SMA (2%) 35.0 - 37.0 3580.0 - 6000.0 - 80.0 - 106.0
Table 2. Mechanical properties of different recycled polymers, fibers, and coupling agents, conditions with their individual results from tensile strength (TS), Young modulus (YM), elongation at break (EB), and impact.
Biological modifications have great potential to improve the adhesion between the natural fiber and the polymeric matrix. Studies have shown that the deposition of 5% and 6% of the biological content on the surface of natural fibers results in an improvement in the interfacial adhesion of this reinforcement with the polymeric matrix[85]
The modifications in the fibers are responsible for modifying their texture and groups designed for it. The use of a coupling agent is one of the chemical modification methods capable of providing compatibility between natural fiber and matrix[86]. An appropriate coupling agent must contain two suitable domains: one capable of forming tangles with a polymeric matrix and the other capable of interacting with fibers through covalent bonds, polymeric chain interlacing, and strong secondary interactions, such as hydrogen bonding[22,45,87,88]. Reichert et al.[79] studied the effect of the mercerization treatment on the properties of vegetable fibers obtained from the pineapple crown residues. Recycled PP was used as the polymer matrix. To improve the matrix/reinforcement interaction, the authors performed an alkaline mercerization treatment on the surface of the fiber. Through the images obtained by Scanning Electron Microscopy (SEM), the authors found a better interfacial adhesion between the mercerized fibers and the recycled PP matrix.
MCAs are the most popular due to two main factors: rapid production and low cost. In addition to being able to counterbalance as polar and non-polar species constituting the composite, through group interaction, the maleic anhydride present in its composition with the hydroxyl groups of the natural fiber form ester bond, overcoming the surface incompatibility and promoting improvement in the mechanical properties. Some examples of MCAs used in composites are styrene-ethylene/butylenes-styrene maleate (SEBS-MA – Figure 1a)[89], maleic styrene anhydride (SMA)[90], polypropylene maleate (MAPP – Figure 1b)[91,92] and polyethylene maleate (MAPE)[93]
MCAs are obtained through chemical modification of the polymer by means of graphitization with maleic anhydride. The graphitization in this process is responsible for improving the wettability of the fiber, providing the best interfacial adhesion caused by the diffusion of the segments of the chain of the graft molecules in the fiber[38]. However, coupling agents are generally made of petroleum-derived polyolefin from a non-renewable source. Alternative and environmentally friendly methods of biodegradable raw materials have been studied, which can supply the mechanical advantages provided using commercial coupling agents.
6. Effect of Maleated Coupling Agent Treatment on the Mechanical Properties of Composites
Oksman and Lindberg[76] studied the mechanical properties of composites with the recycled low-density polyethylene (R-LDPE) matrix of the coupling agent styrene-ethylene/butylenes-styrene (SEBS-MA) (Figure 1a). The authors observed that the addition of SEBS-MA resulted in improvement of tensile strength, elongation at break and impact resistance, from 3.6 to 21.4%, 66.7 to 167% and 68.4 to 136.8%, respectively, according with coupling agent concentration.
However, Young’s modulus shows lower values for all composites with coupling agents in their information (Table 2), which according to the authors, may have been a consequence of the interface created around the wood flour particles through SEBS-MA, preventing loss of stiffness[75]
Mohanty et al.[65] studied four types of modifications in polypropylene composites reinforced with sisal fibers, namely: alkali, cyanoethylation, the addition of the coupling agents commercially known as Epolene (G-3015) and Hostaprime (HC5) belonging to the maleated propylene group – MAPP (Figure 1b). When HC5 and G-3015 were added, the improvement in tensile strength values was more pronounced, above 49.6% for G-3015 and 50% for HC5 (Table 1). The impact resistance increased by around 32.6% using G-3015 and 57.5% for HC5. In comparison, the cyanoethylation and alkali treatments were less efficient. The same behavior regarding chemical modification in composites was observed for impact resistance and tensile strength. The authors concluded that the gain of mechanical properties by adding MAPP (HC5) or G-3015 could be explained by the coupling reaction between the hydroxyl groups of the fibers and the anhydride groups of MAPP, thus forming an ester bond. The presence of the MAPP coupling agent improved the interaction of PP with sisal fiber, which contributes to a transfer of tension from the matrix to the fiber.
Mohanty et al.[64] investigated the use of maleate polyethylene (MAPE) in composites with an LDPE matrix reinforced with jute. The researchers observed that the addition of the coupling agent provided considerable improvement in tensile strength and impact resistance, from 17.6 to 47% and from 5.26 to 28.1%, respectively (Table 1). The authors also concluded that adding the coupling agent was responsible for reducing the hydrophobicity through covalent bonds between the hydroxyl groups of the natural fiber and the functional group of the maleic anhydride, forming an ester bond. In addition, the non-polar (PE) part of MAPE becomes compatible with the matrix, causing a decrease in the surface energy of the fibers, increasing mobility and dispersion within the matrix, thus leading to better mechanical properties than the composite without adding the coupling agent.
Poletto et al.[78] evaluated the mechanical behavior of the composite with recycled expanded polystyrene (R-EPS) matrix with Pinus elliotti poly wood flour (styrene-co-maleic anhydride) and SMA as a coupling agent. The authors observed that adding SMA resulted in superior mechanical properties such as tensile strength, Young modulus, and impact resistance (Table 2). The same behavior was observed in composites without coupling agents due to the greater interfacial bond between wood flour and polystyrene matrix. With the addition of the coupling agent, the interfacial bond between the wood flour and the recycled EPS matrix was considerably improved, consequently improving the interfacial adhesion. A similar behavior was observed by Borsoi et al.[67], who used the addition of SMA in composite polystyrene and cotton, showing an increase in tensile strength and Young modulus properties.
Cao et al.[77] studied maleated natural rubber as a coupling agent (MANR – Figure 1c) to evaluate the mechanical behavior of the composite with the recycled matrix of high-density polyethylene/natural rubber and kenaf powder.
Polímeros, 33(1), e20230012, 2023 6/11
Marin, D., Chiarello, L. M., Wiggers, V. R., Oliveira, A. D., & Botton, V.
Effect of coupling agents on properties of vegetable fiber polymeric composites: review
The authors observed that MANR increased tensile strength and Young modulus properties. When using MANR with 20 parts per hundred of fiber, the elongation at break increased to 117.4% (Table 2). The authors attributed this to the bond formed between the hydroxyl groups of the fiber and the hydrogen of the maleic anhydride of the MANR.
Aouat et al.[68] used maleic anhydride grafted on PVC (PVC-g-MA – Figure 1d) as the coupling agent for the polyvinyl chloride (PVC) composite and olive peel flour (OHF). The properties of the composite with the coupling agent compared to that without the coupling agent increased by 2.2-5.8% tensile strength and 9.0-40% elongation at break, according to the quantity of OHF present in the composite (Table 1). This increase in the properties was attributed to the coupling agent’s ability to improve the reinforcement’s dispersion in the composite, resulting from the interaction between the maleic anhydride groups and the OH group of the cellulose present in the fiber. However, a decrease was observed in the Young modulus. This reduction in stiffness when adding the coupling agent may result from changing the deformation mechanism, as the stiffness is not extremely sensitive to changes in interfacial adhesion.
7. Effect of Treatment with Renewable Coupling Agents on Mechanical Properties of Composites
Commercial coupling agents are produced on a large scale and involve high production costs. The production of these agents can generate environmental impacts since they are petroleum-based products[25,81]. Researchers have been studying alternatives to develop coupling agents based on natural source, Husseinsyah et al.[62] developed eco-composites using low-density polyethylene (LDPE) as matrix, residue of palm kernel shell (PKS) as reinforcing filler and green coconut oil coupling agent (COCA) as coupling agent (Figure 1e). The authors observed that the increase in the mechanical properties of the composites by adding COCA was 58.8% for tensile strength. The increase in the Young modulus value was more significant, reaching up to 114.2% with 20% of PKS (Table 1) compared with the composite without a coupling agent. These increases were caused by the COCA hydrogen bonding with hydroxyl groups on the fiber surface. At the same time, this coupling agent provided organophilic properties to the fiber surface, which improved the wettability and the bonding of the matrix-fiber interface. However, elongation values at break decreased by adding the coupling agent since COCA provides a more significant interfacial interaction between PKS and the LDPE matrix that can reduce the composite’s ductility and flexibility.
Pang et al.[24] developed an ecological coupling agent based on the use of coconut oil after saponification and the reaction with epichlorohydrin, called eco-friendly coupling agent (EFCA) (Figure 1f). Kenaf fibers were used as reinforcement and low-density linear polyethylene (LLDPE) and poly (vinyl alcohol) (PVOH) as a matrix. The authors reported that using EFCA improved tensile strength and Young modulus according to the number of fibers present in the composite (Table 1). According to the authors, this behavior results from the oxirane group of epichlorindrine, which reacts with the OH group of the wood fiber.
In addition, the dispersion and interfacial adhesion of the fiber in the matrices were improved. Meanwhile, the elongation at break when using EFCA composites was lower than that of the untreated composites, showing that fiber composites that use EFCA have an improved interfacial adhesion between polymer and fiber, thus reducing ductility in the composites.
Rocha and Rosa[25] studied starch gum (Figure 1g) to coat the wood fiber in composites with virgin PP matrix and with recycled PP reinforced with wood flour, comparing them with a commercial MAPP-coated polypropylene coating agent. The properties of the composites with the recycled PP matrix showed an increase in tensile strength values of 6.2% when 5% of starch gum was used. Whereas when MAPP was added, the increase was 37.5%. For the Young modulus, the composites with starch gum increased by 72.4%, while the MAPP addition increased by 37.9% compared to the composite without coupling agent (Tables 1 and 2). Regarding the polymer recycled used as a matrix, the presence of oxidized structures added during the recycling process increased the adhesion between the fiber and the matrix, thus improving the mechanical properties.
Poletto[1] researched the use of natural oils (Figure 1h)carboxylic acids: hexanoic (C6); octanoic (C8); decanoic (C10); and dodecanoic (C12) as substitutes for commercial coupling agents (MAPP) in PP composite and wood flour. The author found that natural oils caused an increase in the flexural strength of all composites with an increase in flexural properties between 6 and 38%. The addition of C6 and C8 represents higher values than adding natural oils as a coupling agent. This increase in the mechanical property of the composite can be associated with the formation of hydrogen bonds and ester bonds between the hydroxyl groups of the wood fiber and the carboxyl groups of natural oils. However, it was observed that as the carbon number increases (C10 and C12), the values of Young Modulus decrease since the hydroxyl groups in the wood and the carboxyl groups in the natural oil become less polar as the carbon chain grows, which makes interactions more fragile.
Younesi-Kordkheili and Pizzi[26] used modified and unmodified lignin as coupling agents in composites with recycled polypropylene and bagasse. The mechanical properties of the compounds that used modified lignin were better than those that used MAPP. The tensile strength increased by 46.6, 66.6, and 40% when using unmodified lignin, modified lignin, and MAPP, respectively. Regarding the impact resistance values, compared with the composite without a coupling agent, the increase was 61.6, 78.1 and 56.2%, respectively (Table 2). This behavior can be explained by the lignin’s capacity to fill the spaces between a matrix and a fiber. In addition, the increase in stiffness results from the good interfacial adhesion provided by the coupling agent because lignin has high reactivity, a good cross-linking ratio between compounds, and consequently increasing adhesion.
The addition of a coupling agent is essential to improve the adhesion and dispersion of composites. In the last decade, researchers have investigated coupling agents from renewable sources worldwide due to their sustainable nature. However, in the literature, only some studies evaluate all properties. These gaps were observed in Table 1 and Table 2.
Polímeros, 33(1), e20230012, 2023 7/11
Another possible option can be the use of combined coupling agents to improve one or more mechanical properties. Therefore, adopting mechanisms that exemplify the interaction between the agent, natural fiber, and polymer might facilitate understanding mechanisms and are essential to understanding their interaction.
8. Conclusions
The use of natural fibers in composites is an alternative to reduce excess waste and improve the mechanical properties of the matrix, besides presenting a revolution in the use of renewable resources. The success of their application in composite materials with polymeric matrix depends on the techniques used and mainly on the treatment selected to modify the hydrophilic surface of the fiber and the hydrophobic polymer or both.
There are many ways to promote adhesion between fibers and polymers, but among the most common ones is using coupling agents for the adhesion, such as silane, isocyanates, titanate derivatives, and the most used one, the maleated coupling agent.
The use of natural sources as coupling agents in composites has attracted the attention of researchers who evaluate their use as an alternative to promote adhesion between polymers and fibers and for being an economically viable and sustainable source. The eco-friendly coupling agents used to modify the surface of composites proved to be as efficient as maleated coupling agents in terms of mechanical properties. Further studies with combined coupling agents are opportunities for new research.
9. Author’s Contribution
• Conceptualization – Dielen Marin; Luana Marcele Chiarello; Vinicyus Rodolfo Wiggers; Vanderleia Botton.
• Data curation – Dielen Marin.
• Formal analysis – Dielen Marin.
• Funding acquisition – Dielen Marin; Luana Marcele Chiarello.
• Investigation – Dielen Marin; Luana Marcele Chiarello.
• Methodology – Dielen Marin; Luana Marcele Chiarello.
• Project administration – Vinicyus Rodolfo Wiggers; Amanda Dantas de Oliveira; Vanderleia Botton.
• Resources –Dielen Marin; Luana Marcele Chiarello; Vinicyus Rodolfo Wiggers; Vanderleia Botton.
• Software – Dielen Marin; Luana Marcele Chiarello; Vinicyus Rodolfo Wiggers; Amanda Dantas de Oliveira; Vanderleia Botton.
• Supervision – Vanderleia Botton.
• Validation – Dielen Marin; Luana Marcele Chiarello; Vinicyus Rodolfo Wiggers; Vanderleia Botton.
• Visualization – Dielen Marin; Luana Marcele Chiarello; Vinicyus Rodolfo Wiggers; Vanderleia Botton.
• Writing – original draft – Dielen Marin; Luana Marcele Chiarello; Vinicyus Rodolfo Wiggers; Vanderleia Botton.
• Writing – review & editing – Dielen Marin; Luana Marcele Chiarello; Vinicyus Rodolfo Wiggers; Amanda Dantas de Oliveira; Vanderleia Botton.
10. Acknowledgements
The authors are grateful to the Universidade de Blumenau (FURB), to the Conselho Nacional de Desenvolvimento Científico e Tecnológico (CNPq, no. 304560/2020-0) for the financial support that made this article possible. This study was financed in part by the Coordenação de Aperfeiçoamento de Pessoal de Nível Superior – Brasil (CAPES) – Finance Code 001.
11. References
1 Poletto, M. (2020). Natural oils as coupling agents in recycled polypropylene wood flour composites: mechanical, thermal and morphological properties. Polymers & Polymer Composites, 28(7), 443-450 http://dx.doi.org/10.1177/0967391119886941
2 Bledzki, A. K., Faruk, O., & Jaszkiewicz, A. (2010). Cars from renewable materials. Kompozyty. Retrieved in 2023, May 1, from http://kompozyty.ptmk.net/pliczki/pliki/2010_t3_17.pdf
3 Li, M., & Wu, Z. H. (2013). The properties of wood-plastics composite (WPC) and its application in furniture. Advanced Materials Research, 815, 605-609 http://dx.doi.org/10.4028/ www.scientific.net/AMR.815.605
4 Bakis, C. E., Bank, L. C., Brown, V. L., Cosenza, E., Davalos, J. F., Lesko, J. J., Machida, A., Rizkalla, S. H., & Triantafillou, T. C. (2002). Fiber-reinforced polymer composites for construction - state-of-the-art review. Journal of Composites for Construction, 6(2), 73-87 http://dx.doi.org/10.1061/ (ASCE)1090-0268(2002)6:2(73)
5 Balakrishnan, P., John, M. J., Pothen, L., Sreekala, M. S., & Thomas, S. (2016). Natural fibre and polymer matrix composites and their applications in aerospace engineering. In S. Rana & R. Fangueiro (Eds.), Advanced composite materials for aerospace engineering: processing, properties and applications (pp. 365-383). Duxford: Woodhead Publishing http://dx.doi.org/10.1016/B9780-08-100037-3.00012-2
6 Väisänen, T., Haapala, A., Lappalainen, R., & Tomppo, L. (2016). Utilization of agricultural and forest industry waste and residues in natural fiber-polymer composites: a review. Waste Management, 54, 62-73 http://dx.doi.org/10.1016/j. wasman.2016.04.037 PMid:27184447.
7 Indústria Brasileira de Árvores – IBÁ. (2019). Report 2019 Brasília: Indústria Brasileira de Árvores. Retrieved in 2023, May 1, from https://iba.org/datafiles/publicacoes/relatorios/ relatorioiba2019-final.pdf
8 Associação Brasileira da Indústria do Plástico – ABIPLAST (2019). Prerfil 2019 São Paulo: Associação Brasileira da Indústria do Plástico. Retrieved in 2023, May 1, from http://www.abiplast.org.br/wp-content/uploads/2020/09/ Perfil_2019_web_abiplast.pdf
9 Beckermann, G. W., & Pickering, K. L. (2008). Engineering and evaluation of hemp fibre reinforced polypropylene composites: fibre treatment and matrix modification. Composites. Part
Marin, D.,
L. M.,
D.,
Polímeros, 33(1), e20230012, 2023 8/11
Chiarello,
Wiggers, V. R., Oliveira, A.
& Botton, V.
Effect of coupling agents on properties of vegetable fiber polymeric composites: review
A, Applied Science and Manufacturing , 39(6), 979-988 http://dx.doi.org/10.1016/j.compositesa.2008.03.010
10 Chen, H.-L., & Porter, R. S. (1994). Composite of polyethylene and kenaf, a natural cellulose fiber. Journal of Applied Polymer Science, 54(11), 1781-1783. http://dx.doi.org/10.1002/app.1994.070541121.
11 Bosenbecker, M. W., Cholant, G. M., Silva, G. E. H., Paniz, O. G., Carreño, N. L. V., Marini, J., & Oliveira, A. D. (2019). Mechanical characterization of HDPE reinforced with cellulose from rice husk biomass. Polímeros: Ciência e Tecnologia, 29(4), e2019058 http://dx.doi.org/10.1590/0104-1428.04819
12 Xiao, X., Zhong, Y., Cheng, M., Sheng, L., Wang, D., & Li, S. (2021). Improved hygrothermal durability of flax/polypropylene composites after chemical treatments through a hybrid approach. Cellulose, 28(17), 11209-11229. http://dx.doi.org/10.1007/ s10570-021-04179-w.
13 Reichert, A. A., Sá, M. R., Freitas, T. C., Barbosa, R., Alves, T. S., Backes, E. H., Alano, J. H., & Oliveira, A. D. (2022). Barrier, mechanical and morphological properties of biodegradable films based on corn starch incorporated with cellulose obtained from pineapple crowns. Journal of Natural Fibers, 19(14), 8541-8554 http://dx.doi.org/10.1080/15440478.2021.1964140
14 Li, X., Tabil, L. G., & Panigrahi, S. (2007). Chemical treatments of natural fiber for use in natural fiber-reinforced composites: a review. Journal of Polymers and the Environment, 15(1), 25-33 http://dx.doi.org/10.1007/s10924-006-0042-3
15 Stevens, S., Dhas, J. E. R., Lewise, K. A. S., Mohammad, A., & Fahad, M. (2022). Investigations on chemical behaviours on mechanical properties of natural fiber composites: an evaluation. Materials Today: Proceedings, 64(Part 1), 410-415 http://dx.doi.org/10.1016/j.matpr.2022.04.761
16 Suardana, N. P. G., Piao, Y., & Lim, J. K. (2011). Mechanical properties of HEMP fibers and HEMP/PP composites: effects of chemical surface treatment. Materials Physics and Mechanics. Retrieved in 2023, May 1, from https://mpm.spbstu.ru/userfiles/ files/MPM_11_1_P01.pdf
17 Zaman, H. U., & Khan, R. A. (2021). Acetylation used for natural fiber/polymer composites. Journal of Thermoplastic Composite Materials, 34(1), 3-23 http://dx.doi.org/10.1177/0892705719838000
18 Haque, R., Saxena, M., Shit, S. C., & Asokan, P. (2015). Fibre-matrix adhesion and properties evaluation of sisal polymer composite. Fibers and Polymers, 16(1), 146-152. http://dx.doi.org/10.1007/s12221-015-0146-2.
19 Enciso, B., Abenojar, J., Aparicio, G. M., & Martínez, M. A. (2021). Decomposition kinetics and lifetime estimation of natural fiber reinforced composites: influence of plasma treatment and fiber type. Journal of Industrial Textiles, 51(4), 594-610 http://dx.doi.org/10.1177/1528083719886046
20 Nayak, S., & Mohanty, J. R. (2019). Influence of chemical treatment on tensile strength, water absorption, surface morphology, and thermal analysis of areca sheath fibers. Journal of Natural Fibers, 16(4), 589-599. http://dx.doi.org/ 10.1080/15440478.2018.1430650
21 Ahmad, F., Choi, H. S., & Park, M. K. (2015). A review: natural fiber composites selection in view of mechanical, light weight, and economic properties. Macromolecular Materials and Engineering, 300(1), 10-24 http://dx.doi.org/10.1002/ mame.201400089
22 Lu, J. Z., Wu, Q., & McNabb, H. S. (2000). Chemical coupling in wood fiber and polymer composites: a review of coupling agents and treatments. Wood and Fiber Science. Retrieved in 2023, May 1, from https://wfs.swst.org/index.php/wfs/article/ view/1311
23 Gholampour, A., & Ozbakkaloglu, T. (2020). A review of natural fiber composites: properties, modification and processing techniques, characterization, applications. Journal of Materials
Science, 55(3), 829-892 http://dx.doi.org/10.1007/s10853019-03990-y
24 Pang, A. L., Ismail, H., & Bakar, A. A. (2018). Eco-friendly coupling agent-treated kenaf/linear low-density polyethylene/ poly (vinyl alcohol) composites. Iranian Polymer Journal, 27(2), 87-96 http://dx.doi.org/10.1007/s13726-017-0588-z
25 Rocha, D. B., & Rosa, D. S. (2019). Coupling effect of starch coated fibers for recycled polymer/wood composites. Composites. Part B, Engineering, 172, 1-8 http://dx.doi.org/10.1016/j. compositesb.2019.05.052
26. Younesi-Kordkheili , H. , & Pizzi , A. ( 2020 ). Ionic liquid-modified lignin as a bio-coupling agent for natural fiber-recycled polypropylene composites. Composites. Part B, Engineering, 181, 107587. http://dx.doi.org/10.1016/j. compositesb.2019.107587
27 Iberdrola. (2023, March 10). Quais são as consequências da superexploração dos recursos naturais? Retrieved in 2023, May 1, from https://www.iberdrola.com/sustentabilidade/ superexploracao-dos-recursos-naturais
28. Adekomaya, O., & Majozi, T. (2019). Sustainability of surface treatment of natural fibre in composite formation: challenges of environment-friendly option. International Journal of Advanced Manufacturing Technology, 105(7-8), 3183-3195. http://dx.doi.org/10.1007/s00170-019-04581-6
29 Pickering, K. L., Efendy, M. G. A., & Le, T. M. (2016). A review of recent developments in natural fibre composites and their mechanical performance. Composites. Part A, Applied Science and Manufacturing, 83, 98-112 http://dx.doi.org/10.1016/j. compositesa.2015.08.038.
30 Karmaker, A. C., & Shneider, J. P. (1996). Mechanical performance of short jute fibre reinforced polypropylene. Journal of Materials Science Letters , 15 ( 3 ), 201 - 202 . http://dx.doi.org/10.1007/BF00274450
31 Tserki, V., Matzinos, P., & Panayiotou, C. (2003). Effect of compatibilization on the performance of biodegradable composites using cotton fiber waste as filler. Journal of Applied Polymer Science, 88(7), 1825-1835 http://dx.doi.org/10.1002/ app.11812.
32 Mulinari, D. R., Voorwald, H. J. C., Cioffi, M. O. H., Silva, M. L. C. P., Cruz, T. G., & Saron, C. (2009). Sugarcane bagasse cellulose/HDPE composites obtained by extrusion. Composites Science and Technology , 69 ( 2 ), 214 - 219 http://dx.doi.org/10.1016/j.compscitech.2008.10.006
33 Rosário, F., Pachekoski, W. M., Silveira, A. P. J., Santos, S. F., Savastano, H. Jr., & Casarin, S. A. (2011). Virgin and recycled polypropylene composites reinforced with sisal by-product. Polímeros: Ciência e Tecnologia, 21(2), 90-97.
34 Fuqua, M. A., Huo, S., & Ulven, C. A. (2012). Natural fiber reinforced composites. Polymer Reviews, 52(3), 259-320 http://dx.doi.org/10.1080/15583724.2012.705409
35 Fowler, P. A. , Hughes , J. M. , & Elias , R. M. ( 2006 ). Biocomposites: technology, environmental credentials and market forces. Journal of the Science of Food and Agriculture, 86(12), 1781-1789 http://dx.doi.org/10.1002/jsfa.2558
36 Sood, M., & Dwivedi, G. (2018). Effect of fiber treatment on flexural properties of natural fiber reinforced composites: a review. Egyptian Journal of Petroleum, 27(4), 775-783 http://dx.doi.org/10.1016/j.ejpe.2017.11.005
37 Ramos, L. P., Silveira, M. H. L., Chiarello, L. M., Gomes, G. R., & Cordeiro, C. S. (2016). Perspectivas à implementação de projetos de biorrefinaria baseadas no uso de materiais lignocelulósicos. In M. C. Area & S. W. Park (Eds.), Panorama de la industria de celulosa y papel y materiales lignocelulósicos (pp. 84-119). Posadas: Universidad Nacional de Misiones
38 Albinante, S. R., Pacheco, É. B. A. V., & Visconte, L. L. Y. (2013). A review on chemical treatment of natural fiber for
Polímeros, 33(1), e20230012, 2023 9/11
Marin, D., Chiarello, L. M., Wiggers, V. R., Oliveira, A. D., & Botton, V.
mixing with polyolefins. Química Nova, 36(1), 114-122 http://dx.doi.org/10.1590/S0100-40422013000100021
39 Saheb, D. N., & Jog, J. P. (1999). Natural fiber polymer composites: a review. Advances in Polymer Technology, 18 ( 4 ), 351 - 363 http://dx.doi.org/10.1002/(SICI)10982329(199924)18:4<351::AID-ADV6>3.0.CO;2-X
40 John, M. J., & Thomas, S. (2008). Biofibres and biocomposites. Carbohydrate Polymers, 71 (3 ), 343-364. http://dx.doi. org/10.1016/j.carbpol.2007.05.040
41 Xu, Y., Wu, Q., Lei, Y., Yao, F., & Zhang, Q. (2008). Natural fiber reinforced poly(vinyl chloride) composites: effect of fiber type and impact modifier. Journal of Polymers and the Environment, 16(4), 250-257 http://dx.doi.org/10.1007/ s10924-008-0113-8.
42 Clemons , C. (2008 ). Raw materials for wood-polymer composites. In K. O. Niska & M. Sain (Eds.), Wood-polymer composite (pp. 1-22). Cambridge: Woodhead Publishing Limited http://dx.doi.org/10.1533/9781845694579.1
43 Kabir, M. M., Wang, H., Aravinthan, T., Cardona, F., & Lau, K. T. (2007). Effects of natural fibre surface on composite properties: a review. Energy, Environment, and Sustainability Retrieved in 2023, May 1, from https://eprints.usq.edu.au/18822/5/ Kabir_Wang_Aravinthan_Cardona_Lau_eddBE2011_PV.pdf
44 Lau, K.-T., Hung, P.-Y., Zhu, M.-H., & Hui, D. (2018). Properties of natural fibre composites for structural engineering applications. Composites. Part B, Engineering, 136, 222-233. http://dx.doi.org/10.1016/j.compositesb.2017.10.038
45 Poletto, M. (2017). Compósitos termoplásticos com madeirauma breve revisão. Revista Interdisciplinar de Ciência Aplicada Retrieved in 2023, May 1, from https://sou.ucs.br/revistas/index. php/ricaucs/article/view/46/42
46 Azlin, M. N. M., Sapuan, S. M., Zainudin, E. S., Zuhri, M. Y. M., & Ilyas, R. A. (2020). Natural polylactic acid-based fiber composites: a review. In F. M. Al-Oqla & S.M. Sapuan (Eds.), Advanced processing, properties, and applications of starch and other bio-based polymers (pp. 21-34). Amsterdam: Elsevier http://dx.doi.org/10.1016/B978-0-12-819661-8.00003-2
47 Marques, A. T. (2011). Fibrous materials reinforced composites production techniques. In R. Fangueiro (Ed.), Fibrous and composite materials for civil engineering applications (pp. 191-215). Cambridge: Woodhead Publishing Limited. http://dx.doi.org/10.1533/9780857095583.3.191
48 Ratna, D. (2022). Recent advances and applications of thermoset resins Amsterdam: Elsevier Chemistry and general applications of thermoset resins , pp. 1-172 http://dx.doi. org/10.1016/B978-0-323-85664-5.00006-5
49 Salem, S., Oliver-Ortega, H., Espinach, F. X., Hamed, K. B., Nasri, N., Alcalà, M., & Mutjé, P. (2019). Study on the tensile strength and micromechanical analysis of alfa fibers reinforced high density polyethylene composites. Fibers and Polymers, 20(3), 602-610 http://dx.doi.org/10.1007/s12221-019-8568-x
50 Zhao, X., Sun, Z., & Tang, A. (2022). Effects of hyperbranched polyamide on the properties of sisal fiber reinforced polypropylene composites. Journal of Natural Fibers, 19(5), 1690-1699 http://dx.doi.org/10.1080/15440478.2020.1787923
51 Jiang, L., Fu, J., & Liu, L. (2020). Seawater degradation resistance of straw fiber-reinforced polyvinyl chloride composites. BioResources, 15(3), 5305-5315 http://dx.doi. org/10.15376/biores.15.3.5305-5315
52 Zafar, M. F., & Siddiqui, M. A. (2022). Preparation and characterization of natural fiber filled polystyrene composite using in situ polymerisation technique. Advances in Materials and Processing Technologies, 8(1), 169-179 http://dx.doi. org/10.1080/2374068X.2020.1798087
53 Azammi, A. M. N., Sapuan, S. M., Ishak, M. R., & Sultan, M. T. H. (2020). Physical and damping properties of kenaf fibre
filled natural rubber/thermoplastic polyurethane composites. Defence Technology, 16(1), 29-34 http://dx.doi.org/10.1016/j. dt.2019.06.004
54 Arun, M., Vincent, S., & Karthikeyan, R. (2019). Development and characterization of sisal and jute cellulose reinforced polymer composite. Materials Today: Proceedings, 28(Part 2), 556-561
55 Kumar, S. S. (2020). Effect of natural fiber loading on mechanical properties and thermal characteristics of hybrid polyester composites for industrial and construction fields. Fibers and Polymers, 21(7), 1508-1514 http://dx.doi.org/10.1007/s12221-020-9853-4
56. Ibrahim, M. M., Moustafa, H., Rahman, E. N. A. E., Mehanny, S., Hemida, M. H., & El-Kashif, E. (2020). Reinforcement of starch based biodegradable composite using Nile rose residues. Journal of Materials Research and Technology, 9(3), 6160-6171 http://dx.doi.org/10.1016/j.jmrt.2020.04.018
57 Sarasini, F., Tirillò, J., Puglia, D., Dominici, F., Santulli, C., Boimau, K., Valente, T., & Torre, L. (2017). Biodegradable polycaprolactone-based composites reinforced with ramie and borassus fibres. Composite Structures, 167 , 20-29 http://dx.doi.org/10.1016/j.compstruct.2017.01.071.
58 Azhar, S. W., Xu, F., Zhang, Y., & Qiu, Y. (2020). Fabrication and mechanical properties of flaxseed fiber bundle-reinforced polybutylene succinate composites. Journal of Industrial Textiles, 50(1), 98-113 http://dx.doi.org/10.1177/1528083718821876
59 Manral, A., & Bajpai, P. K. (2020). Static and dynamic mechanical analysis of geometrically different kenaf/PLA green composite laminates. Polymer Composites, 41(2), 691-706 http://dx.doi. org/10.1002/pc.25399
60 Faruk, O., Bledzki, A. K., Fink, H.-P., & Sain, M. (2014). Progress report on natural fiber reinforced composites. Macromolecular Materials and Engineering, 299(1), 9-26 http://dx.doi.org/10.1002/mame.201300008.
61 Chun, K. S., & Husseinsyah, S. (2014). Polylactic acid/corn cob eco-composites: effect of new organic coupling agent. Journal of Thermoplastic Composite Materials, 27(12), 1667-1678 http://dx.doi.org/10.1177/0892705712475008
62 Husseinsyah, S., Chun, K. S., Hadi, A., & Ahmad, R. (2016). Effect of filler loading and coconut oil coupling agent on properties of low-density polyethylene and palm kernel shell eco-composites. Journal of Vinyl and Additive Technology, 22(3), 200-205. http://dx.doi.org/10.1002/vnl.21423.
63 Oliveira, T. Á., Teixeira, A., Mulinari, D. R., & Goulart, S. A. S. (2017). Avaliação do uso de agente compatibilizante no comportamento mecânico dos compósitos PEBD reforçados com fibras de coco verde. Cadernos UniFOA, 5(14), 11-17 http://dx.doi.org/10.47385/cadunifoa.v5.n14.1008
64 Mohanty, S., Verma, S. K., & Nayak, S. K. (2006). Dynamic mechanical and thermal properties of MAPE treated jute/HDPE composites. Composites Science and Technology, 66(3-4), 538-547 http://dx.doi.org/10.1016/j.compscitech.2005.06.014
65 Mohanty, S. , Nayak , S. K. , Verma , S. K. , & Tripathy, S. S. (2004). Effect of MAPP as coupling agent on the performance of sisal-PP composites. Journal of Reinforced Plastics and Composites, 23(18), 2047-2063 http://dx.doi. org/10.1177/0731684404041711
66 Chun, K. S., Husseinsyah, S., & Yeng, C. M. (2016). Effect of green coupling agent from waste oil fatty acid on the properties of polypropylene/cocoa pod husk composites. Polymer Bulletin, 73(12), 3465-3484 http://dx.doi.org/10.1007/s00289-016-1682-7
67 Borsoi, C., Scienza, L. C., Zattera, A. J., & Angrizani, C. C. (2011). Obtainment and characterization of composites using polystyrene as matrix and fiber waste from cotton textile industry as reinforcement. Polímeros: Ciência e Tecnologia, 21(4), 271279 http://dx.doi.org/10.1590/S0104-14282011005000055
68 Aouat, H., Hammiche, D., Boukerrou, A., Djidjelli, H., Grohens, Y., & Pillin, I. (2020). Effects of interface modification on
Polímeros, 33(1), e20230012, 2023 10/11
Effect of coupling agents on properties of vegetable fiber polymeric composites: review
composites based on olive husk flour. Materials Today: Proceedings, 36(Part 1), 94-100
69 Jayaraman, K., & Bhattacharyya, D. (2004). Mechanical performance of woodfibre-waste plastic composite materials. Resources, Conservation and Recycling, 41(4), 307-319. http:// dx.doi.org/10.1016/j.resconrec.2003.12.001
70 Macedo, M. J. P., Silva, G. S., Feitor, M. C., Costa, T. H. C., Ito, E. N., & Melo, J. D. D. (2020). Composites from recycled polyethylene and plasma treated kapok fibers. Cellulose, 27(4), 2115-2134. http://dx.doi.org/10.1007/s10570-019-02946-4.
71 Rokbi, M., Khaldoune, A., Sanjay, M. R., Senthamaraikannan, P., Ati, A., & Siengchin, S. (2020). Effect of processing parameters on tensile properties of recycled polypropylene based composites reinforced with jute fabrics. International Journal of Lightweight Materials and Manufacture, 3(2), 144-149 http://dx.doi.org/10.1016/j.ijlmm.2019.09.005
72 Shebani, A., Algoul, S. M., Al-Qish, A. M., & Elhari, W. (2019). Impact strength and surface hardness properties: virgin PVC versus recycled PVC composites filled with two different natural fibers. In 2nd Conference for Engineering Sciences and Technology (pp. 1-10). Sabratha: Faculty of Engineering Sabratha. Retrieved in 2023, May 1, from https://engs.sabu. edu.ly/wp-content/uploads/2020/02/CEST02_042.pdf
73 Poletto, M. (2017). Mechanical, dynamic mechanical and morphological properties of composites based on recycled polystyrene filled with wood flour wastes. Maderas. Ciencia y Tecnología, 19(4), 433-442 http://dx.doi.org/10.4067/S0718221X2017005000301
74 Najafi, S. K. (2013). Use of recycled plastics in wood plastic composites - a review. Waste Management, 33(9), 1898-1905 http://dx.doi.org/10.1016/j.wasman.2013.05.017 PMid:23777666.
75 Moreno, D. D. P., & Saron, C. (2017). Low-density polyethylene waste/recycled wood composites. Composite Structures, 176, 1152-1157. http://dx.doi.org/10.1016/j.compstruct.2017.05.076.
76 Oksman , K. , & Lindberg , H. ( 1998 ). Influence of thermoplastic elastomers on adhesion in polyethylene-wood flour composites. Journal of Applied Polymer Science , 68(11), 1845-1855 http://dx.doi.org/10.1002/(SICI)10974628(19980613)68:11<1845::AID-APP16>3.0.CO;2-T
77 Cao, X. V., Ismail, H., Rashid, A. A., Takeichi, T., & Vo-Huu, T. (2012). Maleated natural rubber as a coupling agent for recycled high density polyethylene/natural rubber/kenaf powder biocomposites. Polymer-Plastics Technology and Engineering, 51(9), 904-910 http://dx.doi.org/10.1080/036 02559.2012.671425
78 Poletto, M., Dettenborn, J., Zeni, M., & Zattera, A. J. (2011). Characterization of composites based on expanded polystyrene wastes and wood flour. Waste Management, 31(4), 779-784 http:// dx.doi.org/10.1016/j.wasman.2010.10.027 PMid:21172732.
79 Reichert, A. A., Sá, M. R., Silva, G. E. H., Beatrice, C. A. G., Fajardo, A. R., & Oliveira, A. D. (2020). Utilization of pineapple crown fiber and recycled polypropylene for production of sustainable composites. Journal of Renewable Materials, 8(10), 1327-1341 http://dx.doi.org/10.32604/jrm.2020.010291
80. Prabhakaran, R. T. D., Andersen, T. L., & Lystrup, A. (2011). Influence of moisture absorption on properties of fiber reinforced polyamide 6 composites. In 26th Annual Technical Conference of the American Society for Composites 2011 and the 2nd Joint US-Canada Conference on Composites (pp. 500-510). Lancaster: DEStech Publications, Inc
81 Chawla, K. K. (2021). Composite materials: science and engineering New York: Springer
82 Li, M., Pu, Y., Thomas, V. M., Yoo, C. G., Ozcan, S., Deng, Y., Nelson, K., & Ragauskas, A. J. (2020). Recent advancements of plant-based natural fiber-reinforced composites and their applications. Composites. Part B, Engineering, 200, 108254 http://dx.doi.org/10.1016/j.compositesb.2020.108254
83 Amiandamhen, S. O., Meincken, M., & Tyhoda, L. (2020). Natural fibre modification and its influence on fibre-matrix interfacial properties in biocomposite materials. Fibers and Polymers, 21(4), 677-689 http://dx.doi.org/10.1007/s12221-020-9362-5
84 Karim, M. R. A., Tahir, D., Haq, E. U., Hussain, A., & Malik, M. S. (2021). Natural fibres as promising environmental-friendly reinforcements for polymer composites. Polymers & Polymer Composites , 29 ( 4 ), 277 - 300 http://dx.doi. org/10.1177/0967391120913723
85 Cruz, J., & Fangueiro, R. (2016). Surface modification of natural fibers: a review. Procedia Engineering, 155, 285-288 http://dx.doi.org/10.1016/j.proeng.2016.08.030
86 Anbupalani, M. S., Venkatachalam, C. D., & Rathanasamy, R. (2020). Influence of coupling agent on altering the reinforcing efficiency of natural fibre-incorporated polymers - a review. Journal of Reinforced Plastics and Composites, 39(13-14), 520-544 http://dx.doi.org/10.1177/0731684420918937
87 Klyosov, A. A. (2007). Wood-plastic composites Hoboken: John Wiley & Sons http://dx.doi.org/10.1002/9780470165935
88. Kim, J. K., & Pal, K. (2011). Recent advances in the processing of wood-plastic composites. Berlin: Springer. http://dx.doi. org/10.1007/978-3-642-14877-4.
89. Yeh, S.-K., Hsieh, C.-C., Chang, H.-C., Yen, C. C. C., & Chang, Y.-C. (2015). Synergistic effect of coupling agents and fiber treatments on mechanical properties and moisture absorption of polypropylene-rice husk composites and their foam. Composites. Part A, Applied Science and Manufacturing, 68, 313-322. http://dx.doi.org/10.1016/j.compositesa.2014.10.019.
90. Simonsen, J., Jacobson, R., & Rowell, R. (1998). Properties of styrene-maleic anhydride copolymers containing wood-based fillers. Forest Products Journal. Retrieved in 2023, May 1, from https://www.fpl.fs.usda.gov/documnts/pdf1998/simon98a.pdf
91 Cantero, G., Arbelaiz, A., Mugika, F., Valea, A., & Mondragon, I. (2003). Mechanical behavior of wood/polypropylene composites: effects of fibre treatments and ageing processes. Journal of Reinforced Plastics and Composites, 22(1), 37-50 http://dx.doi.org/10.1177/0731684403022001495.
92 Marin, D., Chiarello, L. M., Gruber, G. K., Oliveira, A. D., Reichert, A. A., Vieira, K. P., Ender, L., Wiggers, V. R., & Botton, V. (2022). Influence of the use of renewable compatibility agent Wood Plastic Composite (WPC). Journal of Research Updates in Polymer Science, 11, 25-30 http://dx.doi.org/10.6000/1929-5995.2022.11.04
93 Lei, Y., Wu, Q., Yao, F., & Xu, Y. (2007). Preparation and properties of recycled HDPE/natural fiber composites. Composites. Part A, Applied Science and Manufacturing, 38(7), 1664-1674 http://dx.doi.org/10.1016/j.compositesa.2007.02.001
Received: Dec. 21, 2022
Revised: Mar. 17, 2023
Accepted: May 01, 2023
Polímeros, 33(1), e20230012, 2023 11/11
Effects of replacing Carbon Black with Wood Fibers in wood-rubber composites
Renan Zunta Raia1* , Setsuo Iwakiri1 , Rosilani Trianoski1 , Alan Sulato de Andrade2 , Edemir Luiz Kowalski3 , Aldo Eloizo Job4 and Fábio Friol Guedes de Paiva5
1Laboratório de Painés de Madeira, Departamento de Engenharia e Tecnologia Florestal, Universidade Federal do Paraná – UFPR, Curitiba, PR, Brasil
2Laborartório de Química da Madeira, Departamento de Engenharia e Tecnologia Florestal, Universidade Federal do Paraná – UFPR, Curitiba, PR, Brasil
3Unidade de Alta Voltagem, Instituto de Tecnologia para o Desenvolvimento – LACTEC, Universidade Federal do Paraná – UFPR, Curitiba, PR, Brasil
4Departamento de Física, Química e Biologia, Faculdade de Ciência e Tecnologia, Universidade Estadual Paulista – UNESP, Presidente Prudente, SP, Brasil
5Programa de Pós-graduação em Meio Ambiente e Desenvolvimento Regional, Universidade do Oeste Paulista – UNOESTE, Presidente Prudente, SP, Brasil
*renanraia@gmail.com
Obstract
The objective of this research was to develop a more sustainable composite and still keep its characteristics. Fibers treated with NaOH at 5% w/w for 2 hours were incorporated into natural rubber in different proportions (0 phr, 24 phr, 36 phr, 48 phr and 60 phr). The mechanical properties of the composites suffered changes, increasing the hardness, young’s modulus and decreasing its tensile strength. All the physical properties were not statistically different. The coloration became less dark in the WF60/CB0 treatment, and the electrical properties presented better resistivity with the increase in the concentration of fibers in the composite. This presents a possibility of using WF for the production of wood-rubber composites for the production of rubber artifacts which do not require high rolling resistance. Based on the results from this research, we recommended the WF24/CB36 mix to produce antistatic floors.
Keywords: carbon black, composite, composite properties, natural rubber, wood fibers.
How to cite: Raia, R. Z., Iwakiri, S., Trianoski, R., Andrade, A. S., Kowalski, E. L., Job, A. E., & Paiva, F. F. G. (2023). Effects of replacing Carbon Black with Wood Fibers in wood-rubber composites. Polímeros: Ciência e Tecnologia, 33(1), e20230002.
https://doi.org/10.1590/0104-1428.20220051
1. Introduction
Composites consist of a material divided into two phases: Matrix and Reinforcement; generally, the matrix is involved by the reinforcement. The properties of composite materials are a function of the properties of the matrix and the dispersion of the dispersed phase. Composite materials can be classified according to their matrix into three types: Ceramic Matrix, Polymeric Matrix (which included the elastomers) and Metal Matrix[1-3]
In order to improve the physical-mechanical properties and reduce material costs in the manufacture of rubber composites, many particles are used by the rubber industry and this addition generally leads to a gain in mechanical properties, abrasion and tear resistance[4]
Carbon black (CB) is the common reinforcing filler used in the rubber industry. The properties of carbon black reinforced rubber composites mainly depend on its ‘structure’. CB has the capability to alter the rubber vulcanization chemistry and present both chemical and catalytic activity.
Even though CB provides good physical, mechanical, thermal and barrier properties to the rubber composites, it has some disadvantages. CB is manufactured by the incomplete combustion of heavy petroleum products[5,6]
Nowadays, there is a great environmental pressure relieving products that are more aggressive to the environment from industrial production. This is where lignocellulosic fibers come in as an alternative for the production of sustainable composites.
Cellulosic fibers are basically composed of cellulose, hemicellulose and lignin, which correspond to approximately 90% of the dry weight of these fibers, whereas the remaining 10% correspond to components such as pectins, waxes, extracts and proteins[7]
The structure of the wood fibers (WF) confers to this wood byproduct excellent mechanical properties, such as high strength in relation to its weight. This material can be obtained from wood by different techniques, such
https://doi.org/10.1590/0104-1428.20220051 O O O O O O O O O O O O O O O Polímeros, 33(1), e20230002, 2023 ISSN 1678-5169 (Online) 1/10
as chemical, mechanical, biological and many low-cost combined processes[8]
There are several papers reporting good responses to the addition of lignocellulosic fibers in the formulation of the rubber composite[6]: nanocellulose[9], different fillers[10], sugarcane bagasse[11], jute fibers[12], cereal straw. However, there are few reports about the replacement of CB by these fibers and the physical-mechanical behavior of the composite.
The objective of this research was to produce rubberwood composites and test them for physical-mechanical behavior, looking at sustainability, in order to develop anti-static floors.
2. Materials and Methods
2.1 Wood-rubber composite manufacture
The materials used is this research were: Pinus fiber, without classification about species, used in the manufacture of MDF panels provided by the company ARAUCO and Carbon Black N550 provided by the company Elastrobras. The Carbon Black N550 was used due to its classification as semi-reinforcing with high structure, provides easy and good dispersion, and can be used for calendered rubbers.
The formulation used in the preparation of NR-CB/WF vulcanizates are in Table 1. The wood fiber was dried in an oven for 24 hours at 65°C then it was used directly as filler in NR-CB/WF composites. The mixing was performed in two-roll mills with varying amounts of WF (0, 24, 36, 48 and 60 phr) and CB (0, 60, 36, 24, 12 phr). The treatment control does not have any WF and CB. The ingredients were added in the following order: zinc oxide, stearic acid, WF (treated with sodium hydroxide 15% for 2 hours), CB (when present) and 24 hours later we added MBTS, TMTD and sulfur. The sheets were vulcanized at 150°C under a pressure of 165 Kgf/cm2 in a hydraulic press. 5 sheets with 15x15 cm were made.
2.2 Wood-rubber composite characterization
The rheological properties were obtained using an oscillating disc rheometer in order to determine the t90 and the influence on torque of the replacement of CB by WF.
The mechanical physical properties were obtained according to the ASTM standard for each analysis. The cure characterization was determined by a rheometer with an oscillating disk according to the ASTM D 5289. The water absorption was obtained according to ASTM D 570. Stress-strain test was performed on an EMIC Model
DL 2000 Universal Testing Machine as per ASTM D 412. The composite hardness was measured according to ASTM D 2240 using the Shore A type durometer. The composite density was obtained by the Archimedes Method and the crosslink density as per the Flory-Renner equation[12] Abrasion tests were made using a MAQTEST rotating cylinder according to DIN 53516.
The morphological properties tested were Colorimetry, which was made using Konica Minolta CM-5 spectrophotometer in a computer with the SpectraMagic NX program. The wettability was obtained using the tensiometer OCA 25 with DDE/3 by the sessile drop method. The superficial roughness was determined using the profilometer Talysurf CCI model 2. Thermogravimetric analysis was performed on Thermogravimetric Analyzer STA 449F3 Jupiter with heating rate of 10°C/min under nitrogen atmosphere and the DSC was performed on DSC 200F3 MAIA following the temperature range (-100 to 300°C), using nitrogen as carrier gas with 30ml/min flow.
The resistivity analysis was carried out in an Agilent 4339B resistor with model 16008B resistivity cell, using a 26 mm diameter electrode with a pressure set at 5 Kgf/cm2. For each sample, 5 surface resistivity and 5 volumetric measurements were obtained. For all the treatments, a voltage was used that allowed the evaluation without the equipment being subject to error.
SEM was used to evaluate the morphological characteristics of the composites, as well as the identification of weak bonds, foreign bodies and possible non-incorporation of reinforcements. Before being submitted to image capture, the composites were metallized with gold particles by the plasma spray system for 90 seconds with a current of 30 mA
3. Results and Discussions
3.1 Rheology of wood-rubber composite
The cure characteristic of all the composite formulations is given in Table 2
The lowest torque value was found in the control treatment which also presents better fluidity. This was expected due to the absence of additives (CB and WF) in its formulation, which demands a lower torque for disc movement. The maximum torque increased following the increase in charges, as a result of the increase in existing cross-links, that is, growth in the number of linked chains and a strong link between the charges and the matrix[13]
Polímeros, 33(1), e20230002, 2023 2/10
Raia, R. Z., Iwakiri, S., Trianoski, R., Andrade, A. S., Kowalski, E. L., Job, A. E., & Paiva, F. F. G.
Components Control WF0/CB60 WF24/CB36 WF36/CB24 WF48/CB12 WF60/CB0 Rubber 100 100 100 100 100 100 Wood Fiber* 0 0 24 36 48 60 Zinc Oxide 5 5 5 5 5 5 Stearic Acid 2 2 2 2 2 2 MBTS 1.2 1.2 1.2 1.2 1.2 1.2 TMTD 0.4 0.4 0.4 0.4 0.4 0.4 Sulfur 2.5 2.5 2.5 2.5 2.5 2.5 Carbon Black 0 60 36 24 12 0 MBTS – MBTS
TMTD
Table 1. Formulation in phr for the wood-rubber composite.
– benzothiazole disulfide;
– Tetramethyl thiuram disulfide. *Pinus spp. Fiber.
Effects of replacing Carbon Black with Wood Fibers in wood-rubber composites
Analyzing the t90, it is noted that the vulcanization time is much longer in the control treatment, where there is no CB or WF. When it comes to replacing the CB with WF, there was an increase in time. This behavior suggests that carbon black acts in the vulcanization system, accelerating the formation of sulfide bonds, unlike wood fibers[14]
The increase in t90 for treatments with the use of WF occurs due to the fact that the fibrous material absorbs the vulcanizing agents and curing accelerators due to its high contact area and hydrophilic character[6,15]. One of the possibilities of having a difficulty in the process of vulcanization of rubber is the hydroxyl groups present on the surface of the fibers[15]
3.2 Physical and mechanical properties of wood-rubber composite
3.2.1 Water absorption
The water absorption results are in Table 3
A low WA through the Control and one treatment confirms the hydrophobic behavior of both natural rubber and CB[16-18]. The control showed a higher water absorption compared to the WF0/CB60 due to the absence of carbon black and fibers in its composition. In this case, carbon black reduces the empty spaces left by the rubber at the time of its vulcanization, that is, the presence of carbon black in the WF0/CB60 treatment contributed to the reduction of water absorption by the sample[19].
In treatments with substitution of CB for WF, greater water absorption was noted; this behavior presented was similar to that found by[20], who, evaluating the water absorption with different fillers, concluded that lower presence of CB influences the water absorption by composites.
Generally, the WA of a given material requires the presence of pores or some permeable channel in its microstructure in the form of open cells to create a way for water[21]. The low WA by the treatment with a greater presence of CB, is the result of the small number of pores that the microstructure of the composite presents and the high-water absorption by the treatments as there is a replacement occurs by the lignocellulosic material presenting active hydroxyl groups leading to the formation of hydrogen bridges with water particles[22,23].
3.2.2 Density
The basic density results are in Table 4
According to the results presented in Table 4, there were no statistically significant differences regarding the density of the composite. The presence of fillers in rubber composites
Mean values followed by the same letter in the column showed no statistical difference by Tukey’s test (p=>0.05). Values in parentheses correspond to the Coefficient of Variation.
Mean values followed by the same letter in the column showed no statistical difference by Tukey’s test (p=>0.05). Values in parentheses correspond to the Coefficient of Variation.
does not influence the basic density of the composite, regardless of the nature of this filler[24,25]. The basic density of a composite is directly associated with the hardness of the material, that is, as there is a greater number of additives, there is also an increase in the hardness of the material and its basic density[26]
In this work, there was no positive correlation between hardness and basic density, which is due to the characteristics intrinsic to WF. The WF are light, making the composite less dense. Following this observation, the potential of using WF as a substitute for CB facilitates handling, transportation and
Polímeros, 33(1), e20230002, 2023 3/10
Treatment t90 (min) M t90 (lb.in) MH (lb.in) ML (lb.in) CONTROL 5’ 19” 15.40 17.00 2.00 WF0/CB60 2’ 58” 37.00 40.50 3.50 WF24/CB36 2’ 55” 39.70 43.90 2.40 WF36/CB24 3’ 30” 40.40 44.60 2.60 WF48/CB12 3’ 58” 42.70 47.10 2.80 WF60/CB0 4’ 36” 40.00 44.10 2.50 Where: t90 – Cure time; M t90 –
on t90; MH
Table 2. Rheometrics parameters of NR compared to composites of NR with CB and WF.
Torque
– Maximum torque; ML – Minimum torque.
Treatment Water Absorption (%) CONTROL 2.04 b (27.75%) WF0/CB60 0.48 a (1.07%) WF24/CB36 4.00 e (10.80%) WF36/CB24 4.96 f (7.44%) WF48/CB12 6.66 g (15.43%) WF60/CB0 7.41 h (5.55%)
Table 3. Water absorption of the wood-rubber composite.
Treatment Basic Density (g/cm3) CONTROL 1.112 a (6.46%) WF0/CB60 0.991 a (2.14%) WF24/CB36 1.103 a (15.27%) WF36/CB24 1.080 a (12.87%) WF48/CB12 0.999 a (1.24%) WF60/CB0 0.998 a (0.93%)
Table 4. Basic density of wood-rubber composite.
still maintains important characteristics from the technological point of view for the flooring industry.
3.2.3 Crosslink density
The molecular transport of solvent molecules across the natural rubber matrix is a kinetic parameter that mainly depends on the free volume present in the material, the mobility of polymer chains and the size of the penetrant molecule[6]. The crosslink density results are in Table 5
There is a significant difference between the values of treatments with a high CB content compared to those presenting WF. This drop is justified by the hydrophilic character of the WF, which makes it difficult to form a chemical bond (crosslinking) with the accelerators and activators, as well as the density of cross bonds[27].
In vulcanized rubbers, swelling is directly related to the density of crosslinks that are effectively formed during the vulcanization process. These crosslinks are strong bonds between the chains and the crosslinking agent, which do not allow the complete dispersion of its molecules in toluene, thus restricting the deformation of the rubber[27]
As there is an increase in the density of crosslinks, the diffusion of this composite in the solvent will be lower, reducing the swelling caused[11]. With the addition of reinforcement in the composite formulation, there is usually a decrease in swelling, this behavior is more pronounced when using reinforcing fillers that cause a chemical bond with the crosslinking agent, than inert fillers which originate a physical bond.
The high crosslink densities can directly contribute to the mechanical characteristics of the composite[28]. There is a tendency for a positive correlation between bond density, Shore A hardness and tensile strength, which is related to the amount of bonds formed between the matrix and the fillers.
There is also a relationship between cross-links and physical properties, such as water absorption and curing parameters. There is a greater difficulty in causing deformation to the composite (increased torque), when there is a greater crosslink density and the opposite occurs for water absorption, where there is a reduction on this characteristic[13,29].
3.2.4 Hardness
The hardness of a material is related to the amount of filler connections to the activators and accelerators, in this study, carbon black and wood fibers[9]. A greater number of fillers restricts the movement of the chain, making the composite more rigid, from there the composite becomes more resistant to penetrating forces.
The hardness of the material is directly linked to the amount of reinforcing material that is placed in the
formulation, that is, the higher the phr of reinforcement used, the greater the hardness of the material, safeguarding the nature of the material[30].
According to Figure 1, there was an increase in the hardness of the material when there was an incorporation of WF in the formulation, since the amount of filler used was greater, that is, in the WF0/CB60 treatment the result is lower due to the amount of filler in the formulation being smaller than in the other treatments, in volume of material. When we observe WF60/CB0, we notice a slight decrease in the hardness of the material, compared to the other treatments, this is due to the WF being softer and less hard[31].
Based on rubber classification as to hardness, the control is classified as soft rubber, due the lack of fillers and the others as hard rubber. The rubber flooring companies related that the Shore A hardness of the materials vary from 60 to 85, depending on the application. However[30], reports that products with Shore A hardness ranging from 70 to 90 can be used for engineering rubber parts.
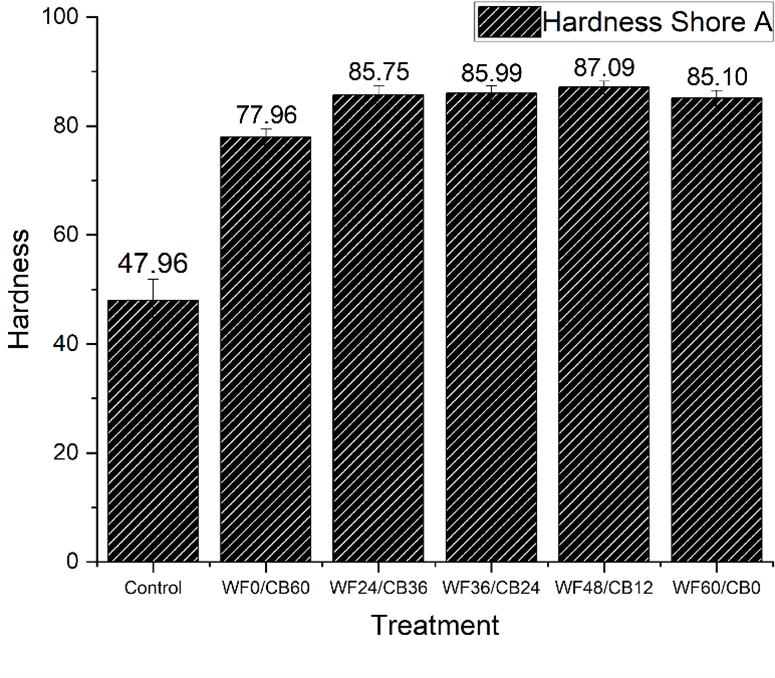
The WF80/CB0 stands out, presenting hardness within the standards for rubber sold as flooring material. The research demonstrated the efficiency of replacing CB with WF, making the material more sustainable, replacing a non-organic material by an organic one, and yet maintaining the characteristics required by the industry.
3.2.5 Tensile properties
The tensile properties results are in Table 6.
Due to increase in WF, the composite becomes more rigid and a tendency to decrease the maximum strength and deformation that the material can withstand until rupture is noticed. Due to this increase in hardness, the material breaks with less deformation, a characteristic present in composites of hybrid loads[32]. This result corroborates the Shore A hardness result (Figure 1), which tends to increase hardness with increasing loads.
The behavior of increasing tensile strength with the incorporation of CB in the composition (control for WF0/ CB60) and the subsequent reduction in other treatments was
Polímeros, 33(1), e20230002, 2023 4/10
Raia, R. Z., Iwakiri, S., Trianoski, R., Andrade, A. S., Kowalski, E. L., Job, A. E., & Paiva, F. F. G.
Figure 1. Hardness of wood-rubber composite.
Treatment Crosslink Density (mol/cm3) CONTROL 6.66E-04 WF0/CB60 1.28E-03 WF24/CB36 6.04E-04 WF36/CB24 4.69E-04 WF48/CB12 6.21E-04 WF60/CB0 5.50E-04
Table 5. Crosslink density of wood-rubber composite.
Effects of replacing Carbon Black with Wood Fibers in wood-rubber composites
Mean values followed by the same letter in the column showed no statistical difference by Tukey’s test (p=>0.05). Values in parentheses correspond to the Coefficient of Variation.
observed by[32,33] in their pure PALF, carbon black + PALF and carbon black + silica composites, respectively.
According to the authors, there are two reasons for the occurrence of this behavior: one is that the leveling stress of rubber with CB is lower than rubber without CB or with addition of WF. Also, the hybrid composites with CB present a good recovery rate when exposed to high stress levels.
For the Young modulus, a behavior that is inversely proportional to the tensile strength is noted, so it can be said that to exert a certain deformation, a greater effort is required to deform the rubber-WF composite as the charges increase.
In the treatments WF36/CB24, WF48/CB12 and WF60/CB0 there were no statistical differences among them, which coincides with the greatest replacements, proving that the less elastic the material, the greater its hardness and the greater the effort for the same degree of deformation of the composite[1]
This statistical similarity among treatments further highlights the advantage of using WF60/CB0 for flooring production, as Young’s modulus was statistically similar to the other treatments mentioned above even with Shore A hardness and lower maximum tensile strength.

3.2.6 Abrasion
The mass loss results are in Figure 2
Figure 2 shows the increase in mass loss through abrasion in treatments where there was addition of wood fibers, with the best result in treatment Control and WF0/CB60. The increase in mass loss with the addition of wood fiber was associated with the possible creation of aggregates, due to the difficulty of dispersing wood fibers in the rubber matrix, causing the decrease in abrasion resistance. One possible cause of this negative effect on this addition can be the natural fiber size used[6]
Another factor that can be considered to explain this increase is the acid character of the wood fiber. This causes a reduction in the action of accelerating and vulcanizing agents, which have a basic character, causing a reduction in the cross-link, that is, the fibers have a low compatibility
with the matrix causing less interaction in these treatments, thus recording the resistance to abrasion [1,34]. In the WF0/CB60 treatment, there was a small decrease in mass loss by abrasion, which can be explained by the ease with which the CB disperses in the rubber matrix.
Even with the results for treatment with the addition of fibers as reinforcement being greater than the Control, it is noted that the WF24/CB36 treatment obtained results lower than 250mm3, which is the requirement for the production of rubber floors[27].
3.3 Morphological properties of wood-rubber composite
3.3.1 Differential scanning calorimetry of wood-rubber composite
DSC analysis was performed with the objective of verifying the phase transitions of the composite. The glass transition temperature (Tg) provides information on how the mobility of the chain can be changed with the addition of cellulosic elements or demonstrates the change in the matrix/load interaction[34].
Tg is the temperature at which the material changes phase, leaving the glassy (more rigid) state to a rubberier (elastomeric) state. Below this temperature there is little movement of the molecules (freezing of the chain segments) and above that temperature there is an increase in the amplitude of this vibration[35]. With Tg ranging from -60.7 to -61.8°C (Table 7) it is compatible with that found in the literature for poly-cis-isoprene (natural rubber) naturally used or in composites.
The Tg of the treatments that use WF presented a slight decrease when compared to the Control, which may be attributed to the higher molecular weight and a smoother molecular chain of the composites[36]. The same authors report that this result can be attributed to the wrapping that rubber makes on different fillers, which can be proven in the density of cross-links and may influence the mechanical results of composites. This small difference between treatments is related to the properties inherent to the equipment, which can make this technique without enough sensitivity to detect Tg changes in this type of material[37].
3.3.2 Colorimetry
Rubber floors usually come in dark colors due to the environment where they are normally used in. The colorimetric evaluation is necessary to detect, even if not visually noticeable,
Polímeros, 33(1), e20230002, 2023 5/10
Treatment Tensile Strength (MPa) Elongation to break (%) Young Modulus (MPa) CONTROL 14.15 b 1772.09 ± 97.34 2.04 d (10.67%) (14.96%) WF0/CB60 20.29 a 575.54 ± 25.83 3.93 cd (7.66%) (4.48%) WF24/CB36 8.33 de 445.04 ± 11.43 7.63 bc (5.14%) (25.96%) WF36/CB24 7.13 e 496.75 ± 30.17 8.63 abc (5.98%) (28.25%) WF48/CB12 4.19 f 407.45 ± 81.25 13.62 a (10.21%) (34.55%) WF60/CB0 3.01 f 406.53 ± 83.91 10.03 ab (10.92%) (11.33%)
Table 6. Tensile properties of wood-rubber composite.
Figure 2. Abrasion loss of wood-rubber composite.
the color difference between the formulations in this study. The results of the colorimetric parameters are in Table 8
The luminosity (L*) is the tendency of a material to present a shade closer to white (+) or closer to black (-). However, some factors may interfere in this parameter, where the materials roughness stands out[38]. The correlation between surface roughness and material color change is responsible for explaining the increase in the value of L* in treatment WF0/CB60, even though it has a lighter shade than the Control treatment, but for presenting a greater roughness according to Table 9, it also presented a higher superficial brightness due to the incidence of light in the grooves which reflect more intensely.
Evaluating the parameter, a* (red-green axis coordinate), the addition of the CB modified the color of the composite, making its color greener than the Control treatment. Unlike the total addition of WF (WF60CB0), which also changed the color, but giving a more reddish hue to the composite.
Different results were found to those presented in this research, where the increase in the charge of carbon nanotubes modified the color of the material making it more reddish; however, as the authors used CaCO3 as a charge, this may have influenced the change in relation to CB used along to wood fibers in this research[39]
For parameter b* (blue-yellow axis coordinate), the Control and WF60/CB0 presented positive values, that is, they presented a more yellowish color. The other treatments, which used CB, presented negative values, giving a characteristic closer to blue. The addition of carbon nanotubes caused the b* coordinate to show lower values, which is compatible with that found in this work for CB, due to the dark coloration of CB and carbon nanotubes, these two factors contribute to the darker color of the composite[39]
3.3.3 SEM Images
The Micrographies of the rubber-wood composites from the treatments Control, WF0/CB60, WF24/CB36 and WF60/CB0 are shown in Figure 3
The presence of sulfur can be noted on the surface of the composite (Figure 3A-3B), which can be characterized by the poor distribution of this reinforcement at the time of addition of this element in the mixing process. The presence of voids can be attributed to the bad formation of the rubber mass at the time of pressing, resulting in air bubbles.
In addition, the adhesion between wood and rubber fibers was weak, so it is possible to identify the presence of voids between the fibers and the matrix. This fact is undesirable, but predictable due to the difference between the nature of the fibers (hydrophilic) and rubber (hydrophobic) which causes this non-compatibility between reinforcement and matrix. Due to these facts, it can be said that the fiber treatment did not have the desired effect on the interfacial bond between wood fibers and rubber.
Another important factor worth highlighting is the surface roughness that can be seen in Figure 3A-3D, when there is an increase in the amount of wood fibers in proportion to the carbon black. In this situation, the surface area becomes less smooth, that is, there is the formation of agglomerates of fibers on the surface or even under the rubber.
Analyzing the SEM images, it is possible to clearly explain the high abrasion losses when there is the presence of a large amount of wood fibers in relation to carbon black. That happens as the agglomerates formed are pulled out with the effort of the grinding wheel, thus decreasing the mass in a much more substantial amount than when the agglomerates are not present.
3.4 Electrical properties of wood-rubber composite
According to Table 10, it is noted that there was a decrease in surface and volumetric resistivity with the addition of carbon black and then there was an increase when CB was replaced by wood fiber. The most significant increase was in the treatment where there is no presence of carbon black.
Where: Ra – Medium roughness; Rq – Quadratic roughness; Rz – Total roughness. Mean values followed by the same letter in the column showed no statistical difference by Tukey’s test (p=>0.05). Values in parentheses correspond to the Coefficient of Variation.
We can classify the treatments Control, WF36/CB24, WF48/CB12 and WF60/CB0 as insulating composites, because they present resistivity in magnitude greater than 108. The other treatments are considered antistatic
Polímeros, 33(1), e20230002, 2023 6/10
Raia, R. Z., Iwakiri, S., Trianoski, R., Andrade, A. S., Kowalski, E. L., Job, A. E., & Paiva, F. F. G.
Treatment Glass Transition Temperature (°C) CONTROL -60.7 WF0/CB60 -60.8 WF24/CB36 -61.4 WF36/CB24 -61.3 WF48/CB12 -61.8 WF60/CB0 -61.8
Table 7. Glass transition temperature of wood-rubber composite.
Treatment L a* b* CONTROL 22.72 0.43 0.97 WF0/CB60 24.65 -0.29 -1.99 WF24/CB36 22.09 -0.24 -1.08 WF36/CB24 23.53 -0.25 -1.27 WF48/CB12 22.92 -0.14 -0.53 WF60/CB0 23.82 2.64 3.46 Legend: L – Luminosity; a* - Green – red axis; b* - Blue – yellow axis.
Table 8. Colorimetric parameters and total roughness of woodrubber composite.
Treatment Ra Rq Rz CONTROL 0.2165 a 0.2667 a 1.2951 a (24.76%) (26.22%) (28.08%) WF0/CB60 0.2883 a 0.3561 a 1.3153 a (52.07%) (53.30%) (25.79%) WF24/CB36 0.2600 a 0.3261 a 1.1000 a (65.17%) (77.71%) (66.57%) WF36/CB24 0.2864 a 0.2840 a 1.1397 a (63.85%) (40.04%) (34.96%) WF48/CB12 0.2717 a 0.3341 a 1.2449 a (44.70%) (50.29%) (38.31%) WF60/CB0 0.2685 a 0.2693 a 1.1814 a (70.50%) (24.19%) (28.39%)
Table 9. Superficial roughness parameters of wood-rubber composite.
Effects of replacing Carbon Black with Wood Fibers in wood-rubber composites
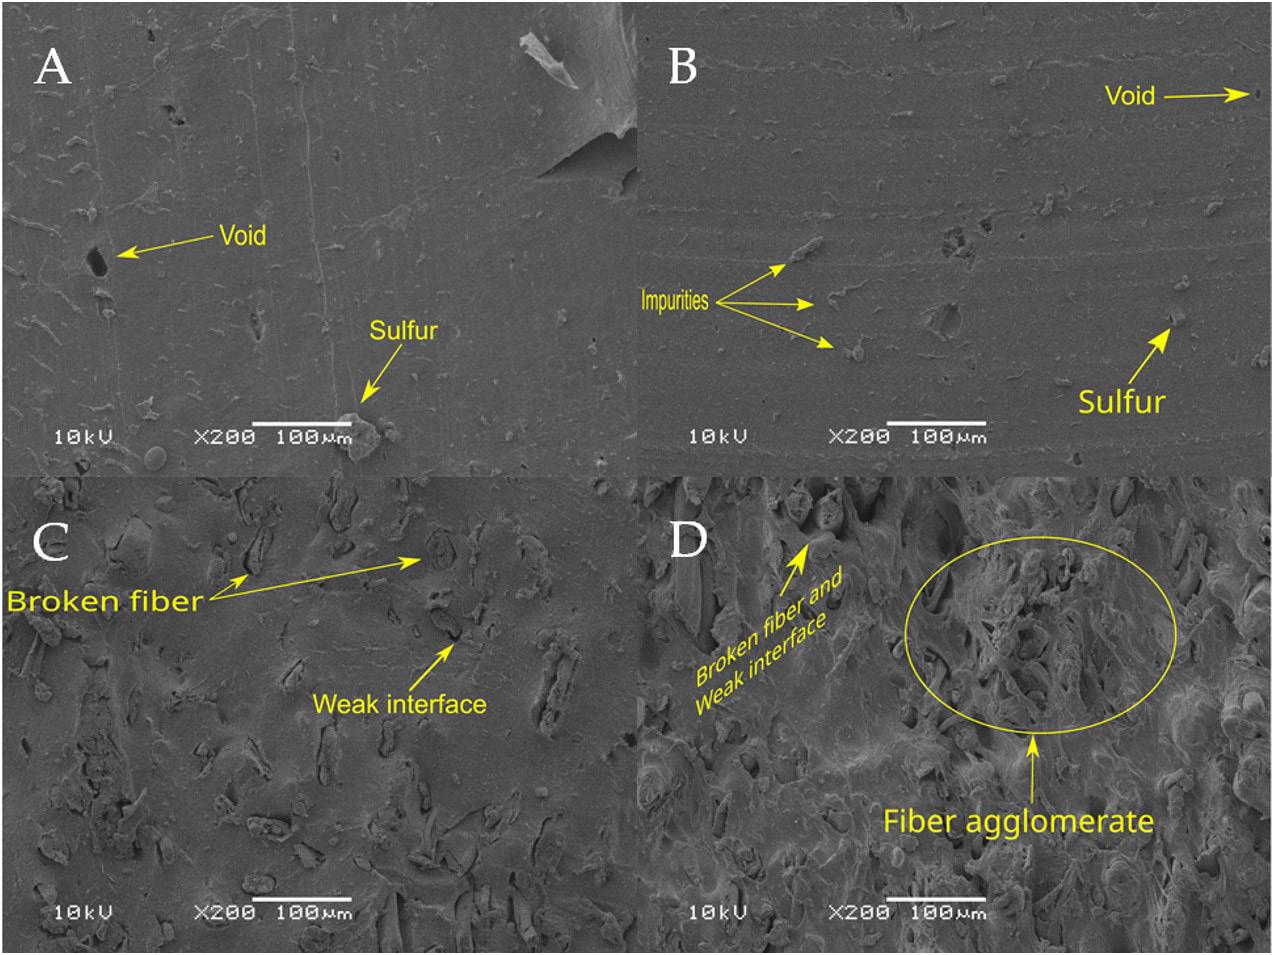
or semiconductors because they have resistivity in the magnitude range between 104 to 108 [38,40] .
The resistivity of a material can be influenced by some factors, such as: acid doping, matrix conductivity, material thickness, polymerization method and synthesis of both the reinforcement and the matrix and the dispersion form of the reinforcement[41,42]
Other studies report that the temperature influences the resistivity of the material, as well as the moisture of the reinforcement[19,43,44]
Note that as wood fibers are added, which have a resistivity of 1010 Ω, there is an increase in the surface and volumetric resistivity of the composite, which can be attributed to the effect of the insulating capacity of dry wood, which has resistivity at around 1010 Ω and even when it reaches the fiber saturation point (PSF) it presents values of 107 Ω, contributing to the insulating capacity of the material.
Another point to be observed is that the interfaces of the materials inserted in the composite have different electrical conductivities and therefore, the electrical charges that are inserted in the material with friction and walking can become trapped in these interfaces (traps), thus being able to store or not the electrons.
What can be noted is that this insulating capacity is gradual, that is, it grows with the amount of fiber inserted, and it can be seen that the FM24/NF36 formulation is what, according to the standard, can be classified as antistatic because it presents results of resistivity in the magnitude of 106 Ω, that is, this formulation that mixes wood fibers and carbon black has the best potential for use in antistatic floors.
4. Conclusions
For the physical tests, there was no statistical difference for the basic density, however, as the addition of a fiber makes the composite less hydrophobic, there was an increase in water absorption. For the swelling test, there was a decrease in the
Polímeros, 33(1), e20230002, 2023 7/10
Figure 3. Micrographies of rubber-wood composites. A: Control; B: WF0/CB60; C: WF24/CB36 and D: WF60/CB0.
Treatment Superficial Resistivity (Ω) Volumetric Resistivity (Ω.cm) CONTROL 3.1777E+13 7.533E+14 (2.07) (0.29) WF0/CB60 3.5100E+05 6.2287E+05 (0.52) (1.09) WF24/CB36 1.7333E+06 5.4908E+06 (0.43) (0.62) WF36/CB24 4.3873E+09 2.7454E+11 (0.73) (0.55) WF48/CB12 2.4850E+12 1.7681E+12 (0.24) (0.21) WF60/CB0 4.1109E+12 2.0500E+12 (0.58) (0.15) Values in parentheses correspond to the Coefficient of Variation.
Table 10. Compared Superficial and volumetric resistivity for the composites of NR with CB and WF.
swelling rate in treatments where there was a substitution of CB for WF. For mechanical tests, the hardness increased at a considerable rate with the addition of WF as a filler, with the treatment WF48/CB12 being the one with the greatest hardness. The tensile strengths were reduced in the treatments with the use of WF in the formulation, which is caused by the increase in hardness causing a faster rupture in the composite. The abrasion resistance was the lowest for the WF60/ CB0 treatment, as the difficulty in mixing may have caused agglomerates that may have caused greater abrasion on the composite surface. For technological analysis, there was no difference in the glass transition (Tg) value, the values being all close to -60°C which is compatible with rubber. This means that WF did not cause a structural change in natural rubber. The color changed in the WF60/CB0 treatment, making the composite lighter. The resistivity of the composite increased with the substitution of CB for WF, proving the possibility of using the wood rubber composite in high electric charge situations. Therefore, the synergistic use of CB and WF is an advance in the search for a more sustainable production for rubber floors that are not exposed to a high abrasion load, concluding that there is a technical viability in the use of WF as a replacement of CB.
5. Author’s Contribution
● Conceptualization – Renan Zunta Raia.
● Data curation – Renan Zunta Raia; Setsuo Iwakiri; Rosilani Trianoski; Alan Sulato de Andrade; Edemir Luiz Kowalski; Aldo Eloizo Job; Fábio Friol Guedes de Paiva.
● Formal analysis – Renan Zunta Raia.
● Funding acquisitions – NA.
● Investigation – Renan Zunta Raia.
● Methodology – Renan Zunta Raia.
● Project administration – NA.
● Resources – Coordenação de Aperfeiçoamento de Pessoal de Nível Superior.
● Software – NA.
● Supervision – Setsuo Iwakiri; Rosilani Trianoski; Alan Sulato de Andrade; Edemir Luiz Kowalski.
● Validation – NA.
● Visualization – NA.
● Writing – original draft – Renan Zunta Raia.
● Writing – review & editing – Setsuo Iwakiri; Rosilani Trianoski; Alan Sulato de Andrade; Edemir Luiz Kowalski.
6. Acknowledgements
The authors would like to thank Coordenação de Aperfeiçoamento de Pessoal de Nível Superior for funding the research, as well as the Polytechnic Center of the Federal University of Paraná and the Paulista State University.
7. References
1 Callister, W. D. Jr, & Rethwisch, D. R. (2015). Fundamentals of materials science and engineering. USA: Wiley
2 Ibrahim, I. D., Jamiru, T., Sadiku, R. E., Kupolati, W. K., Agwuncha, S. C., & Ekundayo, G. (2015). The use of polypropylene in bamboo fibre composites and their mechanical properties - A review. Journal of Reinforced Plastics and Composites, 34(16), 1347-1356 http://dx.doi.org/10.1177/0731684415591302
3 Yang, Y., Boom, R., Irion, B., van Heerden, D.-J., Kuiper, P., & de Wit, H. (2012). Recycling of composite materials. Chemical Engineering and Processing, 51, 53-68 http://dx.doi. org/10.1016/j.cep.2011.09.007
4 Bokobza, L. (2004). The reinforcement of elastomeric networks by fillers. Macromolecular Materials and Engineering, 289(7), 607-621 http://dx.doi.org/10.1002/mame.200400034
5 Lee, A. K. Y., Chen, C.-L., Liu, J., Price, D. J., Betha, R., Russell, L. M., Zhang, X., & Cappa, C. D. (2017). Formation of secondary organic aerosol coating on black carbon particles near vehicular emissions. Atmospheric Chemistry and Physics, 17(24), 15055-15067 http://dx.doi.org/10.5194/acp-17-150552017
6 Dominic, M., Joseph, R., Sabura Begum, P. M., Kanoth, B. P., Chandra, J., & Thomas, S. (2020). Green tire technology: effect of rice husk derived nanocellulose (RHNC) in replacing carbon black (CB) in natural rubber (NR) compounding. Carbohydrate Polymers, 230, 115620 http://dx.doi.org/10.1016/j. carbpol.2019.115620. PMid:31887961.
7 Jawaid, M., Sapuan, S. M., & Alothman, O. Y., editors (2017). Green biocomposites: manufacturing and properties Switzerland: Springer
8 Hodzic, A., & Shanks, R., editors (2014). Natural fibre composites: materials, processes and properties UK: Woodhead Publishing
9 Khongwong, W., Keawprak, N., Somwongsa, P., Tattaporn, D., & Ngernchuklin, P. (2019). Effect of alternative fillers on the properties of rubber compounds. Key Engineering Materials, 758, 316-321 http://dx.doi.org/10.4028/www.scientific.net/ KEM.798.316
10 Paiva, F. F. G., Maria, V. P. K., Torres, G. B., Dognani, G., Santos, R. J., Cabrera, F. C., & Job, A. E. (2019). Sugarcane bagasse fiber as semi-reinforcement filler in natural rubber composite sandals. Journal of Material Cycles and Waste Management, 21(2), 326-335 http://dx.doi.org/10.1007/ s10163-018-0801-y
11. Correia, C. A., & Valera, T. S. (2019). Cellulose nanocrystals and jute fiber-reinforced natural rubber composites: cure characteristics and mechanical properties. Materials Research, 22(suppl. 1), e20190192 http://dx.doi.org/10.1590/1980-5373mr-2019-0192
12 Flory, P. J., & Rehner, J., Jr. (1943). Statistical mechanics of crosslinked polymer networks II. Swelling. The Journal of Chemical Physics, 11(11), 521-526 http://dx.doi.org/10.1063/1.1723792
13. Nor, N. A. M., & Othman, N. (2016). Effect of filler loading on curing characteristic and tensile properties of palygorskite natural rubber nanocomposites. Procedia Chemistry, 19, 351358 http://dx.doi.org/10.1016/j.proche.2016.03.023
14 Pinto, P. R., Nascimento, Z. C., & Sirqueira, A. S. (2019). Misturas elastoméricas de sbr/borracha nitrílica carboxilada compatibilizadas com poliacroleína. The Journal of Engineering and Exact Sciences, 5(1), 0037-0042 http://dx.doi.org/10.18540/ jcecvl5iss1pp0037-0042
15. Wang, J., & Chen, D. (2013). Mechanical properties of natural rubber nanocomposites filled with thermally treated attapulgite. Journal of Nanomaterials, 496584, 1-11 http:// dx.doi.org/10.1155/2013/496584
16 Cottet, L., Baldissarelli, V. Z., Benetoli, L. O. B., & Debacher, N. A. (2014). Hydrogen and carbon black production from the degradation of methane by thermal plasma. Semina.
Polímeros, 33(1), e20230002, 2023 8/10
Raia, R. Z., Iwakiri, S., Trianoski, R., Andrade, A. S., Kowalski, E. L., Job, A. E., & Paiva, F. F. G.
Effects of replacing Carbon Black with Wood Fibers in wood-rubber composites
Ciências Exatas e Tecnológicas, 35(1), 103-114 http://dx.doi. org/10.5433/1679-0375.2014v35n1p103
17 González, N., Custal, M. D. A., Lalaouna, S., Riba, J.-R., & Armelin, E. (2016). Improvement of dielectric properties of natural rubber by adding perovskite nanoparticles. European Polymer Journal, 75, 210-222. http://dx.doi.org/10.1016/j. eurpolymj.2015.12.023.
18 Chaowamalee, S., & Ngamcharussrivichai, C. (2019). Facile fabrication of mesostructured natural rubber/silica nanocomposites with enhanced thermal stability and hydrophobicity. Nanoscale Research Letters, 14(1), 382 http://dx.doi.org/10.1186/s11671019-3197-2 PMid:31848825.
19 Oboh, J. O., Okafor, J. O., Kovo, A. S., & Abdulrahman, A. S. (2019). Thermal and water absorption characteristics of rubber composites reinforced with different plant biomass. Journal of Science Technology and Education, 7(4), 172-179
20 Garing, C. L., & Pajarito, B. B. (2020). Effect of clay loading on the water resistance of ternary-filled natural rubber composites. Materials Today: Proceedings, 33(Pt 4), 1959-1962. http:// dx.doi.org/10.1016/j.matpr.2020.06.076.
21 Abraham, E., Thomas, M. S., John, C., Pothen, L. A., Shoseyov, O., & Thomas, S. (2013). Green nanocomposites of natural rubber/ nanocellulose: membrane transport, rheological and thermal degradation characterizations. Industrial Crops and Products, 51, 415-424 http://dx.doi.org/10.1016/j.indcrop.2013.09.022
22 Kuburi, L. S., Dauda, M., Obada, D. O., Umaru, S., DodooArhin, D., Iliyasu, I., Balogun, M. B., & Mustapha, S. (2017). Effects of coir fibber loading on the physio-mechanical and morphological properties of coconut shell powder filled low density polyethylene composites. Procedia Manufacturing, 7, 138-144 http://dx.doi.org/10.1016/j.promfg.2016.12.036
23. Trakuldee, J., & Boonkerd, K. (2017). Effect of filler water absorption on water swelling properties of natural rubber. IOP Conference Series. Materials Science and Engineering, 223, 012007 http://dx.doi.org/10.1088/1757-899X/223/1/012007
24 Che, W. M., Teh, P. L., Yeoh, C. K., & Jalilah, A. J. (2019). The effect of graphene loading on natural rubber latex/graphene stretchable conductive material. IOP Conference Series. Materials Science and Engineering, 670(1), 012041 http:// dx.doi.org/10.1088/1757-899X/670/1/012041
25 Sawangpet, K., Walong, A., Thongnuanchan, B., Kaesaman, A., Sakai, T., & Lopattananon, N. (2020). Foaming and physical properties, flame retardancy, and combustibility of polyethylene octene foams modified by natural rubber and expandable graphite. Journal of Vinyl and Additive Technology, 26(4), 423-433. http://dx.doi.org/10.1002/vnl.21757.
26 Ekwueme, C. C., Igwe, I. O., & Vivian, A. O. (2019). End-use properties of pineapple leaf fibre filled natural Rubber. Journal of Minerals & Materials Characterization & Engineering, 7(6), 435-445 http://dx.doi.org/10.4236/jmmce.2019.76030
27 Ruiz, M. R., Cabreira, P. L. S., Budemberg, E. R., Reis, E. A. P., Bellucci, F. S., & Job, A. E. (2016). Chemical evaluation of composites natural rubber/carbon black/leather tannery projected to antistatic flooring. Journal of Applied Polymer Science, 133(27), 43618 http://dx.doi.org/10.1002/app.43618
28. Masłowski, M., Miedzianowska, J., & Strzelec, K. (2019). Silanized cereal straw as a novel, functional filler of natural rubber biocomposites. Cellulose (London, England), 26(2), 1025-1040 http://dx.doi.org/10.1007/s10570-018-2093-8
29 Al-Nesrawy, S. H., Al-Maamori, M., & Jappor, H. R. (2016). Effect of temperature on rheological properties of sbr compounds reinforced by some industrial scraps as a filler. International Journal of Chemical Science, 14(3), 1285-1295. Retrieved in 2022, September 19, from https://www.tsijournals.com/ articles/effect-of-temperature-on-rheological-properties-of-sbr-
compounds-reinforced-by-some-industrial-scraps-as-a-filler. pdf
30 Rao, S., Devi, S. N. S., Johns, A., Kalkornsurapranee, E., Sham Aan, M. P., & Johns, J. (2016). Mechanical and thermal properties of carbon black reinforced natural rubber/polyvinyl alcohol fully-interpenetrating polymer networks. Journal of Vinyl and Additive Technology, 24(S1), E21-E29 http://dx.doi. org/10.1002/vnl.21560
31 Yu, P., He, H., Jia, J., Tian, S., Chen, J., Jia, D., & Luo, Y. (2016). A comprehensive study on lignin as a green alternative of silica in natural rubber composites. Polymer Testing, 54, 176-185 http://dx.doi.org/10.1016/j.polymertesting.2016.07.014
32. Prukkaewkanjana, K., Thanawan, S., & Amornsakchai, T. (2015). High performance hybrid reinforcement of nitrile rubber using short pineapple leaf fiber and carbon black. Polymer Testing, 45, 76-82 http://dx.doi.org/10.1016/j. polymertesting.2015.05.004.
33 Wisittanawat, U., Thanawan, S., & Amornsakchai, T. (2014). Remarkable improvement of failure strain of preferentially aligned short pineapple leaf fiber reinforced nitrile rubber composites with silica hybridization. Polymer Testing, 38, 91-99 http://dx.doi.org/10.1016/j.polymertesting.2014.07.006
34 Mariano, M., El Kissi, N., & Dufresne, A. (2016). Cellulose nanocrystal reinforced oxidized natural rubber nanocomposites. Carbohydrate Polymers, 137, 174-183 http://dx.doi.org/10.1016/j. carbpol.2015.10.027 PMid:26686118.
35 Dall’Antonia, A. C., Martins, M. A., Moreno, R. M. B., Mattoso, L. H. C., Gonçalves, P. S., & Job, A. E. (2006). Caracterização mecânica e térmica da borracha natural formulada e vulcanizada dos clones: GT 1, IAN 873, PB 235 e RRIM 600. Polímeros: Ciência e Tecnologia, 19(1), 63-71 https://doi.org/10.1590/ S0104-14282009000100015
36 Li, K., You, J., Liu, Y., Zhu, K., Xue, C., Guo, X., Wang, Z., & Zhang, Y. (2020). Functionalized starch as a novel eco-friendly vulcanization accelerator enhancing mechanical properties of natural rubber. Carbohydrate Polymers, 231, 115705 http:// dx.doi.org/10.1016/j.carbpol.2019.115705 PMid:31888836.
37 Oliveira, F. A., Alves, N., Giacometti, J. A., Constantino, C. J. L., Mattoso, L. H., Balan, A. M. O. A., & Job, A. E. (2007). Study of the thermomechanical and electrical properties of conducting composites containing natural rubber and carbon black. Journal of Applied Polymer Science, 106(2), 1001-1006 http://dx.doi.org/10.1002/app.26689
38 Dognani, G. (2016). Eletrofiação de fibras de borracha natural com adição de polianilina (Dissertação de mestrado). Universidade Estadual Paulista, Presidente Prudente.
39 Su, J., & Li, C. H. (2017). Preparation and properties of ethylene propylene diene rubber/SiO2/carbon nanotubes composites. Advanced Materials Research, 1142, 201-205 http://dx.doi. org/10.4028/www.scientific.net/AMR.1142.201
40 Job, A. E., Herrmann, P. S. P. Jr., Vaz, D. O., & Mattoso, L. H. C. (2001). Comparison between different conditions of the chemical polymerization of polyaniline on top of PET films. Journal of Applied Polymer Science, 79(7), 1220-1229 http:// dx.doi.org/10.1002/1097-4628(20010214)79:7<1220::AIDAPP90>3.0.CO;2-3
41 Yoo, J. E., Cross, J. L., Bucholz, T. L., Lee, K. S., Espe, M. P., & Loo, Y.-L. (2007). Improving the electrical conductivity of polymer acid-doped polyaniline by controlling the template molecular weight. Journal of Materials Chemistry, 17(13), 1268-1275 http://dx.doi.org/10.1039/b618521e
42 Cena, C. R., Malmonge, L. F., & Malmonge, J. A. (2016). Layer-by-layer thin films of polyaniline alternated with natural rubber and their potential application as a chemical sensor. Journal of Polymer Research, 24(1), 9 http://dx.doi. org/10.1007/s10965-016-1170-7
Polímeros, 33(1), e20230002, 2023 9/10
Raia, R. Z., Iwakiri, S., Trianoski, R., Andrade, A. S., Kowalski, E. L., Job, A. E., & Paiva, F. F. G.
43 Malmonge , L. F. , Langiano , S. C. , Cordeiro , J. M. M. , Mattoso, L. H. C., & Malmonge, J. A. (2010). Thermal and mechanical properties of PVDF/PANI blends. Materials Research, 13(4), 465-470 http://dx.doi.org/10.1590/S151614392010000400007
44 Vieira-Junior, W.-F., Vieira, I., Ambrosano, G.-M.-B., Aguiar, F.-H.-B., & Lima, D.-A.-N.-L. (2018). Correlation between
alteration of enamel roughness and tooth color. Journal of Clinical and Experimental Dentistry, 10(8), e815-e820 http:// dx.doi.org/10.4317/jced.54881. PMid:30305882.
Received: Sept. 19, 2022
Revised: Jan. 30, 2023
Accepted: Feb. 14, 2023
Polímeros, 33(1), e20230002, 2023 10/10
Optimization of the ultrasonic treatment for Tara gum using response surface methodology
Barbara da Silva Soares1 , Carlos Wanderlei Piler de Carvalho2 , Edwin Elard Garcia-Rojas1,3*
1Programa de Pós-graduação em Ciência e Tecnologia de Alimentos – PPGCTA, Universidade Federal Rural de Rio de Janeiro – UFRRJ, Seropédica, RJ, Brasil 2Laboratório de Análises Físicas de Alimentos, Embrapa Agroindústria de Alimentos, Guaratiba, RJ, Brasil 3Departamento de Engenharia de Agronegócios – VEA, Universidade Federal Fluminense – UFF, Volta Redonda, RJ, Brasil *edwinr@id.uff.br
Obstract
High-intensity ultrasound irradiation proved to be an effective method for modifying tara gum by generating low molecular weight products and better water solubility. The objectives of this research were to optimize the parameters for the high-intensity ultrasonic treatment with response surface methodology and improve the tara gum solubility. The results demonstrated that after the ultrasound treatment, the solubility of the tara gum had increased (17.7%) as a result of the reduced intrinsic viscosity (70%). The molecular weight of the untreated tara gum was 1.89 x 10⁶ Da, and after ultrasound treatment, it was reduced to 0.47 x 10⁶ Da. Rheological analyses confirmed the reduction in molecular weight for the modified and optimized tara gum and the resulting increase in solubility. This knowledge provides a better understanding of ultrasound treatment technology and increases the scope for use of tara gum in the food industry.
Keywords: depolymerization, galactomannan, solubility, sonication, viscosity.
How to cite: Soares, B. S., Carvalho, C. W. P., & Garcia-Rojas, E. E. (2023). Optimization of the ultrasonic treatment for Tara gum using response surface methodology. Polímeros: Ciência e Tecnologia, 33(1), e20230003. https://doi. org/10.1590/0104-1428.20220090
1. Introduction
Tara gum (TG), also called Peruvian carob, is a polymer obtained by grinding the endosperm of Caesalpinia spinosa tree seeds. Peru is the largest producer of TG, with approximately 80% of the total cultivation. TG is a galactomannan with functionality and structure similar to those of guar and carob gums; however, the mannose/galactose ratios differ, and they are 3/1 for TG, 2/1 for guar gum and 4/1 for carob gum[1]. Due to its similar functional properties, TG has been considered an important alternative with which to relieve the short supply of the two common galactomannan sources (guar gum and carob gum)[2], and it exhibits other advantages, such as easy availability, nontoxicity, biocompatibility and biodegradability[2]. Galactomannans are neutral hydrophilic polysaccharides with approximate molecular weights (Mw) of 1.0 × 10⁶ g·mol−1, and they contain a linear chain of (1-4)-β-D-mannopyranoses linked to α-D-galactopyranosyl units via (1-6) glycosidic bonds[3]. The galactomannan from TG has a high molecular weight, and like other polysaccharides, its chemical structure, monosaccharide composition, bonding modes and branched structures can compromise the biological activities of the polysaccharide[4]. Various studies have reported that high molecular weight polysaccharides exhibit high viscosity and low solubility in water, which could reduce their biological activity and possibly limit application of the polysaccharides[4-6]. Aqueous
TG solutions are neutral and highly viscous[6]. To dissolve TG completely, heating is necessary, which can be considered a disadvantage in economic and practical terms.
In this context, high-intensity ultrasound (HIUS) with frequencies between 20-100 kHz and intensities above 1 W/ cm2 proved to be effective in depolymerization and generation of products exhibiting low molecular weight and better solubility in water[7,8], and it is a green technology; it does not require or produce unwanted chemical products (that is, it does not produce substances that could contaminate the final product), which allows broader application in the pharmaceutical, cosmetic and the food industries. HIUS is widely used to improve the functionality and change the structures of proteins[9], as in the ultrasound-assisted extraction of new galactomannans and polysaccharides[10] and in modification of various galactomannans and polysaccharides, including pectin[11,12], sodium alginate[13], konjac glucomannan[6] and TG recently studied in our laboratory[14]. Thus, the use of a simple sonication method for reducing and increasing the solubilities of polysaccharides represents an important adaptation of the mechanical properties of TG solutions, enabling more adequate and rational uses of the polysaccharides in various fields. However, these previous studies have only superficially addressed the effects of ultrasound, and the ultrasonic parameters have not been optimized. Furthermore,
https://doi.org/10.1590/0104-1428.20220090 O O O O O O O O O O O O O O O Polímeros, 33(1), e20230003, 2023 ISSN 1678-5169 (Online) 1/9
the effects of HIUS on galactomannans, especially those in tara gum, have been sparsely reported.
In this study, the parameters such as time, amplitude and concentration were optimized by means of response surface methodology after treatment of aqueous solutions of TG with HIUS, and the effects of HIUS on the physicochemical and rheological properties of the TG were evaluated.
2. Materials and Methods
2.1 Materials
Tara gum (TG, purity ≥ 90%) was obtained from Silvateam Peru (Lima, Peru). Ultra-pure water with a conductivity of 0.05 µS/cm was obtained from Gehaka Master-P&D (São Paulo, Brazil).
2.2 Experimental design
In using the response surface methodology (RSM), three independent variables were considered: X1 is the sonication time (2.84 to 112.15 min), X2 is the TG concentration (0.19 to 1.20% w/v) and X3 is the amplitude (26 to 93%), and the dependent variable is the intrinsic viscosity (Y). A control was prepared without the ultrasound treatment. The methodology used was as described by Li et al.[15] . The quadratic polynomial regression model (Equation 1) was employed to correlate these values to their coded variables:
(Schott-Gerate, Germany), and the capillaries were immersed in a thermostatic bath (CT-52, Schott-Gerate, Germany) at 25 °C ± 0.05. The intrinsic viscosities [η] were calculated with Equations 2 and 3:
Where b0 (constant term); b1, b2 and b3 (linear effects); b11, b22 and b33 (quadratic effects); and b12, b13 and b23 (interaction effects) represent the coefficients of the polynomial model.
A software package (SAS® 9.0 ADX Interface for Design of Experiments) was used for analyses of the experimental data. The optimal condition for each variable was obtained by applying the numerical optimization procedure.
2.3 Ultrasonic treatment
Solutions of TG with the desired concentrations (0.19 to 1.20% w/v) were prepared with ultrapure water and stirred at 300 rpm (SP-160, SP Labor, Brazil) overnight at room temperature (25 °C). Then, the dispersion was transferred to a jacketed beaker connected in a thermoregulated bath with external circulation (Quimis, Q214M2, Brazil) at 25 °C ± 0.01 and stirred with a C-MAG HS 7 magnetic stirrer (IKA, Staufen, Germany) at 200 rpm throughout the process. The samples were subjected to HIUS by employing an ultrasound generator (UP 100H, Hielschier, Germany) containing a titanium sonotrode (MS2, 2 mm diameter); the frequency was 30 kHz and the power was 100 W. The ultrasound probe was submerged in the sample to a depth of 0.5 cm.
2.4 Determination of intrinsic viscosities
The intrinsic viscosities were measured with the method of Li et al.[15]. The relative viscosities (ηr) of the untreated tara gum (UTG) and tara gum-treated and optimized (TGTO) samples were measured with capillary viscometers
where t s is the flow time of the solution with UTG and TGTO, t0 is the flow time of the solvent, ηr is the relative viscosity, ηsp is the incremental viscosity, and c is the concentration of UTG and TGTO (g/mL).
2.5 Physicochemical characterization of UTG and TGTO
2.5.1 Molecular weight
The molecular weights of UTG and TGTO were determined with an adapted viscosimetric method[16]. In summary, the dynamic viscosity was calculated with data obtained from Cannon-Fenske capillary viscometers (Schott-Gerate, Germany), in which aqueous solutions containing UTG and TGTO were prepared at concentrations from 0.01 to 0.05%. The sample readings were taken in triplicate. The intrinsic viscosity was estimated by extrapolation of Martin’s curves to “zero” concentration using Equations 4 and 5:
where [η] is the intrinsic viscosity (cm3/g), ηsp is the specific viscosity, c is the concentration of the TG (g/mL), η is the solution viscosity of the TG (g/cm.s), η0 is the solvent viscosity (g/cm.s), and K is Martin’s constant.
The molecular weight was estimated with the MarkHouwink Equation 6:
where [η] is the intrinsic viscosity (dL/g), M v is the average viscosimetric molecular weight expressed as g mol -1 and α is a constant related to the structure of galactomannan, which was determined with Equation 7:
where the mannose:galactose (M:G) ratio is the ratio of mannose and galactose in the polysaccharide structure, which was obtained from nuclear magnetic resonance spectroscopy (1H NMR). The decrease in [η] is equivalent to the decrease in the average molecular mass, so it can be considered an indication of TG degradation before and after ultrasound treatment and optimization.
2.5.2 Average particle size determination
The hydrodynamic diameters (d.nm) of the 0.1% (w/v) UTG and TGTO solutions were determined using a Zetasizer
Soares, B. S., Carvalho, C. W. P., &
E. E. Polímeros, 33(1), e20230003, 2023 2/9
Garcia-Rojas
22
2
Y bbXbXbXbb
XX X =++++++ +++ (1)
0112233111222
333121213132323
bbXXbXXbXX
r 0 , 1 s spr t t ηηη==− (2) r 2 sp In c η η η = (3)
( ) ln/ sp clnKcηηη =+ (4) 0 sp ηη η η = (5)
( ) 0.98 6 11.55101 Mv ηα =×− (6)
( ) 1 /M/G 1 α = + (7)
Optimization of the ultrasonic treatment for Tara gum using response surface methodology
(Malvern Instruments, Nano-ZS, UK) at 632.8 nm with a 90° angle at 25 °C, and the experiments were performed in triplicate.
2.5.3 Fourier Transform Infrared (FTIR) Spectra of UTG and TGTO
The spectra were determined with an FTIR spectrometer (Bruker, Vertex 70, Germany) over the range 4000−500 cm-1
2.6 Solubility of UTG and TGTO
Solubilities were determined according to the method of Rodriguez-Canto et al.[17]. Freeze-dried samples were prepared at 0.1% (w/v) in distilled water and stirred with a magnetic stirrer (C-MAG HS 7, IKA, Germany) at room temperature (25 °C) for 1 h. The samples were centrifuged (Digicen 21R, OrtoAlresa, Spain) at 3500 × g for 30 min at 25 °C to remove the insoluble material. Then, the supernatant was collected and dried in an oven (SX 1.3, Sterilifer, Brazil) at 105 °C for 24 h.
2.7 Rheological analyses of the UTG and TGTO solutions
2.7.1 Measurements of constant shear
All rheological properties, including the flow behavior with increasing shear rate and frequency sweep tests of the UTG and TGTO, were measured at a constant temperature of 25 °C with a MARS II rotational rheometer (Thermo Fisher Scientific, Karlsruhe, Germany) equipped with a plate-and-plate geometry (PP 60Ti, 60 mm diameter). The UTG and TGTO solutions were prepared in deionized water with concentrations of 1.0%, 3.0% and 4.0% (w/v), and constant shear rate tests were performed over the range 0.01 to 300 s-1 at 25 °C. The flow behavior was analyzed with the rheological models of Newton (Equation 8), the power law (Equation 9), Bingham (Equation 10) and Herschel-Bulkley (Equation 11):
2.8 Statistical analyses
One-way analysis of variance (ANOVA) and Tukey’s test were used to establish the significance of differences between mean values at the 0.05 significance level. The statistical analyses were performed with Origin® 8.5 software (OriginLab Corporation, USA).
3. Results and Discussion
3.1 Optimization of the experimental design
The effects of different HIUS treatments on the intrinsic viscosity are presented in Table S1, and the regression analysis and ANOVA are presented in Table S2. This table shows that only the linear model was significant (p< 0.05), and the value of the coefficient of determination (R2) was 79.39, suggesting that the regression equation obtained with the RSM was viable. The analysis suggested that the linear effects of the time and concentration variables were significant (p < 0.05), and there was no significant effect (p < 0.05) for the amplitude variable. Using the linear model, the decoded Equation 12 was developed for the intrinsic viscosity: 12.14 2.11*t 1.25*C η =−+ (12)
where η is the intrinsic viscosity, t is the time and C is the gum concentration. Based on the predicted model, the optimal conditions for the experiment in which the variables were tested included a time of 112 min, a concentration of 0.19% (w/v) and an amplitude of 60%.
With these optimized conditions, the intrinsic viscosity was 5.97 (dL/g) according to the SAS program. This result was attributed to the greater exposure (112 min) of the TG to the HIUS, which increased the number of cavitational events, generated free radicals, enabled depolymerization of the TG and, consequently, generated TG with a low intrinsic viscosity[15,18]. These results agreed with the response surface plot shown in Figure 1.
3.2 Effects of the ultrasonic treatment on the physicochemical properties of UTG and TGTO.
3.2.1 Intrinsic viscosity, molecular weight and particle size
where τ is the shear stress (Pa), γ is the shear rate (s-1), η is the Newtonian viscosity (Pa ∙ s), K is the consistency coefficient n Pas , n is the flow behavior index (dimensionless), 0τ is the initial yield stress (Pa), and plη is the Bingham plastic viscosity (Pa ∙ s). The quality of the fit was evaluated from the coefficient of determination (R2).
2.7.2 Dynamic shear measurements
Dynamic oscillatory measurements were performed to ensure linear viscoelastic conditions with frequency sweep tests performed over the range 0.1 to 100 Hz for UTG and TGTO (1%) and over the range 0.1 to 10 Hz for TGTO (3% and 4%) by applying a constant shear stress for analyses of the storage modulus (G’) and loss modulus (G’’) as a function of the oscillation frequency.
The ultrasonic treatments caused substantial decreases in the intrinsic viscosity of TG due to reductions in the molecular weight and chain length of the gum. The intrinsic viscosities of UTG and TGTO were 12.31 dL/g and 3.14 dL/g, respectively. The degradation rate of TG was estimated to be 59%. The average molecular weight (Mw) was higher for UTG (1.89 x 10⁶ Da) than for TGTO (0.47 x 10⁶ Da), which was consistent with the reductions in the intrinsic viscosity, indicating that ultrasound was an effective method for TG depolymerization. The average hydrodynamic diameter (Z-average) of UTG was 147.1 ± 4.90 nm, while that of TGTO was 139.7 ± 2.4 nm. Figure 2 shows the distributions of the UTG and TGTO particle sizes. For UTG (Figure 2A), we observed that the size distribution was wide and contained 3 uneven peaks, whereas TGTO (Figure 2B) showed 2 narrower and more uniform peaks.
Polímeros, 33(1), e20230003, 2023 3/9
τηγ = (8) () n K τγ =⋅ (9) 0 pl ττηγ −=⋅ (10) 0 () n K ττγ −=⋅ (11)
The reductions and uniformity of the particle sizes observed in this study may have been related to cavitation in the aqueous TG solution caused by the HIUS treatment. According to Li et al.[15], shear forces alter the structures of polysaccharides after explosion of the cavitation bubbles generated by the ultrasonic treatment, disperse the polysaccharide aggregates and cause reductions in the molecular weights and particle sizes. Our results agree with other studies in which polysaccharides were degraded with ultrasonic irradiation[4,6]
3.2.2 Analysis of the FTIR spectra

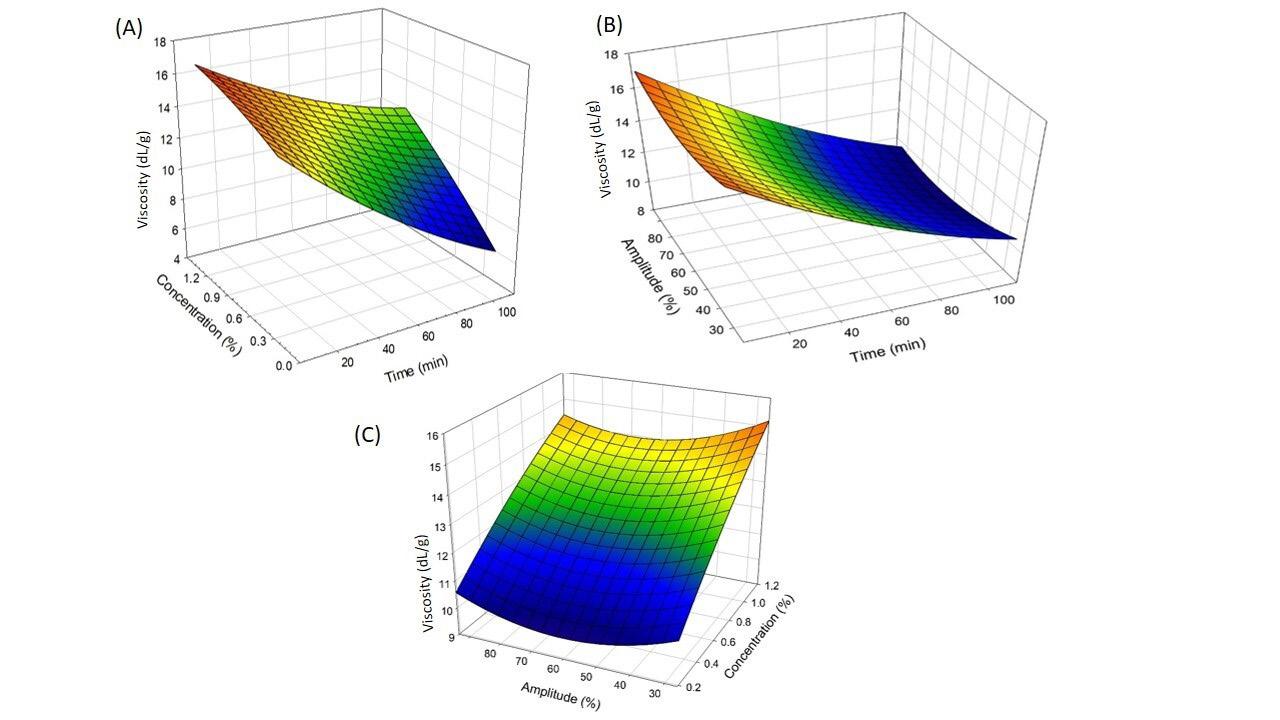
Figure 3 shows that both UTG and TGTO showed broad absorption bands at 3319 and 3368 cm -1, respectively. These could be due to hydrogen bonding involving the hydroxyl groups in the gum molecules and correspond to O-H
stretching vibrations. The band at 2918 cm-1 was attributed to symmetric CH stretching vibrations[14,19]. The absorption band at approximately 1638 cm- 1 corresponded to the asymmetric stretching vibrations of C-O bonds[4]. The peaks at 1023 cm-1 for TGTO and 1014 cm-1 for UTG indicated bending vibrations of H2C-O-CH2 bonds[14,19]. The spectra of UTG and TGTO showed absorption bands at 810 cm-1 characteristic of α-linked D-galactopyranose units, and at 871 cm-1 characteristic of β-linked D-mannopyranose. The infrared spectra of UTG and TGTO clearly showed that there were no major changes in the functional groups or chemical structures caused by the treatments and that ultrasound-induced chain scissions only broke the polymer structures and resulted in viscosity reductions without any changes in the primary structures
Soares, B. S., Carvalho, C. W. P., & Garcia-Rojas E. E. Polímeros, 33(1), e20230003, 2023 4/9
Figure 1. Influence of treatment parameters on the viscosity. Effects of time and concentration (A), time and amplitude (B) and concentration and amplitude (C) on the intrinsic viscosity of the TG.
Figure 2. Particle size distributions of UTG (A) and TGTO (B).
or in the functional properties of the tara gum, as reported previously[4,6,12]
3.3. Effects of ultrasound on the solubilities of UTG and GTTO
The solubilities of TGTO and UTG were 99.67 and 84.67%, respectively. TGTO showed a more significant increase in the water solubility, approximately 17.5%, compared to UTG. The ultrasonic waves caused cavitation due to the expansion and contraction cycles experienced by the material, and these cycles disrupted the cell walls of the solid matrix[20]. These ruptures enabled solvent penetration, which explains the increase seen in the TG solubility after the ultrasound treatment. Furthermore, this result may be related to destruction of intra- and intermolecular noncovalent bonds, which would expose more hydrophilic polysaccharide groups to water and increase the solubility[21]. The current study achieved a better result than the study carried out by Santos, Isabel and Garcia-Rojas[14], in which the solubility of TG was 83% after sonication for 60 min at 25 °C. The higher solubility found in this study is consistent with the results described above (Item 3.2.1), in which prolonged exposure to sonication contributed to a greater reduction in the molecular weight and, consequently, an increase in the solubility. Ultrasound-induced increases in the solubilities of polysaccharides have already been reported[21], but studies with galactomannans are still scarce.

The development of new technologically sophisticated products via nonthermal processing is one of the major trends for the coming years[22]. In this sense, it should be noted that the solubility achieved in this research was possible only with application of the optimized ultrasonic treatment method, and prior thermal processing was not required. There is
Optimization of the ultrasonic treatment for Tara gum using response surface methodology Polímeros,
global demand for new products similar to unprocessed and made with nonthermal technologies. Thus, the food industry could apply an adapted form of TGTO[23]. Consumers are demanding foods with innovative ingredients, and in the future, TGTO can be used to prepare functional foods and beverages from ingredients that are easily soluble at room temperature, such as with instant foods. In addition, the modified TGTO can be used in packages with edible films that require a material with low water resistance that is biodegradable and safe for human consumption.
3.4 Rheological Properties of the UTG and TGTO
Table 1 summarizes the parameters of the Newtonian, power law, Bingham and Herschel-Bulkley models obtained by fitting the rheological data of the UTG (1%, w/v) and TGTO (1, 3 and 4%, w/v) solutions. Thus, the flow behaviors of the UTG and TGTO solutions were best described by the power law model, which presented R2 values close to 1 (R2= 0.99 and 0.97). An increase in the concentration of TGTO from 1 to 4% resulted in an increase in the consistency coefficient K and a decrease in the flow behavior index n (Table 1). This indicated that the solutions became more resistant to flow and were increasingly pseudoplastic as the concentration of TGTO was increased. According to Wei et al.[24], gums with low n values and improved pseudoplasticities are advantageous because they provide a less viscous mouthfeel with easier mixing and serve as thickeners in nutritional formulations used for the management of dysphagia. When comparing UTG and TGTO, we observed a reduction in the consistency coefficient K from 6.806 ± 1.336 to 0.029 ± 0.001 at a 1% concentration. The modifications in the rheological properties are useful, as they confirm a reduction in the molecular weight of TG and consequently the increased solubility.
The flow and apparent viscosity curves of UTG and TGTO are shown in Figure 4A and B. Non-Newtonian behavior was observed for the UTG with decreasing viscosity and increasing strain rate. The TGTO presented as a Newtonian fluid with a very low viscosity close to that of water. This behavior was attributed to breaking of the polymeric network and orientation or alignment of the microstructures along the direction of shear flow, which reduced the flow resistance[25]. This indicated that the ultrasound treatment caused strong changes in the rheological properties due to a reduction of the molecular mass of the TGTO and was consistent with other studies that treated polysaccharides with ultrasound[6,13].
where τ is the shear stress (Pa), γ is the shear rate (s-1), η is the Newtonian viscosity (mPa∙s), K is the consistency coeficiente n Pas , n is the flow behavior index (dimensionless), 0τ is the initial yield stress (Pa), plη is the Bingham plastic viscosity (Pa∙s)and coefficient of determination (R2).
33(1), e20230003, 2023 5/9
Figure 3. FTIR spectra of UTG (untreated) and TGTO (after optimized treatment).
Sample Newton Power law Bingham Herschel-Bulkley η R2 K n R2 τ0 ηPL R2 K N τ0 R2 UGT (1%) 0.28 0.41 6.80 0.40 0.99 24.2 0.16 0.94 23.1 0.25 -26.8 0.99 TGTO (1%) 0.02 0.97 0.02 0.90 0.97 0.1 0.02 0.97 0.04 0.84 -0.16 0.97 TGTO (3%) 0.48 0.99 0.98 0.86 0.99 6.5 0.45 0.99 1.10 0.84 -1,74 0.99 TGTO (4%) 1.21 0.98 3.67 0.79 0.99 26.3 1.08 0.99 5.26 0.73 -12.8 0.99
Table 1. Rheological parameters obtained from the Newton, Power Law, Bingham, and Herschel-Bulkley models for UTG and TGTO solutions at 25 °C.
The plots of ' G and '' G as a function of frequency for the UTG solution presented crossover points ( ) GG ′ = ′′ at low frequencies (1 to 10 Hz). Initially, the solutions behaved as liquids with '' G higher than G ′, and after the crossing point, elastic behavior was established with ' G higher than '' G Figure 4C and D, as found in other studies[6,16]. At frequencies above 10 Hz, ’G and ’’G showed nonlinearity corresponding to disentanglement and irreversible flow of the UTG and TGTO molecules as a result of the shear force[6]. In Figure 4E and F, in which TGTO has higher concentrations of 3% and 4%, the solutions behaved as liquids with '' G higher than G ′. Furthermore, both the ' G and '' G for TGTO decreased, possibly due to breaking of the polymer chain[6]. In water, the UTG formed a relatively elastic dispersion (solid property) that became a viscous dispersion (fluid property) after ultrasound treatment. These results corroborated the results of Li et al.[6], who studied the ultrasonic degradation and rheological profiles of konjac glucomannan (KGM) and observed that ultrasound weakened the intermolecular interactions.
4. Conclusion
A high-intensity ultrasound treatment significantly affected the physicochemical, functional, and rheological properties of TG, depending on the ultrasound treatment time and polymer concentration. After the ultrasound treatment, the TG showed a reduction in the intrinsic viscosity and particle sizes. These changes positively influenced the functional properties of the TG, as shown by the increased solubility. In addition, the TGTO solution behaved as a Newtonian fluid with low viscosity and consistency; this indicated that the ultrasound treatment caused strong changes in the

rheological properties of the TG solution and confirmed the effectiveness of the treatment. The increased solubility of galactomannan, the reduced viscosity, and the reduction in molecular mass, will enable future technological applications, such as with functional beverages, instant foods and edible film packaging. In addition to biological applications involving the antioxidant activity and bioaccessibility of TG, it meets the various demands of the food processing industry. Therefore, advances in ultrasonication treatments of natural polymers are expected to provide new applications in various industrial fields.
5. Author’s Contribution
• Conceptualization – Barbara da Silva Soares; Edwin Elard Garcia-Rojas.
• Data curation – Barbara da Silva Soares.
• Formal analysis – Barbara da Silva Soares.
• Funding acquisition – Edwin Elard Garcia-Rojas.
• Investigation – Barbara da Silva Soares.
• Methodology – Barbara da Silva Soares; Carlos Wanderlei Piler Carvalho; Edwin Elard Garcia-Rojas.
• Project administration – Edwin Elard Garcia-Rojas.
• Resources – Carlos Wanderlei Piler Carvalho; Edwin Elard Garcia-Rojas.
• Software – NA.
• Supervision – Edwin Elard Garcia-Rojas.
• Validation – Barbara da Silva Soares; Carlos Wanderlei Piler Carvalho; Edwin Elard Garcia-Rojas.
• Visualization – NA.
Soares, B. S., Carvalho, C. W. P., &
E. E. Polímeros, 33(1), e20230003, 2023 6/9
Garcia-Rojas
Figure 4. Rheological measurements of the UTG and TGTO solutions. Flow curves (A), apparent viscosity curves for the UTG and TGTO solutions (B); storage and loss moduli (G’, G’’) for UTG at a 1% concentration (C) and TGTO at a 1% concentration (D) and at 3% (E) and 4% (F) at 25 °C.
Optimization of the ultrasonic treatment for Tara gum using response surface methodology
• Writing – original draft – Barbara da Silva Soares.
• Writing – review & editing – Barbara da Silva Soares; Carlos Wanderlei Piler Carvalho; Edwin Elard GarciaRojas.
6. Acknowledgements
The authors thank Conselho Nacional de Desenvolvimento Científico e Tecnológico, Brazil (313928/2021-5); Coordenação de Aperfeiçoamento de Pessoal de Nível Superior, Brazil (Code 001), and Fundação de Amparo à Pesquisa do Estado do Rio de Janeiro, Brazil (E-26/201.030/2021) for financial support
7. References
1 Wu, Y., Ding, W., Jia, L., & He, Q. (2015). The rheological properties of tara gum (Caesalpinia spinosa). Food Chemistry, 168, 366-371 http://dx.doi.org/10.1016/j.foodchem.2014.07.083 PMid:25172722.
2 Wu, Y., Ding, W., & He, Q. (2016). Molecular characteristics of tara galactomannans: effect of degradation with hydrogen peroxide. International Journal of Food Properties, 20(12), 3014-3022 http://dx.doi.org/10.1080/10942912.2016.1270300
3 Martin, A. A., Sassaki, G. L., & Sierakowski, M. R. (2020). Effect of adding galactomannans on some physical and chemical properties of hyaluronic acid. International Journal of Biological Macromolecules, 144, 527-535 http://dx.doi. org/10.1016/j.ijbiomac.2019.12.114 PMid:31857166.
4 Xu, Y., Zhang, X., Yan, X.-H., Zhang, J.-L., Wang, L.-Y., Xue , H. , Jiang , G.-C. , Ma , X.-T. , & Liu , X.-J. (2019 ). Characterization, hypolipidemic and antioxidant activities of degraded polysaccharides from Ganoderma lucidum. International Journal of Biological Macromolecules , 135, 706-716 http://dx.doi.org/10.1016/j.ijbiomac.2019.05.166
PMid:31129213.
5 Chen, X., Qi, Y., Zhu, C., & Wang, Q. (2019). Effect of ultrasound on the properties and antioxidant activity of hawthorn pectin. International Journal of Biological Macromolecules , 131, 273-281 http://dx.doi.org/10.1016/j.ijbiomac.2019.03.077 PMid:30876895.
6 Li, J., Li, B., Geng, P., Song, A.-X., & Wu, J.-Y. (2017). Ultrasonic degradation kinetics and rheological profiles of a food polysaccharide (konjac glucomannan) in water. Food Hydrocolloids, 70, 14-19 http://dx.doi.org/10.1016/j. foodhyd.2017.03.022
7 Zou, P., Lu, X., Jing, C., Yuan, Y., Lu, Y., Zhang, C., Meng, L. , Zhao , H. , & Li , Y. (2018 ). Low-molecular-weightt polysaccharides from Pyropia yezoensis enhance tolerance of wheat seedlings ( Triticum aestivum L.) to salt stress. Frontiers in Plant Science, 9, 427. http://dx.doi.org/10.3389/ fpls.2018.00427 PMid:29719543.
8 Tecson, M. G., Abad, L. V., Ebajo, V. D., Jr., & Camacho, D. H. (2021). Ultrasound-assisted depolymerization of kappacarrageenan and characterization of degradation product. Ultrasonics Sonochemistry , 73 , 105540 http://dx.doi. org/10.1016/j.ultsonch.2021.105540 PMid:33812249.
9 Stefanović, A. B., Jovanović, J. R., Dojčinović, M. B., Lević, S. M., Nedović, V. A., Bugarski, B. M., & Knežević-Jugović, Z. D. (2017). Effect of the controlled high-intensity ultrasound on improving functionality and structural changes of egg white proteins. Food and Bioprocess Technology, 10(7), 1224-1239 http://dx.doi.org/10.1007/s11947-017-1884-5
10 Niknam, R., Mousavi, M., & Kiani, H. (2020). New studies on the galactomannan extracted from Trigonella foenum-graecum (Fenugreek) seed: effect of subsequent use of ultrasound and microwave on the physicochemical and rheological properties. Food and Bioprocess Technology, 13(5), 882-900 http://dx.doi. org/10.1007/s11947-020-02437-6
11 Zheng, J., Zeng, R., Kan, J., & Zhang, F. (2018). Effects of ultrasonic treatment on gel rheological properties and gel formation of high-methoxyl pectin. Journal of Food Engineering, 231, 83-90 http://dx.doi.org/10.1016/j.jfoodeng.2018.03.009
12 Chen, T.-T., Zhang, Z.-H., Wang, Z.-W., Chen, Z.-L., Ma, H., & Yan, J.-K. (2021). Effects of ultrasound modification at different frequency modes on physicochemical, structural, functional, and biological properties of citrus pectin. Food Hydrocolloids, 113, 106484 http://dx.doi.org/10.1016/j. foodhyd.2020.106484
13 Dodero, A., Vicini, S., & Castellano, M. (2020). Depolymerization of sodium alginate in saline solutions via ultrasonic treatments: a rheological characterization. Food Hydrocolloids, 109, 106128 http://dx.doi.org/10.1016/j.foodhyd.2020.106128
14 Santos, M. B., Isabel, I. C. A., & Garcia-Rojas, E. E. (2022). Ultrasonic depolymerization of aqueous tara gum solutions: kinetic, thermodynamic and physicochemical properties. Journal of the Science of Food and Agriculture, 102(11), 4640-4646 http://dx.doi.org/10.1002/jsfa.11824. PMid:35174497.
15 Li, M., Ma, F., Li, R., Ren, G., Yan, D., Zhang, H., Zhu, X., Wu, R., & Wu, J. (2020). Degradation of Tremella fuciformis polysaccharide by a combined ultrasound and hydrogen peroxide treatment: process parameters, structural characteristics, and antioxidant activities. International Journal of Biological Macromolecules, 160, 979-990 http://dx.doi.org/10.1016/j. ijbiomac.2020.05.216 PMid:32473217.
16 Fernandes, R. A., & Garcia-Rojas, E. E. (2021). Effect of cosolutes on the rheological and thermal properties of Tara gum aqueous solutions. Journal of Food Science and Technology, 58(7), 2773-2782 http://dx.doi.org/10.1007/s13197-02004785-9 PMid:34194111.
17 Rodriguez-Canto, W., Chel-Guerrero, L., Fernandez, V. V. A., & Aguilar-Vega, M. (2019). Delonix regia galactomannan hydrolysates: rheological behavior and physicochemical characterization. Carbohydrate Polymers, 206, 573-582. http:// dx.doi.org/10.1016/j.carbpol.2018.11.028 PMid:30553360.
18 Yan, J.-K., Wang, Y.-Y., Ma, H.-L., & Wang, Z.-B. (2016). Ultrasonic effects on the degradation kinetics, preliminary characterization and antioxidant activities of polysaccharides from Phellinus linteus mycelia. Ultrasonics Sonochemistry, 29, 251-257 http://dx.doi.org/10.1016/j.ultsonch.2015.10.005 PMid:26585005.
19 Santos , M. B. , Dos Santos , C. H. C., de Carvalho, M. G., de Carvalho, C. W. P., & Garcia-Rojas, E. E. (2019). Physicochemical, thermal and rheological properties of synthesized carboxymethyl tara gum (Caesalpinia spinosa). International Journal of Biological Macromolecules , 134, 595-603 http://dx.doi.org/10.1016/j.ijbiomac.2019.05.025 PMid:31071404.
20 Wang, C.-Y. (2020). A review on the potential reuse of functional polysaccharides extracted from the by-products of mushroom processing. Food and Bioprocess Technology, 13(2), 217-228 http://dx.doi.org/10.1007/s11947-020-02403-2
21 Wang, W., Chen, W., Zou, M., Lv, R., Wang, D., Hou, F., Feng, H., Ma, X., Zhong, J., Ding, T., Ye, X., & Liu, D. (2018). Applications of power ultrasound in oriented modification and degradation of pectin: A review. Journal of Food Engineering, 234, 98-107 http://dx.doi.org/10.1016/j.jfoodeng.2018.04.016
Polímeros, 33(1), e20230003, 2023 7/9
Soares, B. S., Carvalho, C. W. P., & Garcia-Rojas E. E.
22 Strieder, M. M., Silva, E. K., & Meireles, M. A. A. (2021). Advances and innovations associated with the use of acoustic energy in food processing: an updated review. Innovative Food Science & Emerging Technologies, 74, 102863 http://dx.doi. org/10.1016/j.ifset.2021.102863
23 Mukherjee, K., Dutta, P., Badwaik, H. R., Saha, A., Das, A., & Giri, T. K. (2022). Food Industry applications of Tara Gum and its modified forms. Food Hydrocolloids for Health, 3, 100107 http://dx.doi.org/10.1016/j.fhfh.2022.100107
24 Wei, Y., Guo, Y., Li, R., Ma, A., & Zhang, H. (2020). Rheological characterization of polysaccharide thickeners oriented for
dysphagia management: carboxymethylated curdlan, konjac glucomannan and their mixtures compared to xanthan gum. Food Hydrocolloids, 110, 106198 http://dx.doi.org/10.1016/j. foodhyd.2020.106198
25 Mezger, T. G. (2006). The rheology handbook: for users of rotational and oscillatory rheometers Germany: Vincentz network GmbH & Co. KG.
Received: Oct. 04, 2022
Revised: Feb. 13, 2023
Accepted: Feb. 14, 2023
Polímeros,
2023 8/9
33(1), e20230003,
Optimization of the ultrasonic treatment for Tara gum using response surface methodology
Supplementary Information
Supplementary material accompanies this paper.
Table S1. Variables (coded and decoded) studied for optimization of the ultrasonic treatment used for the gum solutions.
Table S2. ANOVA for the response variable η (dL/g).
This material is available as part of the online article from https://doi.org/10.1590/0104-1428.20220090
Polímeros, 33(1), e20230003, 2023 9/9
Electrospun PHBV nanofiber containing Tea Tree Oil: physicochemical and antimicrobial activity
Verônica Ribeiro dos Santos1 , Samara Domingues Vera1, Gabrielle Lupeti de Cena2 , Adrielle de Paula Silva3 , Ana Paula Lemes4 , Kátia da Conceição2 , Dayane Batista Tada3 , Alexandre Luiz Souto Borges5 and Eliandra de Sousa Trichês1*
1Laboratório de Biocerâmicas, Instituto de Ciência e Tecnologia, Universidade Federal de São Paulo –UNIFESP, São Paulo, SP, Brasil
2Laboratório de Bioquímica de Pepitídeos, Instituto de Ciência e Tecnologia, Universidade Federal de São Paulo – UNIFESP, São Paulo, Brasil
3Laboratório de Nanomateriais e Nanotoxicologia, Instituto de Ciência e Tecnologia, Universidade Federal de São Paulo – UNIFESP, São Paulo, SP, Brasil
4Laboratório de Tecnologia em Polímeros e Biopolímeros, Instituto de Ciência e Tecnologia, Universidade Federal de São Paulo – UNIFESP, São Paulo, SP, Brasil
5Departamento de Materiais Dentários e Prostodontia, Instituto de Ciência e Tecnologia, Universidade Estadual Paulista – UNESP, São Paulo, SP, Brasil *eliandra.sousa@unifesp.br
Obstract
Aiming to produce an antimicrobial dressing for wound healing applications, in this work Tea Tree oil (TTO) was incorporated into PHBV nanofibers by absorption. It was observed increase in the nanofiber diameter due to 5% TTO absorption efficiency, which also led to a 54% decrease in the contact angle. The releasing assay indicates a 6.8% oil release in the first 24 h – being probably the oil deposited at the polymer surface – followed by a minimal release at 48 h. The set of antimicrobial assays performed suggests the incorporation of TTO optimized the antimicrobial activity of the polymer for E. coli and C. albicans, while against S. aureus no significant difference was observed. The MTT assay showed no cytotoxicity of PHBV, but the incubation of L929 fibroblast cells with PHBV-TTO reduced cell viability. Overall, the PHBV nanofibers containing TTO present great potential as an antimicrobial dressing.
Keywords: antimicrobial activity, nanofiber, PHBV, tea tree oil, wound healing.
How to cite: Santos, V. R., Vera, S. D., Cena, G. L., Silva, A. P., Lemes, A. P., Conceição, K., Tada, D. B., Borges, A. L. S., & Trichês, E. S. (2023). Electrospun PHBV nanofiber containing Tea Tree Oil: physicochemical and antimicrobial activity. Polímeros: Ciência e Tecnologia, 33(1), e20230004. https://doi.org/10.1590/0104-1428.20220088
1. Introduction
Preventing pathological infections and performing vital functions in the human body, the skin represents the interface between the internal and external environment. Being able to control the hydration state, thermoregulation, and metabolism, any skin injury must be treated to assure homeostasis maintenance[1,2]. When skin damage occurs due to physical trauma or illness, a cascade of biochemical processes takes place to restore the wounded tissue in four different stages: blood clotting, inflammation, new tissue formation, and tissue remodeling[3,4]. The human body can rapidly heal small wounds but, in case of extended damage such as burns and chronic non-healing wounds, direct exposure to the environment enhances changes of inflammation and microorganism invasion that, together with the poor blood, nutrients, and oxygenation supply, may prevent proper wound healing and management[5]. In such cases, dressings are commonly used as the first treatment to reduce damage by exposure and mechanical stress, to
protect the wounded area from secondary infections, and to promote tissue regeneration by rapid epithelization[6,7]
Nanofiber-based wound dressings stand out once their structure resembles the natural skin’s extracellular matrix (ECM)[8]. Due to their high surface area, porosity, and mechanical resistance, the nanofibers support cell adhesion, proliferation, infiltration, and differentiation[6,8]. Additionally, allow liquid evaporation, has oxygen permeability, absorbs exudates, and prevents wound drying; crucial properties to optimize tissue regeneration[2,6]. Polymers such as polylactic acid (PLA), Polycaprolactone (PCL), Poly(3-hydroxybutyrateco-3-hydroxyvalerate) (PHBV), chitosan and gelatin attend these properties and are widely studied for wound healing applications[9]. Besides the characteristics of the nanofiber structure itself, the material used may also play an important role in wound healing. Produced by electrospinning of a polymer solution, nanofibers of natural polymers have
https://doi.org/10.1590/0104-1428.20220088 O O O O O O O O O O O O O O O Polímeros, 33(1), e20230004, 2023 ISSN 1678-5169 (Online) 1/11
been preferable over the synthetics attributable to their biocompatibility, adaptability to technological needs, and absence of residual monomers with toxicological potential[6,10]
Electrospinning is an electrohydrodynamic technique of fibers production at the micro and nano scales, in which a typical apparatus is composed of a syringe pump, a high-voltage power supply, and a grounded collector[11] The polymer solution is loaded into a syringe coupled to a capillary metal tip and to an electrode, and then positioned into a syringe pump. The other electrode is connected to the grounded collector, enabling a potential difference between the capillary tip and the collector when the electric field is applied. As a result of this setup, the polymer droplet at the capillary tip is elongated in a straight line to the grounded collector direction while whipping motions occur together with the solvent evaporation, generating polymer fibers into the collector surface[11,12].
Poly(3-hydroxybutyrate-co-3-hydroxyvalerate) (PHBV) is a natural thermoplastic linear aliphatic polyester produced by bacteria, being a copolymer of hydroxybutyrate (HB) and hydroxyvalerate (HV) units[13]. PHBV is biodegradable, oxygen permeable, and has intrinsic piezoelectric properties which can improve cellular adhesion and processes such as proliferation and phenotypic maturation[7,14-16] . The PHBV degradation occurs once it is susceptible to human tissue enzymes, such as lysozyme and esterase, but also by hydrolytic degradation in a water environment at slow rates[16]. Additionally, its degradation product HV is already present in human blood and promotes fibroblast and keratinocyte proliferation[17]. It is already reported that PHBV nanofibers provide enough humidity and mechanical resistance for tissue repair[18], besides accelerated healing and minimal scarring[17], being a great material of choice for the development of soft tissue dressings.
Another crucial factor for wound healing is preventing site contamination by microorganisms. Without specific attention, these opportunistic pathogens may uncontrollably grow, promote exudate formation, lead to serious inflammations, and retard healing[19]. Thus, the development of dressing with antimicrobial activity is a constant concern of tissue engineering[10]. Considering this scenario, the antimicrobial action of nanofiber-based dressings may be achieved by the incorporation of bioactive compounds into their structure. Recently, there are increasing interest in essential oils due to their intrinsic antimicrobial and antioxidant properties, provided by their main constituents e.g., terpenes, and terpenoids[5,20]. In general, their mechanisms of action against bacteria consist in inducing cytoplasmic membrane damage by the lipid layer’s hydrocarbons partition, which eventually leads to cell lysis[21]. The antioxidant properties of essential oils also have an interest in wound management once the high concentration of reactive oxygen species from inflammation at the wound site damages healthy cells and destroy proteins, and the use of these plant-based active agents prevents extensive harm to cell structures[22]
Tea tree oil (TTO) is an essential oil extracted from the Melaleuca alternifolia leaves and twigs, having proven efficiency among microorganisms (e.g., E. coli, S. aureus, C. albicans) in small quantities compared to other essential oils due to the low values of minimum inhibitory
concentration[23-25]. Reports in the literature indicate an amount of 0.2 to 1.5% (v/v) of TTO is able to inhibit the growth of the before mentioned microorganisms[23-26] TTO composition is given in the International Standard (ISO 4730-2004) and its major constituents are terpinene-4-ol (30-48%), γ-terpinene (10-28%), α-terpinene (5-13%) and 1-8 cineole (0-15%). Several studies illustrate the antimicrobial potential of TTO for a wide range of applications, e.g., active food packaging[27], dental[28], acne treatment[29] and wound healing[20,30]. Although different techniques were used to obtain the final fiber/membrane product in these studies, such as electrospinning[31], blow spinning[28], or casting technique[23], they all have a common feature: the TTO was added to the polymer solution before the fiber/ membrane obtention. Similarly, Zhang et al.[31] incorporated 15% v/v of TTO into the PLA solution and proceed to the electrospinning process. The obtained nanofibers were then tested against S. epidermidis by the inhibition zone method, but no activity was reported due to the oil evaporation during the electrospinning technique. Indeed, essential oils in general are prone to volatilization, conversion, and degradation reactions due to their low chemical stability[32], which makes them less susceptible to maintaining their properties intact after such processes. Additionally, interactions between essential oils and polymers while in contact with the organic solvents may occur, leading to a contrary effect to expect.
Considering the exposed, it is believed that dripping Tea Tree oil into the nanofiber and promoting its absorption rather than its encapsulation may be an alternative to maintain TTO properties unchanged since chemical interactions with polymers and solvents that are favored during the processing method, would be avoided in the absorption process. Moreover, to the best of our knowledge, there is no literature that had reported on the combined use of PHBV and TTO to promote antimicrobial action. Thus, this work aimed to incorporate TTO into electrospun PHBV nanofibers by absorption and evaluate its antimicrobial properties against three microorganisms (E. coli, S. aureus, and C. albicans), comparing the results with the action of pure oil itself.
2. Materials and Methods
2.1 Materials
Poly(3-hydroxybutyrate-co-3-hydroxyvalerate) (PHBV) was purchased by Nature-Plast (France), with trade name PHI002, having an HV unit concentration between 2-3% and w M in the range of 400.000 to 500.000 g.mol-1. 1,1,1,3,3,3-Hexafluoro-2-propanol (HFIP) (Sigma-Aldrich, St. Louis/Missouri, USA) was used as an organic solvent to dissolve the PHBV, and the Tea Tree Oil (TTO) (Melaleuca alternofilia, PHYTOTERÁPICA, Brazil) was used as the antimicrobial agent.
2.2 Preparation of Tea Tree Oil embedded PHBV nanofibers
Using HFIP, an 8 wt.% PHBV solution was prepared under magnetic stirring. The mixture was homogenized for 24 hours at room temperature to allow its stabilization. The solution was loaded in a 5 mL syringe that has a 27 G stainless-steel
P.,
K.,
D. B.,
A. L. S., &
E.
Polímeros, 33(1), e20230004, 2023 2/11
Santos, V. R., Vera, S. D., Cena, G. L., Silva, A. P., Lemes, A.
Conceição,
Tada,
Borges,
Trichês,
S.
Electrospun PHBV nanofiber containing Tea Tree Oil: physicochemical and antimicrobial activity
flat needle and was electrospun at a rate of 1,5 mL/h under a 14 kV electrostatic field in a proper assembly electrospinning equipment. The deposition of the nanofibers was carried out in a 3 cm diameter rotating collector at 3.000 rpm and 15 cm from the needle tip. The processes took place at 22 °C and 45% of relative humidity, and the collector was previously covered with aluminum foil to facilitate the nanofibers’ handling. After 180 min, the nanofibers were collected and allowed to dry in a vacuum desiccator at room temperature for 48 hours to prevent residual solvent presence. For the development of this work, two mats were obtained by using the same conditions. Nanofibers were cut into 5 mm diameter disks and Tea Tree Oil was dripped on its surface to the saturation volume, which was 3 µL per disk. After 48 hours of absorption and drying at room temperature, the following analyses were carried out.
2.3 Morphology and mean diameter
The PHBV nanofibers were analyzed regarding their morphology before (PHBV) and after (PHBV-TTO) Tea Tree oil embedding by electron scanning microscopy (SEM, FEI Inspect S50, Hillsboro, OR, USA) of the samples coated with gold (Sputtering Quorum Q150R ES). The diameter of 100 nanofibers was collected from three different images using FIJI-Image J software, and the mean diameter and its distribution were obtained from a Gauss curve fitting in Origin ® 2018 software.
2.4 Contact angle measurement
The contact angle was measured using an optical tensiometer (TL 1000 - Invoiced freight, Theta Lite, Attension, Lichfield, Staffordshire, UK) (10 s, 50% - 30 FPS) to determine the wettability of the nanofibers. Distilled water was loaded into a glass syringe (Gastight Syringes #1001 – 1 mL) and the contact angle was recorded by the sessile drop method at room conditions. The test was carried out in quadruplicate.
2.5 Fourier-transformed infrared spectroscopy (FTIR)
The structural characterization of TTO, PHBV, and PHBV-TTO was performed to evaluate spectrum changes with the TTO embedding (n=1). FTIR was performed in a Frontier model Perkin Elmer Spectrum spectrometer from 4000 to 400 cm-1 in UATR mode using a diamond crystal.
2.6 Tea Tree Oil absorption efficiency
The TTO absorption efficiency by PHBV was conducted by mass change. Initially, the mass of 5 mm diameter disks of pure PHBV nanofiber ( PHBV m ) was measured. Then, 3 µL (2.69 mg, ρ = 0.896 g/mL) of TTO was dripped into the polymer and the mass was weighed after drying for 48 hours ( PHBVTTO m ). The high-precision weighing machine used was an AS 60/220.R2 model from Radwag. The amount of oil in the nanofiber ( TTOm ) was determined by Equation 1, while the absorption efficiency was by Equation 2. The experiment was carried out in quintuplicate.
2.7 Tea Tree Oil release from PHBV-TTO
The TTO release from the PHBV-TTO nanofiber was performed by VU-Vis spectroscopy using an FS5 Edinburgh Instruments spectrometer. Firstly, a calibration curve was obtained by analysis of known concentrations of TTO in Phosphate-Buffered Saline solution (PBS) in the range of 200-400 nm and an optical path length (l) of 1 cm. The absorbance (A) of the diluted TTO solutions at the prominent peak was measured at 204 nm and the absorptivity (ɛ) was calculated by the Beer-Lambert Law (Equation 3), where c is the TTO concentration (mg/mL).
To measure the TTO release, PHBV-TTO nanofiber was inserted in 15 mL falcon tubes filled with 3 mL of PBS solution. The tubes were maintained under agitation at 100 rpm and 37 °C in the Shaker Julabo SW 22, and after 0, 1, 3, 6, 24, and 48 hours an aliquot (1 mL) was removed from the system and analyzed by UV-Vis spectroscopy (200-400 nm). After every removal, fresh PBS was inserted into the tubes. The experiment was carried out in triplicate. The amount of TTO released from PHBV in each time point (t) was calculated using the Beer-Lambert Law, and the cumulative TTO mass released (Σ mTTO t) was obtained. Regarding the release according to the absorption efficiency, the results were expressed in terms of percentage (Equation 4).
2.8 Antimicrobial assay
2.8.1 Microorganisms growth inhibition
The antimicrobial activity of PHBV and PHBV-TTO nanofibers was addressed by using a liquid growth inhibition assay against three strains; E. coli (ATCC 25922), S. aureus (ATCC 6537), and C. albicans (ATCC 10231) – which are the most common microorganisms associated with wound infection[33,34]. The pre-inoculum of the strains was prepared in MHA (Mueller Hinton Agar Medium, KASVI, K25-610034) (for bacteria) and Sabouraud Dextrose Agar (SDA, Acumedia®Lab, 7150) (for fungi) for 24 hours at 37 °C. The concentration of the inoculum was standardized at 108 (E. coli) or 106 (S. aureus and C. albicans) cells/ mL at an absorbance of 600 nm, 630 nm, and 530 nm for E. coli, S. aureus, and C. albicans, respectively. The cell suspensions were adjusted to 103 cells/mL in Bacteriological Peptone (BP, KASVI, K25-611707) (for bacteria) or Brain Heart Infusion (BHI, KASVI, K25-610008) (for fungi). After 30 min sterilization by UV light, PHBV and PHBVTTO were added to the 48-well plate containing 300 µL of inoculum, followed by incubation at 37 °C for 24 hours. The microorganism’s growth inhibition was evaluated by measuring absorbance in the microplate reader (BioTek, Synergy H1 Hybrid Reader). The inoculum in the absence of any sample was used as a negative control of growth inhibition, while the inoculum containing 3 µL of TTO was used as a positive control. All experiments were carried out on quadruplicate in different days.
Polímeros, 33(1), e20230004, 2023 3/11
TTOPHBVTTOPHBVm mm = (1) ( ) TTOm Absorption eficiency % 100 % 2,69 mg =× (2)
Acl ε = (3)
( ) % mTTOt TTOreleased Absorptionefficiency ∑ = (4)
2.8.2 Nanofiber and microorganisms’ morphology after liquid growth inhibition assay
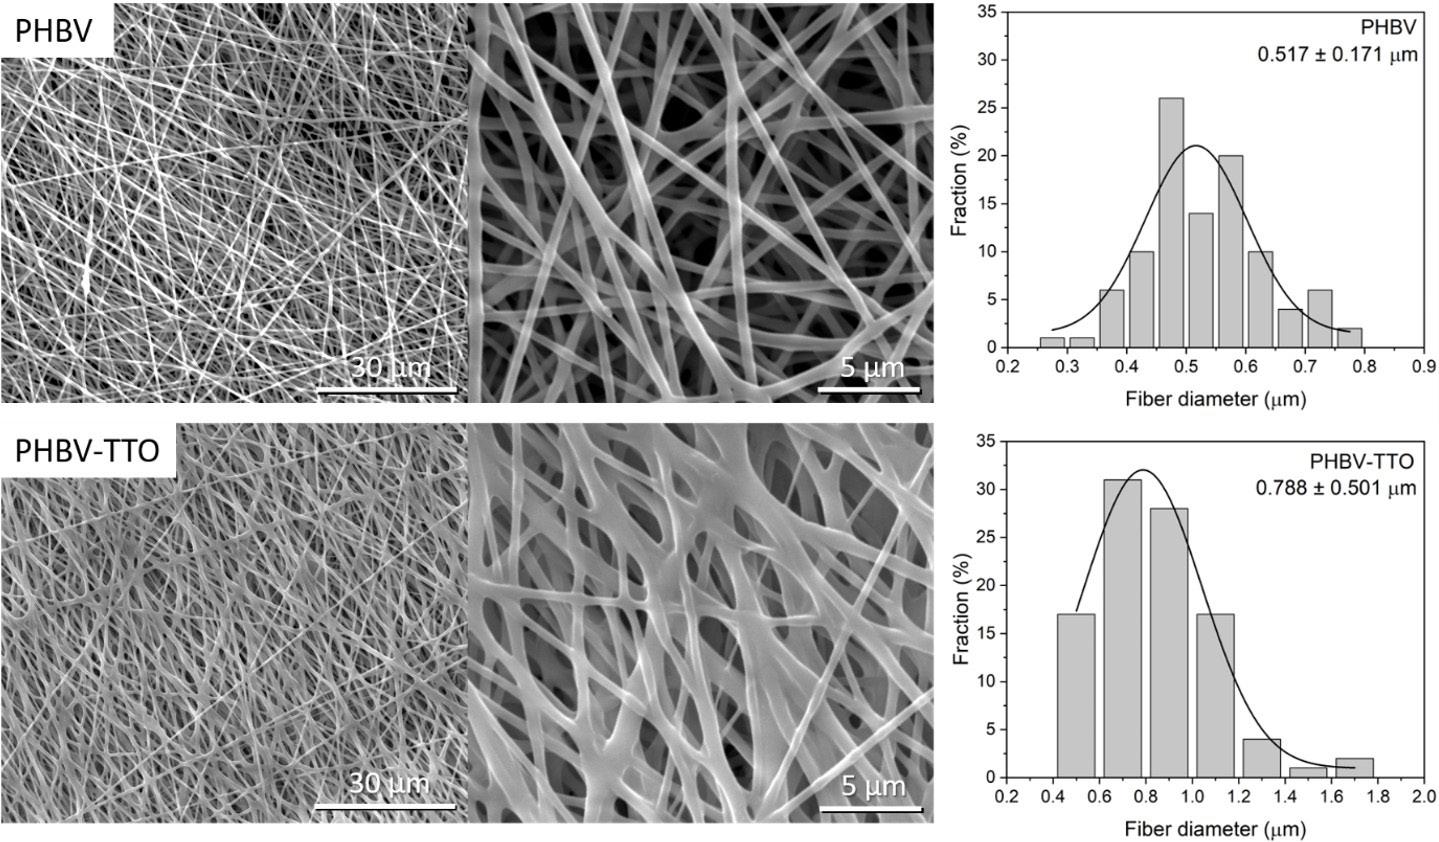
The interactions of the nanofibers with the microorganisms were evaluated by SEM after the fixation and dehydration process (n=3). Firstly, samples were carefully placed into a fresh plate and the microorganisms were fixed by methanol (100%) immersion. The samples were dehydrated at different increasing concentrations of ethanol (10, 25, 50, 75, and 90% for 20 min, and 100% for 1 hour) and dried overnight at room temperature[35]. The specimens were coated with gold (Sputtering Quorum Q150R ES) and observed through an SEM (FEI Inspect S50, Hillsboro, OR, USA) in high vacuum mode at 15.0 kV electron energy and at a 24.000 x magnification.
2.8.3 Agar diffusion assay
300 µL of inoculum at 106 cells/mL were dispersed on the plate surface of MHA (for bacteria) or BHI (for fungi). PHBV and PHBV-TTO nanofibers were carefully placed on the plate and incubated at 37 °C for 24 hours. The diameter of the inhibition zone nanofibers was measured using a digital caliper (Mitutoyo, CD-6” CX-B, São Paulo, Brazil). Filter paper disks of 5 mm were used to separately incorporate 3 µL of TTO used as a positive control of inhibition. As a negative control and to guarantee full microorganisms’ growth, plates containing only bacteria or fungi were used. The experiment was carried out in quadruplicate.
2.9 Cell viability
The cell viability assay was performed according to ISO 10993-12, being conducted by the extract method. For the obtention of extracts with a superficial area to the medium ratio of 6 mm2/mL, 15 nanofibers disks of 5mm2 were
inserted in 1 mL of Dulbecco’s Modified Eagle’s Medium (DMEM) supplemented with 10% (v/v) Fetal Bovine Serum (FBS) (DMEM 10%) followed by incubation for 24 hours (37 °C, 5% CO2) and filtration in Millipore 0.22 µm (n=3). Mouse Fibroblast Cell Line (L929) were cultured in DMEM 10%, seeded into 48-well plates (2,5 x 10⁴ cells per well), and incubated (37 °C, 5% CO2, 24 hours). The extracts of PHBV and PHBV-TTO (250 µL) were then inserted in triplicate into the 48-well plate and incubated. After 24 hours, the culture and extract medium was removed, and the well was washed with fresh Phosphate Buffered Saline (PBS). 400 µL of an MTT (3-(4,5 Dimethylthiazol-2-yl)2,5-Diphenyltetrazolium Bromide) solution (0.5 mg/mL) were added. After a 3 hours incubation period, the MTT solution was substituted with Dimethyl Sulfoxide (DMSO 20%) and solubilization of the formazan crystals was performed for 30 minutes. The absorbance of the formazan was then measured at 540 nm in a microplate reader (Synergy H1-Biotek). MEF L929 cells incubated with no sample were considered 100% of viability. The positive control consisted in 100 µL of L929 cells suspension and 150 µL of DMEM 10%, while the negative control of 250 µL DMSO 20%.
2.10 Statistical analysis
When required to discuss data, ANOVA and 2-sample t statistical test were performed at a level of significance of p < 0.05.
3. Results and Discussions
3.1 Morphology and diameter distribution
The morphology and diameter distribution of PHBV and PHBV-TTO nanofibers are given in Figure 1. PHBV exhibited
R.,
S. D.,
G. L.,
A. P.,
A. P.,
K.,
D. B.,
A. L. S., &
E. S. Polímeros, 33(1), e20230004, 2023 4/11
Santos, V.
Vera,
Cena,
Silva,
Lemes,
Conceição,
Tada,
Borges,
Trichês,
Figure 1. SEM images and fiber diameter distribution of PHBV and PHBV-TTO nanofibers.
Electrospun PHBV nanofiber containing Tea Tree Oil: physicochemical and antimicrobial activity
randomly oriented, homogeneous-sized, and bead-free nanofibers with a mean diameter of 0.517 ± 0.171 μm. The morphology of PHBV-TTO, however, revealed a different structure as the result of the evident essential oil absorption by the polymer and its spreading in the PHBV surface, which reflected in diameter increase to 0.788 ± 0.501 μm. When the essential oil is added to the polymer solution before the electrospinning, the outcome means diameter usually decreases due to the plasticizer effect typically induced[36,37] Once the essential oil was added after the electrospinning process, TTO was absorbed and covered the nanofibers, resulting in the increased mean diameter fiber.
3.2 Contact angle
To study the nanofibers’ wettability the contact angle was measured. As can be observed in Figure 2, the contact angle of PHBV (90.2 ± 6.2°) is significantly higher than PHBV-TTO nanofibers (48.6 ± 2.4°); with the addition of the essential oil, the contact angle decreased by approximately 54%. Once the PHBV contact angle is higher than 65°, its surface is considered to be hydrophobic[23], while PHBV-TTO
exhibited a hydrophilic character. This last result is against the expected, once the lipid nature of essential oils results in water droplets repulsion. Considering that rough surfaces tend to have a higher contact angle than smooth surfaces due to cavities and larger surface area, and that the TTO caused the flattering of the PHBV nanofiber surface due to its absorption and spreading, the result may be explained. Indeed, Figueroa-Lopez et al. (2019) also reported a decrease in contact angle with the addition of essential oils (oregano essential oil, rosemary extract, and green tea extract) in PHBV electrospun nanofibers and attributed this effect to the decrease in the surface tensions caused by the presence of oily molecules on the nanofiber surface[38]. Similarly, Unalan et al. (2019) reported a decrease in contact angle with the incorporation of clove essential oil in a nanofiber blend composed of poly(ε-caprolactone) and gelatin[39]
3.3 Fourier transformed infrared spectroscopy (FTIR)
Figure 3 shows the FTIR spectra of PHBV and PHBV-TTO nanofibers, where Figure 3a indicates the full range spectra, while Figure 3b shows the range between

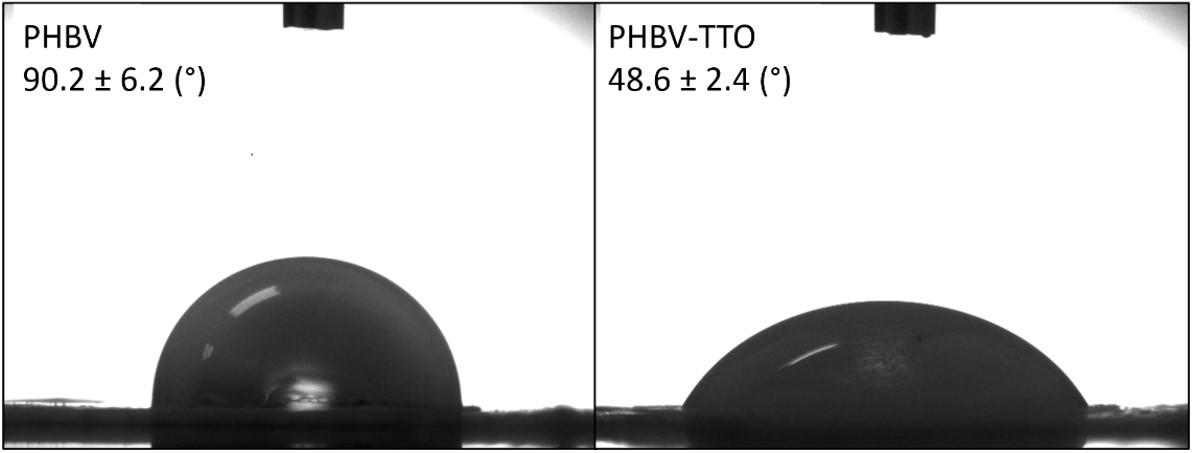
Polímeros, 33(1), e20230004, 2023 5/11
Figure 2. Water contact angle of the PHBV and PHBV-TTO nanofibers.
Figure 3. FTIR spectra of pure TTO, PHBV and PHBV-TTO. (a) 4000-400 cm-1 and (b) 2000-400 cm-1
2000 to 400 cm-1 to evidence PHBV bands. Pure TTO is reported to present infrared active bands at 780, 815, and 830 cm-1 from γ-terpinene and 799, 864, and 889 cm-1 from terpinene-4-ol[40]. These bands are readily observed in the IR spectra (dashed ellipse). Furthermore, the broad between 3620 and 3080 cm-1 is attributed to the O-H stretching vibration of terpene alcohols[41], while the bands in the 2900 cm-1 region correspond to its C-H stretching vibration[42]
PHBV spectra revealed the polymer characteristic bands. The stretching vibration of the C-H groups is observed in 2974 and 2935 cm-1, while its bending mode is shown in 1453 and 1380 cm-1[43]. The band at 1720 cm-1 is attributed to C=O stretching vibration, and the presence of an interval (1792-1700 cm-1) rather than a peak indicates the coexistence of an amorphous phase[7,13]. The anti-symmetrical stress vibration of the C-O-C bond is indicated by the bands at 1129, 1102, and 1054 cm-1, while this same group’s symmetrical stretching is observed in 981, 898, and 827 cm-1[7,43]
The main bands characteristic of γ-terpinene and terpinene-4-ol were not found in the PHBV-TTO obtained spectra, being probably hidden by PHBV which happens to have absorption bands in very close wavenumbers than TTO. Besides the presence of a large band positioned between 3620 and 3080 cm-1 (Figure 3a) and an intensity increase in the 3050-2800 cm-1 region, PHBV-TTO spectra reveal no significant change compared with the PHBV – although these suggest the TTO is effectively present in the polymer. Also, once no significant changes were observed comparing both spectra, it is safe to state no chemical reactions occurred between the polymer and the essential oil, and a physical interaction rather than a chemical took place.
3.4 Tea Tree Oil absorption efficiency
The absorption efficiency performed by mass change indicated a 5.08 ± 0.51% of TTO remaining in the nanofiber after the incorporation and the 48 hours of the drying process (134 μg or 0.145 μL). The volatile compounds of low molecular weight that comprehend the TTO composition are now absent in PHBV-TTO, while compounds of higher molecular weight and less volatile remain.
3.5 Tea Tree Oil release
The representative UV-vis spectra of the aliquots are shown in Figure 4a, while the essential oil cumulative release from PHBV-TTO nanofibers is observed in Figure 4b. As demonstrated by Figure 4a, the highest UV-vis absorption band appears at 204 nm and this wavelength was chosen for cumulative release studies. This absorption band is in agreement with other references[41]. The cumulative release of Tea Tree Oil from PHBV-TTO is shown in Figure 4b, where a progressive, slow, and controlled release is observed in the first 24 hours, followed by a minimal release at 48 hours. The results suggest the release of TTO deposited in the surface of the nanofiber, while in the next hours the release of the oil that was effectively absorbed and entrapped by the polymer. There is no statistical difference in the release measurements at 24 and 48 hours.
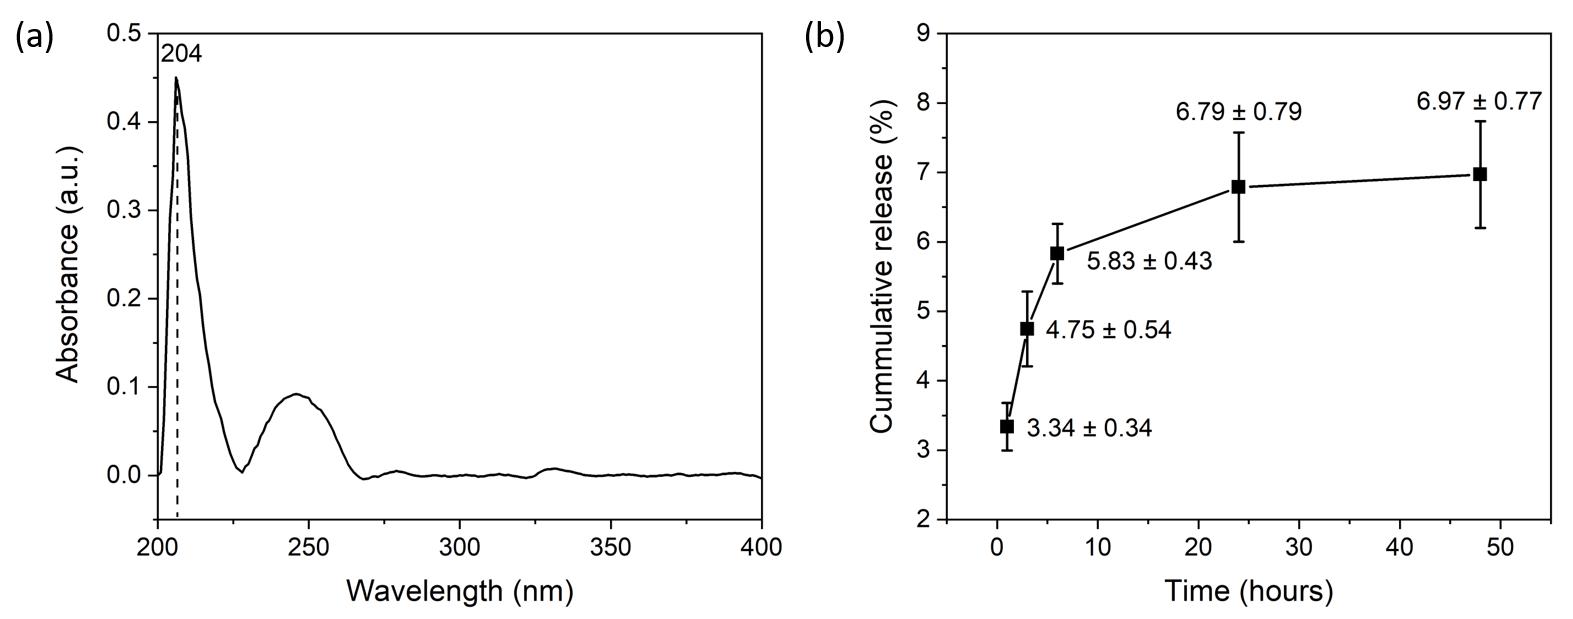
3.6 Antimicrobial assay
3.6.1
Microorganisms growth inhibition
The antimicrobial efficacy of PHBV and PHBV-TTO nanofiber compared with pure TTO (control +) was first investigated by liquid growth inhibition assay against E. coli (gram-negative bacteria), S. aureus (gram-positive bacteria), and C. albicans (fungi), as shown in Figure 5. Pure TTO was highly efficient against the three microorganisms, PHBV nanofiber exhibited great activity against the bacteria only, and PHBV-TTO revealed a similar behavior to pure oil; indicating the amount of oil released from the nanofiber was enough to promote antimicrobial activity.
As previously stated, the antimicrobial action of Tea Tree oil is attributable to its hydrophobicity, in which its lipids alter cell membrane balance turning it more permeable with inevitable cell wall rupture[25]. The TTO compounds play an important role in antimicrobial activity, majorly attributable to terpenes. Although 1,8-cineole is not as stronger against bacteria as terpinene-4-oil, it is agreed it collaborates with the cytoplasmic membrane permeabilization, facilitating the terpinene-4-ol action to promote damage and cell lysis[23,44]. According to the seller’s specifications, the TTO
P.,
K.,
D. B.,
A. L. S., &
E. S. Polímeros, 33(1), e20230004, 2023 6/11
Santos, V. R., Vera, S. D., Cena, G. L., Silva, A. P., Lemes, A.
Conceição,
Tada,
Borges,
Trichês,
Figure 4. (a) Representative UV-vis spectra from the aliquots and (b) cumulative release of TTO from PHBV-TTO nanofibers (1, 3, 6, 24, and 48 hours).
Electrospun PHBV nanofiber containing Tea Tree Oil: physicochemical and antimicrobial activity
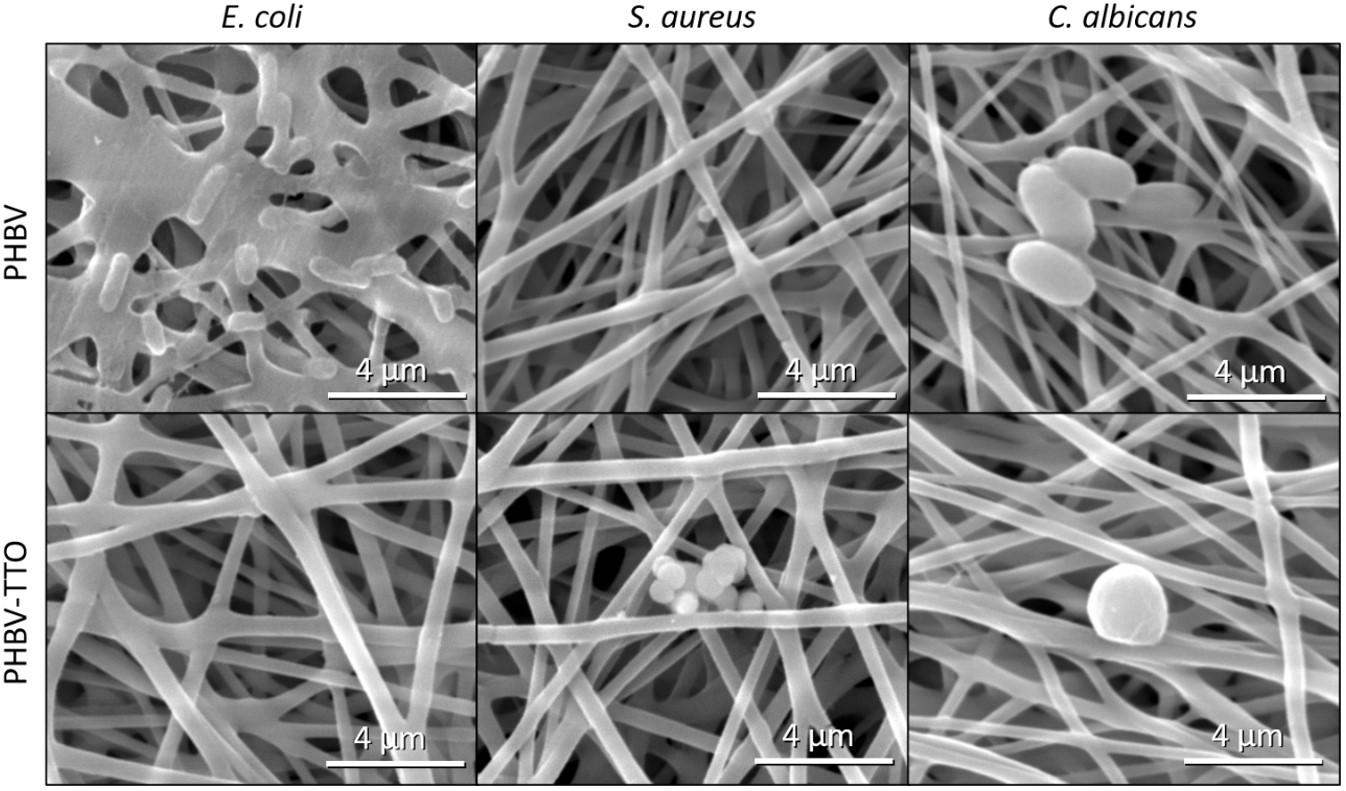
used has 42.3% of terpinene-4-oil, 19.4% of γ-terpineno, 8.5% of α-terpineno, 2.9% of 1,8-cineole, and a few other compounds in smaller content.
Silveira et al.[23] incorporated 1.5% of TTO into the polymeric solution to produce cassava starch cellulose nanofiber-based films and evaluated its efficacy against the same three microorganisms in this study. While a growth inhibition of 68 and 64% were evidenced for S. aureus and C. albicans, no activity was performed against E. coli when a TTO containing 60.42% terpinene-4-oil was used. Thus, not only the influence of the content of the compound was illustrated, but also the incorporation methodology. The stronger activity of the Tea Tree Oil together with the PHBV and the incorporation methodology reflected in the excellent inhibition growth observed in the liquid growth inhibition assay.
3.6.2 Nanofiber and microorganisms’ morphology after liquid growth inhibition assay
After the growth inhibition assay, the microorganisms were fixed to the nanofiber’s surfaces and observed by SEM, as in Figure 6. The microorganisms present their typical morphology; E. coli rods, S. aureus spheres and C. albicans pseudohyphae. Disregarding E. coli in the PHBV, there was general difficulty in finding the microorganisms on the samples, especially for PHBV-TTO. It is believed that due to the initial burst release of the essential oil in PHBV-TTO, differently from the PHBV nanofiber, the E. coli was rapidly inhibited and given no time for adhesion, as well as S. aureus and C. albicans
3.6.3 Agar diffusion assay
To further investigate the interactions of PHBV and PHBV-TTO nanofibers with the microorganisms, the agar diffusion assay was performed. The zone of inhibition generated is observed in Figure 7, and Table 1 summarizes the measured halo diameters. PHBV nanofiber presents limited activity compared with the growth inhibition assay; at higher concentrations of microorganisms, it firstly showed some zone of inhibition but few colonies are visible in the clear area after 24 hours for both bacteria, and no zone at all was observed for fungi. Thus, the antimicrobial activity of PHBV itself is limited according to the microorganism’s strain and concentration. When TTO is added (PHBV-TTO),

Polímeros, 33(1), e20230004, 2023 7/11
Figure 5. Growth inhibition of PHBV and PHBV-TTO against three strains.
Figure 6. Microorganisms’ morphology at PHBV and PHBV-TTO nanofibers after growth inhibition assay.
Strain PHBV PHBV-TTO TTO E. coli 7.45 ± 0.42 13.84 ± 1.33 21.63 ± 1.60 S. aureus 13.83 ± 1.59 * 13.68 ± 1.83 * 15.41 ± 1.52 C. albicans 0 10.13 ± 0.44 18.22 ± 1.53 *No significant difference (p>0.05 in 2-sample t).
Table 1. Zone of inhibition measurements (mm).
however, an increase in the activity of the membrane for E. coli (from 7.45 ± 0.42 mm to 13.84 ± 1.33 mm) (p<0.05 in 2-sample t) and C. albicans (from 0 mm to 10.13 ± 0.44 mm) (p<0.05 in 2-sample t) is observed and, although no significant difference in the zone of inhibition was noticed against S. aureus (p>0.05 in 2-sample t), no colonies were found in the clear area. The pure oil exhibited a higher zone of inhibition for all strains compared to the nanofibers (PHBV and PHBV-TTO), being effective against E. coli, then C. albicans and S. aureus, respectively – a reflection of the concentration used aiming to guarantee its efficacy as a negative control.
Few studies agree TTO is more active against gram-positive bacteria than gram-negative once the latter has an extra protective liposaccharide membrane[5], but here the opposite was found – probably due to the content of the active compound in the Tea Tree Oil composition. In PHBV-TTO, the essential oil amount released by the polymer was demonstrated to
be enough to promote antimicrobial action against E. coli and C. albicans, but a higher content is necessary to extend the activity to S. aureus
3.7 Cell viability assay
The cytotoxicity of the PHBV and PHBV-TTO nanofibers was evaluated by the MTT in vitro assay with L929 cells, as observed in Figure 8. Compared with L929 (positive control) cell viability, the one obtained for PHBV of 86.4% was considered non-cytotoxic while for PHBV-TTO of 33.5% is considered highly cytotoxic (cell viability < 70%) (ISO 10-993-5) reaching values close to the negative control DMSO 20% of 31.09%. Considering the essential oil release pattern (Figure 4), it is believed the initial burst release of TTO caused a negative impact on cell metabolism leading to its low viability. A considerable number of studies regarding the influence of TTO in the metabolism of different cell lines discuss cytotoxicity as a

Santos, V. R., Vera, S. D., Cena, G. L., Silva, A. P., Lemes, A. P., Conceição, K., Tada, D. B., Borges, A. L. S., & Trichês, E. S. Polímeros, 33(1), e20230004, 2023 8/11
Figure 7. Images of agar plates showing the PHBV, PHBV-TTO nanofibers and controls on E. coli, S. aureus and C. albicans
limiting factor in wound healing management, being closely related to its concentration, time of exposure, and main constituents’ content[45-47]. It is known that terpinene-4-ol is the main component responsible for the in vitro cell growth inhibition[45,48], while concentrations up to 1% (v/v)[46] and 10-1000 µg/mL[49] are reported to also perform this effect in a membrane-associated reaction similar to the already described antimicrobial mechanism[48]. Assmann et al.[47] performed an MTT assay on HFF-1 (human fibroblasts) cell line and found a high cytotoxic effect after a 24 hours exposure to 10-1000 µg/mL TTO concentrations, but after 72 hours at 300 µg/mL, however, cell proliferation was induced. In future investigations, the exposure time of PHBV-TTO to cells should be addressed to verify the occurrence of the same phenomena for L929 cells. As demonstrated, many factors should be considered when assessing the in vitro cytotoxicity of TTO, while in vivo the outcome may be quite different. The use of the essential oil in a dressing mode composed of pads and gauzes applied in S. aureus infected wounds in ten volunteers in a clinical study, however, demonstrated accelerated healing of abscessed wounds[30]. As noticed, there are great divergences and controversies related to the use of TTO in wound healing; while there is great concordance with respect to its excellent antimicrobial activity, the cytotoxicity of Tea Tree Oil is still a concern. Considering a hypothetical application of the PHBV-TTO nanofiber in an infected wound, it is believed the progressive release of the essential oil within the first 24 hours followed by minimal release from that time will inhibit further microorganisms’ growth while bringing no harm to healthy cells. Thus, after 24 hours, the PHBV-TTO nanofiber will behave just as pure PHBV, allowing cell proliferation and remodeling in extended periods of time with no further cytotoxicity.
4. Conclusions
In this work, a different method of essential oil incorporation on nanofibers for wound healing application was performed; rather than encapsulation, the oil was embedded by absorption on the polymer matrix. Nanofiber’s micrographs, contact angle measurements, and FTIR spectra indicate the presence of the
essential oil in the PHBV-TTO nanofiber. The absorption efficiency was proven to be around 5%, which corresponds to the less volatile compounds remaining after the drying period of 48 hours. The UV-vis analysis indicated a progressive TTO release from PHBV-TTO nanofiber until reaching 6.8% in the first 24 hours, corresponding to the oil deposited at the surface of the mat, followed by a minimal release at 48 hours as TTO was trapped inside the polymer. The growth inhibition and agar diffusion assays demonstrated the antimicrobial efficacy of not only the PHBV-TTO nanofiber, but also pure PHBV nanofiber (especially against the bacteria) – although no significative differences were shown for S. aureus between PHBV and PHBV-TTO nanofibers. The MTT assay performed in the nanofibers indicated the absence of cytotoxicity for PHBV alone, while when associated with the essential oil in PHBV-TTO, its release resulted in low cell viability. As a suggestion of application in wound healing and considering the set of characterizations performed, PHBV-TTO nanofiber may be used in an urgent action to manage wound infection, while no change of dressing will be necessary to promote tissue repair after 24 hours owing to the oil minimal release after this period. Overall, the results of this work suggest the absorption of Tea Tree oil by the PHBV generated a nanofiber with great potential to be used as an antimicrobial dressing.

5. Author’s Contribution
• Conceptualization – Eliandra de Sousa Trichês.
• Data curation – Verônica Ribeiro dos Santos.
• Formal analysis – Verônica Ribeiro dos Santos.
• Funding acquisition – Verônica Ribeiro dos Santos; Samara Domingues Vera; Eliandra de Sousa Trichês.
• Investigation – Verônica Ribeiro dos Santos; Samara Domingues Vera; Gabrielle Lupeti de Cena; Adrielle de Paula Silva.
• Methodology – Verônica Ribeiro dos Santos; Samara Domingues Vera; Gabrielle Lupeti de Cena; Adrielle de Paula Silva.
• Project administration – Eliandra de Sousa Trichês.
• Resources – Dayane Batista Tada; Kátia da Conceição; Ana Paula Lemes; Alexandre Luiz Souto Borges; Eliandra de Sousa Trichês.
• Software – NA.
• Supervision – Dayane Batista Tada; Kátia da Conceição; Ana Paula Lemes; Alexandre Luiz Souto Borges; Eliandra de Sousa Trichês.
• Validation – Verônica Ribeiro dos Santos.
• Visualization – Verônica Ribeiro dos Santos; Eliandra de Sousa Trichês.
• Writing – original draft – Verônica Ribeiro dos Santos.
• Writing – review & editing – Dayane Batista Tada; Kátia da Conceição; Ana Paula Lemes; Alexandre Luiz Souto Borges; Eliandra de Sousa Trichês.
6. Acknowledgements
The authors would like to thank FAPESP (2019/10877-3, 2020/04455-6 and 2019-19594-4) for the financial support
Electrospun PHBV
activity Polímeros, 33(1), e20230004, 2023 9/11
nanofiber containing Tea Tree Oil: physicochemical and antimicrobial
Figure 8. Cell viability percentage of PHBV and PHBV-TTO nanofibers after 24 hours incubation.
Santos, V. R., Vera, S. D., Cena, G. L., Silva, A. P., Lemes, A. P., Conceição, K., Tada, D. B., Borges, A. L. S., & Trichês, E. S.
to this work, and NAPCEM Multi-User Laboratory for the facilities.
7. References
1 Coelho, D. S., Valeirinho, B., Alberti, T., Maestri, A., Yunes, R., Dias, P. F., & Maraschin, M. (2018). Electrospinning technology: designing nanofibers toward wound healing application. In Clichini, S., Filip, A., & Nascimento, G. M. (Eds.), Nanomaterials - toxicity, human health and environment Croatia: IntechOpen http://dx.doi.org/10.5772/intechopen.81530
2 Moholkar, D. N., Sadalage, P. S., Peixoto, D., Paiva-Santos, A.-C., & Pawar, K. D. (2021). Recent advances in biopolymerbased formulations for wound healing applications. European Polymer Journal, 160, 110784 http://dx.doi.org/10.1016/j. eurpolymj.2021.110784
3 Sorg, H., Tilkorn, D. J., Hager, S., Hauser, J., & Mirastschijski, U. (2017). Skin wound healing: an update on the current knowledge and concepts. European Surgical Research, 58(1-2), 81-94 http://dx.doi.org/10.1159/000454919 PMid:27974711.
4. Pérez-Recalde, M., Ruiz Arias, I. E., & Hermida, É. B. (2018). Could essential oils enhance biopolymers performance for wound healing? A systematic review. Phytomedicine, 38, 57-65. http://dx.doi.org/10.1016/j.phymed.2017.09.024. PMid:29425655.
5 Mahmood, H., Khan, I. U., Asif, M., Khan, R. U., Asghar, S., Khalid, I., Khalid, S. H., Irfan, M., Rehman, F., Shahzad, Y., Yousaf, A. M., Younus, A., Niazi, Z. R., & Asim, M. (2021). In vitro and in vivo evaluation of gellan gum hydrogel films: assessing the co impact of therapeutic oils and ofloxacin on wound healing. International Journal of Biological Macromolecules, 166, 483-495 http://dx.doi.org/10.1016/j. ijbiomac.2020.10.206 PMid:33130262.
6 Negut, I., Dorcioman, G., & Grumezescu, V. (2020). Scaffolds for wound healing applications. Polymers, 12(9), 2010 http:// dx.doi.org/10.3390/polym12092010 PMid:32899245.
7. Dalgic, A. D., Koman, E., Karatas, A., Tezcaner, A., & Keskin, D. (2022). Natural origin bilayer pullulan-PHBV scaffold for wound healing applications. Biomaterials Advances, 134, 112554. http://dx.doi.org/10.1016/j.msec.2021.112554. PMid:35523643.
8 Keshvardoostchokami, M., Majidi, S. S., Huo, P., Ramachandran, R., Chen, M., & Liu, B. (2020). Electrospun nanofibers of natural and synthetic polymers as artificial extracellular matrix for tissue engineering. Nanomaterials (Basel, Switzerland), 11(1), 21 http://dx.doi.org/10.3390/nano11010021 PMid:33374248.
9. Chen, K., Hu, H., Zeng, Y., Pan, H., Wang, S., Zhang, Y., Shi, L., Tan, G., Pan, W., & Liu, H. (2022). Recent advances in electrospun nanofibers for wound dressing. European Polymer Journal, 178, 111490. http://dx.doi.org/10.1016/j. eurpolymj.2022.111490
10 De Luca, I., Pedram, P., Moeini, A., Cerruti, P., Peluso, G., Di Salle, A., & Germann, N. (2021). Nanotechnology development for formulating essential oils in wound dressing materials to promote the wound-healing process: a review. Applied Sciences (Basel, Switzerland), 11(4), 1713 http://dx.doi.org/10.3390/ app11041713
11 Xue, J., Wu, T., Dai, Y., & Xia, Y. (2019). Electrospinning and electrospun nanofibers: methods, materials, and applications. Chemical Reviews, 119(8), 5298-5415. http://dx.doi.org/10.1021/ acs.chemrev.8b00593 PMid:30916938.
12 Liao, Y., Loh, C.-H., Tian, M., Wang, R., & Fane, A. G. (2017). Progress in electrospun polymeric nanofibrous membranes for water treatment: Fabrication, modification and applications. Progress in Polymer Science, 77 , 69 -94 http://dx.doi. org/10.1016/j.progpolymsci.2017.10.003
13 Mutlu, G., Calamak, S., Ulubayram, K., & Guven, E. (2018). Curcumin-loaded electrospun PHBV nanofibers as potential
wound-dressing material. Journal of Drug Delivery Science and Technology, 43, 185-193. http://dx.doi.org/10.1016/j. jddst.2017.09.017
14 Braga, N. F., Vital, D. A., Guerrini, L. M., Lemes, A. P., Formaggio, D. M. D., Tada, D. B., Arantes, T. M., & Cristovan, F. H. (2018). PHBV-TiO 2 mats prepared by electrospinning technique: physico-chemical properties and cytocompatibility. Biopolymers, 109(5), e23120 http://dx.doi.org/10.1002/ bip.23120 PMid:29704425.
15 Montanheiro, T. L. A., Montagna, L. S., Patrulea, V., Jordan, O., Borchard, G., Lobato, G. M. M., Catalani, L. H., & Lemes, A. P. (2019). Evaluation of cellulose nanocrystal addition on morphology, compression modulus and cytotoxicity of poly(3hydroxybutyrate-co-3-hydroxyvalerate) scaffolds. Journal of Materials Science, 54(9), 7198-7210 http://dx.doi.org/10.1007/ s10853-019-03398-8
16 Bacakova, L., Pajorova, J., Zikmundova, M., Filova, E., Mikes, P., Jencova, V., Kostakova, E. K., & Sinica, A. (2019). Nanofibrous scaffolds for skin tissue engineering and wound healing based on nature-derived polymers. In: Khalil, I. A. H. (Ed.), Current and future aspects of nanomedicine Croatia: IntechOpen. doi:http://dx.doi.org/10.5772/intechopen.88602
17 Zonari, A., Martins, T. M. M., Paula, A. C. C., Boeloni, J. N., Novikoff, S., Marques, A. P., Correlo, V. M., Reis, R. L., & Goes, A. M. (2015). Polyhydroxybutyrate-co-hydroxyvalerate structures loaded with adipose stem cells promote skin healing with reduced scarring. Acta Biomaterialia, 17, 170-181 http:// dx.doi.org/10.1016/j.actbio.2015.01.043 PMid:25662911.
18. Han, I., Shim, K. J., Kim, J. Y., Im, S. U., Sung, Y. K., Kim, M., Kang, I.-K., & Kim, J. C. (2007). Effect of Poly(3hydroxybutyrate-co-3-hydroxyvalerate) Nanofiber Matrices Cocultured With Hair Follicular Epithelial and Dermal Cells for Biological Wound Dressing. Artificial Organs, 31(11), 801-808. http://dx.doi.org/10.1111/j.1525-1594.2007.00466.x. PMid:18001389.
19 Edwards, R., & Harding, K. G. (2004). Bacteria and wound healing. Current Opinion in Infectious Diseases, 17(2), 9196 http://dx.doi.org/10.1097/00001432-200404000-00004 PMid:15021046.
20 Labib, R. M., Ayoub, I. M., Michel, H. E., Mehanny, M., Kamil, V., Hany, M., Magdy, M., Moataz, A., Maged, B., & Mohamed, A. (2019). Appraisal on the wound healing potential of Melaleuca alternifolia and Rosmarinus officinalis L. essential oil-loaded chitosan topical preparations. PLoS One, 14(9), e0219561 http://dx.doi.org/10.1371/journal.pone.0219561 PMid:31525200.
21 Abdellatif, M. M., Elakkad, Y. E., Elwakeel, A. A., Allam, R. M., & Mousa, M. R. (2021). Formulation and characterization of propolis and tea tree oil nanoemulsion loaded with clindamycin hydrochloride for wound healing: in-vitro and in-vivo wound healing assessment. Saudi Pharmaceutical Journal, 29(11), 1238-1249 http://dx.doi.org/10.1016/j.jsps.2021.10.004 PMid:34819785.
22 Michalak, M. (2022). Plant-derived antioxidants: significance in skin health and the ageing process. International Journal of Molecular Sciences, 23(2), 585. http://dx.doi.org/10.3390/ ijms23020585 PMid:35054770.
23. Silveira, M. P., Silva, H. C., Pimentel, I. C., Poitevin, C. G., Stuart, A. K. C., Carpiné, D., Jorge, L. M. M., & Jorge, R. M. M. (2020). Development of active cassava starch cellulose nanofiber‐based films incorporated with natural antimicrobial tea tree essential oil. Journal of Applied Polymer Science, 137(21), 48726 http://dx.doi.org/10.1002/app.48726
24 Rubianti, M. A., Ervianti, E., Listiawan, M. Y., Indramaya, D. M., Rahmadewi, R., Hendradi, E., & Prakoeswa, C. R. S. (2021). Efficacy of 5% tea tree oil hydrogel on healing morbus Hansen’s Chronic Plantar Ulcer. Berkala Ilmu Kesehatan Kulit
Polímeros, 33(1), e20230004, 2023 10/11
Electrospun PHBV nanofiber containing Tea Tree Oil: physicochemical and antimicrobial activity
Dan Kelamin, 33(1), 28-33 http://dx.doi.org/10.20473/bikk. V33.1.2021.28-33.
25 Francisconi, R. S., Huacho, P. M. M., Tonon, C. C., Bordini, E. A. F., Correia, M. F., Sardi, J. C. O., & Spolidorio, D. M. P. (2020). Antibiofilm efficacy of tea tree oil and of its main component terpinen-4-ol against Candida albicans. Brazilian Oral Research, 34, e050 http://dx.doi.org/10.1590/18073107bor-2020.vol34.0050 PMid:32578760.
26 Hayes, A. J., & Markovic, B. (2002). Toxicity of Australian essential oil Backhousia citriodora (Lemon myrtle). Part 1. Antimicrobial activity and in vitro cytotoxicity. Food and Chemical Toxicology, 40(4), 535-543 http://dx.doi.org/10.1016/ S0278-6915(01)00103-X PMid:11893412.
27 Lee, J. Y., Lee, J., Ko, S. W., Son, B. C., Lee, J. H., Kim, C. S., & Park, C. H. (2020). Fabrication of antibacterial nanofibrous membrane infused with essential oil extracted from tea tree for packaging applications. Polymers, 12(1), 125. http://dx.doi. org/10.3390/polym12010125 PMid:31948088.
28. Nepomuceno, N. C., Barbosa, M. A., Bonan, R. F., Oliveira, J. E., Sampaio, F. C., & Medeiros, E. S. (2018). Antimicrobial activity of PLA/PEG nanofibers containing terpinen-4-ol against Aggregatibacter actinomycetemcomitans. Journal of Applied Polymer Science, 135(6), 45782 http://dx.doi.org/10.1002/ app.45782
29 Amer, S. S., Mamdouh, W., Nasr, M., ElShaer, A., Polycarpou, E., Abdel-Aziz, R. T. A., & Sammour, O. A. (2022). Quercetin loaded cosm-nutraceutical electrospun composite nanofibers for acne alleviation: Preparation, characterization and experimental clinical appraisal. International Journal of Pharmaceutics, 612, 121309 http://dx.doi.org/10.1016/j.ijpharm.2021.121309
PMid:34801653.
30 Chin, K. B., & Cordell, B. (2013). The effect of tea tree oil (Melaleuca alternifolia) on wound healing using a dressing model. Journal of Alternative and Complementary Medicine (New York, N.Y.), 19(12), 942-945 http://dx.doi.org/10.1089/ acm.2012.0787 PMid:23848210.
31 Zhang, W., Huang, C., Kusmartseva, O., Thomas, N. L., & Mele, E. (2017). Electrospinning of polylactic acid fibres containing tea tree and manuka oil. Reactive & Functional Polymers, 117, 106-111 http://dx.doi.org/10.1016/j.reactfunctpolym.2017.06.013
32 Turek, C., & Stintzing, F. C. (2013). Stability of essential oils: a review. Comprehensive Reviews in Food Science and Food Safety, 12(1), 40-53 http://dx.doi.org/10.1111/1541-4337.12006
33 Bessa, L. J., Fazii, P., Di Giulio, M., & Cellini, L. (2015). Bacterial isolates from infected wounds and their antibiotic susceptibility pattern: some remarks about wound infection. International Wound Journal, 12(1), 47-52 http://dx.doi. org/10.1111/iwj.12049 PMid:23433007.
34 Gil, J., Solis, M., Higa, A., & Davis, S. C. (2022). Candida albicans Infections: a novel porcine wound model to evaluate treatment efficacy. BMC Microbiology, 22(1), 45. http://dx.doi. org/10.1186/s12866-022-02460-x PMid:35120444.
35. Costa, A. C. B. P., Rasteiro, V. M. C., Pereira, C. A., Hashimoto, E. S. H. S., Beltrame, M., Jr., Junqueira, J. C., & Jorge, A. O. C. (2011). Susceptibility of Candida albicans and Candida dubliniensis to erythrosine- and LED-mediated photodynamic therapy. Archives of Oral Biology, 56(11), 1299-1305 http:// dx.doi.org/10.1016/j.archoralbio.2011.05.013 PMid:21704304.
36 Mori, C. L. S. O., Passos, N. A., Oliveira, J. E., Altoé, T. F., Mori, F. A., Mattoso, L. H. C., Scolforo, J. R., & Tonoli, G. H. D. (2015). Nanostructured polylactic acid/candeia essential oil mats obtained by electrospinning. Journal of Nanomaterials, 2015, 439253 http://dx.doi.org/10.1155/2015/439253
37 Unalan, I., Slavik, B., Buettner, A., Goldmann, W. H., Frank, G., & Boccaccini, A. R. (2019). Physical and antibacterial properties of peppermint essential oil loaded poly (ε-caprolactone) (PCL) electrospun fiber mats for wound healing. Frontiers
in Bioengineering and Biotechnology, 7, 346 http://dx.doi. org/10.3389/fbioe.2019.00346 PMid:32039166.
38. Figueroa-Lopez, K. J., Vicente, A. A., Reis, M. A. M., TorresGiner, S., & Lagaron, J. M. (2019). Antimicrobial and antioxidant performance of various essential oils and natural extracts and their incorporation into biowaste derived poly(3-hydroxybutyrateco-3-hydroxyvalerate) layers made from electrospun ultrathin fibers. Nanomaterials (Basel, Switzerland), 9(2), 144 http:// dx.doi.org/10.3390/nano9020144 PMid:30678126.
39. Unalan, I., Endlein, S. J., Slavik, B., Buettner, A., Goldmann, W. H., Detsch, R., & Boccaccini, A. R. (2019). Evaluation of electrospun poly(ε-caprolactone)/gelatin nanofiber mats containing clove essential oil for antibacterial wound dressing. Pharmaceutics , 11 (11), 570 http://dx.doi.org/10.3390/ pharmaceutics11110570 PMid:31683863.
40 Rytwo, G., Zakai, R., & Wicklein, B. (2015). The use of ATR-FTIR spectroscopy for quantification of adsorbed compounds. Journal of Spectroscopy, 727595, 1-8 http:// dx.doi.org/10.1155/2015/727595
41 Zhang, S., Chen, J., Yin, X., Wang, X., Qiu, B., Zhu, L., & Lin, Q. (2017). Microencapsulation of tea tree oil by spray-drying with methyl cellulose as the emulsifier and wall material together with chitosan/alginate. Journal of Applied Polymer Science, 134(13), 44662 http://dx.doi.org/10.1002/app.44662
42 Cui, H., Bai, M., Li, C., Liu, R., & Lin, L. (2018). Fabrication of chitosan nanofibers containing tea tree oil liposomes against Salmonella spp. in chicken. Lebensmittel-Wissenschaft + Technologie, 96, 671-678. http://dx.doi.org/10.1016/j. lwt.2018.06.026
43 Bai, J., Dai, J., & Li, G. (2015). Electrospun composites of PHBV/ pearl powder for bone repairing. Progress in Natural Science, 25(4), 327-333. http://dx.doi.org/10.1016/j.pnsc.2015.07.004.
44 Lee, C.-J., Chen, L.-W., Chen, L.-G., Chang, T.-L., Huang, C.-W., Huang, M.-C., & Wang, C.-C. (2013). Correlations of the components of tea tree oil with its antibacterial effects and skin irritation. Journal of Food and Drug Analysis, 21(2), 169-176 http://dx.doi.org/10.1016/j.jfda.2013.05.007
45 Hayes, A. J., Leach, D. N., Markham, J. L., & Markovic, B. (1997). In vitro Cytotoxicity of Australian Tea Tree Oil using Human Cell Lines. The Journal of Essential Oil Research, 9(5), 575-582 http://dx.doi.org/10.1080/10412905.1997.9700780
46 Homeyer, D. C., Sanchez, C. J., Mende, K., Beckius, M. L., Murray, C. K., Wenke, J. C., & Akers, K. S. (2015). In Vitro activity of Melaleuca alternifolia (tea tree) oil on filamentous fungi and toxicity to human cells. Medical Mycology, 53(3), 285294 http://dx.doi.org/10.1093/mmy/myu072 PMid:25631479.
47 Assmann, C. E., Cadoná, F. C., Bonadiman, B. S. R., Dornelles, E. B., Trevisan, G., & Cruz, I. B. M. (2018). Tea tree oil presents in vitro antitumor activity on breast cancer cells without cytotoxic effects on fibroblasts and on peripheral blood mononuclear cells. Biomedicine and Pharmacotherapy, 103, 1253-1261 http://dx.doi.org/10.1016/j.biopha.2018.04.096 PMid:29864906.
48 Calcabrini, A., Stringaro, A., Toccacieli, L., Meschini, S., Marra, M., Colone, M., Salvatore, G., Mondello, F., Arancia, G., & Molinari, A. (2004). Terpinen-4-ol, the main component of melaleuca alternifolia (tea tree) oil inhibits the in vitro growth of human melanoma cells. The Journal of Investigative Dermatology, 122(2), 349-360 http://dx.doi.org/10.1046/j.0022202X.2004.22236.x PMid:15009716.
49. Söderberg, T. A., Johansson, A., & Gref, R. (1996). Toxic effects of some conifer resin acids and tea tree oil on human epithelial and fibroblast cells. Toxicology, 107(2), 99-109 http://dx.doi. org/10.1016/0300-483X(95)03242-8. PMid:8599176.
Received: Aug. 29, 2022
Revised: Jan. 23, 2023
Accepted: Feb. 17, 2023
Polímeros, 33(1), e20230004, 2023 11/11
Crystallization and fusion kinetics of Poly(butylene terephthalate)/Titanium Dioxide
José Vinícius Melo Barreto1 , Antônio Anderson da Silva Gomes1
,
Amanda Meneses Araújo1
, Andreas
Ries2
, Janetty Jany Pereira
Barros3* and Renate Maria Ramos Wellen1,3
1Departamento de Engenharia de Materiais, Universidade Federal da Paraíba – UFPB, João Pessoa, PB, Brasil
2Centro Multidisciplinario de Investigaciones Tecnológicas, Universidad Nacional de Asunción, Campus Universitario San Lorenzo, San Lorenzo, Paraguay
3Unidade Acadêmica de Engenharia de Materiais, Universidade Federal de Campina Grande – UFCG, Campina Grande, PB, Brasil
*janetty_b@hotmail.com
Obstract
In this paper, the crystallization, fusion, and activation energy (Ea) of PBT/TiO2 were thoroughly evaluated using DSC. Increasing the rates shifted the peaks of melt crystallization to lower temperatures while the fusions were almost unaffected. TiO2 hindered the melt crystallization of PBT and lower crystallization rates, i.e., CMAX and K’ were acquired, in general, the crystallinity degree (Xc) was 4% higher in PBT/TiO2 which is in the marginal error. PseudoAvrami and Mo models were applied to evaluate the melt crystallization kinetics; both fitted the melt crystallization quite well; deviations were observed at the beginning and the crystallization end most due to the nucleation and spherulites impingement during the secondary crystallization. Ea was evaluated using the Friedman model, considering the values of Ea less energy has to be removed from PBT/TiO2 when compared to PBT, specifically at 1% of TiO2.
Keywords: activation energy, kinetics, PBT, phase transition, TiO2
How to cite: Barreto, J. V. M., Gomes, A. A. S., Araújo, A. M., Ries, A., Barros, J. J. P., & Wellen, R. M. R. (2023).
Crystallization and fusion kinetics of Poly(butylene terephthalate)/Titanium Dioxide. Polímeros: Ciência e Tecnologia, 33(1), e20230006.
https://doi.org/10.1590/0104-1428.20220087
1. Introduction
Polyesters are plastic resins widely used in sundry industrial applications, from the general goods as commodities to the sophisticated products with high technological performance and added value. These resins contribute for almost 18% of the world’s polymer production[1]. Among them, one of the most important is poly(butylene terephthalate) (PBT), a thermoplastic, semi-crystalline with excellent processing properties. Its high chemical, thermal and mechanical performances make PBT a potential candidate for many applications in science and technology[2-7]
Literature has reported the crystallization kinetics of PBT upon additives and fillers addition, the second phase addition may promote the heterogeneous nucleation and reduce the crystallization time, speeding up its general processing[8] However, other properties can be achieved, such as significant improvement in the mechanical properties[9], antistatic and super-strength characters[10] are examples of synergistic PBT compounds, filled with aluminum oxide (Al2O3), epoxide elastomers and carbon nanotubes, for instance.
In order to improve polymers’ properties, additives and fillers are commonly added. For instance, Titanium dioxide (TiO2) which is used due to its high thermal and chemical stability, non-toxicity, photo-catalytic character
and antibacterial action, for instance[11,12], the addition of TiO2 to the compounds may increase the solar reflectance[13], rigidity[14], tenacity[15], synthesize films[16] and increases the degree of crystallinity[17]. Due to these great achievements, adding TiO2 can be attractive aiming at higher PBT performance, therefore in this work, PBT was doped with TiO2, in amounts ranging from 0 to 10% of the weight. Afterwards, the phase transitions, i.e., crystallization and melting were investigated.
Zhou et al.[18] reported TiO2 effect in nanocomposites of poly(butene 2,5-furan dicarboxylate) (PBF), a biologicalbased polyester similar to PBT, at concentrations up to 7% of the weight; TiO2 acted as a nucleating agent accelerating the crystallization as well as improving UV resistance. In the present work, as later on discussed at low PBT/TiO2 contents (1% wt) there was no nucleating effect, suggesting that the deterrent effect of TiO2’s solid particles was greater than the nucleation ability into PBT matrix during the melt crystallization[5], investigation of the crystallization kinetics and energetic measurements are presented contributing to scientific and technological databases.
Crystallization and fusion of PBT and PBT/TiO2 composites were recorded using differential scanning calorimetry (DSC)
https://doi.org/10.1590/0104-1428.20220087 O O O O O O O O O O O O O O O Polímeros, 33(1), e20230006, 2023 ISSN 1678-5169 (Online) 1/12
through non-isothermal scans, and applying several heating/ cooling rates. Crystallization kinetics was evaluated using Pseudo-Avrami and Mo models, measured discrepancies are provided validating the modeling. Additionally, this work reports the activation energy evaluations for crystallization and fusion processes, a methodology rarely reported. The activation energy for the melt crystallization was computed using the Friedman isoconversional model[19]. Regarding the activation energy of fusion, Toda et al. [20] suggested a model for polymer fusion, considering the geometry of melting cylindrical rods, however, the literature reports that for cases of sample overheating during fusion, the most robust isoconversional models for calculation of the crystallization activation energy are also suitable for the evaluation of the activation energy of the fusion, therefore Friedman’s isoconversional method was applied in this work[21]. Based on our database, the kinetics of crystallization and its modeling discrepancies, as well as the activation energies evaluation for PBT/ TiO2, have been rarely reported for polymers composites.
2. Materials and Methods
2.1 Materials
PBT 195 Valox was supplied by Sabic company (Bergen op zoom Netherlands), with density of 1.31 g cm-3. TiO2 was purchased from Evonik Degussa Co. with surface area of 50 m2/g and a 75:25 ratio of anatase and rutile, with an average crystal size of 25 to 94 nm.
2.2 Compounding
PBT compounds with 1, 5, and 10% of the weight of TiO2 were prepared in a Haake Rheomix 600 (Germany) laboratory internal mixer fitted with high-intensity rotors type rollers, at 240 °C, 60 rpm during 10 min.
2.3 Scanning electron microscopy (SEM)
Scanning electron microscopy images were captured using a LEO 1430 unit, from Zeiss (USA). The specimens were previously fractured in liquid nitrogen to avoid plastic deformation, afterwards, coated with a carbon layer aiming to avoid the charges accumulation.
2.4 Differential scanning calorimetry
The phase transitions, i.e., crystallization and fusion, as well as the thermal properties were monitored with a DSC Q20 from TA Instruments (USA). Specimens weighing approximately 3 mg were experimented in closed aluminum pans under nitrogen gas flow of 50 mL/min. The applied thermal cycle consisted of: heating from 25 °C to 270 °C, isotherm at 270 °C for 3 minutes, cooling from 270 °C to 20 °C and re-heating from 20 °C to 270 °C using constant heating/cooling/reheating rates of 5, 10, 20, and 30 °C/min. Figure 1 displays a typical DSC scan together with an applied thermal cycle illustrated as a dotted red line. The investigated phase transitions are presented and coded as F1: first fusion; C1: melt crystallization; and F2: second fusion.
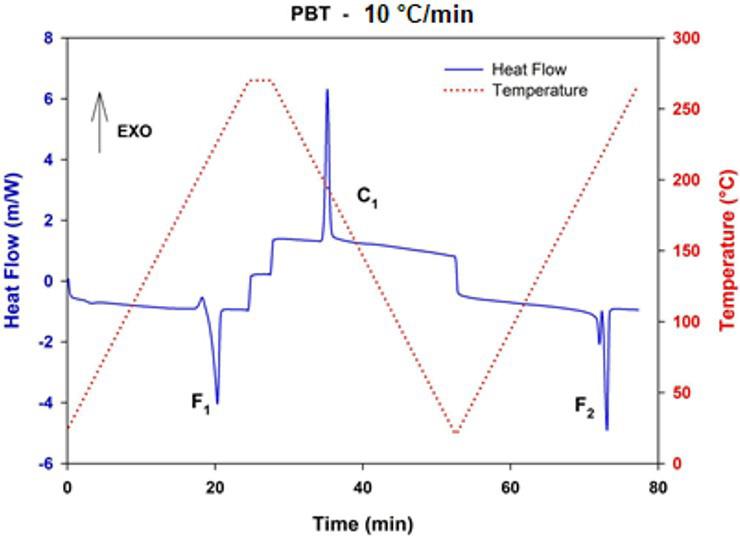
2.5 Integration and conversion during crystallization and fusion measurements
The crystallizable mass conversion during crystallization or fusion, x = x (t), was estimated using Equation 1, through the energy flow between the starting and ending points previously defined.
where: J is the heat flow of the phase transition and ' the time for partial conversion; J0 is an adequate baseline and E0 (Equation 2) refers to the total exchanged heat between the specimen and the neighborhood during the event[22]
the crystallization or fusion rate c = c (t) was computed using Equation 3[22]
The degree of crystallinity Xc developed during the event was evaluated using Equation 4:
In this work, the equilibrium melting enthalpy used for PBT was 140 J/g and the equilibrium melting temperature was 0 226 m TC =° [23]
3. Results and Discussions
3.1 Scanning electron microscopy image (SEM)
Figure 2 shows SEM image of PBT/10% TiO2 where the white dots are TiO2 which are well dispersed in PBT
Polímeros, 33(1), e20230006, 2023 2/12
Barreto, J. V. M., Gomes, A. A. S., Araújo, A. M., Ries, A., Barros, J. J. P., & Wellen, R. M. R.
( ) ( ) ( ) 1 1 ' '' t t xtJttdt Eo = ∫ (1)
( ) ( ) 2 1 00 t t EJtJtdt =− ∫ (2)
( ) ( ) ( ) 0 0 JtJt dx ct dtE ==
(3)
( ) 0 * 100 % c m H X H ∆ = ∆ (4)
Figure 1. Typical DSC scan for PBT collected during applied thermal cycles with the heating/cooling/re-heating of 10 oC/min. The dotted red line is the applied thermal program. The solid blue line the heat flow signal with the investigated phase transitions, i.e., F1, C1, and F2
Crystallization and fusion kinetics of Poly(butylene terephthalate)/Titanium Dioxide
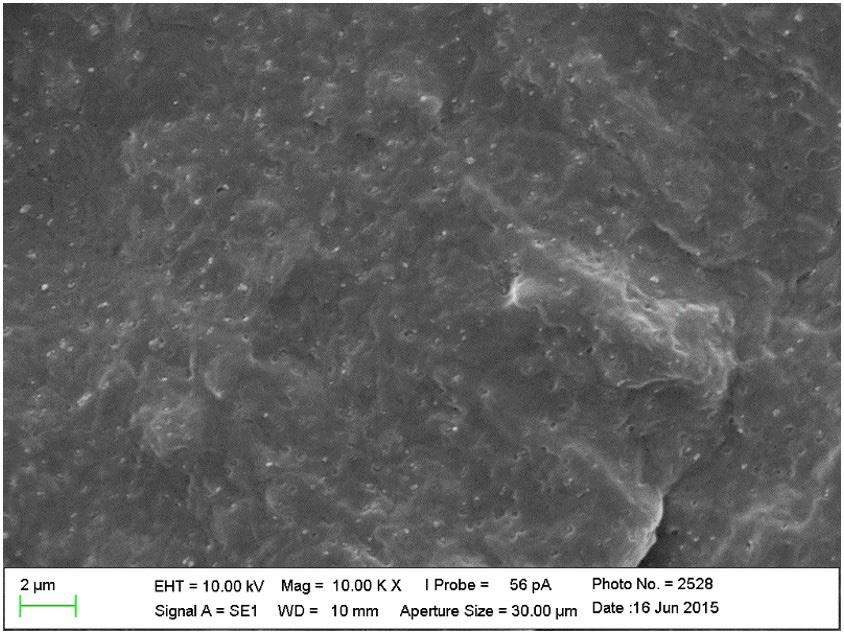
matrix as a result of the proper compounding parameters. The applied magnification was 10.000 x.
3.2 Melt crystallization (C1) measurements
Relative crystallinity (Xrel) and crystallization rate (d x/dt) as temperature functions for PBT and PBT/1% TiO2 using the investigated cooling rates are displayed in Figure 3 The Supplementary Material presents plots for PBT/5% TiO2, and PBT/10% TiO2 (please see Figure S3 and S4).
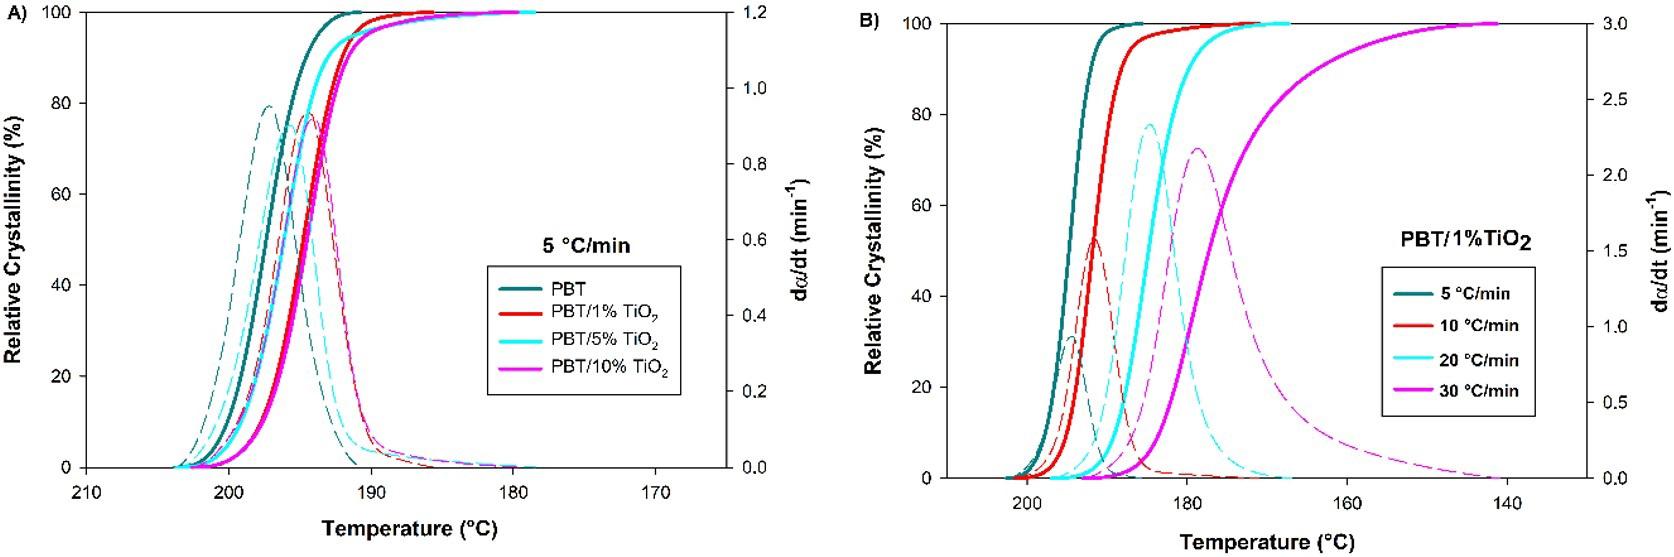
Sigmoidal behavior was verified for Xrel plots in Figure 3a and 3b characterizing the phase transition without discontinuities, commonly observed in polymers[24]. The dα/dt showed bell shape, increasing at the beginning of crystallization which is related to nucleation and primary crystallization, reaching the top and decreasing afterwards configuring the secondary crystallization and spherulites impingement[25]
Sigmoids obtained from the higher cooling rates are displaced to lower temperatures due to the time effect, i.e., upon higher cooling rates exists less time for the nucleation, and crystal growth occurs at lower temperatures [26] The crystallization rates increase for the higher cooling
rates as may be confirmed from the heights of the bellshaped curves. Quantitative data for the crystallization rates is tabled in the Supplementary Material (Table S1). Concerning the TiO2 addition in general, sigmoids of PBT/ TiO2 were displaced to lower temperatures, nevertheless, the filler effect is nonlinear, and this topic is further discussed in terms of activation energy.
3.3 First (F1) and second (F2) fusion measurements
Figure 4a and b presents the sigmoids collected for F1 and F2, respectively, the corresponding melting rates are also shown within the plots. In general, the fusion is less sensitive to the heating rates and TiO2 addition which is evidenced as subtle bell peaks displacement. During the first fusion, both compounds presented quite similar melting rates and molten fraction profiles, light dissimilarity was verified for PBT/ 10% TiO2 that melted in a lower temperature range. The readers may find additional molten fraction plots in the Supplementary Material, please see Figure S2 and Figure S8.
Regarding F2, the investigated compounds presented quite similar sigmoid and melting profiles, nevertheless, contrarily to F1, F2 peaks displayed complex character which may be linked to distinct morphologies and crystals perfection[27]; it seems there are smaller/imperfect crystals that melt in the temperature range from 200 to 220 oC while the most perfect/bigger melt between 220 and 240 oC[28,29] It is supposed there was crystal reordering during the melt crystallization and second heating which promoted the development of higher perfected crystals, similar trend is reported in the literature for PP, PET, Nylon 1212[30-32], for instance. Apparently, TiO2 addition did not significantly change the F2 trend, however during F2 higher melting rates were verified suggesting easier melting, deeper discussion related to this topic and its relationship with the activation energy for melting is further on presented.
The degrees of crystallinity computed for F1 and F2 are displayed in Figure 5. In general, Xc decreased with increasing the heating rate, specifically for the heating rates higher than 10 oC/min, since for higher heating rates there is reduced time for the crystal formation. The thermal environment changes rapidly hindering or interfering in the crystals’ nucleation and growth, hence producing shorter or imperfect crystallites[33].
Polímeros, 33(1), e20230006, 2023 3/12
Figure 2. Scanning electron microscopy image of PBT/10% TiO2, as obtained after compounding
Figure 3. Plots for the relative crystallinity (solid line) and crystallization rate (dashed line) as temperature function. (A) Fixed cooling rate of 5 °C/min and (B) composition of 1% de TiO2 cooled at different rates.
Regarding TiO2 addition, the composites presented a slight increase in Xc, i.e., approximately 4% higher.
3.4 Melt crystallization kinetics – Pseudo Avrami
Aiming to further analyzing the non-isothermal melt crystallization, the kinetics of crystallization of neat PBT and PBT/TiO2 composites was analyzed. The relative crystallinity as crystallization time function was computed as the exothermic peak areas ratio using Equation 5:
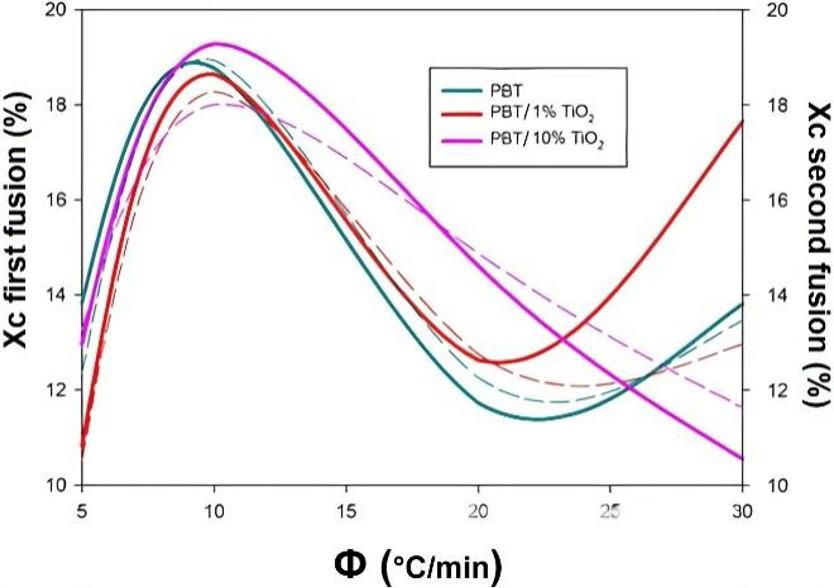

where: c dH dt is the released heat; rel X is the relative crystallinity measured from the peak integration as the ratio between the total and partial peak’s area, 0t and t∞ are the onset and end melt crystallization times.
3.5 Pseudo-Avrami modeling
Avrami[33-37] developed a macrokinetic model to investigate the isothermal crystallization, based on microkinetics approaches. The Avrami model considers the relative crystallinity x as time function τ computed in the event starting according to Equation 6:
Nevertheless, when using this model for nonisothermal crystallization investigations the parameters K’ and n’ are the heating rate φ functions, and not of temperature as in the Avrami model. Therefore, our researcher group has named Pseudo-Avrami[25,26].
K = K(Τ) and n = n(Τ) are the Avrami’s parameters. K is the rate constant evaluated considering the nucleation and crystalline growth rates, and n is the Avrami exponent which is related with the crystallite geometry[37-40]. Nonisothermal crystallization data, acquired using constant cooling rates may be correlated through an expression formally identical to Avrami Equation 7:
The relative crystallinity of PBT and PBT/TiO2 composites are displayed in Figure S9 which presents the theoretical (solid lines) and experimental (symbols) data. All plots displayed sigmoidal shapes characterizing continuous phase transition as commonly observed in polymers. Plots in Figure S9 present reasonable fits without huge deviation between the experimental and theoretical data. Only for PBT/10% TiO2 cooled at 5 °C/min presented deviation at the end of the primary crystallization. It can be verified that the experimental relative crystallinity developed subtly higher than the theoretical predictions, in general, when using rates lower than 10 oC/min and higher than 20 oC/min higher deviations are computed, which may be linked to the noise and time-lag effects, additionally, for PBT/10% TiO2 it is supposed to be also linked to the TiO2 addition influence. Nevertheless, in general, Pseudo-Avrami described the crystallization of PBT and PBT/TiO2 composites in
Barreto, J. V. M., Gomes, A. A. S., Araújo, A. M., Ries, A., Barros, J. J. P., & Wellen, R. M. R. Polímeros, 33(1), e20230006, 2023 4/12
0 0 t c rel c dH dt dt X dH dt dt ∞ = ∫ ∫ (5)
( ) 1 n xexpKτ =−− (6)
1 ' 1 YlnlnlnKnln x τ = = ′ (7)
Figure 4. Plots for the molten fraction (solid line) and melting rates (dashed line) as temperature function. (A) First fusion at 10 °C/min and (B) second fusion at 20 °C/min.
Figure 5. Plots for the crystallinity degree (Xc) developed during F1 (solid lines) and F2 (dashed lines). Compounds indicated.
Crystallization and fusion kinetics of Poly(butylene terephthalate)/Titanium Dioxide
a reasonable mode. The sigmoids may be divided into three stages, i.e., the first stage due to the nucleation, the second stage due to the primary crystallization which takes place at an accelerated rate with a high amount of mass transformation, and the third stage due to the secondary crystallization that is slower and more prominent for the slower cooling rates. It is related to crystallite impingement when the crystallization is finishing[37,41]
As above verified for the crystallization rates, increasing the cooling rates displaced the sigmoids to higher times (lower temperatures), in general upon higher cooling rates the specimen crystallizes faster nevertheless the developed crystallites are shorter and/or imperfects, thus depending on the desired morphology the cooling rates may be a proper tool to attain it. As mentioned, the sigmoids may be divided into three stages, i.e., nucleation, primary crystallization, and secondary crystallization, related to the discrepancy between theoretical and experimental data the higher deviation was verified during the begging, 0 < Xrel < 10% and the crystallization ending, i.e., Xrel > 80%.
From the sigmoids presented in Figure S9 the PseudoAvrami plots were built and are presented in Figure 6, through the plots of Y versus ln τ according to Equation 6. Linearity deviation was mainly verified when the crystallization was beginning and when it was finishing as illustrated. Clearly, Pseudo-Avrami plots may be divided into three stages: 1stnucleation, 2nd -primary crystallization, and 3rd - secondary crystallization, corroborating with presented data in Figure S9
The discrepancy between theoretical and experimental data was measured and data are presented in Figure 7 for PBT/1% TiO2. In general, the higher deviation was verified for higher cooling rates, and for the beginning and ending of crystallization as mentioned. Whether the analysis is concentered between 20% < Xrel < 80% the discrepancy goes down as demonstrated in Figure 7b, confirming Pseudo-Avrami fits quite well the crystallization from the melting of PBT and PBT/TiO2 composites.
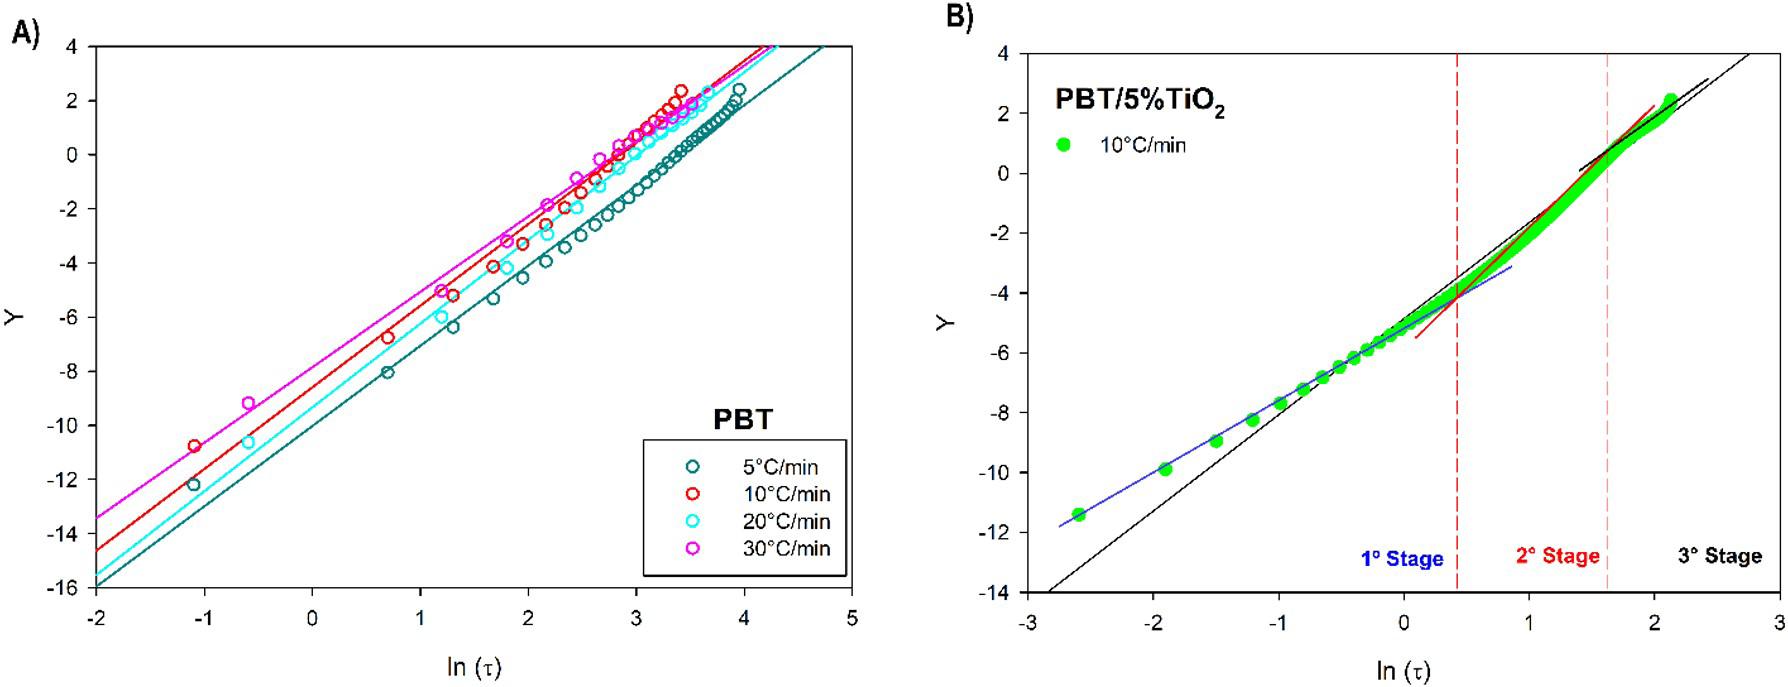
Figure 8 presents the crystallization rate constant (K’) and maximum crystallization rate (Cmax) as the cooling rate function for the investigated compounds, both parameters are
related to the crystallization rate and through the displayed data they increased with the cooling rates, i.e., theoretical and experimental crystallization rates followed similar trend[26,42-45]. For a given cooling rate, the crystallization rate was higher for neat PBT indicating somehow TiO2 decreased PBT’s crystallizability, i.e., decreased PBT’s ability to fast crystallize and hinder the transformation mechanisms, i.e., nucleation, primary and secondary crystallization, possibly changing the activation energy for the crystallization as further on investigated. In the Supplementary Material, in Table S2 the readers find the Pseudo-Avrami exponent and the R2 parameter.
3.6 Mo and co-workers modeling
Mo and co-workers[45,46] developed a model to correlate non-isothermal crystallization parameters in polymers tested using constant cooling/heating rates, assuming the needed time τ to reach a given level of relative crystallinity due to the cooling/heating rate φ, according to Equation 8: F
where ( ) FFx = and ( ) x αα = are Mo’s parameters, i.e., the rate constant and Mo exponent, respectively. Results acquired from the DSC peaks integration must be interpolated to have φ versus τ at constant x
Mo parameters, for each relative crystallinity, are obtained by linear regression of the experimental data, according to Equation 9:
Figure S12c shows sigmoids for PBT/5% TiO2 where symbols are the experimental data acquired during cooling, and the solid lines are the theoretical data computed according to Mo model. Plots presented quite good fits between experimental and theoretical data with subtle deviation at the crystallization extremes, i.e., beginning and ending, i.e., possibly linked with the nucleation and spherulites impingement, following a similar trend as already observed for Pseudo-Avrami model. From these sigmoids Mo plots
Polímeros, 33(1), e20230006, 2023 5/12
= (8)
α φτ
lnlnFlnφατ =− (9)
Figure 6. (A) Pseudo-Avrami plots of PBT built for the indicated cooling rates; (B) Pseudo-Avrami plots of PBT/5% TiO2 cooled at 10 °C/min displaying crystallization in three stages.
were built and presented in Figure S11d for PBT/10% TiO2 and 10% < Xrel < 90% from an overview of these data may be suggested Mo is adequate to modeling PBT and PBT/TiO2 composites. Plots for other compounds are displayed in the Supplementary Material; please see the Figure S11 and Figure S12
Figure 9 shows the discrepancy between the theoretical and experimental data for PBT/10%TiO2 evaluated using Mo model, following a similar trend as already observed for Pseudo-Avrami. A huger deviation was observed at the beginning and end of crystallization, nevertheless if assumed the range 20 < Xrel < 80% the deviation is quite low, i.e., less than 5% which confirms Mo model describes very well the crystallization from the melt of PBT compounds[41,47].
Mo parameters F and α were measured using Equation 9 and are graphically presented in Figure 10[47,48]. In the Supplementary Material, Table S3 the readers find the R2 parameter for the investigated compounds.
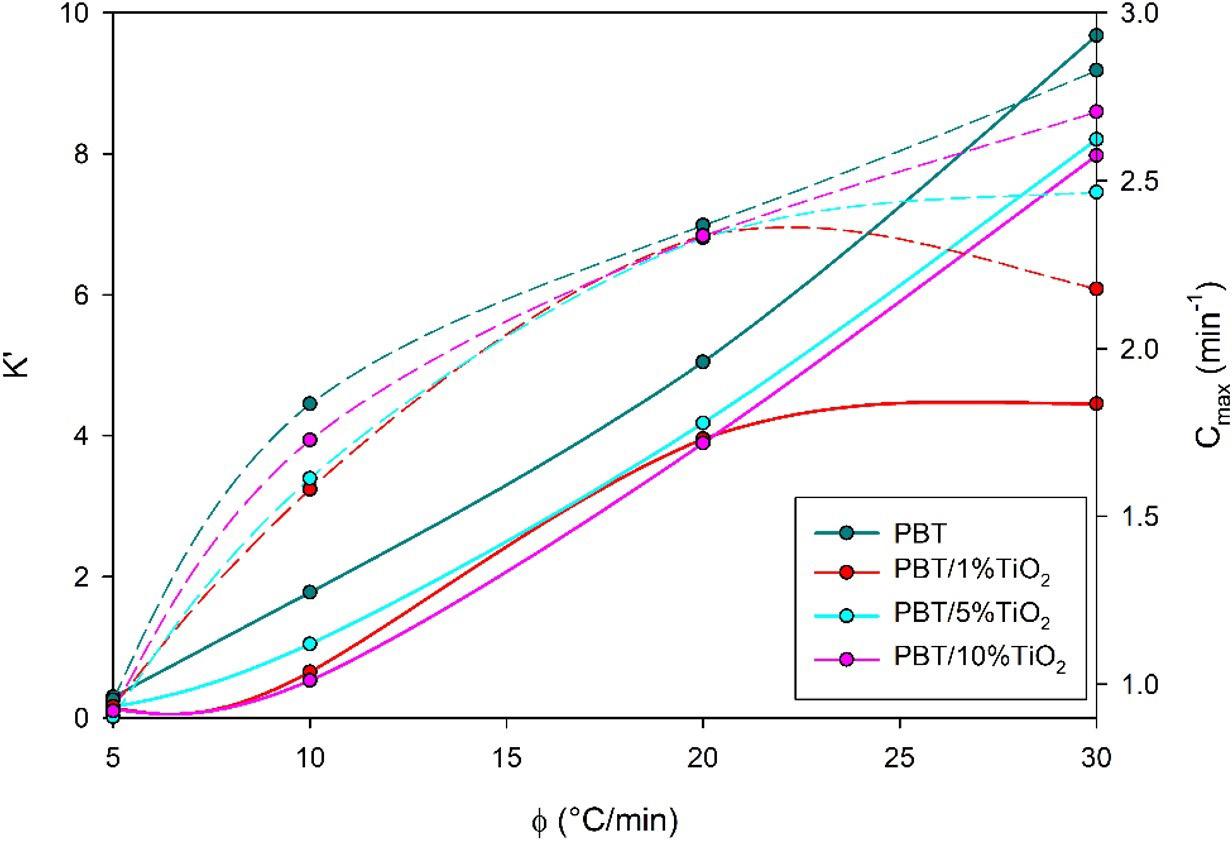
F increased with the degree of crystallization, i.e., for higher crystallinity much energy must be supplied to the system; a quite similar trend was observed for PP/PET blends as reported by Zhu et al.[49]. Related to TiO2 addition, PBT composites displayed higher F suggesting that with the crystallization development the composites need much energy[50-52]
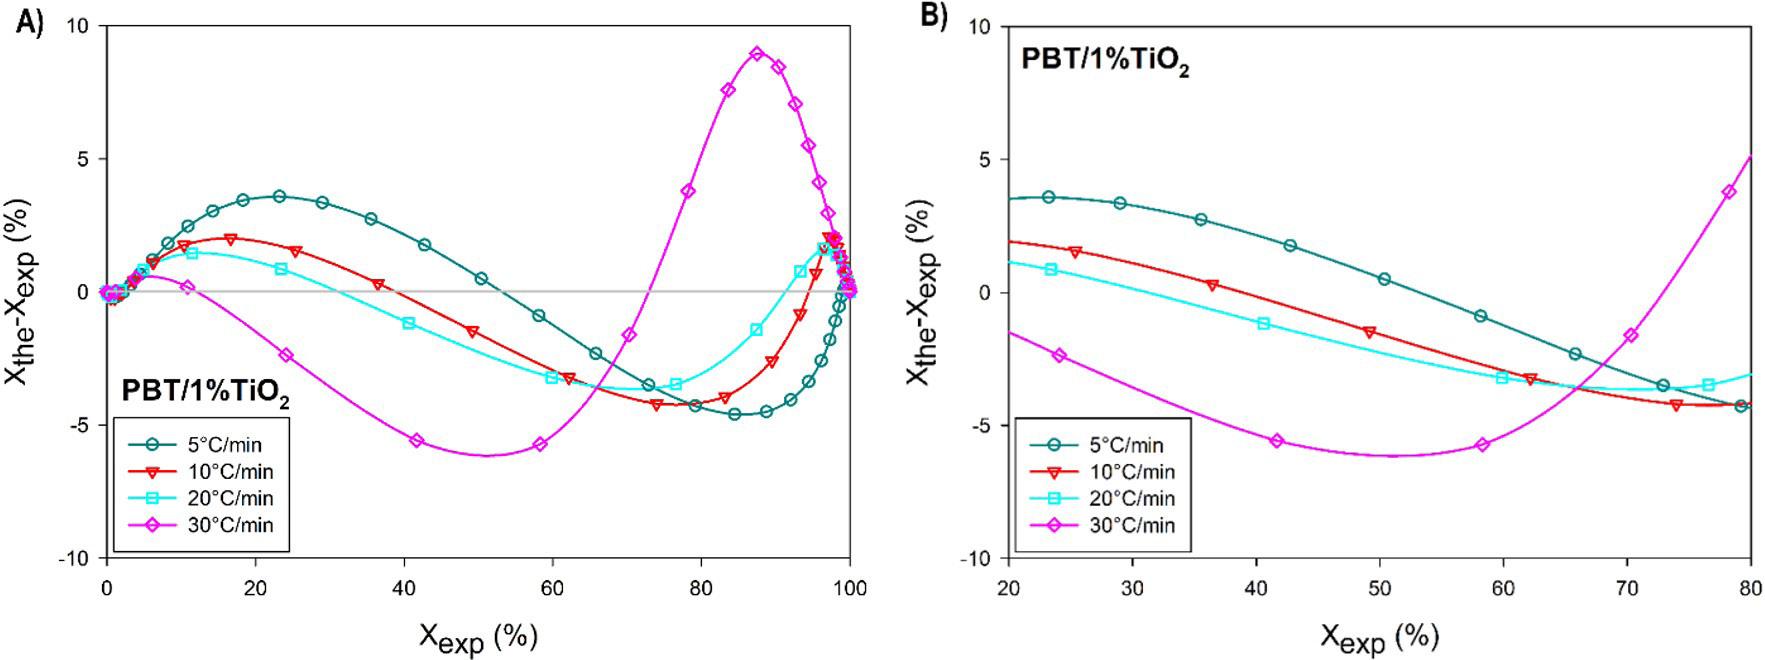
Mo exponent slowly increased with the degree of crystallinity suggesting crystalline structures more complexes were produced with the crystallization advance, i.e., nuclei are formed, as crystallization advance new macromolecules are added, progressing to the fibrils and then to the spherulites, which increase in size and can become more crystalline with the crystallization improvement, their crystallinity also depending on the applied crystallization parameters (time, temperature, cooling/heating rates), which can be used to control the whole crystallization. Parameters reported in the present paper may be used as proper tools to control the crystallization rate and the degree of crystallinity of PBT and PBT/TiO2 composites.
The following section presents the calculations for the activation energy for the melt crystallization and for the fusions.
3.7 Activation Energy ( Ea ) – Melt crystallization
The conversion rate of a chemical reaction is commonly reported as the product of a temperature-dependent rate constant K(T) and a function of the f(x) conversion characteristic of the reaction mechanism, as shown in Equation 10:
Isoconversional models are more applied to determine the activation energy of crystallizations. Friedman’s model[53,54] is based on the logarithmic of the conversion rate assuming a constant rate K(T) defined by Arrhenius, which is shown in Equation 11:
Where A is a pre-exponential factor constant and R = 8.314 J K-1 mol-1 is the universal gas constant. Transformations from the amorphous/disordered state to the crystalline state in polymeric melt are considered
Barreto, J. V. M., Gomes, A. A. S., Araújo, A. M., Ries, A., Barros, J. J. P., & Wellen, R. M. R. Polímeros, 33(1), e20230006, 2023 6/12
( ) ( ) d d x KTfx t = (10)
( ) e Ea RT kTAxp = (11)
Figure 7. (A) Discrepancy for the whole melt crystallization of PBT/1%TiO2 at indicated cooling rates; (B) Discrepancy PBT/1%TiO2 for the melt crystallization PBT/1%TiO2 between 20% < Xrel < 80% at indicated cooling rates. Plots built according to Pseudo-Avrami model.
Figure 8. Pseudo-Avrami rate crystallization constant, K’ (solid lines) and maximum crystallization rate, Cmax (dotted lines) as cooling rate function. Compounds indicated.
Crystallization and fusion kinetics of Poly(butylene terephthalate)/Titanium Dioxide
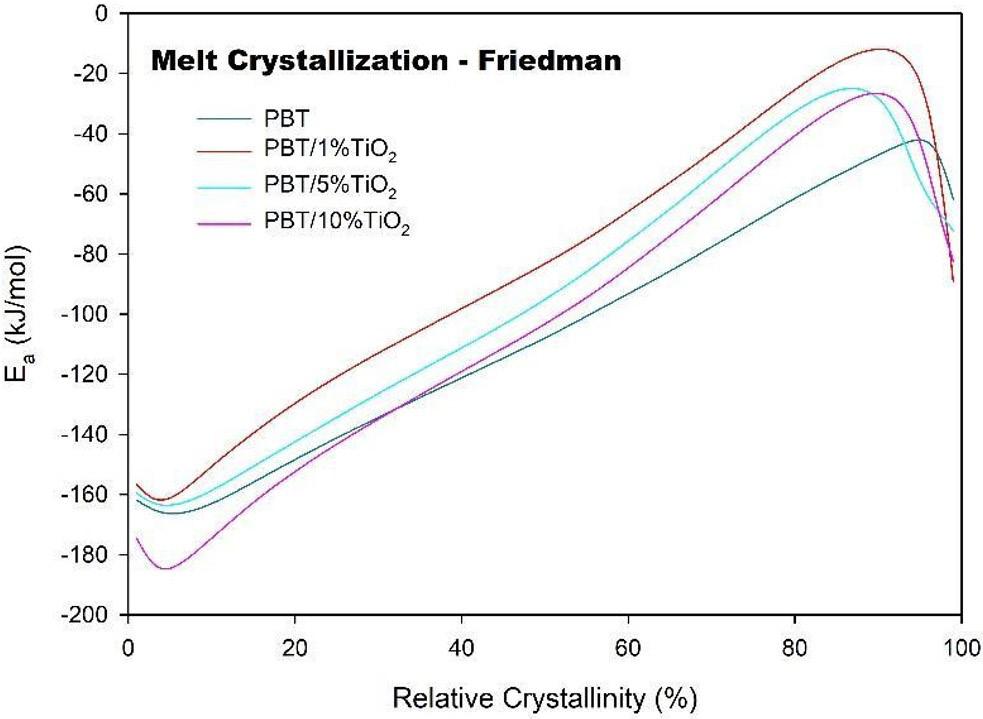
complex reactions; therefore Equations 10 and 11 must be generalized to:
Generally, Ea is a function of conversion (in this case it is a function of (Xrel) and Equation 12 can be converted to the logarithmic form:
For a relative crystallinity rel xX = , the plot of d d x ln t
x 1000 T acquired from data computed at different cooling rates generates a straight line with slope Ea R , this treatment repeated for the different values of Xrel results in Ea as function of Xrel. This method was applied in this work for Xrel ranging between 0 and 1.0 as shown in Figure 11
As can be seen from Figure 11, all activation energies are negative, indicating that energy has to be removed from the system in order to promote the melt crystallization.
Considering the absolute values of the activation energies, less energy has to be removed from the system for the TiO2/ PBT compounds when compared to neat PBT. The only
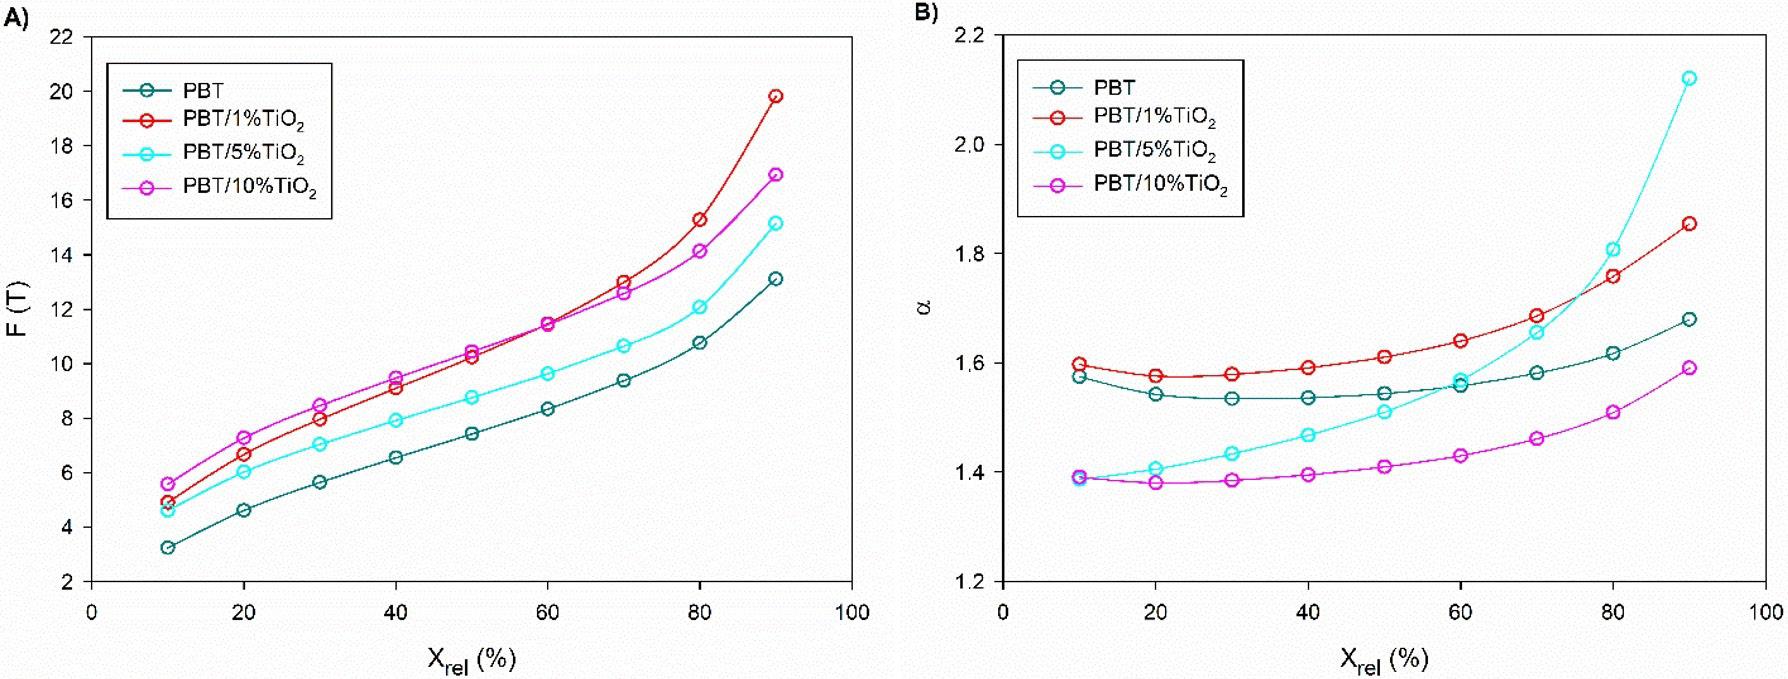
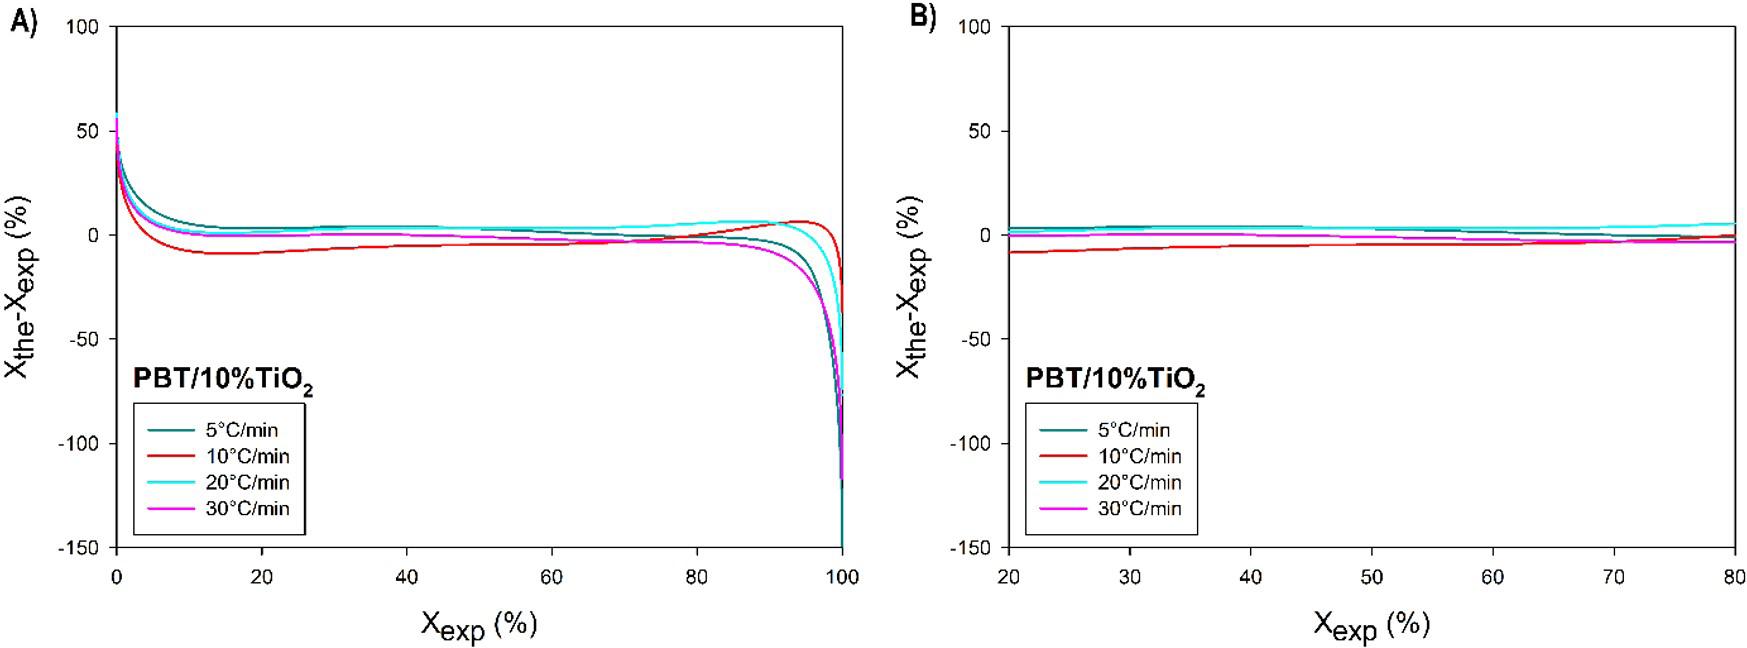
Polímeros, 33(1), e20230006, 2023 7/12
( ) ( ) d e d Ex RT x Axpfx t = (12)
( ) ( ) d d a Ex x lnlnAfx t RT = (13)
Figure 9. (A) Discrepancy between theoretical and experimental data for PBT/10%TiO2 during the melt crystallization calculated using Mo model. Indicated cooling rates; (B) Discrepancy evaluated for 20 < Xrel < 80%.
Figure 10. Mo parameters for the crystallization from the melt of PBT compounds. (A) F (T) and (B) Mo exponent α.
Figure 11. a E for the crystallization from the melt of PBT compounds measured using the Friedman isoconversional method. Compositions indicated.
exception from this behavior is the composition with 10% TiO2 load in the range 0-30% of relative crystallinity, which could be attributed to a measurement error. The fact that all the curves of Ea versus Xrel show up as almost parallel lines indicates that there is no significant change in the melt crystallization mechanism when adding the TiO2. The effect of filler is also nonlinear. A quite similar nonlinear shifting of activation energy curves was reported by Ries et al.[55] for the cold and melt crystallization of PHB/ZnO composites.

3.8 Activation energy ( Ea ) – First fusion
In contrast to crystallization kinetics, fusion kinetics has been rarely investigated[56]. Few studies report polymer fusion kinetics by means of isoconversional kinetic models[57-59] A differential or integral isoconversional method may be applied depending on the nature of the experimental data. If the reported data are from DSC measurements, therefore, Friedman’s differential isoconversional method[53,54] may be used.
Toda et al.[20,60] proposed a nucleation model for polymer fusion which fusion starts with melting the cylindrical cores. However, Friedman’s isoconversional model is powerful to study the fusion kinetics and evaluate Ea under superheating[61]. In those situations, a decrease in Ea s of the fusions upon temperature increase is expected[62]. This behavior was mostly observed in this work.
The numerical optimization method[63] is based on the data of Friedman analytical method. The acquired data from the Friedman method such as E(x) and A(x) are numerically optimized, the best fit between the experimental plots is obtained through non-linear optimization based on the least squares method. For fusion, this model-free method was the most suitable in this work, due to the better R2 of the analytical plot, which ranged from 0,932 to 0,996. Eas were computed using the numerical optimization method and plotted as molten fraction function. Figure 12 shows Ea for the first fusion of PBT and PBT/TiO2 composites. Neat PBT fusion requires the highest activation energy; while the lowest Ea was observed for PBT/1%TiO2 then a further increase in filler content raises the activation energy again. This behavior is similarly nonlinear as the trend verified for the melt crystallization.

3.9 Activation energy ( Ea ) – Second fusion
Ea for the second fusion of investigated compounds was measured using the numerical optimization method, similarly to the first fusion. This method based on the Friedman model presented quite high R2, i.e., 0,975 < R2 < 0,996. Plots are presented in the Supplementary Material, please see Figure S14
Acquired a Es are plotted as molten fraction (Xm) function and shown in Figure 13. All investigated compounds presented a similar profile, i.e., Ea decreased upon the fusion advance, the only exception observed was an increase in Ea for X m > 95% until the end of fusion. In the final stages of the second fusion, the verified trend for Ea was: E95%PBT > E90%PBT > E99%PBT > E100%PBT. During the second melting, there were no significant variations in Ea with TiO2 addition
and similarly to the first melting, there was no linear trend between TiO2 and the computed Ea
From Figure 12 and Figure 13 it may be verified that the second fusion character is quite different from the first one, as the first fusion is related to the quenched material from the mixing while the second fusion is related with the melt crystallized material, hence the second fusion was computed during the second heating with different thermal history and mainly distinct morphology altogether would be conducting to different activation energy as displayed in Figure 13
4. Conclusions
PBT/TiO2 compounds were successfully melting mixed; according to SEM images, TiO2 nanoparticles are well dispersed in the PBT matrix without evidence of agglomeration. The melt crystallization, fusions, and activation energy () Ea were evaluated based on DSC scans. Upon the integration of the DSC scans, the thermal events were visualized as sigmoids, indicating continuous phase transformation. Higher cooling rates shifted the sigmoides of the melt
Polímeros, 33(1), e20230006, 2023 8/12
Barreto, J. V. M., Gomes, A. A. S., Araújo, A. M., Ries, A., Barros, J. J. P., & Wellen, R. M. R.
Figure 12. a E for the first fusion of PBT and PBT/TiO2 composites using the numerical optimization method
Figure 13. a E for the second fusion of PBT and PBT/TiO 2 composites using the numerical optimization method.
Crystallization and fusion kinetics of Poly(butylene terephthalate)/Titanium Dioxide
crystallization to lower temperatures, while the fusions were almost insensible to the heating rates. Pseudo-Avrami and Mo models fit the melt crystallization kinetics quite well with subtle deviation only verified at the beginning and end of the crystallization, nevertheless quite high R2 parameters were acquired. Standard negative activation energies were computed for the melt crystallization and positive activation energies for the fusions; the Friedman model was applied to both phase transition evaluations and high R2 values suggest that they are a proper methodology. As expected, the activation energies decrease upon temperature increase for all filler contents.
5. Author’s Contribution
• Conceptualization – José Vinícius Melo Barreto; Renate Maria Ramos Wellen.
• Data curation – José Vinícius Melo Barreto; Amanda Meneses Araújo; Antônio Anderson da Silva Gomes.
• Formal analysis – José Vinícius Melo Barreto; Amanda Meneses Araújo; Antônio Anderson da Silva Gomes.
• Funding acquisition - Renate Maria Ramos Wellen.
• Investigation – José Vinícius Melo Barreto; Amanda Meneses Araújo; Antônio Anderson da Silva Gomes.
• Methodology – Renate Maria Ramos Wellen.
• Project administration – Renate Maria Ramos Wellen.
• Resources – Renate Maria Ramos Wellen.
• Software – José Vinícius Melo Barreto; Amanda Meneses Araújo; Antônio Anderson da Silva Gomes.
• Supervision – Renate Maria Ramos Wellen.
• Validation – Renate Maria Ramos Wellen; Andreas Ries.
• Visualization – Renate Maria Ramos Wellen; Andreas Ries.
• Writing – original draft – José Vinícius Melo Barreto; Amanda Meneses Araújo; Antônio Anderson da Silva Gomes; Renate Maria Ramos Wellen.
• Writing – review & editing – Renate Maria Ramos Wellen; Andreas Ries; Janetty Jany Pereira Barros.
6. Acknowledgements
The authors acknowledge to the financial support from the Conselho Nacional de Desenvolvimento Científico e Tecnológico (CNPq) and from the Federal University of Paraíba (PIF13111-2020) Professor Renate Wellen is CNPq fellow (Number: 303426/2021-7). The authors thank to Olin Corporation (Brazil) for kindly supplying the reactants.
7. References
1 Wu, T., Hu, H. L., Du, Y. P., Jiang, D., & Yu, B. H. (2014). Discrimination of thermoplastic polyesters by MALDI-TOF MS and Py-GC/MS. IJPAC. International Journal of Polymer Analysis and Characterization, 19(5), 441-452 http://dx.doi. org/10.1080/1023666X.2014.920126
2 Szostak, M. (2004). Mechanical and thermal properties of PET/PBT blends. Molecular Crystals and Liquid Crystals (Philadelphia, Pa.), 416(1), 209-215 http://dx.doi. org/10.1080/15421400490481377
3 Park, C.-S., Lee, K.-J., Nam, J.-D., & Kim, S.-W. (2000). Crystallization kinetics of glass fiber reinforced PBT composites. Journal of Applied Polymer Science, 78(3), 576-585 http:// dx.doi.org/10.1002/1097-4628(20001017)78:3<576::AIDAPP120>3.0.CO;2-M
4 Almeida, A., Nébouy, M., & Baeza, G. P. (2019). Bimodal crystallization kinetics of PBT/PTHF segmented block copolymers: impact of the chain rigidity. Macromolecules, 52(3), 1227-1240 http://dx.doi.org/10.1021/acs.macromol.8b01689
5 Deshmukh, G. S., Peshwe, D. R., Pathak, S. U., & Ekhe, J. D. (2014). Nonisothermal crystallization kinetics and melting behavior of poly(butylene terephthalate)(PBT) composites based on different types of functional fillers. Thermochimica Acta, 581, 41-53 http://dx.doi.org/10.1016/j.tca.2014.02.007
6. Lehmann, B., & Karger-Kocsis, J. (2009). Isothermal and nonisothermal crystallisation kinetics of pCBT and PBT. Journal of Thermal Analysis and Calorimetry, 95(1), 221-227 http:// dx.doi.org/10.1007/s10973-007-8939-1
7 Kulshreshtha, B., Ghosh, A. K., & Misra, A. (2003). Crystallization kinetics and morphological behavior of reactively processed PBT/epoxy blends. Polymer, 44(16), 4723-4734 http://dx.doi. org/10.1016/S0032-3861(03)00347-1.
8 Kalkar, A. K., Deshpande, V. D., & Purkar, B. R. (2018). Evaluation of thermal transitions in Poly(butylene terephthalate)/15A MMT nanocomposites: nonisothermal experiments and modelling using isoconversional methods. Thermochimica Acta, 660, 23-36 http://dx.doi.org/10.1016/j.tca.2017.12.005
9 Jiang, L., Huang, Z., Wang, X., Lai, M., Zhang, Y., & Zhou, H. (2020). Influence of reactive compatibilization on the mechanical, thermal and rheological properties of highly filled PBT/Al2O3 composites. Materials & Design, 196, 109175 http://dx.doi.org/10.1016/j.matdes.2020.109175
10 Cao, Y., Xu, P., Wu, B., Hoch, M., Lemstra, P. J., Yang, W., Dong, W., Du, M., Liu, T., & Ma, P. (2020). High-performance and functional PBT/EVMG/CNTs nanocomposites from recycled sources by in situ multistep reaction-induced interfacial control. Composites Science and Technology, 190, 108043 http://dx.doi.org/10.1016/j.compscitech.2020.108043
11 Tekin, D., Birhan, D., & Kiziltas, H. (2020). Thermal, photocatalytic, and antibacterial properties of calcinated nano-TiO2/polymer composites. Materials Chemistry and Physics, 251, 123067 http://dx.doi.org/10.1016/j.matchemphys.2020.123067
12 Deshmukh, G. S., Peshwe, D. A., Pathak, S. U., & Ekhe, J. D. (2011). A study on effect of mineral additions on the mechanical, thermal, and structural properties of poly(butylene terephthalate)(PBT) composites. Journal of Polymer Research, 18 (5), 1081-1090 http://dx.doi.org/10.1007/s10965-0109510-5
13 Wang, S., & Zhang, J. (2014). Effect of titanium dioxide (TiO2) on largely improving solar reflectance and cooling property of high density polyethylene (HDPE) by influencing its crystallization behavior. Journal of Alloys and Compounds, 617, 163-169 http://dx.doi.org/10.1016/j.jallcom.2014.07.191
14 Supaphol, P., Thanomkiat, P., Junkasem, J., & Dangtungee, R. (2007). Non-isothermal melt-crystallization and mechanical properties of titanium (IV) oxide nanoparticle-filled isotactic polypropylene. Polymer Testing, 26(1), 20-37 http://dx.doi. org/10.1016/j.polymertesting.2006.07.011
15 Yang, T.-C., Noguchi, T., Isshiki, M., & Wu, J.-H. (2014). Effect of titanium dioxide on chemical and molecular changes in PVC sidings during QUV accelerated weathering. Polymer Degradation & Stability, 104, 33-39. http://dx.doi.org/10.1016/j. polymdegradstab.2014.03.023
16 Scuderi, V., Buccheri, M. A., Impellizzeri, G., Di Mauro, A., Rappazzo, G., Bergum, K., Svensson, B. G., & Privitera, V. (2016). Photocatalytic and antibacterial properties of titanium dioxide flat film. Materials Science in Semiconductor Processing, 42(Part 1), 32-35 http://dx.doi.org/10.1016/j.mssp.2015.09.005
17. Olmos, D., Domínguez, C., Castrillo, P. D., & Gonzalez-Benito, J. (2009). Crystallization and final morphology of HDPE: effect of the high energy ball milling and the presence of
Polímeros, 33(1), e20230006, 2023 9/12
TiO2 nanoparticles. Polymer, 50(7), 1732-1742 http://dx.doi. org/10.1016/j.polymer.2009.02.011
18 Zhou, G., Li, L., Jiang, M., Wang, G., Wang, R., Wu, G., & Zhou, G. (2021). Renewable poly(butene 2, 5-furan dicarboxylate) nanocomposites constructed by TiO2 nanocubes: synthesis, crystallization, and properties. Polymer Degradation & Stability , 189 , 109591 http://dx.doi.org/10.1016/j. polymdegradstab.2021.109591
19. Friedman, H. L. (1964). Kinetics of thermal degradation of char‐forming plastics from thermogravimetry: application to a phenolic plastic. Journal of Polymer Science Part C: Polymer Symposia, 6(1), 183-195 http://dx.doi.org/10.1002/ polc.5070060121
20 Toda, A., Hikosaka, M., & Yamada, K. (2002). Superheating of the melting kinetics in polymer crystals: a possible nucleation mechanism. Polymer, 43(5), 1667-1679 http:// dx.doi.org/10.1016/S0032-3861(01)00733-9
21 Christakopoulos , F., Troisi, E. M., Sologubenko, A. S., Friederichs, N., Stricker, L., & Tervoort, T. A. (2021). Melting kinetics, ultra-drawability and microstructure of nascent ultrahigh molecular weight polyethylene powder. Polymer, 222, 123633. http://dx.doi.org/10.1016/j.polymer.2021.123633.
22 Monteiro, A. E. G. (2020). Desenvolvimento de compósitos poliméricos de poli (butileno adipatoco-tereftalato)(PBAT)/ óxido de zinco (ZnO) e poli (butileno adipato-cotereftalato) (PBAT)/dióxido de titânio (TiO2) (Doctoral thesis). Universidade Federal de Pernambuco, Recife
23 Conix, A., & Van Kerpel, R. (1959). Crystallization behavior and melting properties of m‐phenylene group containing polyesters. Journal of Polymer Science, 40(137), 521-532
http://dx.doi.org/10.1002/pol.1959.1204013720
24 Silva, I. D. S., Jaques, N. G., Barbosa, M. C., No., Agrawal, P., Ries, A., Wellen, R. M. R., & Canedo, E. L. (2018). Melting and crystallization of PHB/ZnO compounds. Journal of Thermal Analysis and Calorimetry, 132(1), 571-580. http:// dx.doi.org/10.1007/s10973-017-6749-7
25 Wellen, R. M. R., Canedo, E. L., & Rabello, M. S. (2015). Melting and crystallization of poly(3-hydroxybutyrate)/carbon black compounds: effect of heating and cooling cycles on phase transition. Journal of Materials Research, 30(21), 3211-3226 http://dx.doi.org/10.1557/jmr.2015.287
26 Vitorino, M. B. C., Cipriano, P. B., Wellen, R. M. R., Canedo, E. L., & Carvalho, L. H. (2016). Nonisothermal melt crystallization of PHB/babassu compounds. Journal of Thermal Analysis and Calorimetry, 126(2), 755-769. http://dx.doi.org/10.1007/ s10973-016-5514-7
27 Groeninckx, G., Reynaers, H., Berghmans, H., & Smets, G. (1980). Morphology and melting behavior of semicrystalline poly(ethylene terephthalate). I. Isothermally crystallized PET. Journal of Polymer Science. Polymer Physics Edition, 18(6), 1311-1324 http://dx.doi.org/10.1002/pol.1980.180180612
28 Cruz, L. C. A. (2013). Estudo da cinética de cristalização do Polifluoreto de vinilideno (PVDF) (Doctoral thesis). Universidade Federal do Rio de Janeiro, Rio de Janeiro
29 Wellen, R. M. R., Rabello, M. S., Araujo, I. C., Jr., Fechine, G. J. M., & Canedo, E. L. (2015). Melting and crystallization of poly(3-hydroxybutyrate): effect of heating/cooling rates on phase transformation. Polímeros. Polímeros, 25(3), 296-304. http://dx.doi.org/10.1590/0104-1428.1961
30 Bogoeva‐Gaceva, G., Janevski, A., & Grozdanov, A. (1998). Crystallization and melting behavior of iPP studied by DSC. Journal of Applied Polymer Science, 67(3), 395-404 http:// dx.doi.org/10.1002/(SICI)1097-4628(19980118)67:3<395::AIDAPP2>3.0.CO;2-H
31 Fakirov, S., Fischer, E. W., Hoffmann, R., & Schmidt, G. F. (1977). Structure and properties of poly(ethylene terephthalate)
crystallized by annealing in the highly oriented state: 2. Melting behaviour and the mosaic block structure of the crystalline layers. Polymer, 18(11), 1121-1129 http://dx.doi. org/10.1016/0032-3861(77)90105-7
32. Liu, M., Zhao, Q., Wang, Y., Zhang, C., Mo, Z., & Cao, S. (2003). Melting behaviors, isothermal and non-isothermal crystallization kinetics of nylon 1212. Polymer, 44(8), 25372545 http://dx.doi.org/10.1016/S0032-3861(03)00101-0
33 Bassett, D. C. (1981). Principles of polymer morphology Cambridge: Cambridge University Press
34 Avrami, M. (1941). Granulation, phase change, and microstructure kinetics of phase change. III. The Journal of Chemical Physics, 9(2), 177-184 http://dx.doi.org/10.1063/1.1750872
35 Avrami, M. (1940). Kinetics of phase change. II transformation‐time relations for random distribution of nuclei. The Journal of Chemical Physics, 8(2), 212-224 http://dx.doi. org/10.1063/1.1750631
36 Avrami, M. (1939). Kinetics of phase change. I General theory. The Journal of Chemical Physics, 7(12), 1103-1112 http:// dx.doi.org/10.1063/1.1750380
37 Coutinho, S. V. C. R., Barros, A. B. S., Barros, J. J. P., Albuquerque, A. K. C., Barreto, J. V. M., Siqueira, D. D., Ries, A., & Wellen, R. M. R. (2021). On the nonisothermal melt crystallization kinetics of industrial batch crosslinked polyethylene. Journal of Applied Polymer Science, 138(33), 50807 http://dx.doi.org/10.1002/app.50807
38 Chuah, K. P., Gan, S. N., & Chee, K. K. (1999). Determination of Avrami exponent by differential scanning calorimetry for non-isothermal crystallization of polymers. Polymer, 40(1), 253-259 http://dx.doi.org/10.1016/S0032-3861(98)00188-8
39. Wellen, R. M. R., & Canedo, E. L. (2016). Nonisothermal melt and cold crystallization kinetics of poly(3-hydroxybutyrate) and poly(3-hydroxybutyrate)/carbon black compounds: evaluation of Pseudo-Avrami, Ozawa, and Mo models. Journal of Materials Research, 31(6), 729-739 http://dx.doi. org/10.1557/jmr.2016.68
40 Drzewicz, A., Juszyńska-Gałązka, E., Zając, W., Piwowarczyk, M., & Drzewiński, W. (2020). Non-isothermal and isothermal cold crystallization of glass-forming chiral smectic liquid crystal (S)-4′-(1-methyloctyloxycarbonyl) biphenyl-4-yl 4-[7-(2, 2, 3, 3, 4, 4, 4-heptafluorobutoxy) heptyl-1-oxy]-benzoate. Journal of Molecular Liquids, 319, 114153. http://dx.doi.org/10.1016/j. molliq.2020.114153
41 Schäfer, H., Reul, L. T. A., Souza, F. M., Wellen, R. M. R., Carvalho, L. H., Koschek, K., & Canedo, E. L. (2021). Crystallization behavior of polycaprolactone/babassu compounds. Journal of Thermal Analysis and Calorimetry, 143(4), 29632972 http://dx.doi.org/10.1007/s10973-020-09433-0
42 Canedo, E. L., Wellen, R. M. R., & Almeida, Y. M. B. (2016). Cristalização de Polímeros–Tratamento de Dados e Modelagem Macrocinética. Brazil: Programa de Recursos Humanos da ANP – PRH28/UFPE.
43 Song, L., & Qiu, Z. (2009). Crystallization behavior and thermal property of biodegradable poly(butylene succinate)/ functional multi-walled carbon nanotubes nanocomposite. Polymer Degradation & Stability, 94(4), 632-637 http://dx.doi. org/10.1016/j.polymdegradstab.2009.01.009
44 Zou, P., Tang, S., Fu, Z., & Xiong, H. (2009). Isothermal and non-isothermal crystallization kinetics of modified rape straw flour/high-density polyethylene composites. International Journal of Thermal Sciences, 48(4), 837-846 http://dx.doi. org/10.1016/j.ijthermalsci.2008.06.010
45 Liu, T., Mo, Z., & Zhang, H. (1998). Nonisothermal crystallization behavior of a novel poly(aryl ether ketone): PEDEKmK. Journal of Applied Polymer Science, 67(5), 815-821 http://dx.doi.
Barreto, J. V. M., Gomes,
S.,
A. M., Ries, A.,
J. J. P., &
R. M. R. Polímeros, 33(1), e20230006, 2023 10/12
A. A.
Araújo,
Barros,
Wellen,
Crystallization and fusion kinetics of Poly(butylene terephthalate)/Titanium Dioxide
org/10.1002/(SICI)1097-4628(19980131)67:5<815::AIDAPP6>3.0.CO;2-W
46 Liu, T., Mo, Z., Wang, S., & Zhang, H. (1997). Nonisothermal melt and cold crystallization kinetics of poly(aryl ether ether ketone ketone). Polymer Engineering and Science, 37(3), 568-575 http://dx.doi.org/10.1002/pen.11700
47 Li, C., & Dou, Q. (2014). Non-isothermal crystallization kinetics and spherulitic morphology of nucleated poly(lactic acid): effect of dilithium hexahydrophthalate as a novel nucleating agent. Thermochimica Acta, 594, 31-38 http://dx.doi.org/10.1016/j. tca.2014.08.036.
48 Mohtaramzadeh, Z., Hemmati, F., Kasbi, S. F., Goodarzi, V., Arnhold, K., & Khonakdar, H. A. (2020). Structure-properties correlations in poly(ε-caprolactone)/poly(styrene-co-acrylonitrile)/ nanosilica mixtures: interrelationship among phase behavior, morphology and non-isothermal crystallization kinetics. Polymer Testing, 89, 106593 http://dx.doi.org/10.1016/j. polymertesting.2020.106593
49 Zhu, Y., Liang, C., Bo, Y., & Xu, S. (2015). Non-isothermal crystallization behavior of compatibilized polypropylene/ recycled polyethylene terephthalate blends. Journal of Thermal Analysis and Calorimetry, 119(3), 2005-2013 http://dx.doi. org/10.1007/s10973-014-4349-3
50 Qiu, Z. B., Zhou, H. W., Mo, Z. S., Zhang, H. F., & Wu, Z. W. (2000). Nonisothermal cold crystallization kinetics of Poly(aryl ether diphenyl ether ketone). Polymer Journal, 32(3), 287-290 http://dx.doi.org/10.1295/polymj.32.287
51 Liu, F., Shan, X., & Wang, Z. (2020). Nonisothermal crystallization behaviors of ethylene–acrylic acid copolymer and ethylene–acrylic acid copolymer/chloroprene rubber thermoplastic vulcanizate. Journal of Thermoplastic Composite Materials, 35(10), 15481560. http://dx.doi.org/10.1177/0892705720939138.
52. Xiuju, Z., Juncai, S., Huajun, Y., Zhidan, L., & Shaozao, T. (2011). Mechanical properties, morphology, thermal performance, crystallization behavior, and kinetics of PP/microcrystal cellulose composites compatibilized by two different compatibilizers. Journal of Thermoplastic Composite Materials, 24(6), 735-754 http://dx.doi.org/10.1177/0892705711403527
53 Deb, P. (2014). Kinetics of heterogeneous solid state processes India: Springer http://dx.doi.org/10.1007/978-81-322-1756-5
54 Vyazovkin, S., & Wight, C. A. (1998). Isothermal and nonisothermal kinetics of thermally stimulated reactions of solids.
International Reviews in Physical Chemistry, 17(3), 407-433 http://dx.doi.org/10.1080/014423598230108
55 Ries, A., Canedo, E. L., Souto, C. R., & Wellen, R. M. R. (2016). Non-isothermal cold crystallization kinetics of poly(3hydoxybutyrate) filled with zinc oxide. Thermochimica Acta, 637, 74-81 http://dx.doi.org/10.1016/j.tca.2016.06.002
56 Liavitskaya, T., Birx, L., & Vyazovkin, S. (2017). Melting kinetics of superheated crystals of glucose and fructose. Physical Chemistry Chemical Physics, 19(38), 26056-26064 http://dx.doi.org/10.1039/C7CP05486F. PMid:28926042.
57 Vyazovkin, S., Yancey, B., & Walker, K. (2013). Nucleation‐Driven Kinetics of Poly(ethylene terephthalate) Melting. Macromolecular Chemistry and Physics, 214(22), 2562-2566 http://dx.doi.org/10.1002/macp.201300443
58. Vyazovkin, S., & Sbirrazzuoli, N. (2006). Isoconversional Kinetic Analysis of Thermally Stimulated Processes in Polymers. Macromolecular Rapid Communications, 27(18), 1515-1532. http://dx.doi.org/10.1002/marc.200600404.
59 Vyazovkin, S. (2017). Isoconversional kinetics of polymers: the decade past. Macromolecular Rapid Communications, 38(3), 1600615 http://dx.doi.org/10.1002/marc.201600615 PMid:28009078.
60. Toda, A., Kojima, I., & Hikosaka, M. (2008). Melting kinetics of polymer crystals with an entropic barrier. Macromolecules, 41(1), 120-127 http://dx.doi.org/10.1021/ma702162m
61 Christakopoulos, F., Troisi, E., & Tervoort, T. A. (2020). Melting kinetics of nascent Poly(tetrafluoroethylene) powder. Polymers, 12(4), 791 http://dx.doi.org/10.3390/polym12040791 PMid:32252294.
62 Vyazovkin, S. (2020). Activation energies and temperature dependencies of the rates of crystallization and melting of polymers. Polymers, 12(5), 1070 http://dx.doi.org/10.3390/ polym12051070 PMid:32392771.
63 Radojević, M., Janković, B., Jovanović, V., Stojiljković, D., & Manić, N. (2018). Comparative pyrolysis kinetics of various biomasses based on model-free and DAEM approaches improved with numerical optimization procedure. PLoS One, 13(10), e0206657 http://dx.doi.org/10.1371/journal.pone.0206657 PMid:30379972.
Received: Sept. 19, 2022
Revised: Feb. 14, 2023
Accepted: Feb. 20, 2023
Polímeros, 33(1), e20230006, 2023 11/12
Supplementary Material
Supplementary material accompanies this paper.
Figure S1. Typical DSC scan for PBT, collected during applied thermal cycles for the heating/cooling/re-heating of 10 oC/min. Dotted red line is the applied thermal program. Solid blue line the heat flow signal with the investigated phase transitions, i.e., F1
Figure S2. The half melt crystallization time τ1/2 (dashed line) and melt crystallization rate (solid line) of produced compounds as function of tested cooling rates.
Figure S3. Relative crystallinity (solid line) and Crystallization rate (dotted line) as temperature function. Compounds and cooling rates indicated.
Figure S4. Relative crystallinity (solid line) and Crystallization rate (dotted line) as temperature function. Compounds and cooling rates indicated.
Figure S5. Molten fraction (solid line) and Melting rates (dotted line) as temperature function of F1. Compounds and cooling rates indicated.
Figure S6. Molten fraction (solid line) and Melting rates (dotted line) as temperature function of F2. Compounds and cooling rates indicated.
Figure S7. Pseudo-Avrami plots of neat and PBT/TiO2 cooled at indicated cooling rates illustrating crystallization development in three stages.
Figure S8. Pseudo-Avrami plots of composites a) PBT/1%TiO2, b) PBT/5%TiO2 and c) PBT/10%TiO2 computed for the indicated cooling rates.
Figure S9. Relative crystallinity of a) neat PBT, b) PBT/1%TiO2, c) PBT/5%TiO2 and d) PBT/10%TiO2 at displayed cooling rates. The theoretical data are solid lines and the experimental are symbols.
Figure S10. Discrepancy for the whole melt crystallization of a) neat polymer, b) PBT/5%TiO2 and c) PBT/10%TiO2 at indicated cooling rates. And Discrepancy for the melt crystallization between 20% < Xrel < 80% of d) neat polymer, e) PBT/5%TiO2 and f) PBT/10%TiO2. Plots built according to Pseudo-Avrami model.
Figure S11. Mo plots for the melt crystallization of a) neat PBT, b) PBT with 1%TiO2, c) PBT/5%TiO2, and d) PBT/10%TiO2 at indicated degree of crystallinity.
Figure S12. Relative crystallinity for the melt crystallization of a) neat PBT, b) PBT/1%TiO2, c) PBT/5%TiO2, and d) PBT/10%TiO2 at indicated cooling rates.
Figure S13. Deviation between theoretical and experimental data during the melt crystallization evaluated using Mo model (cooling rates indicated) of a) neat PBT, b) PBT/1%TiO2 and c) PBT/5%TiO2. And discrepancy evaluated for 0 < Xrel < 80% of d) neat PBT, e) PBT/1%TiO2 and f) PBT/5%TiO2
Figure S14. for the second fusion of PBT and PBT/TiO2 composites using the numerical optimization method
Table S1. Melt crystallization data for indicated compositions and rates.
Table S2. Pseudo-Avrami expoent (n’), R2 and degree of crystallinity (Xc %) for the investigated compounds.
Table S3. R2 parameter for Mo fits computed for the investigated compounds.
Table S4. Data for the first fusion for PBT and PBT/TiO2 composites.
Table S5. Data for the second fusion for PBT and PBT/TiO2 composites. This material is available as part of the online article from https://doi.org/10.1590/0104-1428.20220087
Barreto, J. V. M., Gomes, A. A. S., Araújo, A. M., Ries, A., Barros, J. J. P., & Wellen, R. M. R. Polímeros, 33(1), e20230006, 2023 12/12
Influence of carbon fibre layers on the strength of thermally modified laminated veneer lumber
Osman Perçin1* and Onur Ülker2*
1Department of Interior Architecture and Environmental Design, Faculty of Fine Arts and Architecture, Necmettin Erbakan University, Meram, Konya, Turkey
2Department of Interior Architecture, Faculty of Architecture and Design, Eskisehir Technical University, Tepebasi, Eskisehir, Turkey *onurulker@eskisehir.edu.tr
Obstract
Thermally modification of wood is an environment-friendly alternative method for improving several properties of wood without the use of chemicals. The compressive strength (CS) parallel to the grain of reinforced laminated veneer lumber (LVL) manufactured from heat treated beech (Fagus orientalis) veneers and carbon fibre was determined. Thermally modification was performed at 140°C, 160°C, 180°C, and 200 °C according to thermal treatment process. Carbon fibre were added as a reinforcement layer between wood veneers bonded with phenol-formaldehyde (PF), polyvinyl acetate (PVAc) polyurethane adhesives (PU) to improve properties of LVL. Results showed that reinforcing LVL panels with carbon fibre increased both density and CS. The PF adhesive showed better results for reinforced LVL panels with carbon fibre. The anatomical structure and density of the wood material significantly affect its mechanical properties, including compressive strength parallel to the grains. Wood density had a strong significant linear relationship with CS.
Keywords: laminated veneer lumber, carbon fibre, thermal treatment process, beech.
How to cite: Perçin, O., & Ülker, O. (2023). Influence of carbon fibre layers on the strength of thermally modified laminated veneer lumber. Polímeros: Ciência e Tecnologia, 33(1), e20230007. https://doi.org/10.1590/0104-1428.20220070
1. Introduction
Wood material is one of the earliest building and engineering materials used by mankind in the world. It continues to be a remarkable material in the construction and woodworking industries. Wood has unfavorable structural features as knots, combustion properties, dimensional instability, low biological resistance, easy degradation from external environmental conditions, and twisted fibres[1,2]. It is necessary to improve or eliminate these unfavorable structural features of wood material and make it suitable for its end use.
In recent years, considering the environment and human health, different methods have been developed to eliminate or minimize the unfavorable properties of wood and wood-based materials. One of the most popular methods is thermal modification, and its application is increasing in recent years[3-5]. Thermal modification has been found to be an effective method to improve wood dimensional stability, biological durability, and to reduce the equilibrium moisture content. Thermal modification alters the cell wall polymer and chemistry of wood by heating at high temperature levels. High temperature changes the chemical and anatomical properties of wood[6,7]. Furthermore, mechanical strength properties may also decrease depending on the treatment conditions[8-11]
In the last couple of decades, there has been a rapid increase in the consumption of forest resources due to increase in the world population, increase in the demand
for wood materials, unsustainable use of forest resources, forest fires, and natural disasters such as landslides. Structural composite timbers (SCLs) have been produced to eliminate the structural defects of the wood material and to use wood material more efficiently. One of these structural composite timbers is laminated veneer lumber (LVL); it is one of the most widely used high- strength engineered wood products for constructional applications that is also an alternative to solid wood used for structural applications[12,13]
Structural composite lumber can be reinforced with synthetic fibres to effectively improve their structural properties. The commonly used fibre reinforced polymer (FRP) composite for wood is glass-fibre reinforced polymer (GFRP), aramid fibre reinforced polymer (AFRP), carbonfibre reinforced polymer (CFRP), and hybrid materials (carbon fibres and glass fibres)[14-21]. Glass fibre fabrics have lower resistance properties to alkaline environments and lower fatigue strength. Aramid fibres have closely strength properties to glass fibres but are more resistant to fatigue. Alternatively, carbon fibres are characterized by higher stiffness than glass fibres and they are more stable against chemicals and high temperatures. Also, these fibres have the best properties among fibres used in the production of fibre composites[8]
Over the years, to improve of technological properties of LVL as a construction material, reinforcement of LVL,
https://doi.org/10.1590/0104-1428.20220070 O O O O O O O O O O O O O O O Polímeros, 33(1), e20230007, 2023 ISSN 1678-5169 (Online) 1/9
wood and adhesive type and methods have been carried out by many researchers[22-33]. When previous studies are analyzed, many of the researchers have been focused effect of reinforcement material on tension of glulam or timber in bending, modulus of rupture (MOR), and modulus of elasticity (MOE), however reinforcing LVL has not been commonly reported. In addition, the use of heat-treated wood material both indoors and outdoors is increasing, and an increase is observed in the demand for heat-treated wood material in the woodworking industry.
Thermal modification significantly reduces some mechanical properties, including the compressive strength parallel to the grains, however the dimensional stability and the biological durability of wood increases after heat treatment process. Compression strength of wood and wood composites materials plays an important role in almost any construction applications[34-36]
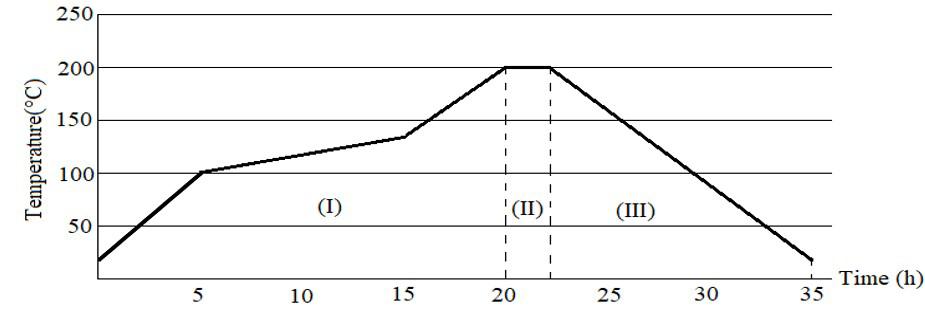
Hence, the objective of this study was to determine the influence of carbon fibre reinforcement on compressive strength parallel to the grain of laminated veneer lumber (LVL) bonded with phenol-formaldehyde (PF), polyvinyl acetate (PVAc) (all the resins used separately) and polyurethane adhesives (PU) using heat-treated beech (Fagus orientalis Lipsky) veneers.
2. Materials and Methods
Beech (Fagus orientalis) wood is one of the widespread tree species in the World to use in LVL. Beech (Fagus orientalis) wood was investigated herein because of its wide usage in the wood working and construction industry[37] Defect-free draft samples (20mm×750mm×100mm) were subjected to heat treatment. Thermally modification was done under a controlled environment with heat tolerance of ±0.1°C. Thermally modification of the test samples was carried out in three stages (drying at high temperature, heat treatment, cooling, and conditioning) given in Figure 1
In the first stage, the temperature was raised to 100°C for 5 hours, then to 130°C for 10 hours, and then to the target temperature for 5 hours. In the second stage, heat treatment has been applied in the aimed four different temperatures (140°C, 160°C, 180°C and 200°C) for two hours. During stage I and II, steam was applied for 5 seconds at 200°C second intervals. In the third stage, the temperature was decreased to room temperature (20±2°C). The total thermally modification period took 35 hours for each temperature value. After the heat treatment process, the samples were rested in a suitable place under atmospheric conditions for three weeks. There are 7 groups (solid wood beech, PVAc-LVL, PF-LVL, PU-LVL, PVAc-RLVL, PF-RLVL, PU-RLVL) researched, in each group 5 different temperatures
investigated, control 20°C, heat treatment groups 140°C, 160°C, 180°C, 200°C. Totally 350 test samples prepared for mechanical tests.
Many chemical and physical properties of wood are permanently altered by the heating process. The main reason for using the features is the thermal degradation of the half-cells. The desired changes become apparent from about 150 ºC and continue with the stairs as the temperatures of the temperature. Esteves and Pereira published a review about wood modification and heat treatment, they cite 163 publications about heat treatment. In major publications, heat treatment applications were changed from 140°C to 200°C[38]. As a result, moisture rise, and shrinkage fall; biological endurance increases; is the color decision; splitting a large number of decomposing substances flowing through the wood; wood becomes lighter; decrease in equilibrium moisture content; The pH value decreases, and the thermal gloss properties become better.
In this study, 200 gr/m2 plain weave carbon fibre was used as reinforcing materials. Carbon fibres were obtained from Dost Kimya Inc., Istanbul, Turkey. According to the technical data provided by the manufacturer, the tensile strength is 3800 MPa, tensile modulus 240 GPa, average density 1.79 g/cm3 and tensile strain 1.6%.
Polyvinyl acetate (PVAc), phenol-formaldehyde (PF), and polyurethane adhesives (PU) were used as binder. The PVAc and PU adhesives were supplied by POLISAN firm. City, Turkey. PVAc adhesive density is 1.1 g/cm3, viscosity 16.000±3.000 mPa s, and pH 5. PF adhesive was purchased from Gentas Company, Bolu, Turkey. It has a density of 1.12 g/cm3 at 20 °C, pH 8.4, viscosity 600 cPs at 20 °C, and contains solid matter at 48%[4]. PU adhesive has an approximate pH of 7 and a viscosity of 5500-7500 mPa at 25°C. Its density is 1.11±0.02 g/cm3, and the period of solidification at 20°C and 65% relative humidity is 24 h, as specified by Gentas Company, Bolu, Turkey.
Thermally modificated veneers were used in the LVL composites manufacturing. Before producing LVL composites, heat-treated draft samples were cut in the dimension of 4 × 70 × 700 mm (radial direction × tangent direction × longitudinal direction). Conditioned at 20±2°C, and 65±%5 relative humidity for at least three weeks. The lamination process of the test samples was carried out under laboratory conditions at room temperature (20 ±2°C). In this process, the adhesives were applied on one surface of the veneers and both sides of the carbon fibre fabric. They were 180 g/m2 for veneer-veneer bonding and 250 g/m2 for veneer-carbon fibre bonding. The surface characteristics of the carbon fibre fabric were effective to permit in spreading the high amount of adhesive to compensate the weaker bonding properties of the adhesive to the carbon fibre compared to wood samples. The hydraulic pressing of all samples was made with a pressure of 10 N/mm2 and temperature of 130 °C during 30 min for PF, 22 °C during 240 min for PU and 22 °C during 240 min for PVAc, and all the panels were stored for 10 days for curing (The stocks were removed from the hydraulic press and kept in a closed environment for a period of 10 days). After the curing process, 15 mm edges were trimmed off from the panels, and test samples were
Perçin, O., & Ülker, O. Polímeros, 33(1), e20230007, 2023 2/9
Figure 1. Schematic representation of heat treatment process.
Influence of carbon fibre layers on the strength of thermally modified laminated veneer lumber
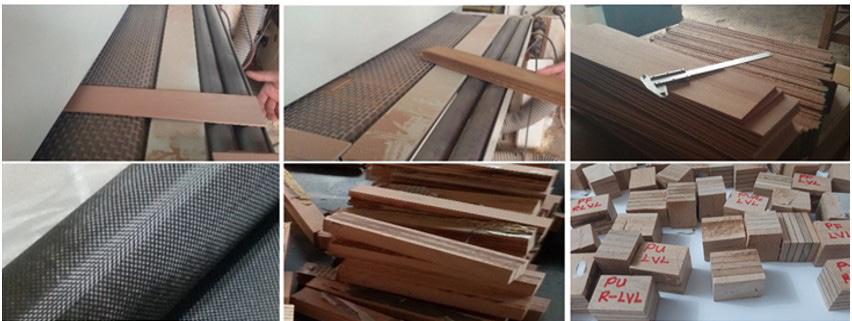
then machined. The manufacturing process of test samples are depicted in Figure 2
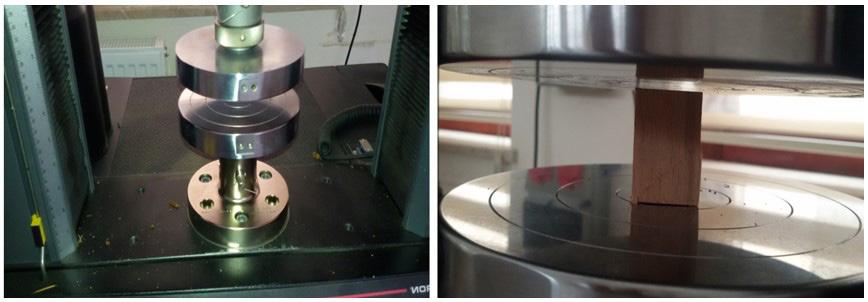
The compressive strength parallel to grain (CS) was determined using a universal testing machine (Instron-5969) according to the ISO 13061-17 (2017) standard[39]. The dimensions of the test samples were 20 mm × 20 mm × 30 mm and during tests the loading rate was 2.5 mm/min. Ten samples were prepared in each experimental group. Figure 3 depicts the test setup for compressive strength parallel to grain test. Specimens were conditioned in a conditioning chamber at temperatures of 20 ±2 °C and relative humidity of 65 ±5% until reached constant weight before the mechanical test. After the climatization process, the mass of each specimen (M) and volume (V) were determined. The air-dry density (D) of the specimens was determined according to ISO 13061-2 (2014)[40] and calculated using Equation 1:
Analysis of variance (ANOVA) tests were performed to determine the effect of thermal treatment temperature, carbon fibre fabric and adhesive types on the compressive strength parallel to grain of beech wood at the 0.05 significance level. Significant differences between the average values of the groups were compared using Duncan’s test by using the Least Significant Difference (LSD) value.
3. Results and Discussions
The CS value was calculated by using Equation 2:
where P max is the maximum load applied to the specimens (N), b is the width of the specimens (mm), and d is their thickness (mm).
In Table 1, the mean values of the specimens density are listed. The density value of three types of reinforced LVL were higher than that both unreinforced LVL and solid woods groups. The highest density was 776 kg/m3 for the reinforced specimens bonded with PF adhesive control group. Increases in density can be explained by the greater amount of adhesive spread in the reinforced samples and the higher density of the carbon fibre fabric regarding the base materials. Wei et al.[41] evaluated the effect of carbon fibre reinforced polymer LVL. The authors reported that the reinforcing process increased the density value of test samples. Also, Auriga et al.[17] reported that density of the reinforced samples with carbon fibres was higher than the control group. Density of wood and wood-based composites are one of the most important properties that affect other physical and mechanical properties, and it is commonly considered as the predictor of strength properties[42], in
Polímeros, 33(1), e20230007, 2023 3/9
( ) 3 / DgmmMV = (1)
( ) 2 / . max CSNmmPbd = (2)
Figure 2. The manufacturing process of test samples.
Figure 3. Test setup for compressive strength parallel to grain.
In this study, density values of reinforced and unreinforced LVL specimens varied significantly. According to Table 1 heat treatment significantly reduces the density of specimens as the applied temperature is increased, regardless of the material tested. The largest reduction on the density of Fagus orientalis were -4.22% at the 180°C and -6.64% at the 200 °C. It is well known that the heating of wood significantly changes its physical and mechanical properties due to degradation of hemicelluloses[39,43,44] which is proportional to the applied temperature.
Density values of samples were heavily dependent on properties of the adhesives used and press conditions. When the density values were compared, the density values of the samples laminated with PF glue were higher than the density values of the samples laminated with the other two glues. This may have been due to the difference in the pressing process with PF glue. In the pressing process with PF glue, a
small mechanical condensation process may have occurred here, since temperature is applied along with press pressure. This may have led to an increase in the density values of the samples laminated with PF glue. This situation can be explained by the distinct structural properties of the PF
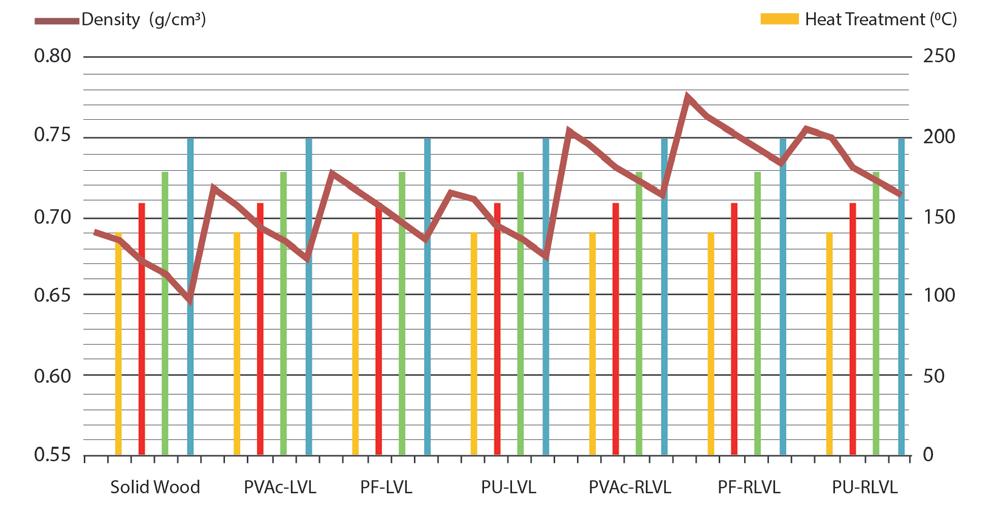
Perçin, O., & Ülker, O. Polímeros, 33(1), e20230007, 2023 4/9
Figure 4, seven groups of specimens density and heat treatment groups illustrated.
Group of Samples Heat Treatment (°C) Density (g mm-3) (Mean value) Min (g mm-3) Max (g mm-3) SD (Standard Deviation) Changes (%) Solid Wood beech (Fagus orientalis) Control 0.691 0.655 0.731 0.025140 0.684 0.657 0.719 0.017 -1.02 160 0.672 0.653 0.698 0.016 -2.83 180 0.663 0.639 0.697 0.015 -4.22 200 0.648 0.614 0.683 0.020 -6.64 PVAc-LVL Unheated 0.717 0.685 0.751 0.020 3.63 140 0.707 0.675 0.733 0.017 2.26 160 0.693 0.668 0.711 0.015 0.29 180 0.684 0.645 0.722 0.025 -1.02 200 0.673 0.631 0.699 0.000 -2.67 PF-LVL Unheated 0.727 0.708 0.748 0.014 4.95 140 0.716 0.681 0.755 0.024 3.49 160 0.706 0.673 0.745 0.021 2.12 180 0.695 0.676 0.723 0.016 0.58 200 0.685 0.668 0.707 0.013 -0.88 PU-LVL Unheated 0.715 0.679 0.724 0.014 3.36 140 0.711 0.685 0.739 0.019 2.81 160 0.694 0.663 0.749 0.023 0.43 180 0.686 0.652 0.721 0.021 -0.73 200 0.675 0.649 0.695 0.016 -2.37 PVAc-RLVL Unheated 0.753 0.732 0.775 0.015 8.23 140 0.744 0.698 0.779 0.025 7.12 160 0.731 0.676 0.763 0.026 5.47 180 0.721 0.673 0.759 0.027 4.16 200 0.713 0.665 0.743 0.028 3.09 PF-RLVL Unheated 0.776 0.739 0.799 0.019 10.95 140 0.763 0.747 0.789 0.012 9.44 160 0.752 0.715 0.779 0.019 8.11 180 0.742 0.699 0.773 0.025 6.87 200 0.733 0.681 0.769 0.024 5.73 PU-RLVL Unheated 0.754 0.705 0.776 0.020 8.36 140 0.748 0.721 0.766 0.015 7.62 160 0.729 0.695 0.769 0.024 5.21 180 0.722 0.685 0.751 0.023 4.29 200 0.712 0.688 0.745 0.019 2.95
Table 1. The density values of LVL and RLVL (reinforced LVL) samples.
Figure 4. Density values according to heat treatment at solid wood, LVL and RLVL samples.
Influence of carbon fibre layers on the strength of thermally modified laminated veneer lumber
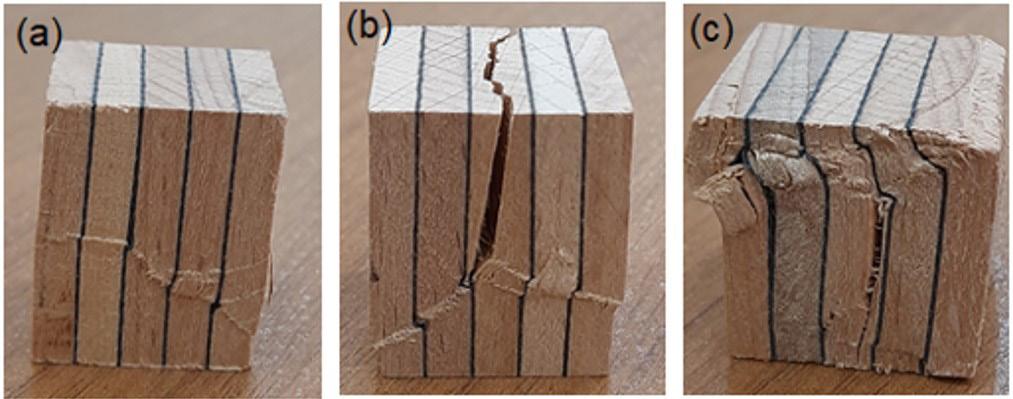
adhesive itself and the laminate production process. In the lamination process with PF adhesive, the press temperature was applied as 130 °C and the press time was 30 min. On the other hand, PVAc and PU adhesives were also applied at a temperature of 25 °C and press time 240 min. The press pressure was 10 N mm-2 in the production of all samples. Lamination process beech veneers glued with PF resins at hot pressure may have caused thermo-mechanical densification and consequently this situation may have been caused an increase in samples density[45].
In recent years, interest in thermal modification of wood and reinforced wood composite materials have been increasing and its use in structural applications is increasing[17,45-51]. It is a widely known fact that heat treated wood material can be more brittle than unheated wood and prone to cracking. Due to the increased brittleness of heat-treated wood material and important to determine the fracture properties if it is used in structural applications particularly fracture in tension perpendicular to the grain[52,53]
In the present study, failure types of solid wood and laminated veneer lumbers in compression parallel to grain were significantly changed after heat treatment. Compared with the unheated samples, delamination of adhesive layer and fracture type of specimens at maximum compressive load of heat-treated sample was much more serious and different. Fracture occurred abruptly at maximum load in samples that were thermally modificated at 180°C and 200°C while non-modified specimens were plastification before failure.
The three most common failure modes are depicted in Figure 5. The failure caused by shearing is presented in Figure 5a. splitting and shearing failure is depicted in Figure 5b and crushing, and splitting failure is illustrated in Figure 5c de la Rosa García et al.[54] stated that the fracture toughness of thermally modified of wood material is not only dependent on the density, but also depend on the temperature, changes in the internal structure of wood and the degree of degradation of the cell wall components. Also, Sebera et al.[42] reported the fracture properties of heat-treated beech wood should be taken into consideration for structural application, when cyclic loading may lead to microcracking and material fatigue.
Table 2 shows the effects of reinforcement on the compressive strength parallel to the grains (CS) and Duncan test results of LVL and RLVL laminates. It has been shown that the effect of adhesive type, and carbon fibre fabric on the compressive strength parallel to the grains was significant (p˂0.05). An increase of CS was observed for all samples made with the addition of carbon fibre compared to the unreinforced and solid wood groups. Also, Table 2 shows that the CS decreases significantly with thermal treatment. It appears that the heat treatment, type of adhesive and reinforcement influence the CS differently. After reinforcement process of heat-treated and unheated samples, the CS improved greatly. The values of the CS of the reinforced samples are significantly higher from 1.02% to 24.27% than those of the control samples. Based on the findings in this study, the results showed that CS values increased at low temperatures, while it decreased with increasing treatment temperature. According to Table 2, CS values varied largely.
Average CS of the samples varied from 64.21 Nmm-2 (200°C) to 90.61 Nmm-2 (160°C). While the CS values increased at low temperatures, they decreased as the temperature increased in all the test groups. The maximum decrease and increase percentages of CS were 6.83% (200°C) and 24.27% (160°C), respectively. Increase in compressive strength parallel to the grain at low temperatures can be explained by the decrease in moisture content due to the increase in cellulose crystallinity[18], while the significant decrease in CS values at high temperatures can be explained by the chemical change and degradation of chemical compounds of the wood material[39]. Average CS values of the test samples in solid wood group agree with the literature[55] In addition, Boonstra et al.[34] evaluated the influences of high temperatures (ranging from 150 to 260°C) on the mechanical properties of wood material and stated that heat treatment increased CS values of samples.
As shown in Table 2, average CS values of samples ranged from 64.21 N/mm2 (200°C) to 71.27 N/mm2 (160°C) in solid wood groups. At relatively low temperatures, some increases in CS values (up to 3.72% (at 160°C) were obtained. However, intensive heat treatment caused some
Polímeros, 33(1), e20230007, 2023 5/9
Figure 5. Failure modes in compression parallel to the grain of specimens reinforced LVL. (a) Shearing failure; (b) Splitting and shearing failure; (c) crushing and splitting.
decreases (6.83% at 200°C). In PVAc-LVL group, average CS of samples were ranged from 69.53 N/mm2 (unheated) to 74.61 N/mm2 (at 160°C). In this group, CS increased from 1.31% (unheated) to 8.03% (at 160°C) but decreased by 6.80% (at 200°C) according to control samples. Considering the PF-LVL group, average CS of samples ranged from 72.98 N/mm2 (at 200 °C) to 77.58 N/mm2 (at 160°C). The CS increased from 5.08% (unheated) to 11.55% (at 160°C). However, as the heat treatment temperature increased, CS value presented a declining trend.
Considering the reinforced samples, an increase of CS was observed for all LVL made with the addition of carbon fibres compared to the control samples. All the CS values in PVAc-RLVL group increased. The increases were 10.15% (unheated), 14.46% (at 140°C), 17.43% (at 160°C), 13.02% (at 180°C), and 1.02% (at 200°C) compared to the control samples. However, as the heat treatment conditions got harsher, CS value displayed a declining trend, especially at 200°C. Regarding the PF-RLVL group the highest CS value
was determined in samples that were heat treated at 160 °C. Average CS values of this samples significantly increased according to control samples. In addition, the CS values of the reinforced samples were higher than the massive and LVL samples that were heat treated at the same temperature. The CS value increased by 16.51% in unheated samples, by 20.31 at 140°C, by 24.27% at 160°C, by 22.44% at 180°C, and by 17.66% at 200°C. In PU-RLVL group, CS value of all reinforced samples were higher than that of the control samples. Regarding the increase, rates were 10.24% for unheated samples, 14.59% at 140°C, 18.27% at 160°C, 10.38% at 180°C, and 8.08% at 200°C.
The obtained results showed that the three lower temperatures have a positive effect on CS, while the heat treatment at a temperature of 200 °C reduced it. In many studies in the literature, it has been stated that the heat treatment temperatures applied approximately up to 170 °C are critical point for wood material[35,56,57]. Hidayat et al. [58] reported CS values of the wood material decreased
Perçin, O., & Ülker, O. Polímeros, 33(1), e20230007, 2023 6/9
Group of Samples Heat Treatment (°C) CS (N/mm2) (Mean value) SD (Standard deviation) HG (Homogeneity groups) Changes (%) Solid Wood (Beech) Control 68.62 3.83 P140 69.11 4.31 OP 0.71 160 71.27 3.37 M 3.72 180 67.48 3.02 Q -1.69 200 64.21 3.10 S -6.83 PVAc-LVL Unheated 69.53 3.58 O 1.31 140 72.47 3.86 L 5.31 160 74.61 3.48 K 8.03 180 72.71 4.11 L 5.63 200 64.29 3.76 S -6.80 PF-LVL Unheated 72.29 4.05 L 5.08 140 74.62 3.85 K 8.04 160 77.58 3.22 I 11.55 180 77.07 3.69 IJ 10.96 200 72.98 4.04 L 5.97 PU-LVL Unheated 70.49 4.41 MN 2.65 140 72.91 3.46 L 5.88 160 75.37 3.90 K 8.96 180 69.72 4.09 NO 1.58 200 65.49 4.31 R -4.78 PVAc-RLVL Unheated 76.37 3.56 J 10.15 140 80.22 4.57 G 14.46 160 83.11 4.21 E 17.43 180 78.89 3.98 H 13.02 200 69.33 4.35 OP 1.02 PF-RLVL Unheated 82.19 4.29 F 16.51 140 86.11 3.44 C 20.31 160 90.61 3.59 A 24.27 180 88.47 3.47 B 22.44 200 83.34 3.33 DE 17.66 PU-RLVL Unheated 76.45 3.41 J 10.24 140 80.34 3.76 G 14.59 160 83.96 3.46 D 18.27 180 76.57 3.14 J 10.38 200 74.65 3.37 K 8.08
Table 2. Results of the Duncan tests of the Specimens.
depending on the heat treatment temperature, also there was no significant change in the range of 160°C to 180°C, however, significant strength losses were determined at temperatures above 200°C and 220°C. The increase in CS values after heat treatment at relatively low temperatures can be explained by the decrease in moisture content due to the increase in cellulose crystallinity[18], while the significant losses in mechanical strength at high temperatures can be explained by the chemical change and the degradation of chemical components of the wood[40,58,59]. Therefore, using carbon fibre fabric and PF could improve the CS of LVL. The maximum increase was determined in reinforced samples that were laminated with PF similar results found by Perçin and Altunok[2]. The anatomical structure and density of the wood material significantly affect its mechanical properties, including compressive strength parallel to the grains[52,60-64].
As can be seen in Figure 6, wood density had a significant linear relationship with CS (R2= 0.6211 and P= 0.0082). It was found to be a significant correlation among density and compression strength parallel to the grain. Wood density is a commonly used wood quality indicator that is related to other wood mechanical strength[65,66]
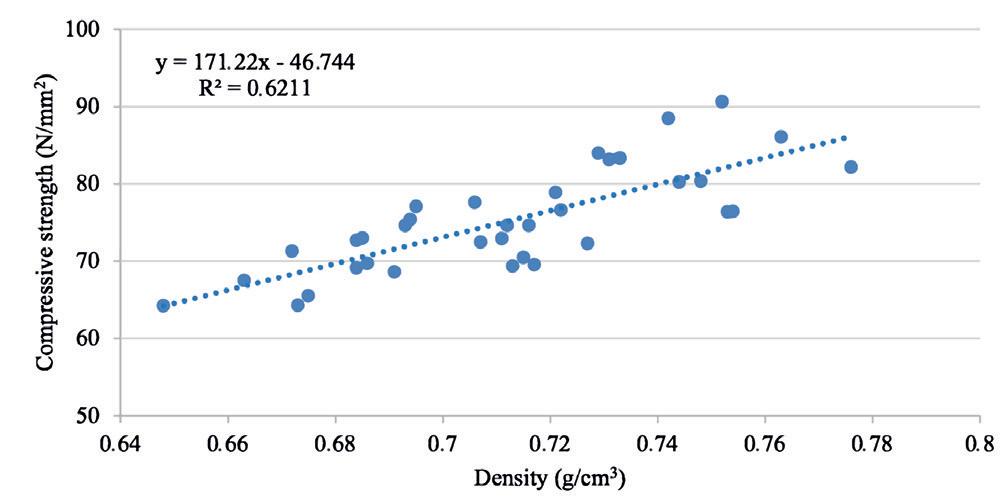
4. Conclusions
The results of an experimental test of the reinforcement by carbon fibres on compressive strength parallel to the grain of LVL bonded with phenol-formaldehyde (PF), polyvinyl acetate (PVAc) and polyurethane adhesives (PU) using thermally modificated beech (Fagus orientalis) veneers. The results showed that thermally modification reduced density of beech wood. Moreover, higher temperatures gave lower density after heat treatment. Carbon fibre reinforcement placed within the layers increased density in all reinforced specimens. The results demonstrated that the density values of samples were heavily dependent on carbon fibre, properties of the adhesives used and press conditions. The results also confirmed compressive strength parallel to the grain increased up to 160 °C after then it yielded a declining trend. Different failure behavior (abrupt fracture at medium and higher temperature) of heat-treated wood was observed during the CS tests. While plastic deformation forms were formed in the samples that were not heat-treated, sudden rupture types were commonly determined due to the increase in temperature. CS values increased at low temperature, while it decreased with increasing treatment temperature. Therefore, increase of CS was observed for all specimens made with the addition of carbon fibre fabrics bonded with
different adhesive compared to the unreinforced and solid wood and CS of all the thermally modificated specimens were significantly improved. It was evident from experimental results, the PF adhesive provided better results compared to others. In future studies, carbon fiber material is an effective material against combustion, topics related to combustion or combustion after the pyrolysis process of wood.
5. Author’s Contribution
• Conceptualization – Onur Ülker; Osman Perçin.
• Data curation – Osman Perçin; Onur Ülker.
• Formal analysis – Onur Ülker.
• Funding acquisition – Osman Perçin.
• Investigation – Onur Ülker; Osman Perçin.
• Methodology – Onur Ülker; Osman Perçin.
• Project administration – Onur Ülker
• Resources – Osman Perçin; Onur Ülker.
• Software – Osman Perçin; Onur Ülker.
• Supervision – Osman Perçin
• Validation – Onur Ülker
• Visualization – Onur Ülker
• Writing – original draft – Onur Ülker; Osman Perçin.
• Writing – review & editing – Onur Ülker; Osman Perçin.
6. References
1 Malaga-Toboła, U., Łapka, M., Tabor, S., Niesłony, A., & Findura, P. (2019). Influence of wood anisotropy on its mechanical properties in relation to the scale effect. International Agrophysics, 33(3), 337-345 http://dx.doi.org/10.31545/intagr/110808
2 Percin, O., & Altunok, M. (2017). Some physical and mechanical properties of laminated veneer lumber reinforced with carbon fibre using heat-treated beech veneer. Holz als Roh- und Werkstoff, 75(2), 193-201 http://dx.doi.org/10.1007/s00107-016-1125-z
3 Ramage, M. H., Burridge, H., Busse-Wicher, M., Fereday, G., Reynolds, T., Shah, D. U., Wu, G., Yu, L., Fleming, P., Densley-Tingley, D., Allwood, J., Dupree, P., Linden, P. F., & Scherman, O. (2017). The wood from the trees: the use of timber in construction. Renewable & Sustainable Energy Reviews, 68(Part 1), 333-359 http://dx.doi.org/10.1016/j. rser.2016.09.107
4 Kol, H. S., Özbay, G., Köse, L., & Kurt, S. (2010). Effects of some impregnation chemicals on combustion characteristics of laminated veneer lumber (LVL) produced with oak and poplar veneers. BioResources, 5(1), 70-80. Retrieved in 2022, July 01, from https://bioresources.cnr.ncsu.edu/BioRes_05/ BioRes_05_1_0070_SahinKol_OKK_Impreg_Chem_Combus_ Veneer_Oak_Poplar_727.pdf
5 Sandberg, D. (2016). Additives in wood products—today and future development. In A. Kutnar & S. S. Muthu (Eds.), Environmental impacts of traditional and innovative forestbased bioproducts (pp. 105-172). Singapura: Springer http:// dx.doi.org/10.1007/978-981-10-0655-5.
6 Chowdhury, Q., Ishiguri, F., Iizuka, K., Hiraiwa, T., Matsumoto, K., Takashima, Y., Yokota, S., & Yoshizawa, N. (2009). Wood property variation in Acacia auriculiformis growing in Bangladesh. Wood and Fiber Science, 41(4), 359-365
7 Costa, M. A., & Del Menezzi, C. H. S. (2017). Effect of thermo-mechanical treatment on properties of parica plywoods
Polímeros, 33(1), e20230007, 2023 7/9
Influence of carbon fibre layers on the strength of thermally modified laminated veneer lumber
Figure 6. Linear regression and the coefficient of determination (R2) of wood density and CS.
(Schizolobium amazonicum Huber ex Ducke). Revista Árvore, 41(1), e410115 http://dx.doi.org/10.1590/180690882017000100015
8 Schober, K.-U., Harte, A. M., Kliger, R., Jockwer, R., Xu, Q., & Chen, J.-F. (2015). FRP reinforcement of timber structures. Construction & Building Materials, 97, 106-118. http://dx.doi. org/10.1016/j.conbuildmat.2015.06.020.
9 Song, Y.-J., Hong, S.-I., Suh, J.-S., & Park, S.-B. (2017). Strength performance evaluation of moment resistance for cylindrical-LVL column using GFRP reinforced wooden pin. Wood Research, 62(3), 417-426. Retrieved in 2022, July 01, from http://www.woodresearch.sk/cms/strength-performanceevaluation-of-moment-resistance-for-cylindrical-lvl-columnusing-gfrp-reinforced-wooden-pin/
10 Missanjo, E., & Matsumura, J. (2016). Wood density and mechanical properties of Pinus kesiya Royle ex Gordon in Malawi. Forests, 7(7), 135 http://dx.doi.org/10.3390/f7070135
11 Miyoshi, Y., Kojiro, K., & Furuta, Y. (2018). Effects of density and anatomical feature on mechanical properties of various wood species in lateral tension. Journal of Wood Science, 64(5), 509-514 http://dx.doi.org/10.1007/s10086-018-1730-z
12 Andor, K., Lengyel, A., Polgár, R., Fodor, T., & Karácsonyi, Z. (2019). Experimental and statistical analysis of formwork beams reinforced with CFRP. Periodica Polytechnica. Civil Engineering, 63(1), 184-191 http://dx.doi.org/10.3311/ PPci.13057
13. Arruda, L. M., & Del Menezzi, C. H. S. (2013). Effect of thermomechanical treatment on physical properties of wood veneers. International Wood Products Journal, 4(4), 217-224 http://dx.doi.org/10.1179/2042645312Y.0000000022
14 Brol , J. , & Wdowiak-Postulak , A. (2019 ). Old timber reinforcement with FRPs. Materials (Basel), 12(24), 4197 http://dx.doi.org/10.3390/ma12244197 PMid:31847239.
15 Korkut, D. S., Korkut, S., & Dilik, T. (2008). Effect of heat treatment on some mechanical properties of laminated window profiles manufactured using two types of adhesives. International Journal of Molecular Sciences, 9(4), 454-463. http://dx.doi.org/10.3390/ijms9040454. PMid:19325761.
16 Örs, Y., Atar, M., & Keskin, H. (2004). Bonding strength of some adhesives in wood materials impregnated with ImersolAqua. International Journal of Adhesion and Adhesives, 24(4), 287-294 http://dx.doi.org/10.1016/j.ijadhadh.2003.10.007
17 Auriga, R., Gumowska, A., Szymanowski, K., Wronka, A., Robles, E., Ocipka, P., & Kowaluk, G. (2020). Performance properties of plywood composites reinforced with carbon fibres. Composite Structures, 248, 112533 http://dx.doi.org/10.1016/j. compstruct.2020.112533
18 Bekhta, P., & Niemz, P. (2003). Effect of high temperature on the change in color, dimensional stability, and mechanical properties of spruce wood. Holzforschung, 57(5), 539-546 http://dx.doi.org/10.1515/HF.2003.080
19 Bektaş, İ., Güler, C., & Baştürk, M. A. (2002). Principal mechanical properties of Eastern beech wood naturally grown in Andirin Northeastern Mediterranean region of Turkey. Turkish Journal of Agriculture and Forestry, 26(3), 147-154 Retrieved in 2022, July 01, from https://journals.tubitak.gov. tr/agriculture/vol26/iss3/6
20. Li, Y.-F., Xie, Y.-M., & Tsai, M.-J. (2009). Enhancement of the flexural performance of retrofitted wood beams using CFRP composite sheets. Construction & Building Materials, 23(1), 411-422 http://dx.doi.org/10.1016/j.conbuildmat.2007.11.005
21 Lu, W., Ling, Z., Geng, Q., Liu, W., Yang, H., & Yue, K. (2015). Study on flexural behaviour of glulam beams reinforced by Near Surface Mounted (NSM) CFRP laminates. Construction & Building Materials, 91, 23-31 http://dx.doi.org/10.1016/j. conbuildmat.2015.04.050
22 Derikvand, M., Kotlarewski, N., Lee, M., Jiao, H., & Nolan, G. (2019). Characterisation of physical and mechanical properties of unthinned and unpruned plantation-grown Eucalyptus nitens H. Deane & Maiden lumber. Forests, 10(2), 194 http://dx.doi. org/10.3390/f10020194
23. Ministry of Supply and Services. (1996). No. Fo42-91/1461996E - Development of composite glued laminated timber Canada: Ministry of Supply and Services
24 Gryc, V., & Horáček, P. (2007). Variability in density of spruce (Picea abies [L.] Karst.) wood with the presence of reaction wood. Journal of Forest Science, 53(3), 129-137 http://dx.doi. org/10.17221/2146-JFS
25 Hill, C., Altgen, M., & Rautkari, L. (2021). Thermal modification of wood-A review: chemical changes and hygroscopicity. Journal of Materials Science, 56(11), 6581-6614. http://dx.doi. org/10.1007/s10853-020-05722-z.
26 Hlásková, L., Procházka, J., Novák, V., Čermák, P., & Kopecký, Z. (2021). Interaction between thermal modification temperature of spruce wood and the cutting and fracture parameters. Materials (Basel), 14(20), 6218 http://dx.doi.org/10.3390/ ma14206218 PMid:34683809.
27 Johnsson, H., Blanksvärd, T., & Carolin, A. (2006). Glulam members strengthened by carbon fibre reinforcement, materials, and structure. Materials and Structures, 40(1), 47-56. http:// dx.doi.org/10.1617/s11527-006-9119-7.
28 Kačíková, D., Kačík, F., Čabalová, I., & Ďurkovič, J. (2013). Effects of thermal treatment on chemical, mechanical and colour traits in Norway spruce wood. Bioresource Technology, 144, 669-674 http://dx.doi.org/10.1016/j.biortech.2013.06.110 PMid:23871194.
29 Kutnar, A., & Šernek, M., (2007). Densification of wood. Zbornik Gozdarstva in Lesarstva, 82, 53-62
30 Sandberg, D., Kutnar, A., & Mantanis, G. (2017). Wood modification technologies - A review. iForest - Biogeosciences and Forestry, 10(6), 895-908 http://dx.doi.org/10.3832/ ifor2380-010
31 Silva, M. R., Machado, G. O., Brito, J. O., & Calil, C., Jr. (2013). Strength and stiffness of thermally rectified eucalyptus wood under compression. Materials Research, 16(5), 1077-1083 http://dx.doi.org/10.1590/S1516-14392013005000086
32. Sviták, M., & Ruman, D. (2017). Tensile-shear strength of layered wood reinforced by carbon materials. Wood Research, 62(2), 243-252. Retrieved in 2022, July 01, from http://www. woodresearch.sk/cms/tensile-shear-strength-of-layered-woodreinforced-by-carbon-materials/
33 Wang, J., Jiang, N., & Jiang, H. (2009). Effect of the evolution of phenol–formaldehyde resin on the high-temperature bonding. International Journal of Adhesion and Adhesives, 29(7), 718723 http://dx.doi.org/10.1016/j.ijadhadh.2009.03.001
34. Boonstra, M. J., Van Acker, J., Tjeerdsma, B. F., & Kegel, E. V. (2007). Strength properties of thermally modified softwoods and its relation to polymeric structural wood constituents. Annals of Forest Science, 64(7), 679-690 http://dx.doi.org/10.1051/ forest:2007048
35 Wang, J., Guo, X., Zhong, W., Wang, H., & Cao, P. (2015). Evaluation of mechanical properties of reinforced poplar laminated veneer lumber. BioResources, 10(4), 7455-7465 http://dx.doi.org/10.15376/biores.10.4.7455-7465
36. Yapici, F., Esen, R., Yorur, H., & Likos, E. (2013). The effects of heat treatment on the modulus of rupture and modulus of elasticity of scots pine (Pinus Sylvestris L.) wood. NWSATechnological Applied Sciences, 8(1), 1-6
37 Bektaş, İ., Oruç, S., & Ak, A. K. (2016). Some technological properties of pedunculate oak wood grown in Hatay-Dörtyol region. Turkish Journal of Forestry, 17(2), 178-186 http:// dx.doi.org/10.18182/tjf.55302
Perçin, O., & Ülker, O. Polímeros, 33(1), e20230007, 2023 8/9
Influence of carbon fibre layers on the strength of thermally modified laminated veneer lumber
38 Esteves, B. M., & Pereira, H. M. (2009). Wood modification by heat treatment: a review. BioResources, 4(1), 370-404 http://dx.doi.org/10.15376/biores.4.1.Esteves
39 International Organization for Standardization - ISO ISO 13061-17:2017 - Physical and mechanical properties of wood — Test methods for small clear wood specimens — Part 17: Determination of ultimate stress in compression parallel to grain Geneva: ISO; 2017
40 International Organization for Standardization - ISO ISO 13061-2:2014 - Physical and mechanical properties of wood — Test methods for small clear wood specimens — Part 2: Determination of density for physical and mechanical tests. 2014 Geneva: ISO; 2014
41 Wei, P., Wang, B. J., Zhou, D., Dai, C., Wang, Q., & Huang, S. (2013). Mechanical properties of poplar laminated veneer lumber modified by carbon fibre reinforced polymer. BioResources, 8(4), 4883-4898. http://dx.doi.org/10.15376/ biores.8.4.4883-4898
42 Sebera, V., Redón-Santafé, M., Brabec, M., Děcký, D., Čermák, P., Tippner, J., & Milch, J. (2019). Thermally modified (TM) beech wood: compression properties, fracture toughness and cohesive law in mode II obtained from the three-point endnotched flexure (3ENF) test. Holzforschung, 73(7), 663-672 http://dx.doi.org/10.1515/hf-2018-0188
43 Tan, H., Ulusoy, H., & Peker, H. (2020). Antioxidant stone water (human/friendly environment) thermal (thermogravimetric-tga) combustion properties in biohazard (insect/fungus) wood. Polímeros, 30(2), e2020014 http://dx.doi.org/10.1590/0104-1428.00720
44 Tan, H. (2021). Analysis of some top surface treatment materials with the artificial neural network method. Fresenius Environmental Bulletin, 30(11), 12421-12429
45 Ulker, O., Aslanova, F., & Hiziroglu, S. (2018). Properties of thermally treated yellow poplar, southern pine, and eastern redcedar. BioResources, 13(4), 7726-7736 http://dx.doi. org/10.15376/biores.13.4.7726-7737
46 Esteves, B., Graça, J., & Pereira, H. (2008). Extractive composition and summative chemical analysis of thermally treated eucalypt wood. Holzforschung, 62(3), 344-351 http:// dx.doi.org/10.1515/HF.2008.057.
47 Figueroa, M. J. M., Moraes, P. D. D., & Maestri, F. A. (2015). Temperature and moisture content effects on compressive strength parallel to the grain of paricá. Ambiente Construído, 15(1), 17-27 http://dx.doi.org/10.1590/S1678-86212015000100003
48 Morales-Conde, M. J., Rodríguez-Liñán, C., & Rubio-de Hita, P. (2015). Bending and shear reinforcements for timber beams using GFRP plates. Construction & Building Materials, 96, 461-472 http://dx.doi.org/10.1016/j.conbuildmat.2015.07.079
49 Nadir, Y., Nagarajan, P., Ameen, M., & Arif, M. M. (2016). Flexural stiffness and strength enhancement of horizontally glued laminated wood beams with GFRP and CFRP composite sheets. Construction & Building Materials, 112, 547-555 http:// dx.doi.org/10.1016/j.conbuildmat.2016.02.133
50 Nairn, J. A. (2006). Numerical simulations of transverse compression and densification in wood. Wood and Fiber Science, 38(4), 576-591. Retrieved in 2022, July 01, from https://wfs.swst.org/index.php/wfs/article/view/2/2
51 Ulker, O., İmirzi, Ö., & Burdurlu, E. (2012). The effect of densification temperature on some physical and mechanical properties of Scots pine (PINUS SYLVESTRIS L.). BioResources, 7(4), 5581-5592 http://dx.doi.org/10.15376/ biores.7.4.5581-5592.
52 Jirouš-Rajković, V., & Miklečić, J. (2019). Heat-treated wood as a substrate for coatings, weathering of heat-treated wood, and coating performance on heat-treated wood. Advances in Materials Science and Engineering, 2019, 8621486 http:// dx.doi.org/10.1155/2019/8621486.
53 Khelifa, M., Lahouar, M. A., & Celzard, A. (2015). Flexural strengthening of finger-jointed Spruce timber beams with CFRP. Journal of Adhesion Science and Technology, 29(19), 2104-2116. http://dx.doi.org/10.1080/01694243.2015.1057395
54 de la Rosa García, P., Escamilla, A. C., & García, M. N. G. (2013). Bending reinforcement of timber beams with composite carbon fibre and basalt fibre materials. Composites. Part B, Engineering, 55, 528-536 http://dx.doi.org/10.1016/j. compositesb.2013.07.016
55 Kol, H. Ş., Keskin, S. A., & Vaydoğan, K. G. (2018). Effect of heat treatment on the mechanical properties and dimensional stability of beech wood. Journal of Advanced Technology Sciences, 6(3), 820-830
56 Glišović, I., Stevanović, B., Todorović, M., & Stevanović, T. (2016). Glulam beams externally reinforced with CFRP plates. Wood Research, 61(1), 141-154. Retrieved in 2022, July 01, from http://www.woodresearch.sk/wr/201601/14.pdf
57 Izekor, D. N., Fuwape, J. A., & Oluyege, A. O. (2010). Effects of density on variations in the mechanical properties of plantation grown Tectona grandis wood. Archives of Applied Science Research, 2(6), 113-120
58. Hidayat, W., Jang, J. H., Park, S. H., Qi, Y., Febrianto, F., Lee, S. H., & Kim, N. H. (2015). Effect of temperature and clamping during heat treatment on physical and mechanical properties of okan wood. BioResources, 10(4), 6961-6974 Retrieved in 2022, July 01, from https://bioresources.cnr.ncsu. edu/resources/effect-of-temperature-and-clamping-duringheat-treatment-on-physical-and-mechanical-properties-ofokan-cylicodiscus-gabunensis-taub-harms-wood/
59 Shukla, S. R., & Kamdem, D. P. (2008). Properties of laminated veneer lumber (LVL) made with low density hardwood species: effect of the pressure duration. Holz als Roh- und Werkstoff, 66(2), 119-127 http://dx.doi.org/10.1007/s00107-007-0209-1
60 Hiziroglu, S. (2009). Laminated veneer lumber (LVL) as a construction material. Food Technology Fact Sheet, FAPC-163, 4.
61 Kiaei, M., Bakhshi, R., Saffari, M., & Golkari, S. (2015). The within-tree variation in wood density and mechanical properties and their relationship in juniperus polycarpos. Journal of Forest and Environmental Science, 31(4), 267-271. http://dx.doi.org/10.7747/JFES.2015.31.4.267
62 Kučerová, V., Lagaňa, R., Výbohová, E., & Hýrošová, T. (2016). The effect of chemical changes during heat treatment on the color and mechanical properties of fir wood. BioResources, 11(4), 9079-9094 http://dx.doi.org/10.15376/biores.11.4.9079-9094
63 Kubojima, Y., Okano, T., & Ohta, M. (2000). Bending strength and toughness of heat-treated wood. Journal of Wood Science, 46(1), 8-15 http://dx.doi.org/10.1007/BF00779547
64 Majano-Majano, A., Hughes, M., & Fernandez-Cabo, J. L. (2012). The fracture toughness and properties of thermally modified beech and ash at different moisture contents. Wood Science and Technology, 46(1), 5-21 http://dx.doi.org/10.1007/ s00226-010-0389-4
65 Kliger, I. R., Haghani, R., Brunner, M., Harte, A. M., & Schober, K.-U. (2016). Wood-based beams strengthened with FRP laminates: improved performance with pre-stressed systems. Holz als Roh- und Werkstoff, 74(3), 319-330 http://dx.doi. org/10.1007/s00107-015-0970-5
66. Pelit, H., & Emiroglu, F. (2021). Density, hardness and strength properties of densified fir and aspen woods pretreated with water repellents. Holzforschung, 75(4), 358-367 http://dx.doi. org/10.1515/hf-2020-0075
Received: July 01, 2022
Revised: Jan. 27, 2023
Accepted: Mar. 02, 2023
Polímeros, 33(1), e20230007, 2023 9/9
Ternary segmented polyurethanes: morphology and kinetics of the crystallization
André Sanches Bevilacqua1 , Rafael Bergamo Trinca1 and Maria Isabel Felisberti1*
1Instituto de Química, Universidade Estadual de Campinas – UNICAMP, Campinas, SP, Brasil *misabel@unicamp.br
Obstract
Segmented polyurethanes based on poly(l-lactide)diol – PLLA, poly(ethylene-glycol) – PEG, poly(trimethylenecarbonate)diol – PTMC and hexamethylene diisocyanate were synthesized by a two-step polyaddition. Polyurethanes with variable compositions and molar mass were semi-crystalline and presented PLLA or PLLA + PEG crystalline phases and a heterogeneous amorphous phase. Sequential crystallization of PLLA and PEG resulted in a confined PEG crystallization into the PLLA crystalline phase. The random distribution of the segments in the polymer chains and the partial miscibility of the segments in the amorphous phase strongly influenced the morphology of the crystalline phase, and the kinetics of the crystallization. Morphology changed from not well-defined spherulites with Maltese cross to ring banded spherulites and axialites as the PLLA mass fraction decreased. PLLA nucleation and crystal growth rates varied with crystallization temperature similarly to homopolymers, presenting a bell-shaped curve, and the temperature for the maximum growth rate dependent on the polyurethanes composition.
Keywords: crystallization, kinetics, morphology, segmented polyurethanes.
How to cite: Bevilacqua, A. S., Trinca, R. B., & Felisberti, M. I. (2023). Ternary segmented polyurethanes: morphology and kinetics of the crystallization. Polímeros: Ciência e Tecnologia, 33(1), e20230008. https://doi.org/10.1590/01041428.20220123
1. Introduction
Crystallization is an important issue in polymer science because this process is amenable to be tailored to improve properties[1]. The crystallization of polymers is complex, and the complexity is even greater for blends and copolymers due to factors such as the interactions among different segments, volume fraction and the molar mass of the crystallizable polymers, and phase separation[2-7]. Different crystalline structures may be observed in blends and copolymers of varied compositions and crystallization conditions[3-5] For copolymers, phase separation results in microphases in which crystallization occurs[2,5,8]. One of the most studied block copolymer is poly(ethylene glycol)-b-poly(L-lactide), PEG-b-PLLA, because blocks crystallize[5,9,10]. Moreover, PEG crystallizes in confined environments within the PLLA crystalline structure[8-15]
Another class of copolymers is that of segmented polyurethanes (SPU). In general, these polyurethanes are prepared using different macrodiols that constitute blocks in the polyurethane chains. The main difference between SPU and traditional block copolymers is that, in SPU, the blocks are random distributed along the polymer chains. Despite their random architecture, SPU present microphase separation and the resulting phases are capable of crystallization[16-20]. The combination of a great variety of precursors imparts to SPU properties that make them useful in a variety of applications[21]. The combination of two or three macrodiols results in binary and ternary SPU,
respectively[22,23]. The properties of SPU are defined by the characteristics of the macrodiols (e.g., hydrophilicity, crystallinity), of the diisocyanates (aromatic, aliphatic and cycloaliphatic), and chain extenders[21,24-28]. In general, semi-crystalline soft segments may crystallize if they are connected to symmetric diisocyanate and in conditions of low steric hindrance[29,30]. High diisocyanate contents (> 50 wt%) may inhibit soft segment crystallization[19].
Ternary SPU based on PEG, PLLA and poly(trimethylene carbonate) (PTMC) macrodiols and hexamethylene diisocyanate (HDI) or toluene diisocyanate (TDI) have been studied by our research group[22,23]. The combination of the properties of PEG (a semi-crystalline and hydrophilic polyether), PLLA (a semi-crystalline and hydrophobic polyester), and PTMC (an amorphous and hydrophobic polycarbonate) segments in variable mass fractions allowed the syntheses of amphiphilic SPU with a wide range of properties that depend heavily on composition.
The miscibility of PLLA and PEG is controversial. Many reports on PLLA/PEG blends[31] and copolymers[9] have suggested that they are immiscible. However, PEG and PLLA may be miscible in the molten state for block copolymers[9,13]. PLLA and PTMC are reported as immiscible[32] or partially miscible[33], while PEG and PTMC are miscible[34]. In PEG/ PLLA blends and PEG-b-PLLA diblock copolymers, PEG chains or blocks, respectively, influence the crystallization of PLLA from the molten state, reduce the PLLA number
https://doi.org/10.1590/0104-1428.20220123 O O O O O O O O O O O O O O O Polímeros, 33(1), e20230008, 2023 ISSN 1678-5169 (Online) 1/11
of nuclei, and increase the PLLA spherulite growth rate[15] Because the melting and crystallization temperatures of PEG are lower than the crystallization temperature for PLLA, in the cooling from the molten state, PLLA crystallizes first and PEG crystallizes in confined environments of the PLLA crystalline phase[5,31]. In PLLA/PTMC blends, PTMC decreases the PLLA spherulite growth rate and increases the PLLA number of nuclei[32]
The phase behavior of the SPU based on PLLA, PEG and PTMC is quite complex. Based on thermal, dynamic mechanical properties and morphology, Trinca and Felisberti concluded that PTMC may promote partial miscibility of the PEG and PLLA segments[22,23]
In this work, we studied the crystallization of ternary SPU based on PEG, PLLA, PTMC and hexamethylene diisocyanate. Ternary SPU with different PLLA, PEG and PTMC mass fractions were synthesized via the two-step route and isothermal crystallization was conducted by cooling from the molten state to the crystallization temperature of the PLLA, followed by the crystallization of PEG segments induced by further cooling. The morphology of the SPU was studied by polarized optical microscopy (POM) and atomic force microscopy (AFM). The kinetics of crystallization of the PLLA segments in the SPU was evaluated by POM and the effect of the polyurethane composition on the nucleation and growth rates was discussed. To the best of our knowledge, there are no reports on the crystallization behavior of ternary SPU based on two semi-crystalline blocks such as PEG and PLLA.
2. Experimental
hydroxyl index IOH = 0.80 mmol g-1 or M n = 4.1 kDa, Mw/ Mn= 1.2; IOH = 0.49 mmol g-1)) and PTMC (Mn = 2.4 kDa, Mw/Mn= 1.8; IOH = 0.83 mmol g-1) macrodiols, HDI as diisocyanate, and BD as chain extender by a two-step route. The macrodiols and SPU were characterized by gel permeation chromatography (GPC), hydrogen nuclear magnetic resonance (1H NMR) and differential scanning calorimetry (DSC); the results are summarized in Table 1 DSC analyses were performed on an MDSC2910 (TA Instruments) using the following sequence at a heating and cooling rate of 20 °C min-1: i) heating from 25 °C to 200 °C; ii) 2 min isotherm; iii) cooling from 200 °C to -100 °C; iv) 2 min isotherm; v) second heating from -100 °C to 200 °C.
2.2 Kinetics of crystallization and morphology
2.1 Homopolymers and polyurethanes
synthesis and characterization
Tin (II) 2-ethylhexanoate (92.5%–100% purity), dibutyltin dilaurate (DBTDL, 95%), hexamethylene diisocyanate (HDI, 98%), 1,4-butanediol (BD), 3,6-dimethyl-1,4-dioxan-2,5-dione (L-lactide, LLA, 98%) and PEG (2kDa) were purchased from Sigma Aldrich. 1,3-dioxan-2-one (trimethylene carbonate, TMC) was purchased from Boehringer Ingelheim. PLLA and PTMC macrodiols were synthesized by ring-opening polymerization (ROP) using the procedure previously reported[35] Based on our previous works[22,23], SPU were synthesized using PEG (Mn = 2.0 kDa, Mw/Mn= 1.1; hydroxyl index IOH = 0.95 mmol g-1), PLLA (Mn = 2.5 kDa, Mw/Mn= 1.2;
Kinetics of the crystallization and the morphology of the crystalline phase were studied by POM using a Nikon Eclipse 80i optical microscope coupled to a Linkam CSS-450 hot stage and a Nikon DS camera D2 U2. Thin PLLA-diol (Mn = 4.2kDa) and SPU films of thicknesses varying from 10 μm to 30 μm and area of 1.5 x 1.5 cm2 were prepared by solvent casting from a previously filtered 5 wt % solution in CHCl3, using a PTFE filter with a pore diameter of 0.24 μm. Around 200 μL of the solution were deposited on a microscope followed by solvent evaporation. The films were subjected to the crystallization protocol using a Linkam hot stage: i) heating from room temperature to 180 °C at 10 °C min-1; ii) isotherm for 2 min; iii) cooling at 20 °C min-1 to the crystallization temperature for PLLA (TcPLLA); iv) isotherm at TcPLLA for 1 h to crystallize PLLA segments; v) cooling to 40 °C (TcPEG) at 20 °C min-1; vi) 30 min isotherm at 40 °C to crystallize PEG segments. Crystallization temperatures for PLLA segments in the SPU and PLLA-diol were 75, 80, 85, 90, 95, 100, 105, 110, and 115 °C. For PLLA-diol, steps i, ii, iii, and iv were performed and the crystallization was conducted for around 10 min. For each crystallization experiment, images were captured at each 10 s using a Nikon microscope software NIS Elements AR.
For AFM analysis, films prepared as described for POM analysis, and with 10 μm thickness were isothermally crystallized using a Linkam CSS-450 hot stage. The crystallization protocol was heating at the rate of 10 °C min-1 from room temperature to 180 °C, isotherm for 2 min, and cooling at the rate of 20 °C min-1 to the crystallization temperature of the PLLA, TcPLLA = 100 °C through 1 h. It was followed by further cooling to crystallize PEG at TcPEG = 40 °C for
Mass fraction of the macrodiols in relation to the total mass of the macrodiols in the SPU (determined by 1H NMR). bDetermined by GPC. cCrystallization temperature determined in cooling scans. dGlass transition temperatures of the SPU determined in the second heating scans. eCrystallization and melting temperatures of the PEG phase and f glass transition, crystallization and melting temperatures of the PLLA phase determined in the second heating scans.
Polímeros, 33(1), e20230008, 2023 2/11
Bevilacqua, A. S., Trinca, R. B., & Felisberti, M. I.
SPU xPEGa xPLLAa xPTMCa M n b (kDa) M w /M n b TcPEGc (°C) TcPLLAc (°C) T g d (°C) TcPEGe (°C) TmPEGe (°C) T g f (°C) T c f (°C) T m f (°C) SPU111 0.32 0.33 0.35 11.0 1.8 17 92 -24 22 - - 85 72; 117 SPU121 0.25 0.45 0.30 11.0 1.8 - 96 -13 38 - - 96 78; 125 SPU112 0.26 0.25 0.49 12.0 2 35 86 -25 28 - - 91 73; 122 SPU211 0.44 0.23 0.33 14.0 1.8 16 93 -36 10 34 - 91 123 SPU163 0.11 0.59 0.30 11.0 3.2 - 82 2 - - 74 - 123 SPU299 0.11 0.42 0.47 10.0 3.6 - 85 -6 - - 74 - 123 a
Table 1. Mass fraction of the macrodiol “i” (xi) in the SPU, molar mass and dispersity, and thermal properties of the SPU.
Ternary segmented polyurethanes: morphology and kinetics of the crystallization
30 min. The samples were examined on an Atomic Force Microscope Nanosurf C3000 Nanoscope, operating in tapping mode with a Si probe Nanoworld FMR (resonance frequency 75 kHz and constant force of 2.8 Nm-1) at the Laboratory of Surface Science (LSC) – CNPEM.
3. Results and Discussion
The nomenclature, composition expressed in mass fraction, number average molar mass Mn, and dispersity D are presented in Table 1. The nomenclature used for the polyurethanes, SPUxyz, describes the mass proportion of each segment: x = PEG; y = PLLA and z = PTMC. In general, the SPU presented Mn in the range of 11 kDa – 14 kDa.
The crystallization of the macrodiol segments in the SPU depends on their length and isocyanate content[16,19]
According to Li et al. [16], SPU based on polycaprolactone diol, 4,4’-diphenylmethane diisocyanate (MDI) and 1,4-butanediol did not crystallize if the molar mass of the macrodiol was lower than 2 kDa. Concerning diisocyanate content, high diisocyanate mass fraction (≥ 50%) in the SPU led to the crystallization of the diisocyanate-HDI segments and confined the crystallization of PEG into HDI crystalline structure[19] .
The molar masses of the PEG (Mn = 3.0 kDa) and PLLA (Mn = 2.5 kDa, and 4.1 kDa) crystallizable segments, the low diisocyanate content in the SPU in the range of 7-21%, the symmetry and the low hysteric hindrance imparted by aliphatic nature of the HDI, favor the crystallization of these segments in the SPU[29,30]. DSC analyses revealed thermal events associated with PEG and PLLA crystalline and amorphous phases in the SPU, as shown in Figure 1. DSC data such as glass transition temperature (Tg), crystallization and melting temperatures (Tc and Tm, respectively) are summarized in Table 1.
During the DSC cooling from the molten state, PLLA segments crystallized in the range of 82-96 °C for all SPU. However, PEG crystallization below 50 °C was verified only for SPU111, SPU112, and SPU211 (Figure 1a) in the range of 10-35 ° C. Apparently, a minimum mass fraction of PEG (> 0.11) is necessary for an appreciable crystallization under the cooling conditions. SPU composition influences slightly the crystallization temperatures of the
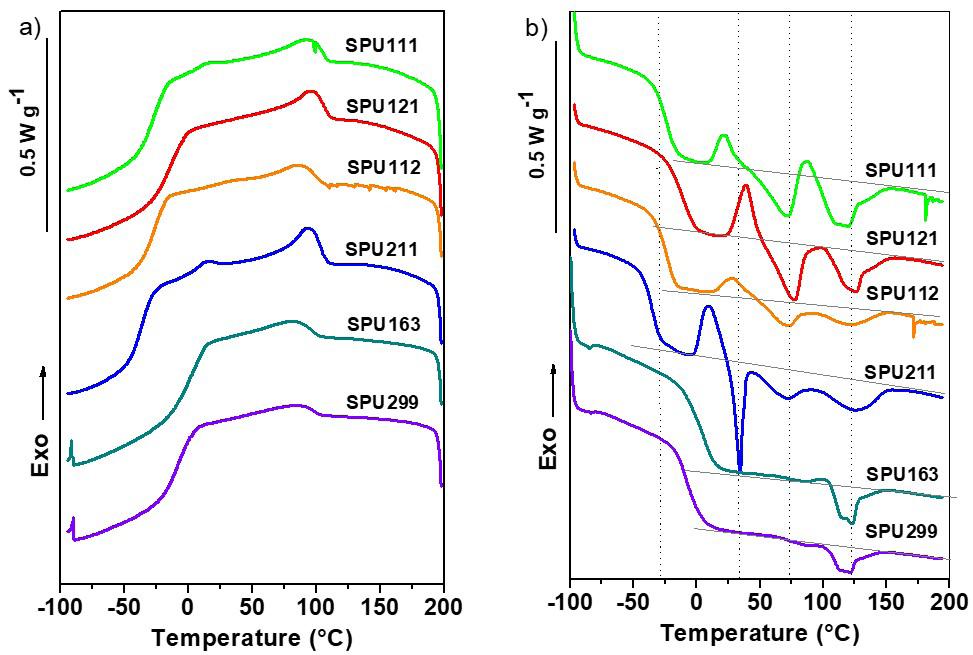
PLLA phase. DSC 2nd heating scan of the SPU163 and SPU299 (Figure 1b) presented a glass transition around 2° C and -6 °C, respectively, attributed to an amorphous phase composed of a mixture of randomly connected macrodiols segments[22]; a second and less intense glass transition at 74 °C, attributed to the amorphous phase of PLLA[36], an exothermic peak around 99 °C due to the cold crystallization of PLLA and two melting peaks partially overlapped and above 100 °C due to the melting of PLLA. No peaks related to PEG crystallization (Figure 1a) and melting (Figure 1b) could be observed probably due to the low PEG mass fraction (0.11), random segment-distribution and low chain mobility[22,35]. The presence of two glass transitions indicates that SPU163 and SPU299 are heterogeneous. DSC 2nd heating scans of the others SPU presented a more complex profile, exhibited glass transition, and multiple cold crystallizations and melting peaks (Figure 1b). Glass transition was observed in a temperature range from -50 °C to 25 °C (Figure 1b), and attributed to an amorphous phase constituted by various randomly connected macrodiols[22]. In general, PEG and PTMC segments contributed to a decrease in the glass transition temperature as observed in SPU rich in PEG (211 and 111) and PTMC (111 and 112), which presented the lowest Tg in the range of -36 °C – -24 °C. The cold crystallization of PEG segments occurred above 0 °C and the area and position of the peak depended on the SPU composition (Figure 1b). PEG melting peak was clearly observed for SPU 211 at 34 °C; for the others SPU, the melting is probable overlapped by the PLLA thermal events. The cold crystallization, recrystallization and melting of the PLLA phase, occurred in the temperature range of 40-130 °C. For PLLA, the temperature corresponding to the minimum of the peak at the highest temperature range occurred in a narrow temperature range of 117-125 °C and was not affected by the SPU composition.
According to DSC data, SPU are heterogeneous polymers that present crystalline phases and at least two amorphous phases, depending on their composition. Dynamic mechanical analyses (Figure S1, Supplementary Material) and AFM phase contrast images for SPU (Figure S2) revealed the multiphasic nature of the SPU and the presence of phases with a gradient of composition. In a previous work, dynamic mechanical and AFM analyses showed that ternary SPU were composed
Polímeros, 33(1), e20230008, 2023 3/11
Figure 1. (a) Cooling; (b) 2nd heating DSC scans for SPU.
Bevilacqua, A. S., Trinca, R. B., & Felisberti, M. I.
of PEG-PTMC-rich domains dispersed in an amorphous, continuous, and PLLA-rich phase[22,23]. The increase in the PTMC content resulted in diffuse PEG-PTMC domains suggesting that higher PTMC content promoted partial miscibility of PEG and PLLA[22,23]
Crystallization studies performed by POM allowed the evaluation of the morphology of the crystalline phases in the SPU subjected to isothermal crystallization in the temperature range of 75-115 °C for PLLA, followed by cooling at a rate of 20 °C min-1 to 40 °C for PEG crystallization. Figure 2 shows POM images of SPU111 crystallized at different temperatures. The increase in the crystallization temperature for SPU111 resulted in a morphology evolution from spherulites with a Maltese cross at Tc = 75 °C (Figure 2a) into ring banded spherulites at Tc in the range of 80-100 °C (Figures 2b-2f) and finally to axialites at Tc in the range of 105-115 °C (Figures 2g-2i). The evolution of the crystalline phase of the PLLA in the SPU111 is similar to the ones reported for PEG-b-PLLA diblock copolymers (MnPEG = 5 kDa[9,13,15] and MnPLLA = 2.5 kDa[13], 3 kDa[15], 5 kDa[9,13-15], 12 kDa[15], and 16 kDa[13]), for which the changes in the morphology were attributed to the evolution of microphase separation between PEG and PLLA at the crystallization temperature. This suggests that the crystallization in SPU is also controlled by phase separation. The occurrence of the ring banded spherulites in the PLLA block of the PEG-b-PLLA diblock copolymers with MnPEG = 5 kDa and MnPLLA= 5 kDa and
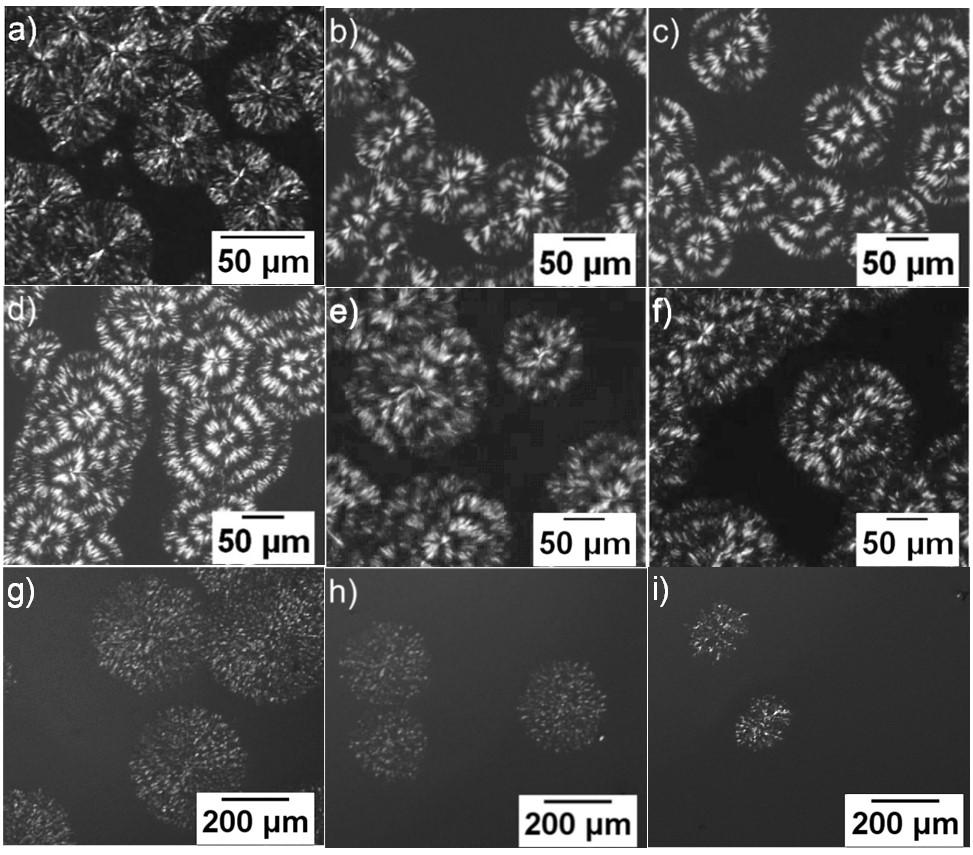
15kDa crystallized at lower temperatures was due to the twisting of the lamellae caused by the non-crystallizable amorphous phase during crystallization[5]. In SPU, the cause of the lamellar twisting may the presence of a complex molten amorphous phase constituted by PLLA, PEG and PTMC.
The morphology of the PLLA crystalline phase in SPU211 (Figure S3) varied in a similar way to that observed in SPU111 (Figure 2). In SPU121, spherulites with Maltese cross were observed in samples crystallized in the temperature range of 90-100 °C (Figure S4). The increase in the PTMC mass fraction led to the formation of ring banded PLLA spherulites in SPU112 at crystallization temperatures below 100 °C (Figure S5). Moreover, PLLA-diol used to synthesize SPU presented well-defined spherulites with Maltese cross at the crystallization temperature of up to 90 °C, ring banded spherulites up to 110 °C and an axialites-like structure at 115 °C (Figure S6). These results show that the PLLA crystalline phase may present similar morphology if PLLAdiol and SPU are crystallized at different temperatures. Therefore, the profile of the nucleation rate and crystal growth rate as a function of temperature is governed by the composition. POM images of SPU163 and SPU299 are shown in Figures S7 and S8, respectively.
The PLLA phase for the SPU211 crystallized as axialites at 105 °C (Figure 3a). Further cooling to 40 °C led to PEG crystallization in and around the axialites (Figure 3b) and showed that the PLLA crystalline phase acted as a template
Polímeros, 33(1), e20230008, 2023 4/11
Figure 2. POM images of SPU111 crystallized at different temperatures: (a) 75 °C; (b) 80 °C; (c) 85 °C; (d) 90 °C; (e) 95 °C; (f) 100 °C; (g) 105 °C; (h) 110 °C; (i) 115 °C. The spherulites are constituted of PLLA.
for PEG crystallization. Similar effect observed for the others SPU (Figure S9) and reported for PEG/PLLA blends[31] and PEG-b-PLLA[5,9] is attributed to confined PEG crystallization in the PLLA crystalline phase[9-11]
Figure 4 shows POM images (a, b, c, g, h, i) and AFM topography images acquired in tapping mode (d, e, f, j, k, l) for SPU subjected to PLLA isothermal crystallization at 100 °C/1h, followed by PEG isothermal crystallization at 40 °C/30 min. POM images show the strong influence of SPU composition on the morphology of the crystalline phases. In general, the increase in PLLA mass fraction led to the formation of spherulites with Maltese cross, as can be seen in Figure 4b and Figure 4h for SPU121 and SPU163 with PLLA mass fraction of 0.45 and 0.59, respectively. However, spherulites were not well-defined, possibly due to the random distribution of PLLA segments and the heterogeneity of SPU. The morphology of the crystalline phase of the SPU with PLLA mass fraction around 0.25 was quite different for polymers richer in PTMC (SPU112) and PEG (SPU211), Figure 4c and Figure 4g, respectively. SPU112 was birefringent, however, no defined pattern was observed for the crystalline phase, suggesting a disorderly crystal growth in different directions and at different rates. Moreover, the crystal boundaries were diffuse possibly due to the PTMC partial miscibility with PEG and PLLA[22,23]. The increase in the PEG mass fraction led to a decrease in the PLLA crystallites size for SPU111 (Figure 4a) and SPU211 (Figure 4g), compared with SPU121 (Figure 4b). For SPU299 (Figure 4i), the Maltese cross is absent. However, the crystallite boundary is better defined, probably due to the higher PLLA mass fraction compared to that in SPU112 (Figure 4c).
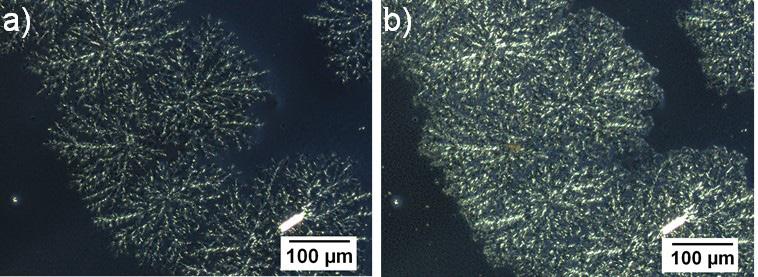
AFM images present a single crystalline structure, which corroborates the PEG confined crystallization in the PLLA crystalline phase. Besides, the uniform distribution of the crystalline phase observed in AFM topography images suggests that the amorphous phase is distributed in the interlamellar region. A radial growth pattern is barely visible in the AFM topographic image for SPU112 (Figure 4f), that indicates random growth of the lamellae in different directions. On the other hand, a radial growth pattern was observed for SPU163 and SPU299 in topographic images (Figure 4k and Figure 4l). The morphology of the SPU211 crystalline phase in the POM image (Figure 4g), resembles that of distorted
spherulites, while AFM topographic image (Figure 4j) reveals axialites that suggests growth in a preferential direction[5]. The presence of axialites in the PEG-b-PLLA crystalline phase was due to the changes in the phase separation associated to the increase in the crystallization temperature[37]. The increase of PEG content in SPU might lead to a similar effect on the phase separation of the segments in SPU in response to changes in the temperature. Complementary AFM topographic images are shown in Figures S10
The kinetics of the crystallization of PLLA segments in the SPU was evaluated by POM and the results are summarized in Table S1, Supplementary Material. This study could not be conducted to PEG segments because it occurred in confined environments of the PLLA crystalline phase.
For homopolymers and copolymers, the nucleation step can be described by the Turnbull and Fisher equation[2,38,39] The nucleation rate for random and block copolymers is lower as compared with their parent homopolymers because of the restrictions imposed by the comonomers and blocks[2]. Impurities and heterogeneities may induce nucleation and increase the nucleation rate at higher temperatures due to heterogeneous nucleation[40,41]. Besides, in copolymers, nucleation rate can be affected by the composition and interfacial energy for multiphase systems[2,38]. As discussed earlier, SPU are multiphase polymers whose phases may be mixtures with diffuse interfaces and different capacities for nucleation of the PLLA.
The nucleation rate of PLLA-diol and PLLA in the SPU and, determined as the slope of the number of nuclei per unit of area vs. time plots (Figures S11 and S13), is shown in Figure 5 as a function of crystallization temperature. A bellshaped profile was not observed for PLLA-diol because it crystallizes in a lower temperature range compared with PLLA segments in the SPU. The maximum nucleation rate for PLLA-diol occurs at temperatures below 75 °C and the nucleation rate (dN/dt) was 12.33 mm-2 s-1 at 75 °C. On the contrary, for SPU, PLLA nuclei formed at higher temperatures and a lower nucleation rate, due to the presence of amorphous phases with different interfacial energy[2,38] and the lower degree of freedom of the PLLA segments in the SPU chains, respectively. For SPU richer in PLLA, the nucleation rate (dN/dt) vs. T c plots presented the characteristic bell-shape (Figure-5a). The maximum nucleation rate
Ternary
Polímeros, 33(1), e20230008, 2023 5/11
segmented polyurethanes: morphology and kinetics of the crystallization
Figure 3. POM images of SPU211, for which PLLA phase was crystallized at (a) 105 °C/1h; (b) and further PEG was crystallized at 40 °C/30 min.
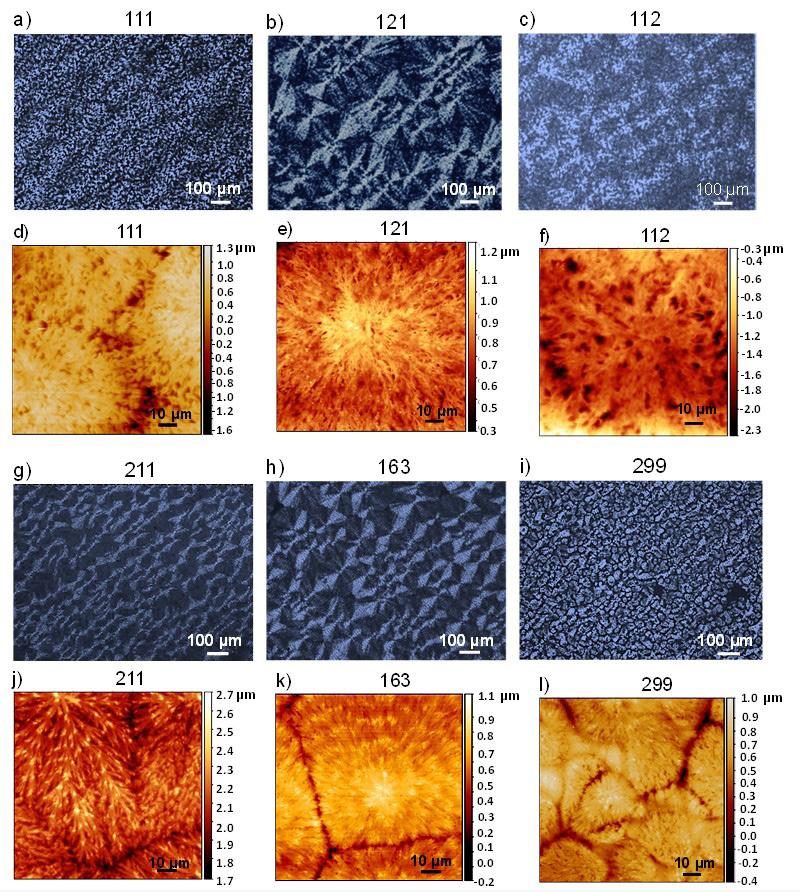
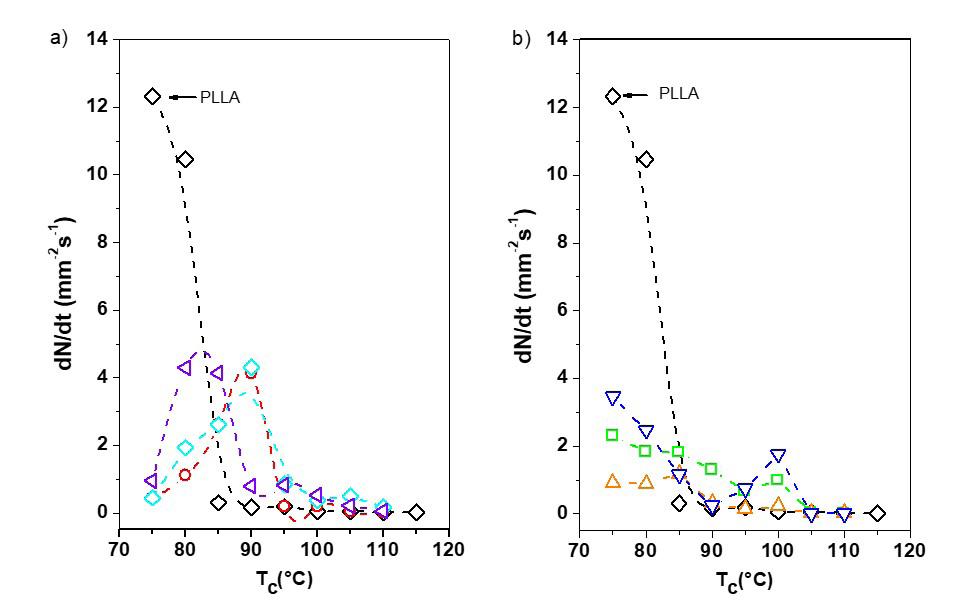
Bevilacqua, A. S., Trinca,
&
Polímeros, 33(1), e20230008, 2023 6/11
R. B.,
Felisberti, M. I.
Figure 4. POM and AFM topographic images of the SPU crystallized at 100 °C and further at 40 °C: (a) and (d) SPU111; (b) and (e) SPU121; (c) and (f) SPU112; (g) and (j) SPU211; (h) and (k) SPU163; (i) and (l) SPU299.
Figure 5. Nucleation rate vs T c for the crystallization of: (a) PLLA (◇), SPU121 (○), SPU163 (◇), and SPU299 (◁); (b) PLLA (◇), SPU112(△), SPU111 (◻), and SPU211 (▽). Dotted lines serve to guide the eyes.
Ternary segmented polyurethanes: morphology and kinetics of the crystallization
occurred at 90 °C for SPU121 and SPU163 and around 80 °C for SPU299. The structural differences such as molar mass and mass fraction of PLLA do not explain the shift of the maximum nucleation rate of the PLLA segments in SPU299 to lower temperatures. However, the SPU global composition is possibly the key to understanding the results. The mass fraction of PEG was 0.25, 0.11 and 0.11 and the mass fraction of PTMC was 0.30, 0.30 and 0.47 for SPU121, SPU163 and SPU299. The concomitant decrease in the PEG mass fraction and the increase in the PTMC mass fraction caused a shift of the maximum nucleation rate in SPU299 to lower temperatures. However, the nucleation rate remained close to ∼ 4.0 mm-2 s-1 – 4.5 mm-2 s-1 (Figure 5a). These results suggest the mutual cancelation of the antagonistic effects of PEG and PTMC on the nucleation rate of PLLA in the ternary SPU. The nucleation rate for the SPU richer in PLLA was three times lower than the nucleation rate of the PLLA-diol at 75 °C, 12.33 mm-2 s-1, an expected result because of the higher diffusion coefficient of PLLA-diol chains.
The nucleation rate vs. T c plots for SPU111, SPU112 and SPU211 presented at least two peaks (Figure 5b), suggesting the occurrence of concurrent nucleation processes in the analyzed temperature range. One hypothesis is that the SPU in the melt is heterogeneous, and nucleation occurs in different phases. However, nucleation occurred uniformly throughout the sample as observed from POM, indicating the absence of the macroscopic phases. Another possibility is that the heterogeneous distribution of PLLA segments in the polyurethane chains and the presence of phases with different compositions and submicrometric dimensions in the amorphous phase could be the causes of the concurrent nucleation processes. Phases of chains with higher PLLA mass fraction could crystallize first, while phases or chains with lower PLLA mass fraction would be segregated from the growth crystal boundary and eventually be crystallized at lower temperatures. In general, the nucleation rate at 100 °C for the SPU with PLLA mass fractions in the range of 0.23 to 0.33 increased with increasing PEG contents in the following order: SPU 112 (xPEG = 0.26; xPTMC = 0.49) < SPU 111 (xPEG = 0.32; xPTMC = 0.35) < SPU 211 (xPEG = 0.44;
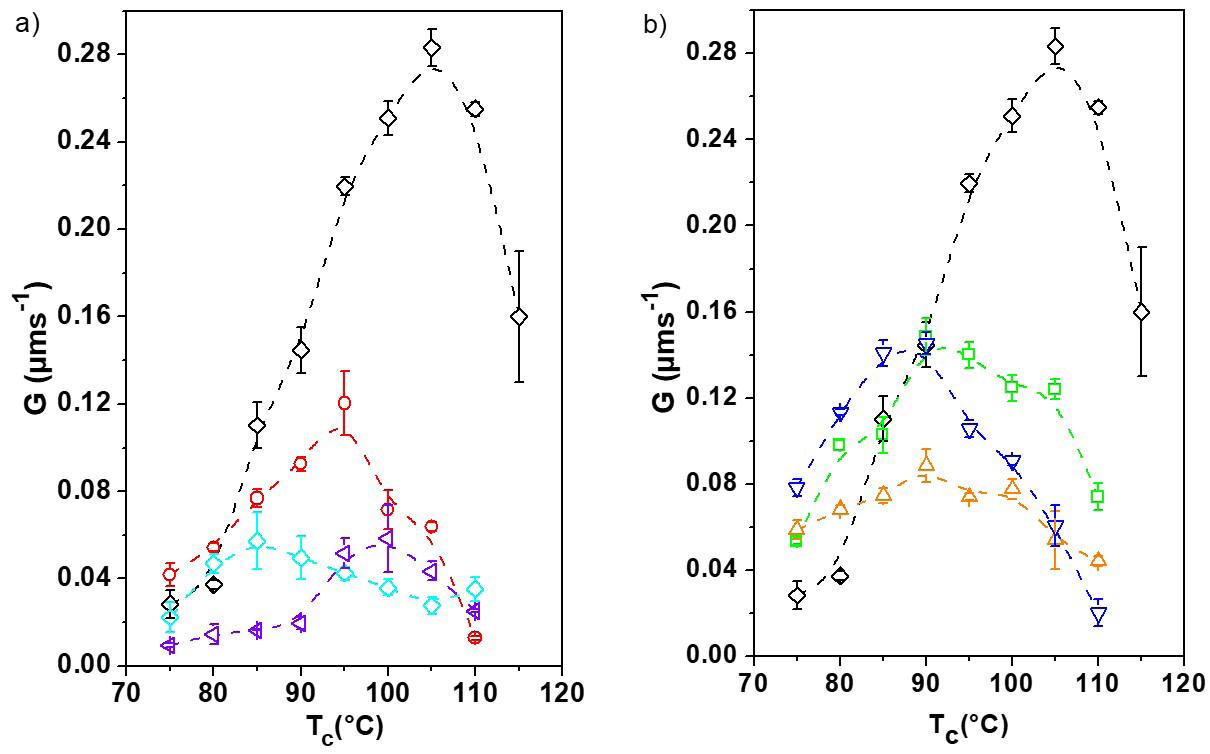
xPTMC = 0.33). These results differ from those reported in the literature for PEG-b-PLLA, in which the dilution effect of the molten PEG phase led to a decrease in the PLLA nucleation rate[12,15]. However, SPU display a more complex phase behavior compared with PEG-b-PLLA[29,30] The partial miscibility and the random distribution of the macrodiols segments in the SPU may influence the kinetics of the crystallization of PLLA.
The growth rate (G) was determined as the slope of the spherulite radius vs time plots (Figures S12 and S14) resulting from monitoring the growth of at least three spherulites. Figure 6 shows the evolution of G in the temperature range of 75-110 °C for the PLLA-diol and SPU. In general, bellshaped curves were observed with a maximum growth rate in the temperature range of 85-100 °C for SPU, depending on the composition, and at 105 °C for PLLA-diol. For SPU richer in PLLA (Figure 6a), the temperature of maximum growth rate TGmax increased with the decrease in the PLLA mass fraction: SPU163 (xPLLA = 0.59; TGmax = 85 °C) > SPU121 (xPLLA = 0.45; TGmax = 95 °C) > SPU299 (xPLLA = 0.42; TGmax = 100 °C). For SPU with PLLA mass fraction in the range of 0.23 - 0.33 (SPU211, SPU112 and SPU111), TGmax was 90 °C and G max was around 0.140-0.148 μm s-1 for SPU111 and SPU211 and around 0.090 μm s-1 for SPU112 (figure-6b). Curiously, Gmax values for the SPU richer in PLLA were lower – around 0.120 μm s-1, 0.060 μm s-1 and 0.058 μm s-1 for SPU121, SPU163 and SPU 299, respectively. Therefore, there was no clear relationship between G max and the PLLA mass fraction in the SPU.
In PEG-b-PLLA and PEG/PLLA blends, PEG is miscible with PLLA in the molten state and causes a decrease in the viscosity[10], an increase in the PLLA chains mobility and crystals’ growth rate[15,42]. On the other hand, PTMC decreases PLLA mobility in PLLA/PTMC blends and the crystals’ growth rate[32]. For SPU, the PLLA, crystallization occurs in presence of both PEG and PTMC segments in a heterogeneous medium in which phases with different compositions coexist. The crescent order of Gmax observed for SPU richer in PLLA (SPU163 ≅ SPU299 < SPU121) seems correlated to the concomitant increase in the PEG mass fraction and the decrease in the PTMC mass fraction.
Polímeros, 33(1), e20230008, 2023 7/11
Figure 6. Growth rate vs T c for: (a) PLLA (◇), SPU121 (○), SPU163 (◇), and SPU299 (◁); (b) PLLA (◇), SPU112(△), SPU111 (◻), and SPU211 (▽). Dotted lines serve to guide the eyes.
The G max for the crystallization of the PLLA segments in the SPU varied in the range of 0.058μm s-1–0.148μm s-1 in the temperature range of 80-100 °C, while that for PLLA homopolymer with comparable molar mass (Mn =1.759 kDa), G max = 0.15μm s-1 at TGmax = 105 °C and for PLLA-diol used in the synthesis of the SPU, Gmax = 0.283 ± 0.009 μm s-1 at 105 °C. This is in agreement with the literature; for random[2,38] and block copolymers[2,12,41,43] the spherulite growth rate is lower compared to the values for analogous homopolymers due to the restrictions of the chain mobility. The PLLA spherulite growth rate for SPU163 and SPU299 of around 0.060 μm s-1 at 85 °C and 100 °C, respectively, were close to the ones found for PEG-b-PLLA diblock copolymers (0.04 μms-1 at 115 °C)[12]. However, the molar mass of the PLLA block in the diblock copolymer was around three times more than the PLLA segment in the SPU. This is possibly due to the random distribution of the PLLA segments in the polymer chains and the multiple amorphous phases of SPU.
4. Conclusions
Despite the random distribution of PLLA, PEG and PTMC segments in SPU chains, PLLA or both PLLA and PEO segments crystallize from the melt. In this condition, PLLA crystallizes first and forms crystalline structures of morphologies such as spherulites with classical Maltese cross, ring banded spherulites, and axialites depending on the composition of the SPU and crystallization temperature. Further cooling leads to a confined PEG crystallization, in which the PLLA crystalline phase acts as a template. The crystallites of the SPU richer in PLLA display a preference for the morphology of spherulites resulting from radial lamellar growth. On the other hand, for SPU richer in PTMC, the growth of the crystallites occurs randomly leading to undefined patterns and diffuse interfaces. The influence of the SPU composition on the kinetics of the crystallization is complex. The isothermal crystallization of PLLA segments is governed by the SPU composition and the distribution of the segments in the chains.
• Validation – André Sanches Bevilacqua; Rafael Bergamo Trinca; Maria Isabel Felisberti.
• Visualization – Rafael Bergamo Trinca; Maria Isabel Felisberti.
• Writing – original draft – André Sanches Bevilacqua.
• Writing – review & editing – Rafael Bergamo Trinca; Maria Isabel Felisberti.
6. Acknowledgements
The authors acknowledge FAPESP (Grant number 2015/25406-5) and CAPES (Finance Code 001) for the financial support, and LNNano/CNPEM (proposal AFMNSIIIa-16677).
7. References
1 Piorkowska, E., & Rutledge, G. C. (Eds.). (2013). Handbook of polymer crystallization. Hoboken: John Wiley & Sons, Inc.. http://dx.doi.org/10.1002/9781118541838
2 Mandelkern, L. (2004). Crystallization of polymers: kinetics and mechanims UK: Cambridge Press http://dx.doi.org/10.1017/ CBO9780511535413.
3 Pu, W.-F., Liu, R., Wang, K.-Y., Li, K.-X., Yan, Z.-P., Li, B., & Zhao, L. (2015). Water-soluble core-shell hyperbranched polymers for enhanced oil recovery. Industrial & Engineering Chemistry Research, 54(3), 798-807. http://dx.doi.org/10.1021/ ie5039693
4 Hsieh, Y.-T., Nurkhamidah, S., & Woo, E. M. (2011). Lamellar orientation and interlamellar cracks in co-crystallized poly(ethylene oxide)/poly(L-lactic acid) blend. Polymer Journal, 43(9), 762-769 http://dx.doi.org/10.1038/pj.2011.63
5 Huang, S., & Jiang, S. (2014). Structures and morphologies of biocompatible and biodegradable block copolymers. RSC Advances, 4(47), 24566-24583 http://dx.doi.org/10.1039/ C4RA03043E.
6 Palacios, J. K., Liu, G., Wang, D., Hadjichristidis, N., & Müller, A. J. (2019). Generating triple crystalline superstructures in melt miscible PEO‐ b ‐PCL‐ b ‐PLLA triblock terpolymers by controlling thermal history and sequential crystallization. Macromolecular Chemistry and Physics, 220(20), 1900292 http://dx.doi.org/10.1002/macp.201900292
• Conceptualization – Rafael Bergamo Trinca; Maria Isabel Felisberti.
• Data curation – André Sanches Bevilacqua; Maria Isabel Felisberti.
• Formal analysis – André Sanches Bevilacqua; Rafael Bergamo Trinca; Maria Isabel Felisberti.
• Funding acquisition – Maria Isabel Felisberti.
• Investigation – André Sanches Bevilacqua; Maria Isabel Felisberti.
• Methodology – Rafael Bergamo Trinca; Maria Isabel Felisberti.
• Project administration – Maria Isabel Felisberti.
• Resources – Maria Isabel Felisberti.
• Software – MS Word; Origin 8.1.
• Supervision – Maria Isabel Felisberti.
7 Jing, Z., Huang, X., Liu, X., Liao, M., & Li, Y. (2023). Poly(lactide)‐based supramolecular polymers driven by selfcomplementary quadruple hydrogen bonds: construction, crystallization and mechanical properties. Polymer International, 72(1), 39-53 http://dx.doi.org/10.1002/pi.6445
8 Castillo, R. V., & Müller, A. J. (2009). Crystallization and morphology of biodegradable or biostable single and double crystalline block copolymers. Progress in Polymer Science, 34(6), 516-560 http://dx.doi.org/10.1016/j.progpolymsci.2009.03.002
9 Yang, J., Liang, Y., Luo, J., Zhao, C., & Han, C. C. (2012). Multilength scale studies of the confined crystallization in poly(l -lactide)- block -poly(ethylene glycol) copolymer. Macromolecules, 45(10), 4254-4261 http://dx.doi.org/10.1021/ ma202505f
10. Wang, L., Feng, C., Shao, J., Li, G., & Hou, H. (2019). The crystallization behavior of poly(ethylene glycol) and poly(Llactide) block copolymer: effects of block length of poly(ethylene glycol) and poly(L-lactide). Polymer Cryslallization, 2(4), e10071 http://dx.doi.org/10.1002/pcr2.10071
11 Hu, D. S.-G., & Liu, H.-J. (1994). Effects of soft segments and hydrolysis on the crystallization behavior of degradable poly(oxyethylene)/poly(L-lactide) block copolymers.
Polímeros, 33(1), e20230008, 2023 8/11
Bevilacqua, A. S., Trinca, R. B., & Felisberti, M. I.
5. Author’s Contribution
Ternary segmented polyurethanes: morphology and kinetics of the crystallization
Macromolecular Chemistry and Physics, 195(4), 1213-1223
http://dx.doi.org/10.1002/macp.1994.021950409
12 Huang, S., Jiang, S., An, L., & Chen, X. (2008). Crystallization and morphology of poly(ethylene oxide-b-lactide) crystallinecrystalline diblock copolymers. Journal of Polymer Science. Part B, Polymer Physics, 46(13), 1400-1411 http://dx.doi. org/10.1002/polb.21474
13 Yang, J., Zhao, T., Liu, L., Zhou, Y., Li, G., Zhou, E., & Chen, X. (2006). Isothermal crystallization behavior of the poly(L-lactide) block in poly(L-lactide)-poly(ethylene glycol) diblock copolymers: influence of the PEG block as a diluted solvent. Polymer Journal, 38(12), 1251-1257 http://dx.doi. org/10.1295/polymj.PJ2006094
14 Huang, S., Li, H., Jiang, S., Chen, X., & An, L. (2011). Morphologies and structures in poly(l-lactide-b-ethylene oxide) copolymers determined by crystallization, microphase separation, and vitrification. Polymer Bulletin, 67(5), 885-902. http://dx.doi.org/10.1007/s00289-011-0518-8
15 Sun, J., Hong, Z., Yang, L., Tang, Z., Chen, X., & Jing, X. (2004). Study on crystalline morphology of poly(l-lactide)poly(ethylene glycol) diblock copolymer. Polymer, 45(17), 5969-5977 http://dx.doi.org/10.1016/j.polymer.2004.06.026
16 Li, F., Hou, J., Zhu, W., Zhang, X., Xu, M., Luo, X., Ma, D., & Kim, B. K. (1996). Crystallinity and morphology of segmented polyurethanes with different soft-segment length. Journal of Applied Polymer Science, 62(4), 631-638 http://dx.doi. org/10.1002/(SICI)1097-4628(19961024)62:4<631::AIDAPP6>3.0.CO;2-U.
17 Sonnenschein, M. F., Lysenko, Z., Brune, D. A., Wendt, B. L., & Schrock, A. K. (2005). Enhancing polyurethane properties via soft segment crystallization. Polymer, 46(23), 10158-10166 http://dx.doi.org/10.1016/j.polymer.2005.08.006
18 Wang, W., Jin, Y., Yang, X., & Su, Z. (2010). Chain orientation and distribution in ring-banded spherulites formed in poly(ester urethane) multiblock copolymer. Journal of Polymer Science. Part B, Polymer Physics , 48(5), 541-547 http://dx.doi. org/10.1002/polb.21919
19 Hood, M. A., Wang, B., Sands, J. M., La Scala, J. J., Beyer, F. L., & Li, C. Y. (2010). Morphology control of segmented polyurethanes by crystallization of hard and soft segments. Polymer, 51(10), 2191-2198 http://dx.doi.org/10.1016/j. polymer.2010.03.027
20 Fernández-d’Arlas, B., Baumann, R. P., Pöselt, E., & Müller, A. J. (2017). Influence of composition on the isothermal crystallization of segmented thermoplastic polyurethanes. CrystEngComm, 19(32), 4720-4733. http://dx.doi.org/10.1039/ C7CE01028A
21 Król, P. (2007). Synthesis methods, chemical structures and phase structures of linear polyurethanes. Properties and applications of linear polyurethanes in polyurethane elastomers, copolymers and ionomers. Progress in Materials Science, 52(6), 915-1015 http://dx.doi.org/10.1016/j.pmatsci.2006.11.001
22. Trinca , R. B. , & Felisberti , M. I. ( 2015 ). Segmented polyurethanes based on poly(l-lactide), poly(ethylene glycol) and poly(trimethylene carbonate): physico-chemical properties and morphology. European Polymer Journal, 62, 77-86 http:// dx.doi.org/10.1016/j.eurpolymj.2014.11.008.
23 Trinca, R. B., & Felisberti, M. I. (2015). Effect of diisocyanates and chain extenders on the physicochemical properties and morphology of multicomponent segmented polyurethanes based on poly(l-lactide), poly(ethylene glycol) and poly(trimethylene carbonate). Polymer International, 64(10), 1326-1335 http:// dx.doi.org/10.1002/pi.4920
24 . Fonseca, L. P., Trinca, R. B., & Felisberti, M. I. (2018). Amphiphilic polyurethane hydrogels as smart carriers for acidic hydrophobic drugs. International Journal of Pharmaceutics , 546(1-2),
106-114 http://dx.doi.org/10.1016/j.ijpharm.2018.05.034 PMid:29772283.
25 Paiva, G. M. S., Duarte, L. G. T. A., Faleiros, M. M., Atvars, T. D. Z., & Felisberti, M. I. (2020). Z-E isomerization of azobenzene based amphiphilic poly(urethane-urea)s: influence on the dynamic mechanical properties and the effect of the selfassembly in solution on the isomerization kinetics. European Polymer Journal, 127, 109583 http://dx.doi.org/10.1016/j. eurpolymj.2020.109583
26. Fonseca, L. P., Zanata, D. M., Gauche, C., & Felisberti, M. I. (2020). A one-pot, solvent-free, and controlled synthetic route for thermoresponsive hyperbranched polyurethanes. Polymer Chemistry, 11(39), 6295-6307 http://dx.doi.org/10.1039/ D0PY01026J
27 Paiva, G. M. S., Duarte, L. G. T. A., Faleiros, M. M., Atvars, T. D. Z., & Felisberti, M. I. (2021). Photoactive polyurethanes based on 2,2′-dihydroxyazobenzene fluorescent segments. Journal of Molecular Liquids, 337, 116481 http://dx.doi. org/10.1016/j.molliq.2021.116481
28 Bronzeri, L. B., Gauche, C., Gudimard, L., Courtial, E.-J., Marquette, C., & Felisberti, M. I. (2021). Amphiphilic and segmented polyurethanes based on poly(ε-caprolactone)diol and poly(2-ethyl-2-oxazoline)diol: synthesis, properties, and a preliminary performance study of the 3D printing. European Polymer Journal, 151, 110449 http://dx.doi.org/10.1016/j. eurpolymj.2021.110449
29 Panwiriyarat, W., Tanrattanakul, V., Pilard, J.-F., Pasetto, P., & Khaokong, C. (2013). Effect of the diisocyanate structure and the molecular weight of diols on bio-based polyurethanes. Journal of Applied Polymer Science, 130(1), 453-462 http:// dx.doi.org/10.1002/app.39170
30. Caracciolo, P. C., Buffa, F., & Abraham, G. A. (2009). Effect of the hard segment chemistry and structure on the thermal and mechanical properties of novel biomedical segmented poly(esterurethanes). Journal of Materials Science. Materials in Medicine, 20(1), 145-155 http://dx.doi.org/10.1007/s10856008-3561-8 PMid:18704646.
31 Rufino, T. C., & Felisberti, M. I. (2016). Confined PEO crystallisation in immiscible PEO/PLLA blends. RSC Advances, 6(37), 30937-30950 http://dx.doi.org/10.1039/C6RA02406H
32 Zhao, L.-F., Cheng, J., Tian, X.-J., & Zhang, R.-L. (2015). Miscibility and isothermal crystallization of poly(L-lactide) and poly(trimethylene carbonate) blends. Chinese Journal of Polymer Science, 33(3), 499-507 http://dx.doi.org/10.1007/ s10118-015-1604-4
33 Kim, J.-H., & Lee, J. H. (2002). Preparation and properties of poly(L-lactide)-block-poly(trimethylene carbonate) as biodegradable thermoplastic elastomer. Polymer Journal, 34(3), 203-208 http://dx.doi.org/10.1295/polymj.34.203
34. Barbosa, P. C., Rodrigues, L. C., Silva, M. M., Smith, M. J., Parola, A. J., Pina, F., & Pinheiro, C. (2010). Solid-state electrochromic devices using PTMC/PEO blends as polymer electrolytes. Electrochimica Acta, 55(4), 1495-1502. http:// dx.doi.org/10.1016/j.electacta.2009.03.031.
35 Trinca, R. B., & Felisberti, M. I. (2014). Influence of the synthesis conditions on the structural and thermal properties of poly(l -lactide)- b -poly(ethylene glycol)- b -poly(l -lactide). Journal of Applied Polymer Science, 131(13), 40419 http:// dx.doi.org/10.1002/app.40419
36 Trinca, R. B., Abraham, G. A., & Felisberti, M. I. (2015). Electrospun nanofibrous scaffolds of segmented polyurethanes based on PEG, PLLA and PTMC blocks: physico-chemical properties and morphology. Materials Science and Engineering C, 56, 511-517 http://dx.doi.org/10.1016/j.msec.2015.07.018 PMid:26249621.
Polímeros, 33(1), e20230008, 2023 9/11
Bevilacqua, A. S., Trinca, R. B., & Felisberti, M. I.
37 Li, B., Marand, H., & Esker, A. R. (2007). Dendritic growth of poly(ε-caprolactone) crystals from compatible blends with poly(t-butyl acrylate) at the air/water interface. Journal of Polymer Science. Part B, Polymer Physics, 45(24), 3200-3318 http://dx.doi.org/10.1002/polb.21328
38 Safari, M., Mugica, A., Zubitur, M., Martínez de Ilarduya, A., Muñoz-Guerra, S., & Müller, A. J. (2019). Controlling the isothermal crystallization of isodimorphic PBS-ran-PCL random copolymers by varying composition and supercooling. Polymers, 12(1), 17 http://dx.doi.org/10.3390/polym12010017 PMid:31861773.
39 Umemoto, S., Hayashi, R., Kawano, R., Kikutani, T., & Okui, N. (2003). Molecular weight dependence of primary nucleation rate of poly(ethylene succinate). Journal of Macromolecular Science - Physics. Journal of Macromolecular Science, Part B: Physics, 42(3-4), 421-430 http://dx.doi.org/10.1081/MB-120021571
40 Khariwala, D. U., Taha, A., Chum, S. P., Hiltner, A., & Baer, E. (2008). Crystallization kinetics of some new olefinic block copolymers. Polymer, 49(5), 1365-1375 http://dx.doi. org/10.1016/j.polymer.2007.12.046
41 Andjelić, S., Jamiolkowski, D., McDivitt, J., Fischer, J., & Zhou, J. (2001). Spherulitic growth rates and morphology of absorbable poly(p-dioxanone) homopolymer and its copolymer by hot-stage optical microscopy. Journal of Polymer Science. Part B, Polymer Physics, 39(24), 3073-3089. http://dx.doi. org/10.1002/polb.10065
42 Yang, J.-M., Chen, H.-L., You, J.-W., & Hwang, J. C. (1997). Miscibility and crystallization of poly(L-lactide)/poly(ethylene glycol) and poly(L-lactide)/poly(ε-caprolactone) blends. Polymer Journal, 29(8), 657-662 http://dx.doi.org/10.1295/ polymj.29.657
43 Wu, H., & Qiu, Z. (2012). Synthesis, crystallization kinetics and morphology of novel poly(ethylene succinate-co-ethylene adipate) copolymers. CrystEngComm, 14(10), 3586-3595 http://dx.doi.org/10.1039/c2ce06629g
Received: Jan. 04, 2023
Revised: Feb. 27, 2023
Accepted: Mar. 10, 2023
Polímeros, 33(1), e20230008, 2023 10/11
Ternary segmented polyurethanes: morphology and kinetics of the crystallization
Supplementary Material
Supplementary material accompanies this paper.
Figure S1. a) Storage modulus (E’); b) loss modulus (E”) and c) loss factor (tan delta) as a function of temperature for: SPU111 (◻); SPU121(○); SPU112(△); SPU211 (▽); SPU163 (◇), and SPU299 (◁).
Figure S2. AFM phase-contrast images for SPU crystallized at 100°C and further at 40°C: a) SPU 111, b) SPU121, c) SPU112, d) SPU211, e) SPU163 and f) SPU299.
Figure S3. POM imagens of the SPU211 crystallized at different temperatures: (a) 75°C, (b) 80°C, (c) 85 °C, (d) 90°C, (e) 95°C, (f) 100°C, (g) 105°C, (h) 110°C and (i) 115°C. The spherulites are constituted of PLLA.
Figure S4. POM imagens of the SPU121 crystallized at different temperatures: (a) 75°C, (b) 80°C, (c) 85 °C, (d) 90°C, (e) 95°C, (f) 100°C, (g) 105°C, (h) 110°C and (i) 115°C. The spherulites are constituted of PLLA.
Figure S5. POM imagens of the SPU112 crystallized at different temperatures: (a) 75°C, (b) 80°C, (c) 85 °C, (d) 90°C, (e) 95°C, (f) 100°C, (g) 105°C, (h) 110°C and (i) 115°C. The spherulites are constituted of PLLA.
Figure S6. POM images of the PLLA-diol crystallized at different temperatures and time, as indicated in each image.
Figure S7. POM imagens of the SPU163 crystallized at different temperatures: (a) 75°C, (b) 80°C, (c) 85 °C, (d) 90°C, (e) 95°C, (f) 100°C, (g) 105°C, (h) 110°C and (i) 115°C. The spherulites are constituted of PLLA.
Figure S8. POM imagens of the SPU299 crystallized at different temperatures: (a) 75°C, (b) 80°C, (c) 85 °C, (d) 90°C, (e) 95°C, (f) 100°C, (g) 105°C, (h) 110°C and (i) 115°C. The spherulites are constituted of PLLA.
Figure S9. POM images after the PLLA crystallization at 100°C/1h for a) SPU 111, c) SPU121, e) SPU112, g) SPU211, i) SPU163 and k) SPU299 and their respective surfaces after PEG crystallization at 40°C in b), d), f), h), j) and l).
Figure S10. AFM topographic images of the SPU crystalized at TcPLLA = 100 °C and TcPEG = 40 °C: a) SPU111, b) SPU121, c) SPU112, d) SPU211, e) SPU163 and f) SPU299.
Figure S11. Number of the PLLA-diol nuclei per area vs. time (N/A vs. t). The crystallization temperature is indicated for each isotherm.
Figure S12. PLLA spherulite radius vs. time curves of the PLLA-diol. The crystallization temperature is indicated for each isotherm.
Figure S13. Number of the PLLA nuclei per area vs. time (N/A vs. t) plots for SPU a) 111, b)121, c) 112, d) 211, e) 163 and f) 299 crystallized at temperatures in the range of 75 - 110°C. The temperature of the crystallization is indicated for each isotherm.
Figure S14. PLLA spherulite radius vs. time plots for a) SPU111, b) SPU121, c) SPU112, d) SPU211, e) SPU163 and f) SPU299 during crystallization in the temperature range of 75 - 110°C. The temperature of the crystallization is indicated for each isotherm.
Table S1. Nucleation and crystal growth rates of the crystallization of the PLLA segments in the SPU. This material is available as part of the online article from https://doi.org/10.1590/0104-1428.20220123
Polímeros, 33(1), e20230008, 2023 11/11
Phenoxazine and diketopyrrolopyrrole based donoracceptor conjugated polymers: synthesis and optical properties
Thao Thanh Bui1 , Tam Huu Nguyen1 , Bao Kim Doan1 , Le-Thu Thi Nguyen2 , Chau Duc Tran2* and Ha Tran Nguyen1,2*
1National Key Laboratory of Polymer and Composite Materials, Vietnam National University, Ho Chi Minh City, Vietnam
2Faculty of Materials Technology, Ho Chi Minh City University of Technology – HCMUT, Vietnam National University, Ho Chi Minh City, Vietnam
*chau_tran@hcmut.edu.vn; nguyentranha@hcmut.edu.vn
Obstract
While numerous phenoxazine-based small molecules developed for organic electronic devices, very limited attention has been received on synthesized conjugated polymers containing this phenoxazine. Herein, we designed and synthesized two new low-bandgap donor−acceptor conjugated copolymers based on phenoxazine with different side chains and diketopyrrolopyrrole by Pd-catalyzed direct (hetero)arylation polycondensation using a Pd(OAc)2 catalyst and PCy3 HBF4 ligand. The effects of side chain branched alkyl and benzoyl of phenoxazine on the thermal, and optical properties of the polymers have been investigated. Both the polymers have a good yield 85%, high molecular weight up to 41500 g/mol, low dispersity index 1.91, excellent solubility in common organic solvents, and a broad absorption spectrum in the range of 500-900 nm with optical bandgaps as low as 1.40 eV. All these polymers possess good thermal stability with decomposition temperatures over 350 oC and no obvious thermal transitions.
Keywords: conjugated polymer, donor−acceptor polymer, phenoxazine, diketopyrrolopyrrole, direct arylation polycondensation
How to cite: Bui, T. T., Nguyen, T. H., Doan, B. K., Nguyen, L.-T. T., Tran, C. D., & Nguyen, H. T. (2023). Phenoxazine and diketopyrrolopyrrole based donor-acceptor conjugated polymers: synthesis and optical properties. Polímeros: Ciência e Tecnologia, 33(1), e20230009. https://doi.org/10.1590/0104-1428.20230002
1. Introduction
Over the past 20 years, conjugated polymers have received the most attention as novel organic semiconducting materials to alternative silicon-based devices for organic field-effect transistors (OFETs), organic light-emitting diodes (OLEDs), and polymer solar cells (PSCs) due to their flexibility, low cost, lightweight, and solution processability[1,2]. Therefore, the discovery of innovative semiconducting polymers is an essential task to develop next-generation electronic devices. Among them, phenoxazine(POZ)-based semiconductors, which include electron-rich nitrogen and oxygen heteroatoms in a heterocyclic structure that results from nonplanar butterfly conformation, have greatly enhanced the device performance. Thus, several small molecules containing POZ are widely used in organic electronic devices[3,4], including OLEDs[5,6], fluorescent probes[7], OSCs and perovskite solar cells[8-10], as well as photoredox catalysts in atom transfer radical polymerization[11]. In contrast to POZ-based small molecules, POZ-based polymers are far less common, hence more research is necessary.
In organic optoelectronic devices, conjugated polymers have clear advantages over small-molecule materials such as
flexibility and stretchability[12-14]. Therefore, it is important to develop conjugated polymers with high molecular weights. Since 2005, POZ-based conjugated polymer was first reported by the Jenekhe group[15], several p-type conjugated polymersbased POZ have been synthesized and used in p-channel OFETs and PSCs[16,17]. There have also been some reports on POZ-based ladder polymers that serve as innovative supercapacitor electrode materials[18]. Moreover, most of the reports discussed properties of POZ-based polymers as p-type materials, while a few pieces of literature referred to that in n-type polymer, bearing high coplanarity that leads to a low optical band gap. POZ-based polymers have been synthesized primarily by cross-coupling reactions such as the Suzuki−Miyaura coupling and the Migita−Kosugi−Stille coupling reactions. However, the resulting polymers had low molecular weights with the number-average molecular weight (Mn) lower than 10 000 g/mol due to the instability of the boronated POZ monomer[15,19]. Alternatively, transition metal-catalyzed direct (hetero)arylation polymerization (DArP or DHAP) via C–H bond activation has been developed recently as a new synthetic method for conjugated polymers[20,21]. Because this polycondensation method does
https://doi.org/10.1590/0104-1428.20230002 O O O O O O O O O O O O O O O Polímeros, 33(1), e20230009, 2023 ISSN 1678-5169 (Online) 1/7
not require an organometallic monomer, the preparation step for a boronated monomer and concern about its instability can be avoided. The absence of organometallic monomers also results in the high purity of the polymers because organometallic monomers do not contaminate waste with metals. The main issue still lies in selecting the appropriate processes to produce high-molecular-weight polymers with high selectivity and broad monomer scope.
In this regard, our group reported highly efficient Pdcatalyzed direct arylation polycondensation of a novel low bandgap POZ-based polymer as a potential photoactive donor material in bulk heterojunction (BHJ) OSCs[17]. Herein, we report further investigation of direct arylation polycondensation of the POZ with different side chains and diketopyrrolopyrrole (DPP) to design and synthesized novel low-bandgap donoracceptor conjugated copolymers. We also investigated the effect of the side chain on the electronic, optical, and nanostructures properties of the new POZ-based polymers, including poly(10-ethylhexyl phenoxazine-3,7-diyl-alt-3,6dithien-2-yl-2,5-diethylhexylpyrrolo[3,4-c]pyrrole-1,4-dione5′,5′′-diyl) (P1) and poly(10-hexylbenzoyl-phenoxazine3,7-diyl-alt-3,6-dithien-2-yl-2,5-diethylhexylpyrrolo[3,4-c] pyrrole-1,4-dione-5′,5′′-diyl) (P2).
2. Materials and Methods
2.1 Materials
All chemical reagents were used without further purification as purchased from Aldrich, Acros, and TCI chemical unless otherwise specified. Phenoxazine (98%), and 3,6-bis(5-bromothiophen-2-yl)-2,5-bis(2-ethylhexyl)2,5-dihydropyrrolo[3,4-c]pyrrole-1,4-dione were purchased from TCI (Tokyo, Japan). Triethylamine (98%), 4-dimethylaminopyridine (98%), 2-ethylhexyl bromide (98%), 4-hexylbenzoyl chloride (98%), and tetrahydrofuran (99.9%) were purchased from Acros Organics. Palladium(II) acetate (Pd(OAc)2, 98%), tricyclohexylphosphine tetrafuoroborate (97%, PCy3·HBF4), and pivalic acid (PivOH, 97%) were purchased from Sigma-Aldrich. Sodium tert-butoxide (NaOtBu, 97%), sodium carbonate (99%), and magnesium sulfate (98%) were purchased from Acros and used as received. Chloroform (CHCl3, 99.5%), and dimethylacetamide (DMAc, 99%) were purchased from Fisher/Acros and dried using molecular sieves under N2. Dichloromethane (99.8%), hexane (99%), methanol (99.8%), and ethyl acetate (99%) were purchased from Fisher/Acros and used as received.
2.2 Instrumentation
FT-IR spectra collected as the average of 256 scans with a resolution of 4 cm-1, were recorded from KBr disk on the FT-IR Bruker Tensor 27. 1H NMR spectra was carried out on a 500 MHz spectrometer – Bruker AMX500 apparatus in CDCl3 1H NMR chemical shifts are referenced to TMS (δ 0.00 ppm). The following abbreviations are used to describe the NMR signals: s (singlet), d (doublet), t (triplet), q (quartet), and br (broad). Size exclusion chromatography (SEC) measurements were performed on a Polymer PL-GPC 50 gel permeation chromatograph system equipped with an RI detector, with chloroform as the eluent at a flow rate of 1.0 mL/min, 35 0C. Molecular weights and molecular
weight distributions were calculated with reference to polystyrene standards. UV–vis absorption spectra of polymers in solution and polymer thin films were recorded on a Shimadzu UV-2450 spectrometer over a wavelength range of 300–900 nm. Fluorescence spectra were measured on a HORIBA IHR 325 spectrometer. Differential scanning calorimetry (DSC) measurements were carried out with DSC 204 F1-NETZSCH instruments under nitrogen flow (heating rate 10 °C min-1). Thermogravimetric analysis (TGA) measurements were performed under nitrogen flow using STA 409 PC Instruments with a heating rate of 10 °C min-1 from ambient temperature to 800 °C.
2.3 Synthesis of the monomers and polymers
2.3.1 Synthesis of monomer 10-(2-ethylhexyl)-10Hphenoxazine (M1)
Monomer 10-(2-ethylhexyl)-10H-phenoxazine (M1) was synthesized according modified earlier procedures[8] A schlenk tube was charged with phenoxazine (400 mg, 2.18 mmol), and sodium tert-butoxide (252 mg, 2.62 mmol) in 10 mL of THF under nitrogen. After the mixture refluxed for 1 h, 2-ethylhexyl bromide (506 mg, 2.62 mmol) was added, then the mixture refluxed for 23 h. After the reaction, the solvent was removed by rotary evaporation, then 30 mL of water are added and the solution is extracted with dichloromethane. Collect the organic layer and the solvent was removed by rotary evaporation. The residue was purified by chromatography (silica gel, hexane) to provide product M1 as a colorless oil (550 mg, 86%). 1H NMR (500 MHz, CDCl3, ppm): δ 6.86 – 6.79 (d, 2H), 6.70 – 6.60 (m, 4H), 6.56-6.50 (d, 2H), 3.41 (d, J = 7.3 Hz, 2H), 1.88 (dd, J = 12.7, 6.4 Hz, 1H), 1.46 – 1.26 (m, 8H), 0.94-0.86 (m, 6H).
2.3.2 Synthesis of monomer 10-(4-(hexyl)benzoyl)-10Hphenoxazine (M2)
4-hexylbenzoyl chloride (587. mg, 2.62 mmol) was placed in a nitrogen-filled round bottom flask equipped with a reflux condenser, phenoxazine (400 mg, 2.18 mmol), 10 mL THF, triethylamine (0.3 mL, 2.18 mmol), and 4-dimethylaminopyridine (45 mg, 0.36 mmol) were added. The mixture was heated to reflux for 72 h. After the reaction, the solvent was removed by rotary evaporation, then 30 mL of water are added and the solution is extracted with dichloromethane. Collect the organic layer and the solvent was removed by rotary evaporation. The residue was purified by chromatography (silica gel, hexane/ethyl acetate: 15/1) to provide product M2 as a colorless oil (512 mg, 75%). 1H NMR (500 MHz, CDCl3, ppm): δ 7.38 (d, J = 7.9Hz, 2H), 7.33 (d, J = 7.3 Hz, 2H), 7.12 (m, J = 7.2 Hz, 4H), 7.07 (d, 2H), 6.93 (d, 2H), 2.57 (m, 2H), 1.59 (m, 2H), 1.38 - 1.18 (m, 6H), 0.87 (m, J = 7.2 Hz, 3H).
2.3.3 General synthesis of donor-acceptor conjugated copolymers P1 and P2 via direct arylation polycondensation
A 25 mL Schlenk flask was charged with monomer M1 (88.63 mg, 0.3 mmol) or M2 (111.44 mg, 0.3 mmol), 3,6-bis(5bromothiophen-2-yl)-2,5-bis(2-ethylhexyl)2,5-dihydropyrrolo[3,4-c]pyrrole-1,4-dione (DPP) (204.77 mg, 0.3 mmol) and DMAc (6 mL). The reactor was purged with nitrogen for 20 min. The septum was
Polímeros, 33(1), e20230009, 2023 2/7
Bui, T. T., Nguyen, T. H., Doan, B. K., Nguyen, L.-T. T., Tran, C. D., & Nguyen, H. T.
Phenoxazine and diketopyrrolopyrrole based donor-acceptor conjugated polymers: synthesis and optical properties
opened and Pd(OAc)2 (3.36 mg, 0.015 mmol), PCy3 HBF4 (11.05 mg, 0.03 mmol), PivOH (30.64 mg, 0.3 mmol), and K2CO3 (248.767 mg, 1.8 mmol) were added. Oxygen was removed from the reaction solution by three freeze–pump–thaw cycles, and at the end the reactor was then back-filled with argon to preserve an inert atmosphere. The reactor was heated in a 100 °C oil bath for 4h. After being cooled to room temperature, the reaction mixture was diluted with 30 mL of chloroform. The obtained organic layer was passed through Celite to remove the Pd catalyst and the insoluble polymer fraction, concentrated and was precipitated into methanol. The product was purified by sequential Soxhlet extractions using methanol (6h), acetone (6h), and hexane (6h). The resultant polymer was further purified by dissolving in CHCl3 and reprecipitating into methanol. The pure copolymers were obtained after drying under a vacuum at 60 °C overnight.
P1: a deep blue solid in 82% yield, 201 mg. 1H NMR (500 MHz, CDCl3, ppm): δ 9.1-8.66 (d, 2H), 7.71 (m, 3H), 7.52 (m, 3H), 7.37 (d, 2H), 4.22 (td, 4H), 4.05 (td, 2H), 1.90 (m, 2H), 1.88-1.26 (m, 24H), 0.94-0.86 (m, 18H). GPC: M n = 28 000 gmol-1, Mw/Mn = 2.22.
P2: a deep blue solid in 85% yield, 228 mg. 1H NMR (500 MHz, CDCl3, ppm): δ 9.1-8.66 (d, 2H), 8.65 (d, 2H), 8.46 (d, 2H), 8.44-8.20 (m, 3H), 8.19-7.94 (m, 3H), 7.34 (d, 2H), 4.06 (td, 4H), 2.30 (td, 2H), 1.90 (dd, 2H), 1.75-1.16 (m, 24H), 0.94-0.84 (m, 15H). GPC: Mn = 41 500 gmol-1, Mw/ M n = 1.91.
3. Results and Discussions
We synthesized two different donor-acceptor conjugated copolymers based on DPP as an acceptor unit and POZ as a donor unit, in which the effect of replacing the branched alkyl substituent at the POZ by a benzoyl moiety on the structural, photophysical, and thermal parameter was investigated. The synthesis of all monomers (M1 and M2) and their copolymers (P1 and P2) is outlined in Scheme 1
3.1 Monomer synthesis
First, two monomers POZ, M1 and M2, were synthesized in only one step from relatively inexpensive and commercially available H-phenoxazine with high yields of 86% and 75%, respectively. The structure of monomers M1 and M2 was determined via 1H NMR. The 1H NMR spectrum of monomer M1 (Figure 1a) shows a doublet peak at 6.86 ppm (peak d), a triplet peak at 6.70 ppm (peak b, c), and a doublet peak at 6.56 ppm (peak a) corresponding to the protons of the POZ benzene ring. The peaks from 0.86 ppm to 3.41 ppm are attributed to the ethylhexyl protons. Similarly, the 1H NMR spectrum of monomer M2 (Figure 1b) also showed all characteristic peaks of the hexylbenzoyl-POZ. The presence of these peaks, along with their integral ratios, indicate that the reaction has taken place successfully to give the ethylhexyl-POZ and hexylbenzoyl-POZ monomers.
3.2 Polymer synthesis
As shown in Scheme 1, the alternating POZ-DPP copolymers were synthesized by direct arylation polycondensation between branched alkyl or benzoyl alkyl of POZ and dibromides of DPP to give P1, and P2, respectively. The polycondensation was carried out in dimethylacetamide (DMAc) at 100 °C for 4h with 5%mol of Pd(OAc)2, 10%mol of PCy3.HBF4, 1.0 equivalent of pivalic acid (PivOH), and 6.0 equivalents of K2CO3. Both polymers were purified by sequential Soxhlet extractions using methanol (6h), acetone (6h), and hexane (6h) to remove catalyst and oligomers, then a chloroform fraction was collected, precipitated from cold methanol and isolated. The yield of both reactions was a high yield ≥ 82%. All the polymers showed excellent solubility in organic solvents such as tetrahydrofuran, chloroform, toluene, and chlorobenzene at room temperature. The number average molecular weights (Mn) and dispersity (Đ) of the two polymers P1 and P2 were determined by gel permeation chromatography (GPC) against polystyrene standards in CHCl3 and were found to be 28 000 and 41 500 gmol-1 and 2.22 and 1.91, respectively (Table 1).
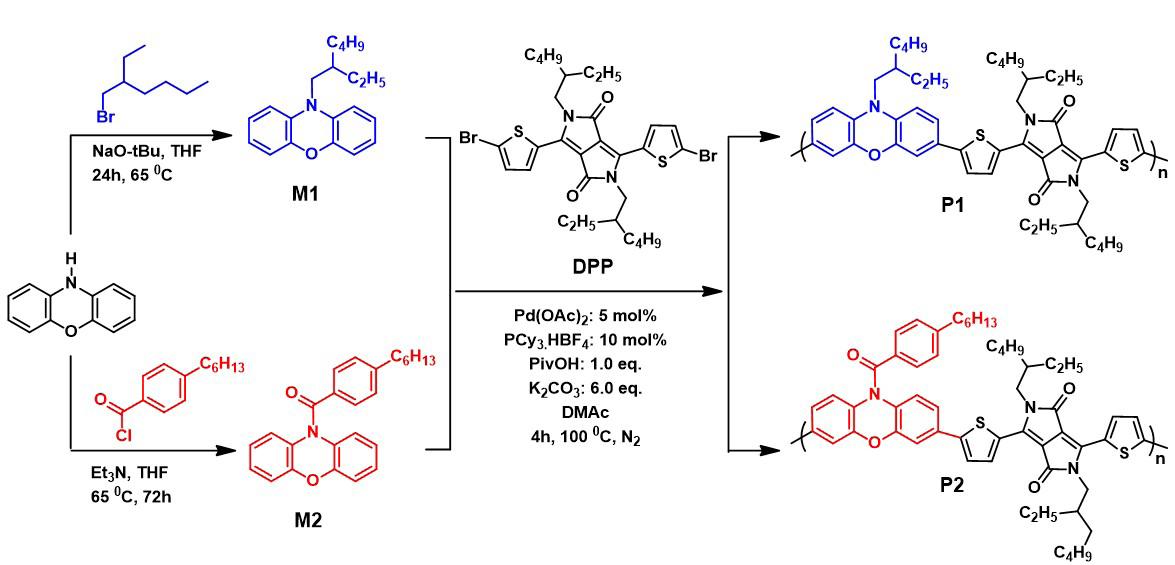
Polímeros, 33(1), e20230009, 2023 3/7
Scheme 1. Route of synthesis for the phenoxazine-based monomers and copolymers.
3.3 Polymer structure
The chemical structures of the polymers were verified by FT-IR, and 1H NMR spectra. Figure 2 shows the FT-IR spectra of the obtained these copolymers. The bands at 2850 and 3060 cm-1 are ascribed to C−H stretching modes of n-alkyl groups and ring C−H stretching vibrations. The vibrational bands between 1550 and 1000 cm-1 in all the polymers are due to stretching vibrations of the C−N
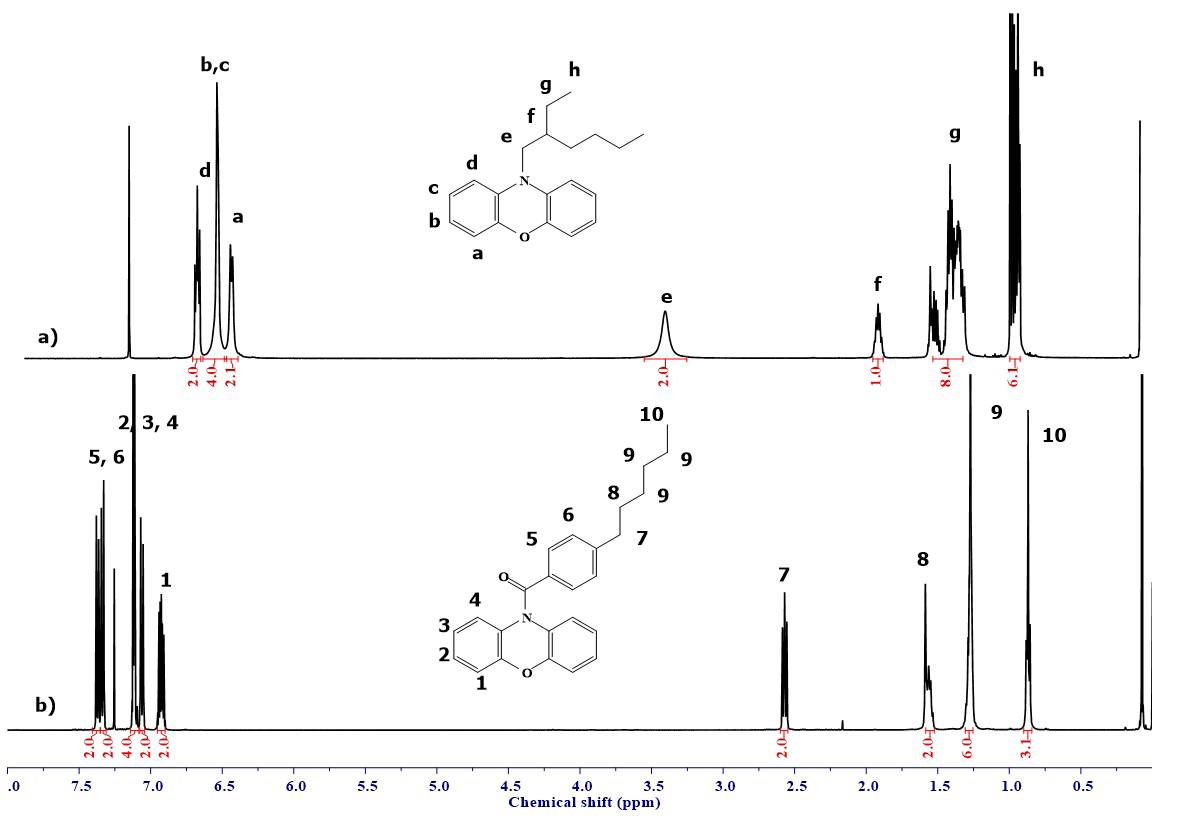
and C−O groups in the phenoxazine ring. Especially, a peak at 1689 cm-1 appears in the spectrum of the P2 attributed to the stretching vibration of the carbonyl groups (C=O) having higher intensity than of the P1 Figure 3 showed the 1H NMR spectra of the alternating copolymers, P1 and P2, which were in good agreement with the polymers’ structures. The spectrum of P1 showed resonances in the range of 7.5-7.8 ppm that can be attributed to the protons in the
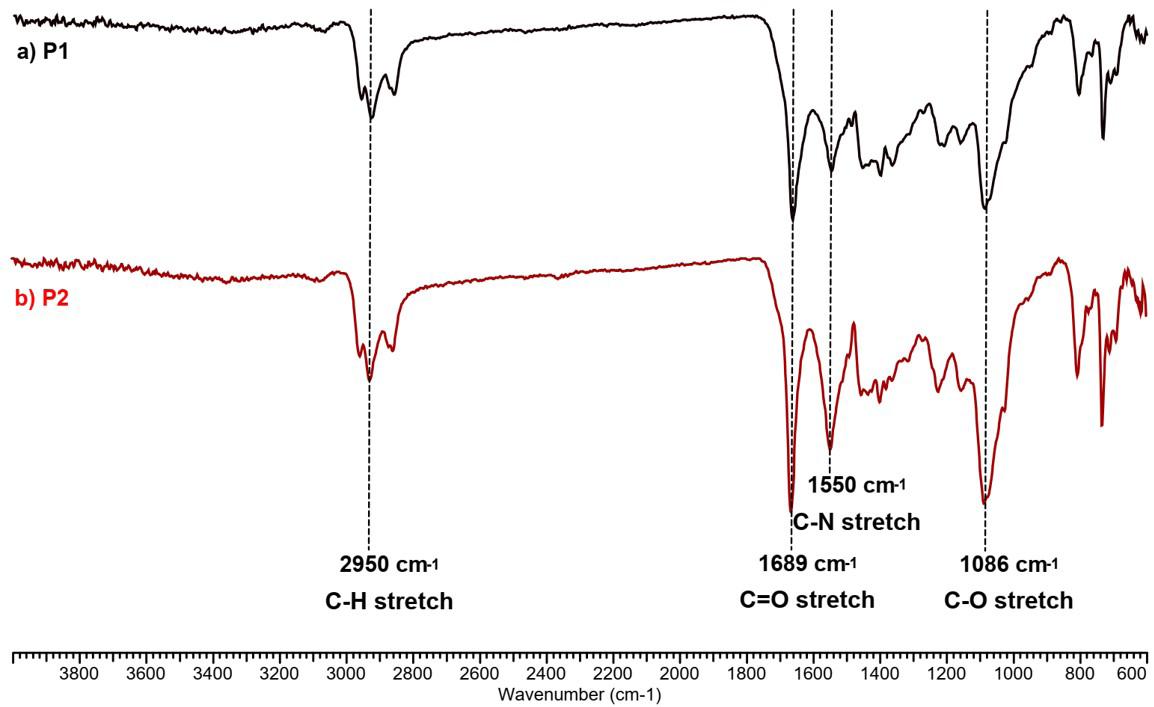
Polímeros, 33(1), e20230009, 2023 4/7
Bui, T. T., Nguyen, T. H., Doan, B. K., Nguyen, L.-T. T., Tran, C. D., & Nguyen, H. T.
Table
Polymer Yield (%) Mn (gmol-1)a Đa T g (°C)b Td (°C)c P1 82 28 000 2.22 - 374 P2 85 41 500 1.91 - 375 a Number-average molecular weight and dispersity index (Đ) determined by GPC with CHCl3 as eluent using polystyrene standards; bGlass transition temperature determined by DSC at a heating rate of 10 0C/min under nitrogen; cTemperature at 10% weight loss measured by TGA under nitrogen.
1. Polymerization yields, molecular weights and thermal properties of copolymers.
Figure 1. 1H NMR spectra of monomer M1 (a) and M2 (b) in CDCl3. Figure 2 Comparative FT-IR spectra of P1 (a) and P2 (b).
Phenoxazine and diketopyrrolopyrrole based donor-acceptor conjugated polymers: synthesis and optical properties
phenoxazine ring and peaks at 9.0 ppm and 7.3 ppm which is attributable to the protons in the DPP ring. In contrast, the proton in the phenoxazine ring was represented by the P2 spectrum peaks at 7.9–8.6 ppm. While the resonance at 4.25 ppm in the spectra of P1 is assigned to the two R-methylene protons in the N-substituted hexyl chain, the peak at 2.26 ppm in the P2 spectrum corresponds to the two R-methylene protons in the N-benzoyl hexyl chain.
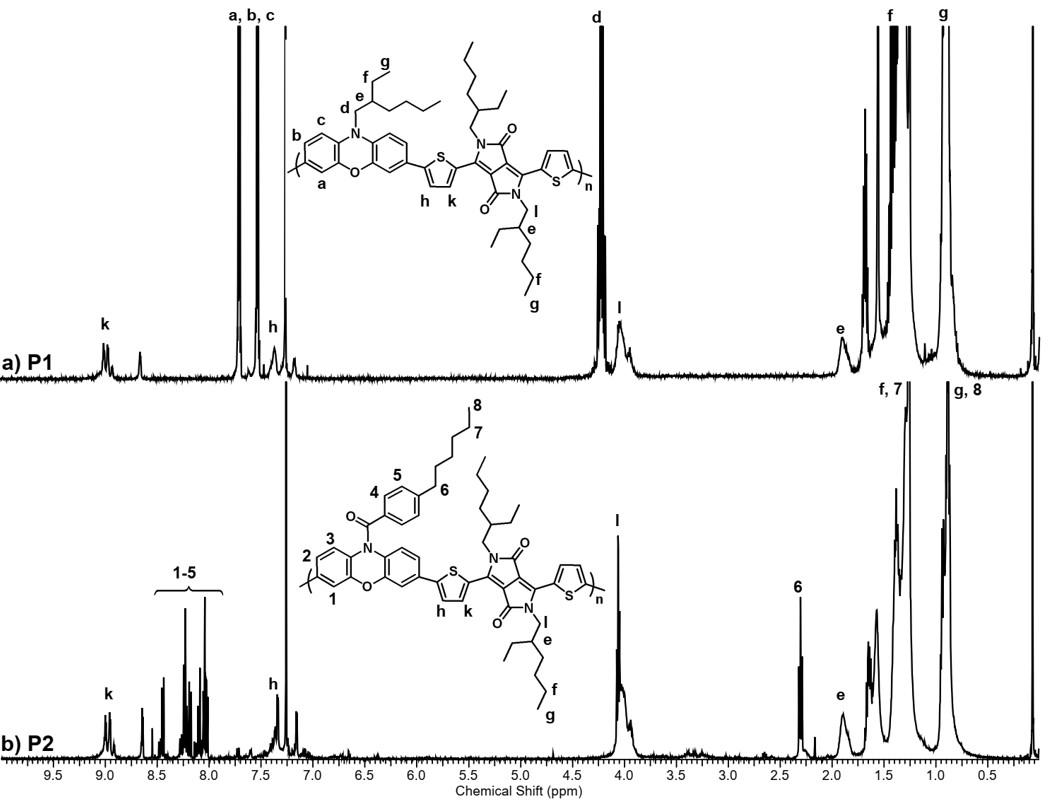
The thermal properties of the polymers were evaluated by thermogravimetric analysis (TGA) and differential scanning calorimetry (DSC) under nitrogen and the results are summarized in Table 1 and Figure 4. All the polymers showed good thermal stability with the onset decomposition temperature (Td) weight loss of 10% occurred above 350 oC and a loss of about 50 wt% at 800 oC (Figure 4a). No obvious thermal transitions were detected in the second heating scans from the DSC experiment in the temperature range
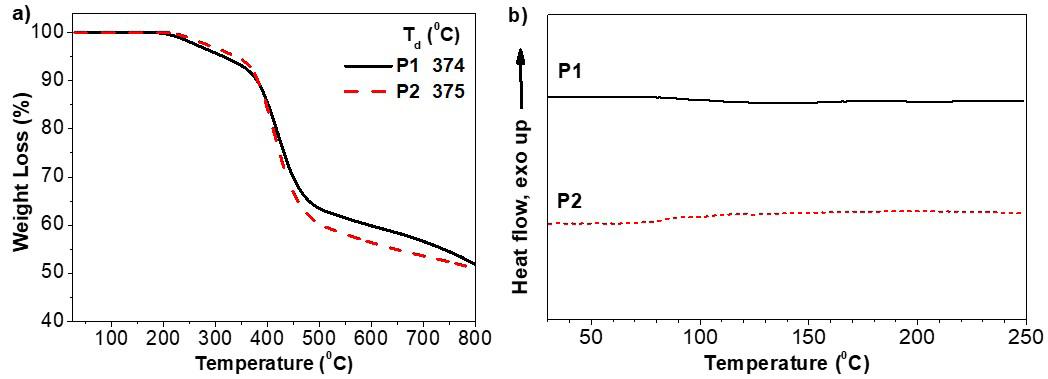
up to 250 oC, indicating that the polymers are amorphous in the temperature range (Figure 4b).
3.4 Optical properties
The UV−vis absorption spectra of the two polymers P1 and P2 were recorded at room temperature both in dilute chloroform solution (ca. 10−6 M) and as thin films spin-coated onto quartz substrates (Figure 5). The detailed absorption data, including maximum absorbance (λmax) in solution and solid state as well as the optical bandgaps, deduced from the absorption edge in films (Eg opt), are summarized in Table 2 The UV spectrum of P1 and P2 polymers in chloroform exhibit a strong absorbance with λmax at 700 nm and 710 nm, respectively. This absorption maximum of over 700 nm results from an intramolecular charge transfer (CT) state of the phenoxazine moieties alternate with diketopyrrolopyrrole moieties in the backbone.
Polímeros, 33(1), e20230009, 2023 5/7
Figure 3. 1H NMR spectra of P1 (a) and P2 (b) in CDCl3
Figure 4 TGA (a) and DSC (b), second heating scans) curves of spectra of P1 and P2 with heating rate of 10 ◦Cmin−1 under nitrogen atmosphere. Td represents the temperature of 10% weight loss.
The UV−vis spectra of thin films of all polymers show absorption throughout the visible region. Moreover, there is significant absorption extending into the near-IR region (as far as ca. 900 nm). In the thin film absorption spectrum, the 92 nm red shift in λ max observed for the P2 polymer compared to P1 is due to the branched alkyl/benzoyl of group substitutions on phenoxazine. The optical band gaps for P1 and P2 polymers were calculated from the absorption cut off value in the solid state. In comparison, P2 films exhibit slightly red-shifted absorption and a lower Eg opt of 1.43 eV, whereas P1 films exhibit blue-shifted absorption and a higher Eg opt of 1.46 eV. The red-shifted absorption maxima in P2 copolymer, indicating that the increased electronic delocalization arising from a more coplanar conformation and reduced steric interactions when benzoyl of group substitutions on phenoxazine moieties alternate with diketopyrrolopyrrole moieties in the backbone. The benzoyl system facilitates π-π interactions between copolymer chains, although the benzoyl substituent is not in direct but cross-conjugated conjugation with the polymer backbone[22]. The substitution of the branched alkyl side chain by a benzoyl ring system led to a significant red-shift of the absorption peak as well as a broadening of the absorption band both in solution and solid state.
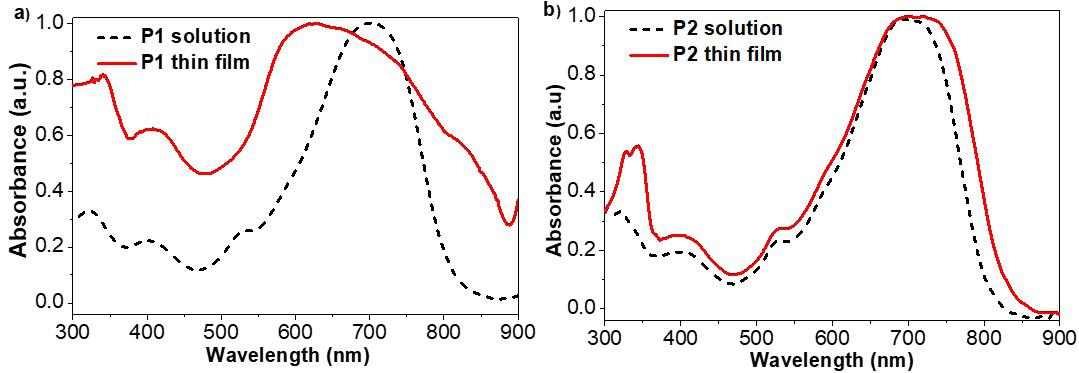
4. Conclusions
In conclusion, two novel low-bandgap conjugated donor-acceptor copolymers based on phenoxazine with ethylhexyl/hexyl benzoyl side chain and diketopyrrolopyrrole were successfully synthesized by Pd-catalyzed direct arylation coupling polycondensation with high Mn (up to 41 500 g/mol) and high yield (>80%). Interestingly, the phenoxazine-based polymers with hexyl benzoyl side chains have higher molecular weights than those with branched ethylhexyl side chains. The benzoyl substitution also resulted in a broadening and redshift of the solid-state absorption spectra of the corresponding copolymer compared to the non-
benzoyl counterpart giving rise to lower optical bandgaps. These copolymers are promising candidate materials for developing new materials in optoelectronic applications.
5. Author’s Contribution
• Conceptualization – Tam Huu Nguyen; Chau Duc Tran; Ha Tran Nguyen.
• Data curation – Thao Thanh Bui; Tam Huu Nguyen; Chau Duc Tran; Ha Tran Nguyen.
• Formal analysis – Tam Huu Nguyen; Bao Kim Doan; Le-Thu Thi Nguyen.
• Funding acquisition – Chau Duc Tran.
• Investigation – Tam Huu Nguyen; Thao Thanh Bui; Bao Kim Doan; Le-Thu Thi Nguyen.
• Methodology – Tam Huu Nguyen; Thao Thanh Bui; Bao Kim Doan; Le-Thu Thi Nguyen.
• Project administration – Chau Duc Tran.
• Resources – Tam Huu Nguyen; Chau Duc Tran.
• Software – Tam Huu Nguyen; Le-Thu Thi Nguyen.
• Supervision – Chau Duc Tran; Ha Tran Nguyen.
• Validation – Chau Duc Tran; Ha Tran Nguyen.
• Visualization – Tam Huu Nguyen; Chau Duc Tran; Ha Tran Nguyen.
• Writing – original draft – Tam Huu Nguyen; Chau Duc Tran; Ha Tran Nguyen.
• Writing – review & editing – Chau Duc Tran; Ha Tran Nguyen.
6. Acknowledgements
This research is funded by Vietnam National University Ho Chi Minh City (VNU-HCM) under grant number C2022-20-19 and NVTX2023: TX2023-20a-1.
Polímeros, 33(1), e20230009, 2023 6/7
Bui, T. T., Nguyen, T. H., Doan, B. K., Nguyen, L.-T. T., Tran, C. D., & Nguyen, H. T.
Polymer λ max solution (nm) λ max flim (nm) λ optical film (nm) E g optical (eV)a P1 700 628 850 1.46 P2 710 720 865 1.43 a
Eg opt = 1240/λ max onset
Table 2. Absorption maxima and energy levels of the polymers.
Optical band gap estimated from the UV–vis absorption spectra edge in film,
. The solid-state UV-vis spectra were used to estimate the optical band gaps from the wavelength at the intersection of the tangent drawn at the low-energy side of the absorption spectrum with the x-axis.
Figure 5. UV–vis absorption spectra of P1 (a) and P2 (b) in CHCl3 solution and thin film on a quartz substrate.
Phenoxazine and diketopyrrolopyrrole based donor-acceptor conjugated polymers: synthesis and optical properties
7. References
1. Cheng, M., Chen, C., Yang, X., Huang, J., Zhang, F., Xu, B., & Sun, L. (2015). Novel small molecular materials based on phenoxazine core unit for efficient bulk heterojunction organic solar cells and perovskite solar cells. Chemistry of Materials, 27(5), 1808-1814 http://dx.doi.org/10.1021/acs. chemmater.5b00001
2 Cheng, M., Xu, B., Chen, C., Yang, X., Zhang, F., Tan, Q., Hua, Y., Kloo, L., & Sun, L. (2015). Phenoxazine-based small molecule material for efficient perovskite solar cells and bulk heterojunction organic solar cells. Advanced Energy Materials, 5(8), 1401720 http://dx.doi.org/10.1002/aenm.201401720
3 Choi, J., Kim, W., Kim, S., Kim, T.-S., & Kim, B. J. (2019). Influence of acceptor type and polymer molecular weight on the mechanical properties of polymer solar cells. Chemistry of Materials, 31(21), 9057-9069 http://dx.doi.org/10.1021/ acs.chemmater.9b03333
4. Gobalasingham, N. S., & Thompson, B. C. (2018). Direct arylation polymerization: a guide to optimal conditions for effective conjugated polymers. Progress in Polymer Science, 83, 135-201 http://dx.doi.org/10.1016/j.progpolymsci.2018.06.002
5 Gong, X., Zhang, Y., Wen, H., Fan, Y., Han, P., Sun, Y., Zhang, X., Yang, H., & Lin, B. (2016). Phenoxazine-based conjugated ladder polymers as novel electrode materials for supercapacitors. ChemElectroChem, 3(11), 1837-1846 http:// dx.doi.org/10.1002/celc.201600381.
6 Hu, J.-J., Luo, X.-F., Zhang, Y.-P., Mao, M.-X., Ni, H.-X., Liang, X., & Zheng, Y.-X. (2022). Green multi-resonance thermally activated delayed fluorescence emitters containing phenoxazine units with highly efficient electroluminescence. Journal of Materials Chemistry C, 10(2), 768-773 http://dx.doi. org/10.1039/D1TC04595D
7 Huang, Y., Kramer, E. J., Heeger, A. J., & Bazan, G. C. (2014). Bulk heterojunction solar cells: morphology and performance relationships. Chemical Reviews, 114(14), 7006-7043 http:// dx.doi.org/10.1021/cr400353v PMid:24869423.
8 Jenni, S., Renault, K., Dejouy, G., Debieu, S., Laly, M., & Romieu, A. (2022). In situ synthesis of phenoxazine dyes in water: application for “turn-on” fluorogenic and chromogenic detection of nitric oxide. ChemPhotoChem, 6(5), e202100268 http://dx.doi.org/10.1002/cptc.202100268
9 Lipomi, D. J., & Bao, Z. (2017). Stretchable and ultraflexible organic electronics. MRS Bulletin, 42(2), 93-97 http://dx.doi. org/10.1557/mrs.2016.325
10 Lombeck, F., Müllers, S., Komber, H., Menke, S. M., Pearson, A. J., Conaghan, P. J., McNeill, C. R., Friend, R. H., & Sommer, M. (2017). Benzoyl side-chains push the open-circuit voltage of PCDTBT/PCBM solar cells beyond 1 V. Organic Electronics, 49, 142-151 http://dx.doi.org/10.1016/j.orgel.2017.06.055
11 Mazzio, K. A., & Luscombe, C. K. (2015). The future of organic photovoltaics. Chemical Society Reviews, 44(1), 78-90 http:// dx.doi.org/10.1039/C4CS00227J PMid:25198769.
12 Narayanaswamy, K., Yadagiri, B., Chowdhury, T. H., Swetha, T., Islam, A., Gupta, V., & Singh, S. P. (2019). Impact of A–D–A-structured dithienosilole- and phenoxazine-based small molecular material for bulk heterojunction and dopant-free perovskite solar cells. Chemistry: a European Journal, 25(71),
16320-16327 http://dx.doi.org/10.1002/chem.201903599 PMid:31497906.
13 Nowakowska-Oleksy, A., Cabaj, J., Olech, K., Sołoducho, J., & Roszak, S. (2011). Comparative study of alternating low-band-gap benzothiadiazole co-oligomers. Journal of Fluorescence, 21(4), 1625-1633 http://dx.doi.org/10.1007/ s10895-011-0851-1 PMid:21279539.
14 Nowakowska-Oleksy, A., Sołoducho, J., & Cabaj, J. (2011). Phenoxazine based units- synthesis, photophysics and electrochemistry. Journal of Fluorescence, 21(1), 169-178 http://dx.doi.org/10.1007/s10895-010-0701-6 PMid:20625802.
15 Onoabedje, E. A., Ayogu, J. I., & Odoh, A. S. (2020). Recent development in applications of synthetic phenoxazines and their related congeners: a mini-review. ChemistrySelect, 5(28), 8540-8556 http://dx.doi.org/10.1002/slct.202001932
16 Pearson, R. M., Lim, C.-H., McCarthy, B. G., Musgrave, C. B., & Miyake, G. M. (2016). Organocatalyzed atom transfer radical polymerization using n-aryl phenoxazines as photoredox catalysts. Journal of the American Chemical Society, 138(35), 11399-11407. http://dx.doi.org/10.1021/ jacs.6b08068 PMid:27554292.
17 Pouliot, J.-R., Grenier, F., Blaskovits, J. T., Beaupré, S., & Leclerc, M. (2016). Direct (hetero) arylation polymerization: simplicity for conjugated polymer synthesis. Chemical Reviews, 116(22), 14225-14274 http://dx.doi.org/10.1021/ acs.chemrev.6b00498 PMid:27809495.
18 Truong, N. T. T., Mai, H. L. T., Luu, T. H., Nguyen, L. T., Nguyen, L.-T. T., Hoang, M. H., Huynh, H. P. K., Tran, C. D., & Nguyen, H. T. (2021). New narrow bandgap polymers containing 10-(4-((2-ethylhexyl)oxy)phenyl)-10H-phenothiazine/ phenoxazine and 3,6-di(2-thienyl)pyrrolo[3,4-c]pyrrole-1,4dione)-based units: synthesis and photovoltaic properties. Journal of Materials Science Materials in Electronics, 32(8), 10194-10208 http://dx.doi.org/10.1007/s10854-021-05675-2
19 Zheng, Y., Zhang, S., Tok, J. B.-H., & Bao, Z. (2022). Molecular design of stretchable polymer semiconductors: current progress and future directions. Journal of the American Chemical Society, 144(11), 4699-4715. http://dx.doi.org/10.1021/jacs.2c00072. PMid:35262336.
20 Zhu, Y., Babel, A., & Jenekhe, S. A. (2005). Phenoxazine-based conjugated polymers: a new class of organic semiconductors for field-effect transistors. Macromolecules, 38(19), 7983-7991. http://dx.doi.org/10.1021/ma0510993
21 Zhu, Y., Kulkarni, A. P., & Jenekhe, S. A. (2005). Phenoxazinebased emissive donor−acceptor materials for efficient organic light-emitting diodes. Chemistry of Materials, 17(21), 52255227 http://dx.doi.org/10.1021/cm050743p
22 Zhu, Y., Kulkarni, A. P., Wu, P.-T., & Jenekhe, S. A. (2008). New ambipolar organic semiconductors. 1. synthesis, singlecrystal structures, redox properties, and photophysics of phenoxazine-based donor−acceptor molecules. Chemistry of Materials, 20(13), 4200-4211 http://dx.doi.org/10.1021/ cm702212w
Received: Feb. 17, 2023
Revised: NA
Accepted: Mar. 31, 2023
Polímeros, 33(1), e20230009, 2023 7/7
Effect of hybridisation and nano reinforcement on repairing cracked pipeline Payman
Sahbah Ahmed1*
1Strength of Materials Laboratory, Manufacturing & Industrial Engineering Department, Faculty of Engineering, Koya University, Koya, Kurdistan Region, Iraq
*payman.suhbat@koyauniversity.org
Obstract
Composite materials are used to repair cracks in pipelines that appear after a period of time. This study investigates the effect of hybridisation on the blister behaviour of composite repair by using the finite element method. The behaviour of the best hybridised stacking sequence is compared with the experimental results to validate the numerical outcomes. The effect of adding multiwall carbon nanotubes (MWCNTs) to the epoxy resin, used to stick the composite repair with the steel pipeline, is explored by combining the MWCNT and the epoxy through high shear mixing. The results showed that hybridisation has a great effect on improving the blistering behaviour of the composite repair. The preparation of nano-reinforced adhesive by shear mixing did not show noticeable improvement. Predicting the composite repair behaviour through blister test by using the finite element method can be used as a good indication of pipeline protection.
Keywords: hybridisation, blister test, MWCNTs, shear mixing process, composite repair.
How to cite: Ahmed, P. S. (2023). Effect of hybridisation and nano reinforcement on repairing cracked pipeline. Polímeros: Ciência e Tecnologia, 33(1), e20230010. https://doi.org/10.1590/0104-1428.20220111
1. Introduction
Composite materials are used to repair pipeline issues, such as rifts and fissures due to weathering and large temperature differences between summer and winter[1,2] They are used for this purpose due to their capability to overcome the generated stresses in the pipes and to retain the bending and tensile stiffness of the pipelines caused by high internal pressure[3]
Recently, the demand for high-strength and good performance composites is increasing due to their outstanding toughness under various thermal and chemical conditions, as a result of generation composite hybridisation[4,5]. Two or more types of fibre can be mixed in the resin by composite hybridisation to utilise the good properties of fibres and to overcome the weaknesses of the individual fibres[4,6,7]. Mechanical properties are greatly influenced by hybrid composite stacking sequence[4] where the appropriate types and sequence of fibres are used and mixed. Considering the required application and its specific requirements of particular properties can greatly improve the behaviour of the composite material. The selection of fibre type depends on how many plies will be used in addition to the density and thickness of each ply[8]
The use of a hybrid combination of glass fibre with other types can improve the mechanical and impact properties[9] Although carbon-reinforced polymer composites have extremely high strength, they have high cost, low toughness and strain to failure, which restricts their use in applications that require high compressive and flexural strength. The addition
of glass fibre to carbon-reinforced polymer composites can greatly improve the strain of failure and lower the cost[10,11].
Blister test[12] is used to evaluate the sticking of composite repair to the pipeline. The composite repair is stuck with an adhesive over a steel plate with a hole at the centre. A shaft is placed across the hole as opposed to the bottom of the coating, resulting in composite repair delamination from the steel plate and creating a blister[3]
Zugliani et al.[13] developed a method of repairing pipes with bonded joints by wrapping a composite around the pipe became standard practice in the sector. To determine the energy release rate of different specimens made of the same material as the most frequent repairs (steel/glass fiber reinforced polymer), double cantilever beam (DCB) and width tapered double cantilever beam (WTDCB) tests were conducted. It is possible to anticipate a value of failure pressure using the results of the energy release rate calculations for the DCB and WTDCB using the design equation published in Standards ISO/PDTS 24817 and ASME PCC-2. Analysis was done by comparing the prophesied failure pressure value to the outcomes of the experimental hydrostatic tests and the comparison should a good agreement, which indicates that this methodology can be utilized to foretell the failure pressure in bonded repaired pipes.
A shaft blister test was utilized by Barros et al.[3] to evaluate the projected failure pressure of glass reinforced Epoxy composite repairs. An investigation on the interfacial debonding of a composite plate bonded to steel substrate included blister tests. The pipeline repair used on the
https://doi.org/10.1590/0104-1428.20220111 O O O O O O O O O O O O O O O Polímeros, 33(1), e20230010, 2023 ISSN 1678-5169 (Online) 1/8
blister test specimen is composite material. It is possible to foretell the failure pressure using the outset debonding load. The debonding propagation has been tracked, and the blister shape had been assessed, using a 3D digital image correlation (DIC). To simulate the loaded shaft blister test, a 3D finite element model with a cohesive zone model has been used. The results showed a good correlation between blister testing and finite element simulations[3]
The full-scale pipeline burst tests and finite element calculations on a damaged pipe and a composite-repaired pipe were explored by Lim et al.[14]. The findings demonstrated that the composite-repaired pipe’s burst pressure increased by 23% while its strain in the defect area was greatly reduced. Detailed information on the burst pressure and strain reading over the whole applied pressure range was recorded for each component of the burst-test specimens, and their behavior was analyzed. These results were helpful in optimizing the current composite repair design processes[14]
Kong et al.[15] utilized CFRP to repair defects in pipes with various hoop lengths, and various putties to cover the flaws. The impacts of defect diameters and putty mechanical characteristics on the burst performances of the repaired pipes were examined through burst test and finite element (FE) Analysis. For example, if the defect’s hoop length is less than 20% of the pipe’s diameter and the putty failed before the CFRP, the CFRP continued to support the load. However, if the length was longer, it became inactive. To prevent the putty from failing first, the rupture strain of the material should be higher than that of CFRP. The design approaches based on acceptable stress in the pipe substrate or allowable strain of the repair laminates in ISO/TS 24817 were quantitatively compared based on the burst performances of the repaired faulty steel pipe with CFRP. Based on the failure mechanism of the repaired pipes, a method to estimate the burst pressure of the pipes was put forth[15]
Zhang et al.[16] used tests to investigate the durability of Carbon Fiber Reinforced Polymer (CFRP) which was used to repair corroded maritime pipes with the bending moment and seawater immersion. The elements affecting durability were investigated, and the attenuation of the restored structure was divided into that of CFRP and that of the interface between CFRP and steel. The Finite Element Analysis method (FEM) was used to create a numerical damage model of CFRP-repaired pipes based on the attenuation law. Numerical methods were used to obtain the mechanical characteristics of the restored pipelines. These characteristics were nearly identical to those found in the experimental findings[16]
To assess the failure behavior and capacity of grouted composite repair systems, Shamsuddoha et al.[17] created a three-dimensional (3D) Finite Element Analysis (FEA) of a full-scale pipe with varying amounts of metal loss. Using two infill grout systems reinforced with carbon and glass sleeves of various thicknesses, steel pipes with a localized fault ranging from 20% to 80% metal loss were considered. The outcomes showed that the infill grout’s tensile cracking controls how well the repair technique performs. Higher tensile strength grout and a thicker sleeve result in greater pipe capacity in the repair system. A high modulus grout, on the other hand, offers a more efficient load transfer from steel to sleeve[17]
As can be seen from the aforementioned earlier studies, researchers either utilized glass or carbon alone but never attempted to combine the two to improve behavior, highlighting the gap in the literature and the importance of the present study.
The behaviour of the adhesives is weak and imperfect due to their low strength compared with the composite repair and the steel plate. The use of nanoparticle reinforcement can solve this problem and improve the mechanical properties of structural adhesive. Nano–reinforced polymers have exhibited the preferred physical and mechanical properties over polymer-matrix composites and their corresponding conventional fillers, such as fibres or micro reinforcement in the last decades. The addition of small amounts of nano reinforcement can lead to a huge improvement in the polymer properties[18]
Manufacturing of nanoparticle-reinforced composite is difficult due to the need of nano reinforcement for functionalisation. This process requires a surface modification of the nanoparticles to make them chemically compatible with the matrix, and a special chemical preparation process is needed in addition to careful dealing with the nanopowder due to its high hazardous effects. Many processes, such as the use of ultrasound energy, solvent evaporation, ball mills, 3-roll mill and high shear mixing, have been proposed by authors to disperse the nanoparticle in the matrix and to ensure an effective functionalisation[19]
This work investigates the effect of the hybridisation of woven glass with carbon fibres in 12 different stacking sequences on the blister behaviour of composite repair by using the FEM. The behaviour of the best stacking sequence was compared with the experimental results to validate the numerical outcomes. The effect of adding multiwall carbon nanotubes (MWCNTs) to the epoxy resin that is used to stick the composite repair with the steel pipeline is explored by combining the MWCNTs and the epoxy through high shear mixing.
2. Theoretical and Numerical Model
Shaft-loaded blister tests, in which the shaft stimulates the created load from the petroleum flow and the resulting pressure on the composite repair, can be used to determine the strength of the adhesive bonding between the composite repair and pipeline.
The energy release rate GT can be calculated in terms of the load of failure F, as shown in Equation 1[3]
where D represents the stiffness of bending measured depending on the characteristics of the laminate, E is young’s modulus, ν is Poisson’s ratio, and t is the plate thickness, as shown in Equation 2[3]
Failure pressure P of the utilised composites to repair the pipes can be calculated by using Equations 3[20,21]:
P. S. Polímeros, 33(1), e20230010, 2023 2/8
Ahmed,
2 2 32 = T F G D π (1)
( ) 3 2 121 Et D v = (2)
where 12 = ac EEE [22] , d represents the diameter of the hole, and G is the shear modulus.
By creating a model using FEM in the ANSYS workbench, the cohesive zone model (CZM) is utilized to depict the interface between the pipeline and the composite repair through the blister test. The foundation of the CZM approach is a zone where the material can bear traction stresses just in front of a fracture tip[23]. When the surface thickness is zero, surface cohesive behaviour can be used to model CZM as an alternative to the cohesive element technique[24]
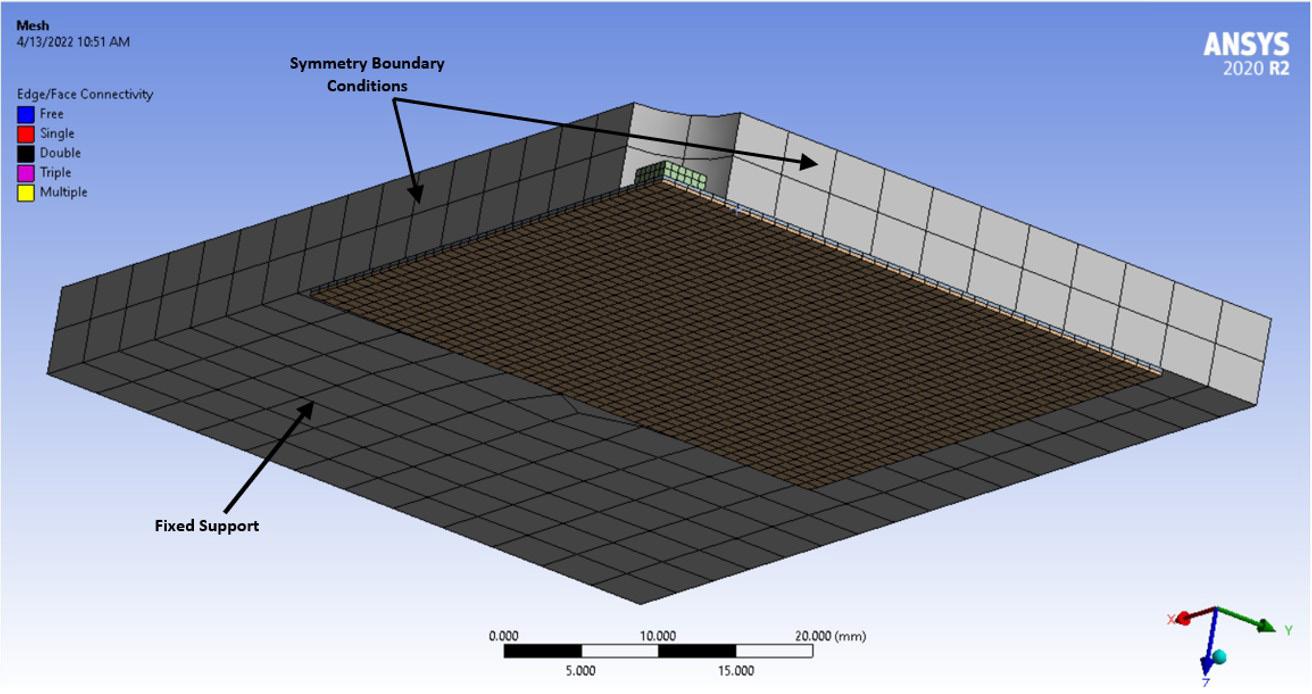
A traction separation law (Figure 1) that consists of three parts (the first of which is the linear elastic region before damage initiation and before the separation starts δin and σmax in Figure 1 and the second of which is the damage evolution from initial separation δin until final separation δf. σmax represents the behavior of the adhesive zone to mode I of fracture. The adhesive binding strength is shown by the symbol max in Figure 1. The third part is the after-damage initiation region, sometimes referred to as the softening region or the release site for fracture energy (Gc)[23,25,26].
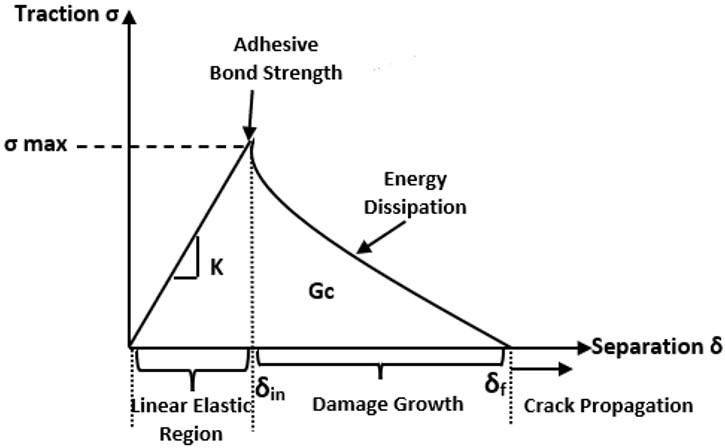
In this investigation, traction stress of 8 MPa and interface displacement of 0.06 mm were used as CZM parameters. Figure 2 depicts the mesh and boundary conditions for the
quad/tri free face sweep meshing method. To cut down on run time, one-fourth of the model is utilised. To show the shaft, a displacement in a vertical direction is applied to the disc’s upper face[3]. The woven, unidirectional carbon and glass-reinforced epoxy mechanical characteristics employed in the numerical model were acquired from the Ansys library.
Twelve stacking sequences are used in this research (Table 1) to investigate the effect of hybridisation on the blister test behaviour of composite used for pipeline repair.
3. Methodology
3.1 Materials
Epoxy resin (Sikadur-52, Sika Company) is used as the matrix and consists of two components, namely, low viscosity resin and hardener, where three parts of resin are mixed with one part of hardener. The properties of the epoxy matrix are listed in Table 2.
Steel plates with 6 mm thickness, a maximum tensile strength of 470 MPa and yield tensile strength of 355 MPa are used as a base, and their chemical composition is 0.23% carbon, 1.6% manganese, 0.05 silicon, 0.05% sulphur and 0.05% phosphorus.
The properties of woven carbon and glass fibres are listed in Table 3.
MWCNTs (Henan Huier Nano Technology Company) have 3–12 nm tube length, 12.9 nm tube outer diameter, 4.1 mm tube wall thickness, and 5 to 12 layers.
3.2 Preparation of composite repair and nano-reinforced adhesive
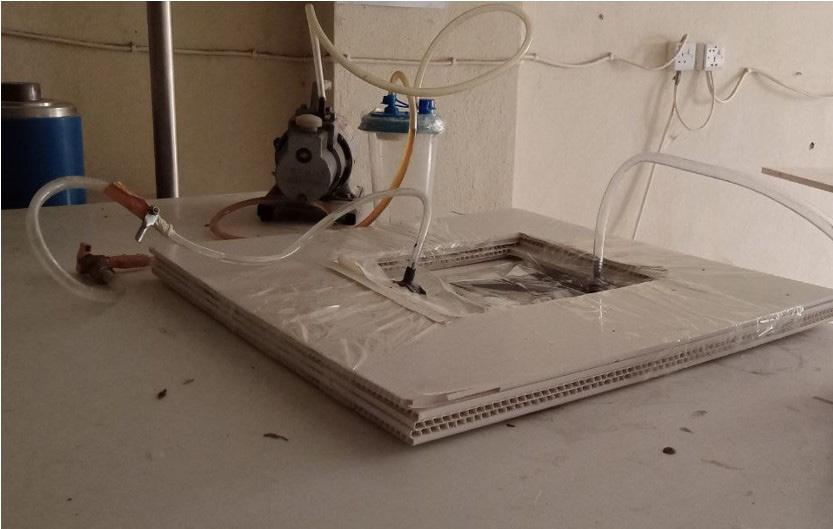
3.2.1 Preparation of composite repair
Vacuum bagging is used to prepare the carbon and glass hybrid composite, as shown in Figure 3. Four plies are placed together between two nylon sheets to form the vacuum bag. The vacuum bag is connected to a vacuum motor by a hose from one side, and another hose connects the vacuum bag with the epoxy resin-hardener mix from the other side. A resin trapper is placed between the vacuum bag and the vacuum motor to prevent the epoxy from going into the vacuum motor.
Polímeros, 33(1), e20230010, 2023 3/8 ( ) 2 42 3 1 313 64 512 T ac G P v ddd E Gt t π = ++ (3)
Effect of hybridisation and nano reinforcement on repairing cracked pipeline
Figure 1. Traction-separation law represents the behavior of the adhesive zones.
Figure 2. Meshing and boundary conditions of the finite element model used in simulating blister test.
Figure 3. Vacuum bagging technique.
A mesh sheet is placed over the fibre layers to guarantee a homogeneous distribution of the resin inside the fibre layers. The vacuum bag is tightly sealed to ensure no leakage occurs before pumping the resin into the vacuum bag. When all fibre layers are completely covered with the resin, the two hoses are closed tightly, and the composite is left to cure at room temperature for 24 h. The cured composites are cut to the repair dimensions of 80 mm*80 mm, and they are ready to be stuck on the steel plate.
3.2.2 Preparation of nano-reinforced adhesive
The MWCNT is mixed with the epoxy resin and left overnight at 80 °C. The mixture is mixed manually until the nanopowder was visibly dispersed into the resin. MWCNT samples are prepared at 0.8% by weight according to[27]. Mille shear mixer was used on the previously mixed composite at 1800 RPM for 60 min[19], and then the mixture is used to stick the composite repair to the steel plate.
3.3 Blister sample and test
The blister test sample is made of a steel plate with 95 mm width, 140 mm length and a hole with a 5 mm radius in the centre where the shaft will pass through. The lower surface of the steel plate is cleaned by using a sand jet to obtain a clear and rough surface, and acetone is used to remove dirt. A waxy material is utilised to fill up the hole in the steel plate to precluding the adhesive to go in the hole. The epoxy and MWCNT-reinforced epoxy are
used to agglutinate the composite repair on the steel plates. Hybrid woven carbon and glass-reinforced epoxy plates are agglutinated on the steel plates and cured for a week at room temperature (Figure 4). The waxy material should be removed after curing.
A cylindrical part with a 4 mm radius and 4 mm height is agglutinated on the composite repair inside the hole of the steel plate to ensure an axisymmetric formation during the test.
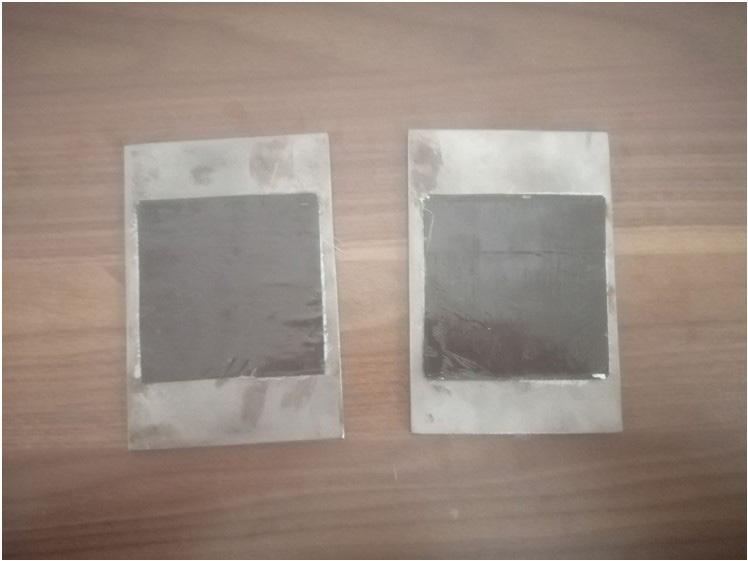
Ahmed, P. S. Polímeros, 33(1), e20230010, 2023 4/8
No. Abbreviation No. of Layers Stacking Sequence 1 CG 2 Layers Woven Carbon + Woven Glass 2 GC Woven Glass + Woven Carbon 3 2G 2 Woven Glass 4 2C 2 Woven Carbon 5 2G2C 4 Layers 2 Woven Glass+2 Woven Carbon 6 GCGC Woven Glass + Woven Carbon+ Woven Glass + Woven Carbon 7 CGGC Woven Carbon +Woven Glass + Woven Glass + Woven Carbon 8 GCCG Woven Glass +Woven Carbon +Woven Carbon+ Woven Glass 9 GUCUCG Woven Glass +Unidirectional Carbon Unidirectional Carbon+ Woven Glass 10 UGCCUG Unidirectional Glass +Woven Carbon +Woven Carbon+ Unidirectional Glass 11 UCGGUC Unidirectional Carbon +Woven Glass + Woven Glass + Unidirectional Carbon 12 CUGUGC Woven Carbon + Unidirectional Glass + Unidirectional Glass + Woven Carbon
Table 1. Stacking sequence of hybrid composite repair.
Compression Strength Flexural Strength Tension Strength Modulus of Elasticity 53 N/mm2 50 N/mm2 25 N/mm2 1.06 KN/mm2
Table 2. Properties of epoxy matrix (provided by the supplier).
Fiber Woven Carbon Woven Glass Unidirectional Carbon Unidirectional Glass Longitudinal Modulus of Elasticity (GPa) 29 20 45 169 Transvers Modulus of Elasticity (GPa) 5.52 13.96 12 9 Shear modulus (GPa) 2.51 3.1 5.5 6.5 Poisson’s ratio 0.15 0.22 0.19 0.21 Density (gm/cm3) 1.22 1.83 2.076 1.646
Table 3. Properties of woven carbon and glass fibers (provided by the supplier).
Figure 4. Hybrid woven glass and carbon reinforced epoxy blister test samples with and without nano reinforced adhesives.
Effect of hybridisation and nano reinforcement on repairing cracked pipeline
An Instron machine is utilised to test the samples by blister test. The steel plate with the composite repair is placed horizontally, and the composite direction is placed downward and fixed in the machine by two holders. The cross-head velocity is set to 2 mm/min, and force is applied on the shaft and the small disc to ensure that the load will be distributed uniformly on the composite repair[22]. The blister sample and test are shown in Figure 5
3.4 SEM images
A MIRA 3 field emission scanning electron microscope is used to find out the effectiveness of high shear mixing in dispersing the MWCNT in the epoxy adhesive.
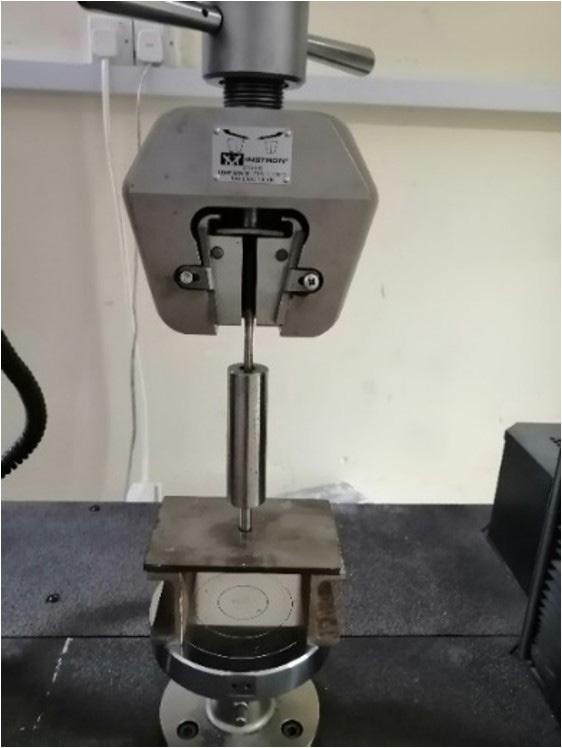
4. Results and Discussion
This study investigates the effect of hybridisation and nano-reinforced adhesive on the blistering behaviour of 12 composites having different stacking sequences, as mentioned in Table 1
To reduce the amount of time and money spent on the experiment, the effect of hybridizing glass with carbon woven fibers is studied using the FEM. In contrast to utilizing either carbon or glass alone, using two layers of woven glass and carbon fibers raises the load and improves the blistering behavior, as demonstrated in Table 4 and Figure 6. This results in a higher failure pressure value. A better result may be obtained by placing glass in front of carbon as opposed to carbon in front of glass. The reason for this behavior is that the composite maintains its strength under the load and pressure of the shaft, and its back is shielded by the highstrength carbon fiber. This behavior is caused by the high strain of glass in the composite. The composite is unable to bend and cannot maintain its strength under pressure when the carbon is placed in front of the low strain carbon fiber. The low-strength glass in its rear is unable to provide the composite with the necessary level of protection, which causes the composite repair to prematurely delaminate from the pipe.
When compared to the two layers of GC, where the failure pressure of 2G2C is four times higher than GC, the employment of four woven layers improved the blistering behavior. according to Table 4. It is preferable to place two layers of woven glass fiber in front of two layers of woven
carbon fiber rather than alternate layers of glass and carbon, placing the glass and carbon on the exterior surfaces, or

Polímeros, 33(1), e20230010, 2023 5/8
Sample P critical (N) GT (N/mm) P (MPa) 2 Woven Layers CG 214 0.5488 5.00154 GC 260 0.8101 6.0761 2G 203 0.5961 4.8376 2C 225 0.51869 5.1442 4 Woven Layers 2G2C 825 1.0194 24.6789 GCGC 655 0.6425 19.5931 CGGC 564 0.4764 16.871 GCCG 175 0.0458 5.2348 2 Woven & 2 Unidirectional Layers GUCUCG 215 0.0177 2.5349 UGCCUG 183 0.0333 2.7243 UCGGUC 211 0.0170 2.4876 CUGUGC 603 0.3626 8.9767
Table 4. FEM results of blister test for varying stacking sequence of hybrid composite repair.
Figure 5. Sample of blister test in Instron machine.
Figure 6. Effect of composite type on critical load (by using 2 woven layers).
placing the glass and carbon inside the core, as shown in Figure 7. The bending force pressures the composite during the blistering test, creating tension and compression stresses. Due to its high strain to failure, glass will endure compression pressures, and carbon will withstand tension strains because to its great strength.
The inclusion of four layers significantly raises the failure pressure of composite repairs, with 2G2C having a failure pressure that is four times higher than GC. The failure pressure of the composite repair is improved by the inclusion of alternating layers made of woven carbon and glass fibers, where the failure pressure of GCGC is three times higher than that of the GC composite. The pipeline repair composite’s strength is significantly increased with the addition of fibers with higher stiffness, such carbon[28]. It works better to place woven carbon fibers on the outside than woven glass fibers. This circumstance results from the outer layer’s fundamental control of stiffness[28], which suggests that the delamination load is mostly dependent on the outer layer’s strength. Adding carbon to the outside When compared to GC, CGGC increases failure pressure by 2.8 times, and the failure pressure of GCCG composite falls to 5.2348 MPa from 6.0761 MPa for GC composite.
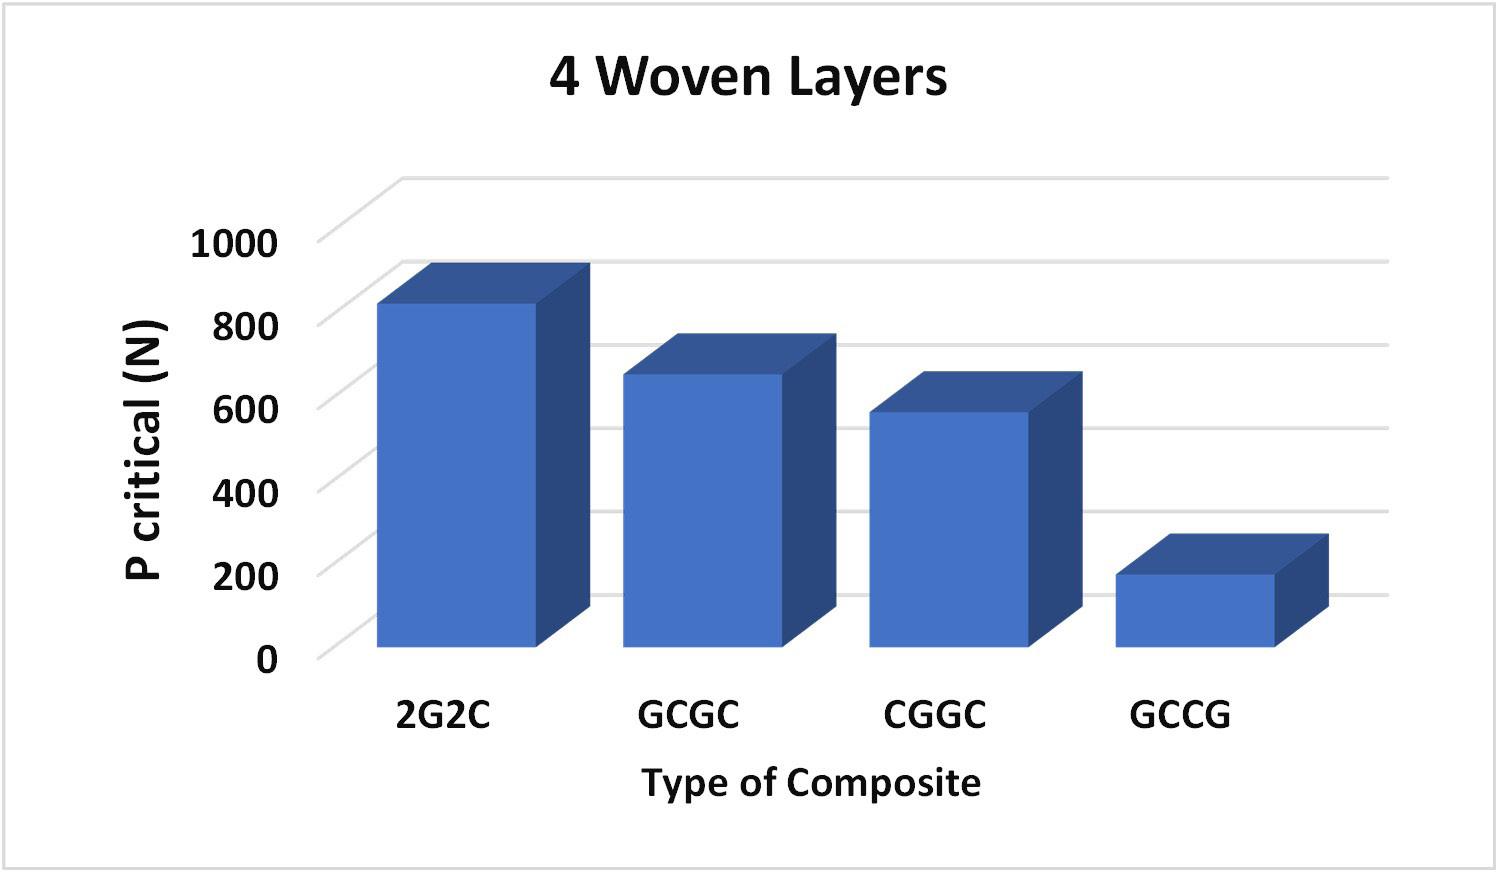
Table 4 demonstrates that there is a significant reduction in blistering behavior when unidirectional fibers are hybridized with woven fibers. The unidirectional fibers will resist the load from one direction when it is applied to the center of the composite during the blistering test, but the composite will be unprotected from the other direction due to the non-isotropic structure of the composite layer[28]. Due to the low load value, delamination will take place before failure, which lowers the failure pressure. as depicted in Figure 8. Higher load values are achieved when employing woven carbon fibers on the outside than when using woven glass fibers, unidirectional carbon fibers, or unidirectional glass fibers.
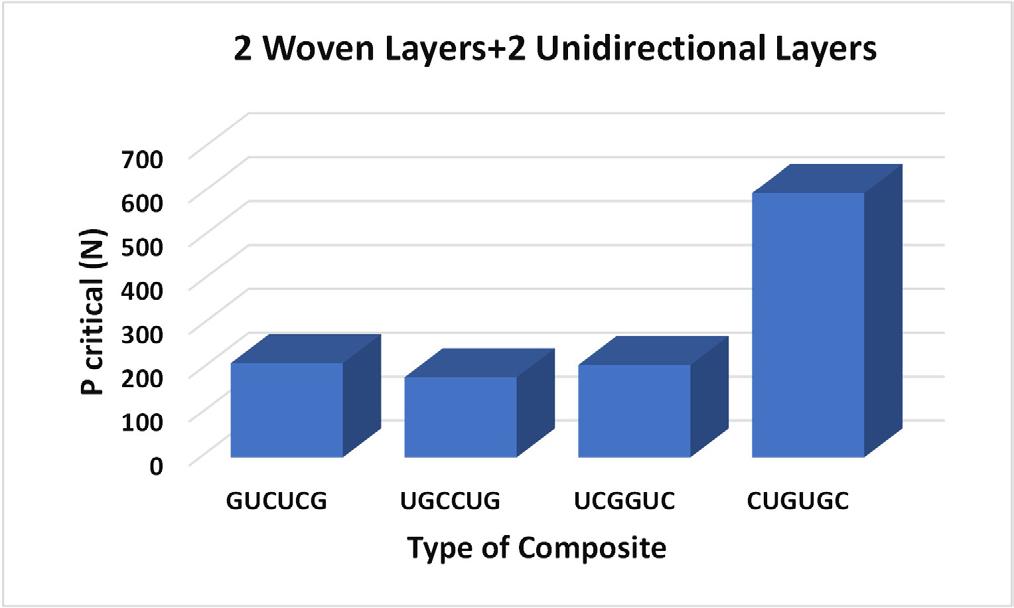
According to the FEM findings, the 2G2C composite performed the best in the blister test. The numerical computation is verified through a series of experimental blister testing. The composites are prepared by vacuum bagging to conserve the mechanical properties of the composite[29]. As shown in Figure 9. a close delamination behaviour is observed but the numerical value of the load is higher, and this is logically right due to the ideal behaviour of the FEM model.
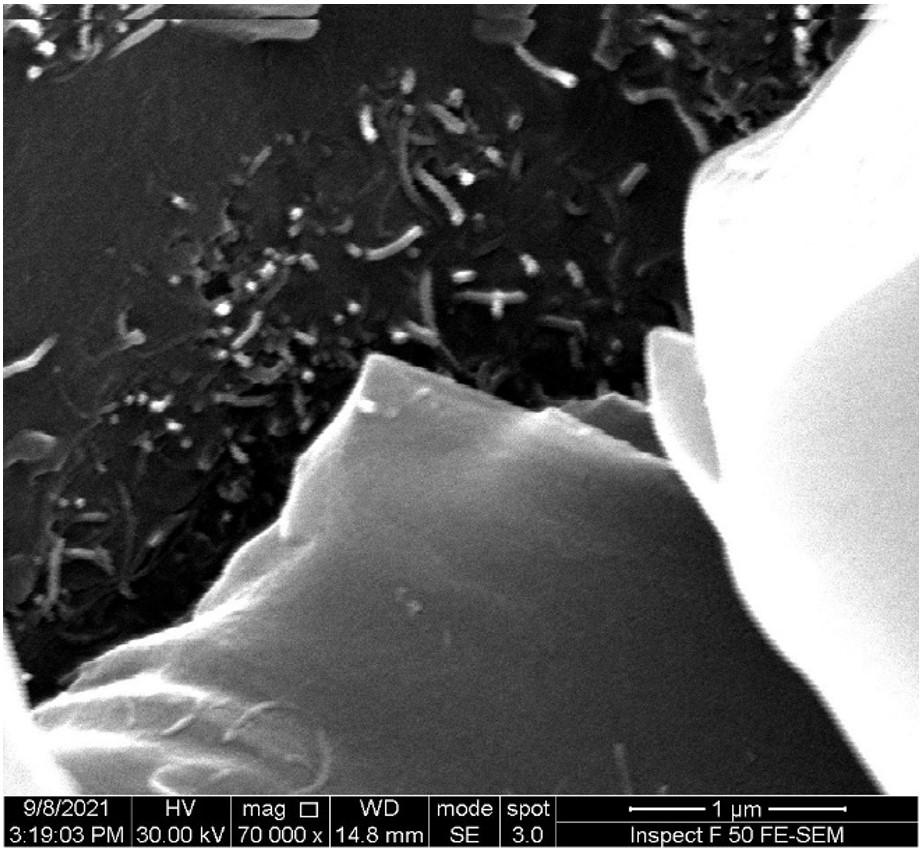
The addition of the MWCNTs to the epoxy adhesive by shear mixing does not give an improvement in the blister behaviour (Figure 9). This condition is due to the huge agglomeration and nonuniform distribution of the nanotubes, as shown Figure 10. The use of other preparation methods may solve the agglomeration problem and result in better behaviour, such as 3-roll milling as suggested by Collinson et al.[19] or ultrasonic dispersion as demonstrated by Oliveira et al.[30]
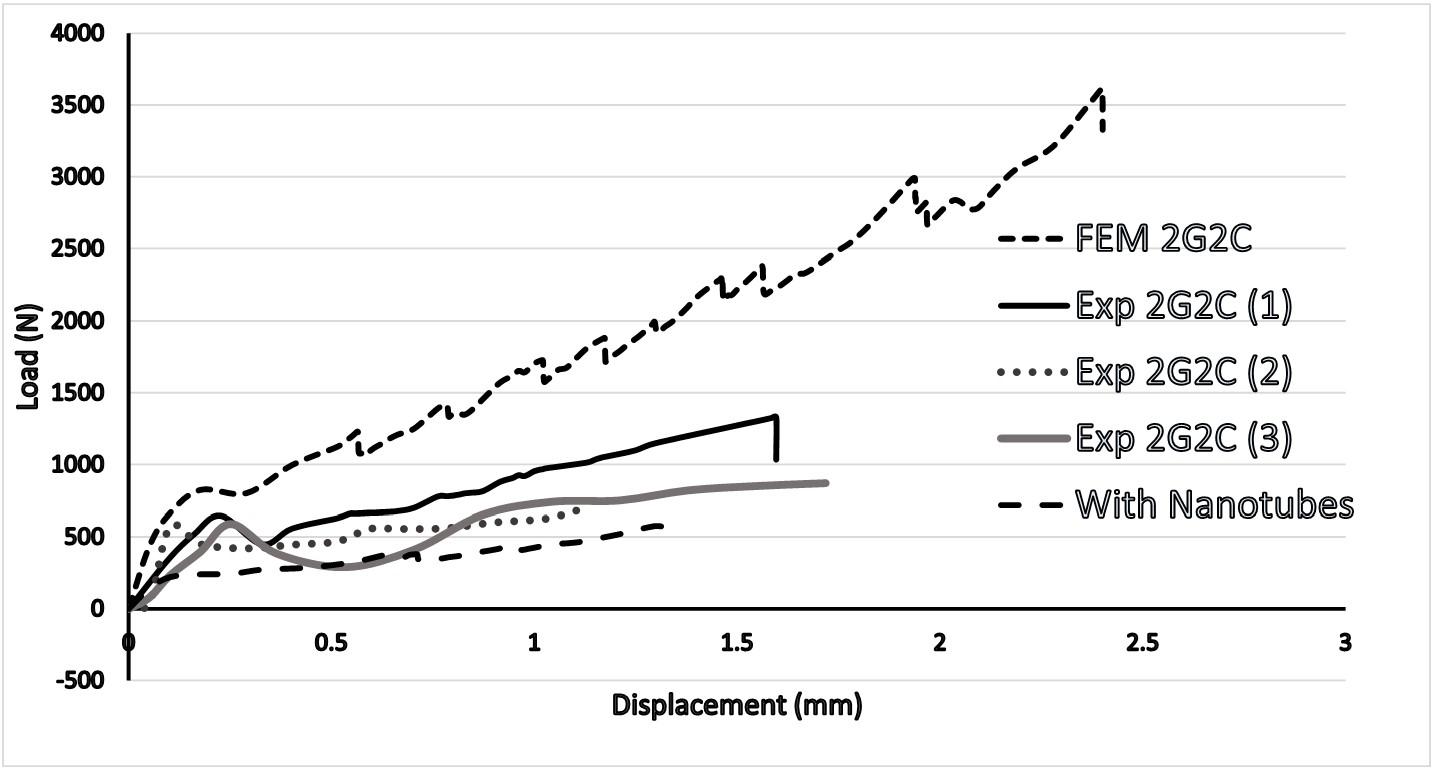
Ahmed, P. S. Polímeros, 33(1), e20230010, 2023 6/8
Figure 7. Effect of composite type on critical load (by using 4 woven layers).
Figure 8. Effect of composite type on critical load (by using 2 woven layers+2 unidirectional layers).
Figure 9. Experimental and numerical load – displacement curve of 2G2C composite repair with and without the MWCNT reinforced adhesive.
Figure 10. FE-SEM image of the MWCNT reinforced adhesive.
5. Conclusions
Hybridisation has a great effect on improving the blistering behaviour and increasing the failure pressure of the composite repair, where using two layers of woven glass and carbon fibres increases the load and improves the blistering behaviour leading to an increase in the failure pressure value compared with using either carbon or glass alone. Putting the glass in front of carbon can give a better effect than putting the carbon in front of glass.
The use of four woven layers enhanced the blistering behaviour compared with the two layers of GC where the failure pressure of 2G2C is four times higher than GC. Putting two layers of woven glass fibre in front of two woven carbon fibres is better than putting alternating layers of glass and carbon or putting the glass and carbon on the outer surfaces or in the core. The use of unidirectional fibres is not beneficial in composite repair.
The incorporation of higher stiffness fibres, such as carbon, leads to a remarkable improvement in the strength of the pipeline repair composite. Putting woven carbon fibres on the outer sides has a better effect than putting the woven glass fibres.
The addition of the MWCNTs to the epoxy adhesive by shear mixing does not give an improvement in the blister behaviour due to the huge agglomeration.
The preparation of nano-reinforced adhesive by high shear mixing is not recommended.
Predicting the composite repair behaviour under blister test by using the FEM can give a good indication about the pipeline protection.
6. References
1 Budhe, S., Banea, M. D., Barros, S., & Silva, L. F. M. (2017). An updated review of adhesively bonded joints in composite materials. International Journal of Adhesion and Adhesives, 72, 30-42 http://dx.doi.org/10.1016/j.ijadhadh.2016.10.010
2 Saeed, N. (2015). Composite overwrap repair system for pipelines - onshore and offshore application (Doctoral thesis). The University of Queensland, St. Lucia.
3 Barros, S., Fadhil, B. M., Alila, F., Diop, J., Reis, J. M. L., Casari, P., & Jacquemin, F. (2019). Using blister test to predict the failure pressure in bonded composite repaired pipes. Composite Structures, 211, 125-133 http://dx.doi.org/10.1016/j. compstruct.2018.12.030
4 Azlin, M. N. M., Sapuan, S. M., Zuhri, M. Y. M., & Zainudin, E. S. (2022). Effect of stacking sequence and fiber content on mechanical and morphological properties of woven kenaf/ polyester fiber reinforced polylactic acid (PLA) hybrid laminated composites. Journal of Materials Research and Technology, 16, 1190-1201 http://dx.doi.org/10.1016/j.jmrt.2021.12.046
5 Rajak, D. K., Pagar, D. D., Menezes, P. L., & Linul, E. (2019). Fiber-reinforced polymer composites: manufacturing, properties, and applications. Polymers, 11(10), 1667. http:// dx.doi.org/10.3390/polym11101667 PMid:31614875.
6 Safri, S. N. A., Sultan, M. T. H., Jawaid, M., & Jayakrishna, K. (2018). Impact behavior of hybrid composites for structural applications: a review. Composites. Part B, Engineering, 133, 112-121 http://dx.doi.org/10.1016/j.compositesb.2017.09.008
7 Bunsell, A. R., & Harris, B. (1974). Hybrid carbon and glass fiber composites. Composites, 5(4), 157-164 http://dx.doi. org/10.1016/0010-4361(74)90107-4.
8 Shesan, O. J., Stephen, A. C., Chioma, A. G., Neerish, R., & Rotimi, S. E. (2019). Improving the mechanical properties of natural fiber composites for structural and biomedical applications. In A. B. Pereira & F. Fernandes (Eds.), Renewable and sustainable composites (pp. 130-141). Croatia: IntechOpen http://dx.doi.org/10.5772/intechopen.85252
9. Jusoh, M. S. M., Santulli, C., Yahya, M. Y. M., Hussein, N. S., & Ahmad, H. A. I. (2016). Effect of stacking sequence on the tensile and flexural properties of glass fibre epoxy composites hybridized with basalt, flax or jute fibres. Material Science and Engineering with Advanced Research, 1(4), 19-25 http:// dx.doi.org/10.24218/msear.2015.19
10 Ikbal, M. H., Wang, Q. T., & Li, W. (2015). Effect of glass/ carbon ratios and laminate geometry on flexural properties of glass/carbon fiber hybrid composites. In 2015 International Conference on Materials Chemistry and Environmental Protection (MEEP-15) (pp. 114-118). China: Atlantis Press
11 Mishnaevsky, L. Jr, & Dai, G. (2014). Hybrid carbon/glass fiber composites: micromechanical analysis of structure–damage resistance relationships. Computational Materials Science, 81, 630-640 http://dx.doi.org/10.1016/j.commatsci.2013.08.024
12 Dannenberg, H. (1961). Measurement of adhesion by a blister method. Journal of Applied Polymer Science, 5(14), 125-134 http://dx.doi.org/10.1002/app.1961.070051401
13 Zugliani, P. A., Banea, M. D., Budhe, S., Carbas, R. J., Silva, L. F. M., Rohem, N. R. F., & Barros, S. (2019). Bonded composite repair of metallic pipeline using energy release rate method. Journal of Adhesion Science and Technology, 33(19), 21412156 http://dx.doi.org/10.1080/01694243.2019.1632537
14 Lim, K. S., Azraai, S. N. A., Yahaya, N., Noor, N. M., Zardasti, L., & Kim, J.-H. J. (2019). Behaviour of steel pipelines with composite repairs analysed using experimental and numerical approaches. Thin-walled Structures, 139, 321-333 http://dx.doi. org/10.1016/j.tws.2019.03.023
15 Kong, D., Huang, X., Xin, M., & Xian, G. (2020). Effects of defect dimensions and putty properties on the burst performances of steel pipes wrapped with CFRP composites. International Journal of Pressure Vessels and Piping, 186, 104139 http:// dx.doi.org/10.1016/j.ijpvp.2020.104139
16 Zhang, Y., Liu, Z., Xin, J., Wang, Y., Zhang, C., & Zhang, Y. (2021). The attenuation mechanism of CFRP repaired corroded marine pipelines based on experiments and FEM. Thin-Walled Structures, 169, 108469. http://dx.doi.org/10.1016/j. tws.2021.108469
17 Shamsuddoha, M., Manalo, A., Aravinthan, T., Islam, M. M., & Djukic, L. (2021). Failure analysis and design of grouted fibrecomposite repair system for corroded steel pipes. Engineering Failure Analysis, 119, 104979 http://dx.doi.org/10.1016/j. engfailanal.2020.104979
18. Tutunchi, A., Osouli-Bostanabad, K., Eskandarzadeasl, M., Kamali, R., & Chavoshian, M. (2015). Steel-epoxy composite joints bonded with nano reinforced structural acrylic adhesive In 5th International Biennial Conference on Ultrafine Grained and Nanostructured Materials - UFGNSM15 (pp. 663-676). Amsterdam: Elsevier
19 Collinson, M., Hayes, S., & Petropoulos, S. (2019). The effect of type of mechanical processing on electrical conductivity and piezoresistive response of CNT and graphite composites. In 2nd CIRP Conference on Composite Material Parts Manufacturing (CIRP-CCMPM 2019) (pp. 314-320). Amsterdam: Elsevier http://dx.doi.org/10.1016/j.procir.2019.10.001.
20 International Organization for Standardization – ISO. (2017). ISO 24817:2017: petroleum, petrochemical and natural gas
Polímeros, 33(1), e20230010, 2023 7/8
Effect of hybridisation and nano reinforcement on repairing cracked pipeline
Ahmed, P. S.
industries. Composite repairs for pipework — qualification and design, installation, testing and inspection Geneva: ISO
21. American Society of Mechanical Engineers – ASME. (2015). ASME PCC-2-2015. Repair of pressure equipment and piping with supplement New York: ASME
22 Köpple, M. F., Lauterbach, S., & Wagner, W. (2013). Composite repair of through-wall defects in pipework – analytical and numerical models with respect to ISO/TS 24817. Composite Structures , 95 , 173 - 178 http://dx.doi.org/10.1016/j. compstruct.2012.06.023
23 Caro, S., Masad, E., Bhasin, A., Little, D., & Sanchez-Silva, M. (2010). Probabilistic modeling of the effect of air voids on the mechanical performance of asphalt mixtures subjected to moisture diffusion. Electronic Journal of the Association of Asphalt Paving Technologists, 79, 221-252
24 Liravi, F., Das, S., & Zhou, C. (2014). Separation force analysis based on cohesive delamination model for bottomup stereolithography using finite element analysis. In 2014 International Solid Freeform Fabrication Symposium (pp. 1432-1451). Austin: Laboratory for Freeform Fabrication/ University of Texas at Austin
25 Xue, J., Wang, W.-X., Zhang, J.-Z., Wu, S.-J., & Li, H. (2015). Experimental and numerical study on the tensile behaviour of UACS/Al fibre metal laminate. Applied Composite Materials, 22(5), 489-505 http://dx.doi.org/10.1007/s10443-014-9419-y
26. Daggumati, S., Sharma, A., Kasera, A., & Upadhyay, N. (2020). Failure analysis of unidirectional ceramic matrix composite lamina and cross-ply laminate under fiber direction uniaxial tensile load: cohesive zone modeling and brittle fracture mechanics approach. Journal of Materials Engineering and
Performance, 29(4), 2049-2060 http://dx.doi.org/10.1007/ s11665-020-04724-x
27 Ahmed, P. S., Kamal, A. A., Abdulkadir, N. J., Fadhil, B. M., & Khoshnaw, F. M. (2022). Blister test reliability to evaluate bonding of MultiWall Carbon Nanotubes (MWCNT) on woven carbon fiber reinforced epoxy used for repairing pipelines Multidiscipline Modeling in Materials and Structures In press
28 Ahmed, P. S., Fadhil, B. M., & Mohamed, A. A. K. (2016). Effect of unidirectional and woven fibers on impact properties of epoxy. Research Journal of Applied Sciences, Engineering and Technology, 12(2), 197-205 http://dx.doi.org/10.19026/ rjaset.12.2321.
29 Sałasińska, K., Cabulis, P., Kirpluks, M., Kovalovs, A., Kozikowski, P., Barczewski, M., Celiński, M., Mizera, K., Gałecka, M., Skukis, E., Kalnins, K., Cabulis, U., & Boczkowska, A. (2022). The effect of manufacture process on mechanical properties and burning behavior of epoxy-based hybrid composites. Materials, 15(1), 301 http://dx.doi.org/10.3390/ ma15010301 PMid:35009447.
30. Oliveira, M. M., Forsberg, S., Selegård, L., & Carastan, D. J. (2021). The influence of sonication processing conditions on electrical and mechanical properties of single and hybrid epoxy nanocomposites filled with carbon nanoparticles. Polymers, 13(23), 4128 http://dx.doi.org/10.3390/polym13234128 PMid:34883631.
Received: Nov. 17, 2022
Revised: Apr. 13, 2023
Accepted: Apr. 13, 2023
2023 8/8
Polímeros, 33(1), e20230010,
Structural characterization of polymeric nanofibers of polyvinylidene fluoride (PVDF)
José Augusto Souza Gomes da Silva1 , Walace Rodrigues da Silva Júnior2 , Ana Neilde Rodrigues da Silva3 , Roseli Künzel4 , José Roberto Ribeiro Bortoleto2 , Emanuel Benedito de Melo5 , Carina Ulsen6 and Neilo Marcos Trindade7*
1Programa de Pós-graduação em Engenharia Mecânica, Instituto Federal de Educação, Ciência e Tecnologia, São Paulo, Brasil
2Programa de Pós-graduação em Ciência e Tecnologia de Materiais, Universidade Estadual Paulista
“Júlio de Mesquita Filho”, São Paulo, Brasil
3Departamento de Sistemas Eletrônicos, Faculdade de Tecnologia do Estado de São Paulo, São Paulo, Brasil
4Departamento de Física, Universidade Federal de São Paulo, São Paulo, Brasil
5Departamento de Física, Instituto Federal de Educação, Ciência e Tecnologia, Itapetininga, Brasil
6Laboratório de Caracterização Tecnológica, Escola Politécnica, Universidade de São Paulo, São Paulo, Brasil
7Instituto de Física, Universidade de São Paulo, São Paulo, Brasil *neilotrindade@usp.br
Obstract
Polyvinylidene fluoride (PVDF) is a polymer material that exhibits piezoelectricity, which is the ability of certain materials to generate an electric charge in response to applied mechanical stress. Electrospun nanofibers were prepared from a solution with 1800 mg PVDF (18 wt.%) powder dissolved in 7.5 ml of dimethylformamide (DMF) and 2.5 ml acetone. The experimental setup used in the electrostatic deposition process was developed in our laboratory. Atomic Force Microscopy (AFM) showed that the fibers vary from 100 nm to 200 nm. Scanning Electron Microscopy (SEM) measurements showed distributed and well-formed nanofibers, but with few incidences of beads. The Energy Dispersive Spectroscopy (EDX) results showed that all points of the formed nanofibers have very similar chemical compositions, based on carbon and fluorine. Raman and Fourier Transform Infrared (FTIR) Spectroscopic analysis revealed the characteristic bands related to β-phase in the sample, which is responsible for the piezoelectricity of PVDF.
Keywords: beta phase, electrospinning, nanofibers, piezoelectricity.
How to cite: Silva, J. A. S. G., Silva Júnior, W. R., Silva, A. N. R., Künzel, R., Bortoleto, J. R. R., Melo, E. B., Ulsen, C., & Trindade, N. M. (2023). Structural characterization of polymeric nano-fibers of polyvinylidene fluoride (PVDF). Polímeros: Ciência e Tecnologia, 33(1), e20230011. https://doi.org/10.1590/0104-1428.20220117
1. Introduction
Polyvinylidene fluoride (PVDF) has drawn much attention in the scientific, technological, and industrial community due to its good mechanical properties, resistance to acids, solvents, heat, radiation, and low cost[1,2]. However, other characteristics considered more relevant are the high ferroelectric, pyroelectric, piezoelectric, and dielectric response[2-5]. This polymer consists of alternating CH2 and CF2 groups along its polymer chain. In addition, the polymer can crystallize into, at least, five distinct crystalline phases, known as alpha (α), beta (β), gamma (γ), delta (δ), and epsilon (ε)[6-12]. Each phase provides unique properties to the polymer and, therefore, different applications[13,14]. The α-phase is the most common crystalline phase obtained by PVDF. This phase is non-polar and can be obtained by cooling solutions with different solvents, for example, dimethylformamide (DMF)[15]. The β-phase is the one with the highest dipole moment and highest piezoelectric response; therefore, it is
the most desirable for various applications[5]; for example, for applications in sensors and actuators, as it displays better pyro- and piezoelectric properties[4,16]. Recently, it was found that in the crystallization of PVDF from a solution in DMF, the α or β phases can be obtained, depending on the chosen crystallization temperature[17]. PVDF solution concentration is usually used within a range of 10 – 25 wt.%[2,4]. At high and low PVDF concentrations, there are no stability in β-phase formation and fewer entanglements between polymer molecular chains, respectively[2]. The PVDF nanofibers were obtained by electrospinning.
Electrospinning is one of the most versatile techniques for obtaining fibrous structures with diameters in micro and nanometer scales[4,18-20]. Electrospinning is a technique that uses electrostatic forces to produce fibrous filaments with diameters in the micrometer and nanometer scale[21-23]. This
https://doi.org/10.1590/0104-1428.20220117 O O O O O O O O O O O O O O O Polímeros, 33(1), e20230011, 2023 ISSN 1678-5169 (Online) 1/8
technique has received considerable attention due to the low cost of the materials involved, easy assembly, and handling[4]
Over the years, researchers related to the subject have shown that, due to their high surface/volume ratio and high performance, electrospun fibers could have great potential in various applications[19]. The properties of the materials used in the process can be promoted in the electrospun fibers, which can act, e.g., as chemical protective clothing[24], biomedicine[25], filtering process[26,27], sensors[4,28], electronic devices[26,29,30], etc. However, for the transfer of this technology to industry and large-scale production, it has been necessary to overcome some limitations such as (i) low fiber deposition rate, (ii) production of fibers with controlled and consistent diameters, and (iii) the obtaining fibers free of defects inherent to the control of process parameters[31]. To overcome these issues, modifications are being carried out in the process and there is a great deal of research focused on evaluating the parameters that influence the execution of the technique, whether they are related to the properties of the solution, environmental conditions of the electrospinning system or inherent to the process itself[23,32]
Within this context, this work presents the production of PVDF fibers in concentration of 18 wt.% and their physicalchemical characterization by atomic force microscopy, energy dispersive X-ray analysis, scanning electron microscopy, Raman and FTIR spectroscopy. In our laboratory, the homemade system is used to produce the nanofibers.
2. Materials and Methods
2.1 Materials
Electrospun nanofibers were prepared from a solution of PVDF powder dissolved in DMF and acetone. The polymer concentration was determined by the percentage of PVDF mass (mg) in the solvent volume (ml). The solution was prepared with 1800 mg of PVDF (18 wt.%), 2.5 ml of acetone, and 7.5 ml of DMF. For the total dissolution of the polymer, a magnetic stirrer at 900 RPM was used for 2 hours. The PVDF (Mw = 534,000 g∙mol-1) and DMF
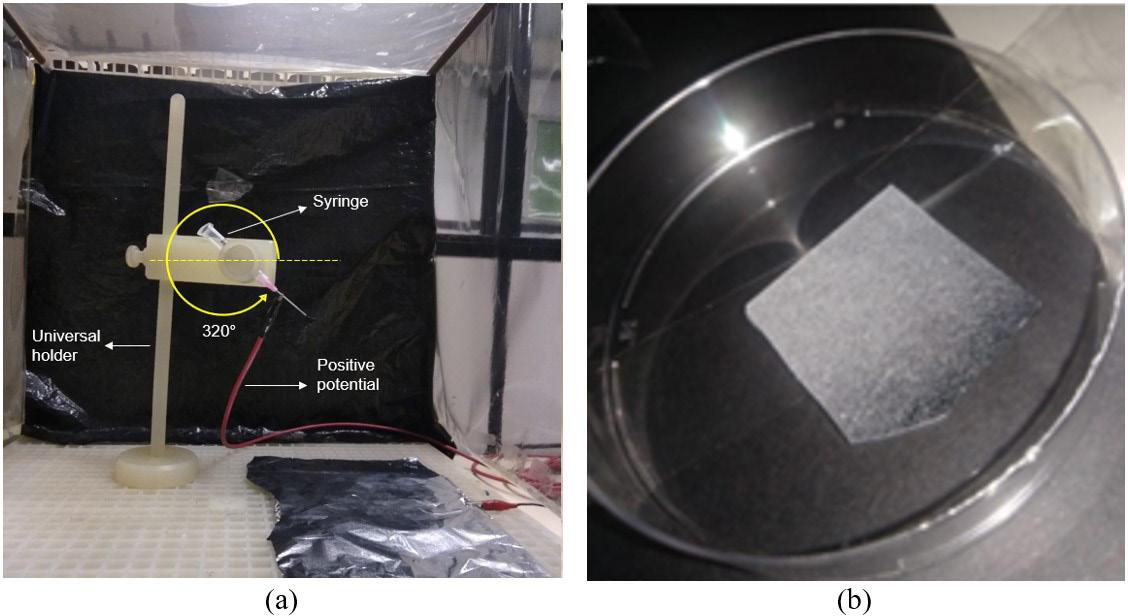
(>98%) were purchased from Sigma-Aldrich. Acetone (99.8%) was purchased from MERCK.
2.2 Experiemental setup
Figure 1a shows the experimental setup employed in the electrostatic deposition process. The process consists of three steps: (i) completely dissolving the polymer in an appropriate solvent to form a polymer solution of suitable viscosity; (ii) placing the resulting solution in a capillary; and (iii) subjecting the solution to a potential difference[33,34] With the application of high voltage DC, an electric field is created between the capillary (which contains the solution with the polymer dissolved in a suitable solvent) and the collector plate[21]. In setting up the experimental arrangement, one of the terminals of the high voltage source is connected to the syringe needle and the other is connected to the metallic base or collector. When a potential difference is applied, a polarization is created and then the solution droplets are attracted by the electric field to the collector, which contains the neutral potential of the connected high voltage source. The electric field formed contributes to the appearance of electrostatic and drag forces that act on the polymer solution[21]. The initial flow can be given by gravity, a metering pump, or by the process handler. When the applied electric field is sufficient to break the attraction forces between the molecules of the solution, the liquid is expelled in the form of a jet of fibers[19,23,35]
The system is composed of a plastic box, a high voltage DC source variable from 0 to 30 kV and 0.400 mA, machined polypropylene support with a rod used to fix syringes from 3 ml to 10 ml[36]. In this system, height can vary from 0 to 35 cm, and the angular inclination of the syringes varies from 0 to 360o. A grounded metallic plate was also used where the fiber deposition was concentrated. The distance between the tip of the 22G1 hypodermic needle (25.0×0.7 mm) and the metallic base was set at 15 cm. The hypodermic needle inclines approximately 320° relative to the horizontal, and for this procedure, the needle tip was previously cut and sanded to increase the outflow of the polymer solution. Based in previous results, the electrical potential difference
Polímeros, 33(1), e20230011, 2023 2/8
Silva, J. A. S. G., Silva Júnior, W. R., Silva, A. N. R., Künzel, R., Bortoleto, J. R. R., Melo, E. B., Ulsen, C., & Trindade, N. M.
Figure 1. (a) Homemade electrospinning system; (b) monocrystalline silicon wafer cleaved with deposited fibrous material.
Structural characterization of polymeric nano-fibers of polyvinylidene fluoride (PVDF)
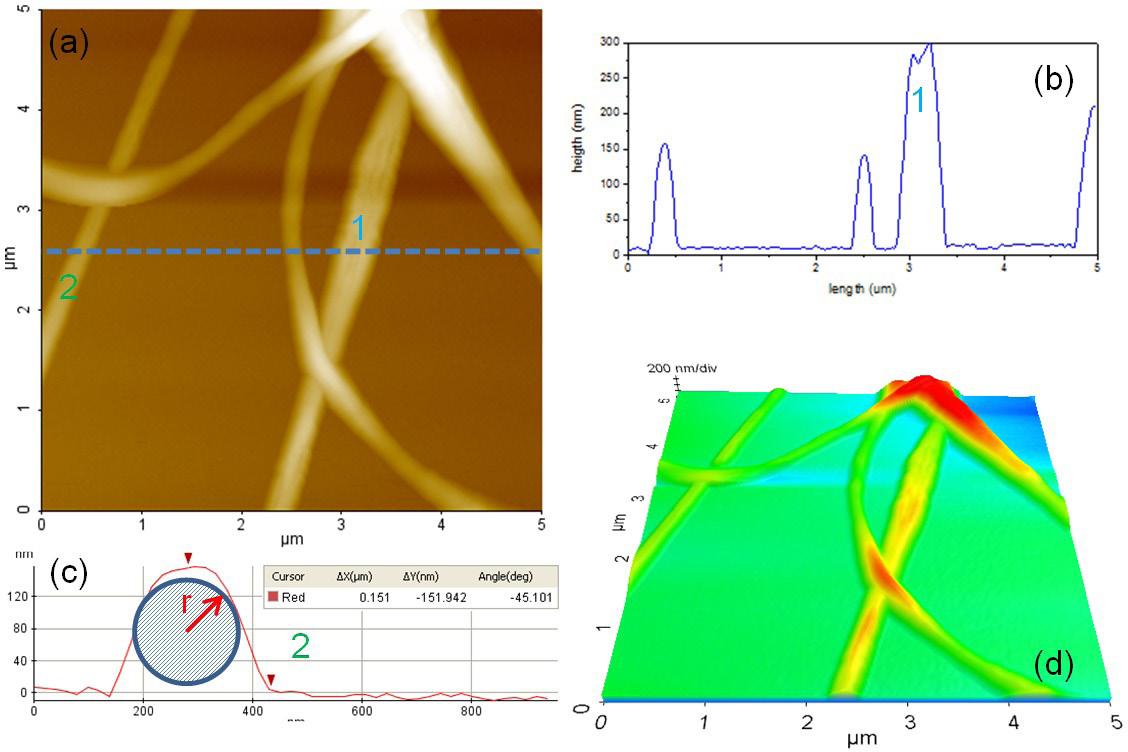
was set at 15 kV[33]. The duration of the electrospinning was 3 minutes at room temperature. The box was developed with plastic material to ensure electrical isolation and favor the electrospinning process, also avoiding, for example, air currents to interfere in the formation of field lines and consequently the direction of fibers to the sample. In addition, the plastic box offers greater safety to the operator, as it does not allow contact with the solvent that evaporates from the electrospun fibers[36]. The syringe containing the solution was adequately connected to the positive pole of the high voltage source, while the metallic collector was connected to the ground of the high voltage source. It was not necessary to use the syringe plunger, because the initial flow of the process was spontaneously established due to the gravitational action and the viscosity of the solution. The electrospun fibers were collected over the metallic collector covered by monocrystalline silicon cleaved into small squares measuring 1.5×1.5 mm as shown in Figure 1b.
2.3 Characterization techniques
Atomic force microscope (AFM) analysis was performed to identify the fibers morphology and roughness using the XE-100 Park Systems. The analysis was performed in noncontact mode using a silicon tip with a nominal radius of 5 nm over a scanning area of 8 μm2 for 2D images. The scanning electron microscope (SEM) was also employed to analyze the morphology. Energy dispersive X-ray (EDX) analysis was used to characterize the elements and their distribution. For SEM and EDX analysis, the FEI Quanta 650 FEG was used. As the electrospun fiber is a polymeric material, a thin platinum layer with approximately 10 nm was sputtered over the sample in order to increase the conductivity and allow the electron dissipation.
Raman spectroscopy was used to provide molecular information and the phase composition was investigated
using Fourier Transformed Infrared (FTIR). Raman spectra were recorded in a Renishaw microscope (InVia model) with a multichannel CCD detector and He-Ne laser (632.8 nm). The Raman spectra were recorded in the range from 100 to 3200 cm−1 with the cosmic ray removal option on. FTIR spectra were registered on a Shimadzu (IEPrestige-21) spectrophotometer. A pellet technique was used with potassium bromide (KBr) which is transparent to the radiation. The fibers were scrapped from the silicon surface added to KBr powder and pressed until a pellet is formed. The FTIR spectra were obtained with 120 scans and in the region between 400 and 1400 cm-1
3. Results and Discussions
Figure 2a shows an AFM image of 5×5 µm. It can be observed several nanofibers on Si substrate. Figure 2b shows an 1D AFM profile at the position of the dashed line. The radius of the nanofibers varies from 100 nm to 200 nm as estimated by AFM analysis. In particular, the typical radius for the electrospun nanofiber is 150 nm as shown in Figure 2c. These value are in agreement with reported previously in the literature[37,38]. In addition, it was also possible to verify that during the scan of the nanofibers , the AFM tip came across a bead and then the profile drawn in the graph did not follow the curvature expected in the projections of the other nanofibers. Therefore, the difference between the fiber radius observed in the AFM analysis confirms the influence of the solutions parameter. Finally, Figure 2d shows a 3D representation of the AFM image shown in Figure 2a
Figure 3a presents morphological images of PVDF sample on the substrate obtained from SEM. In addition, Figure 3b-3c show the detail of the surface and the interior of a bead, which is rounded structure that forms along with
Polímeros, 33(1), e20230011, 2023 3/8
Figure 2. (a) AFM image of 5×5µm containing typical nanofibers; (b) 1D AFM profile at the position of the dashed line. It is possible to notice that when the radius of the nanofibers exceeds 150 nm, can occur self-deformation; (c) 1D AFM profile of nanofiber on position 2. Nanofibers with radius up to 150 nm maintain the tubular shape; (d) 3D representation of the AFM image is shown in Figure 2a
the fiber. Figure 3a-3b illustrates that electrospun of the fibers are randomly distributed, well-formed, and with few incidences of beads. The applied voltage was sufficient to generate an electric field capable of overcoming the surface tension of the solution and distorting the droplet until the formation of fibrous material. As the fibers were not divided into droplets before reaching the collector plate, it is verified that the polymer concentrations did not negatively influence the process. The distance between the collecting tube and the syringe and the outflow of the polymer solution through the cut and sanded needle was assertive, as the fibers generated present few imperfections, which indicates adequate evaporation of the solvent until the material deposits on the silicon blade. In addition, in Figure 3b-3c, the occurrence of the beads interferes with the linearity of fibers. This could be due to distortion in the electric field during the process. When the deposition starts, the distribution of the electric field that forms between the capillary tube and the collecting base is homogeneous, but over time the nanofibers already deposited on the surface of the material behave as an insulator, distorting and directing the jet to regions still free of deposition, in this case, the edges of the silicon wafer.
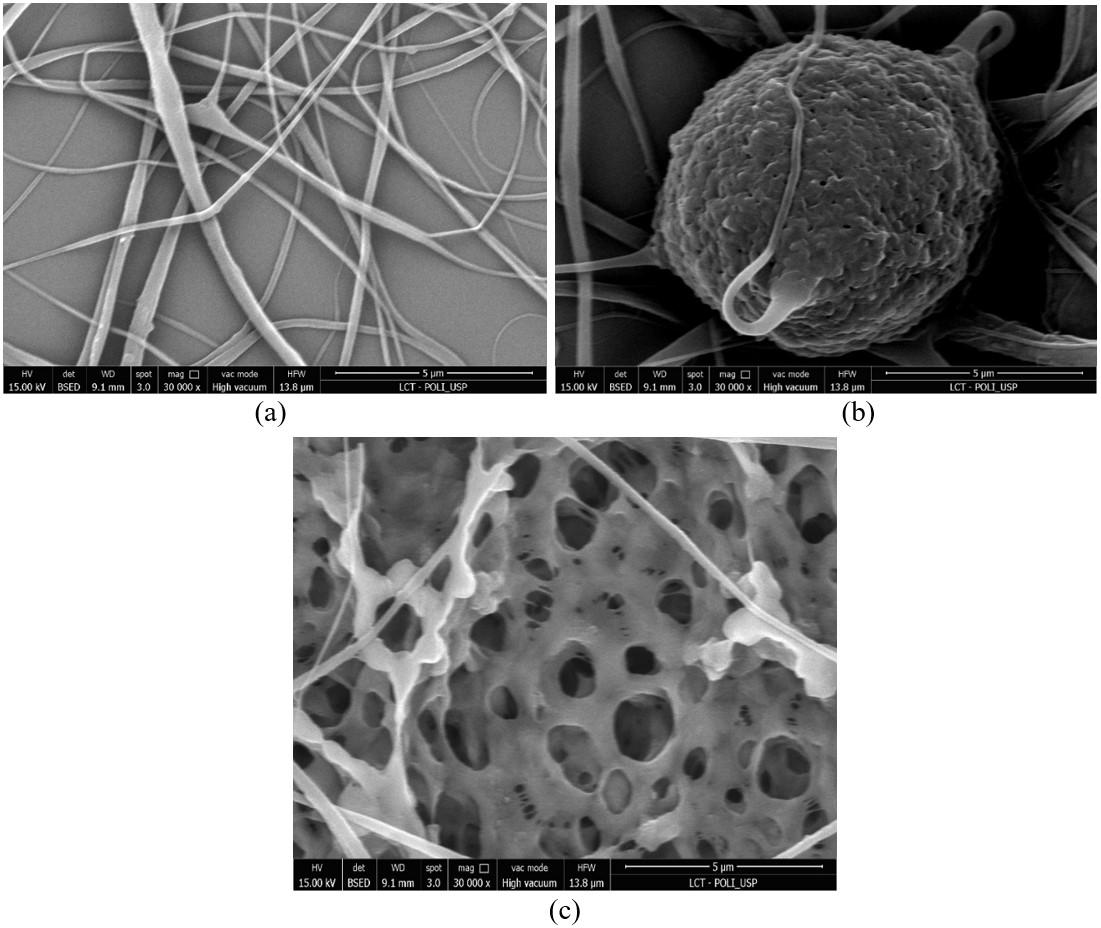
To perform the EDX analysis, six points of sample was selected and numbered (1 - 6), three in the beads (1, 2, 3) and three in the fibers (4, 5, 6), as shown in Figure 4 The EDX results showed that all points have very similar
compositions, containing carbon and fluorine, in addition to the platinum used in the coating. EDX analysis also reveals no specific or differentiated behavior regarding mapping the elemental chemical composition of beads and fibers. Overall, such imperfections in fiber linearity are related to process parameters and solution properties[39]
The Raman spectrum of the sample is shown in Figure 5. Some authors[30,40,41] have already described that the electrospinning process favors the appearance of the β-phase. With it in mind, it is possible to notice the presence of bands referring to the β-phase at 421 cm-1, 840 cm-1, and 1278 cm-1 in the spectrum[13,30,40]. The band observed at 799 cm-1 is designed as α-phase[12]. The peak at 840 cm-1 is higher in intensity than at 799 cm-1, which may indicate a predominance of β-phase if compared to the α-phase. Bands referring to CH2, which belong to the PVDF polymer chain, are also present and occur in about 1430 cm-1[12]. The intense peak centered around 522 cm-1 corresponds to scattering by optical phonons of the first order of the silicon lattice structure[37]. The spectrum measured of a silicon standard is illustrated in the inset of Figure 5 and the main peak falls around 522 cm-1. In the studied sample, the peak around 522 cm-1 arises from the monocrystalline silicon that covers the metallic collector where the nanofibers are deposited.
Figure 6 shows the registered FTIR spectra of the sample. Vibrational bands at 611 cm-1 (CF2 bending), 763 cm-1 (CF2 bending and skeletal bonding)[10,38], and
Silva, J. A. S. G.,
N. M. Polímeros, 33(1), e20230011, 2023 4/8
Silva Júnior, W. R., Silva, A. N. R., Künzel, R., Bortoleto, J. R. R., Melo, E. B., Ulsen, C., & Trindade,
Figure 3. SEM images of PVDF sample (a) deposited on the substrate; (b) surface of a bead; (c) interior of a bead.
Structural characterization of polymeric nano-fibers of polyvinylidene fluoride (PVDF)
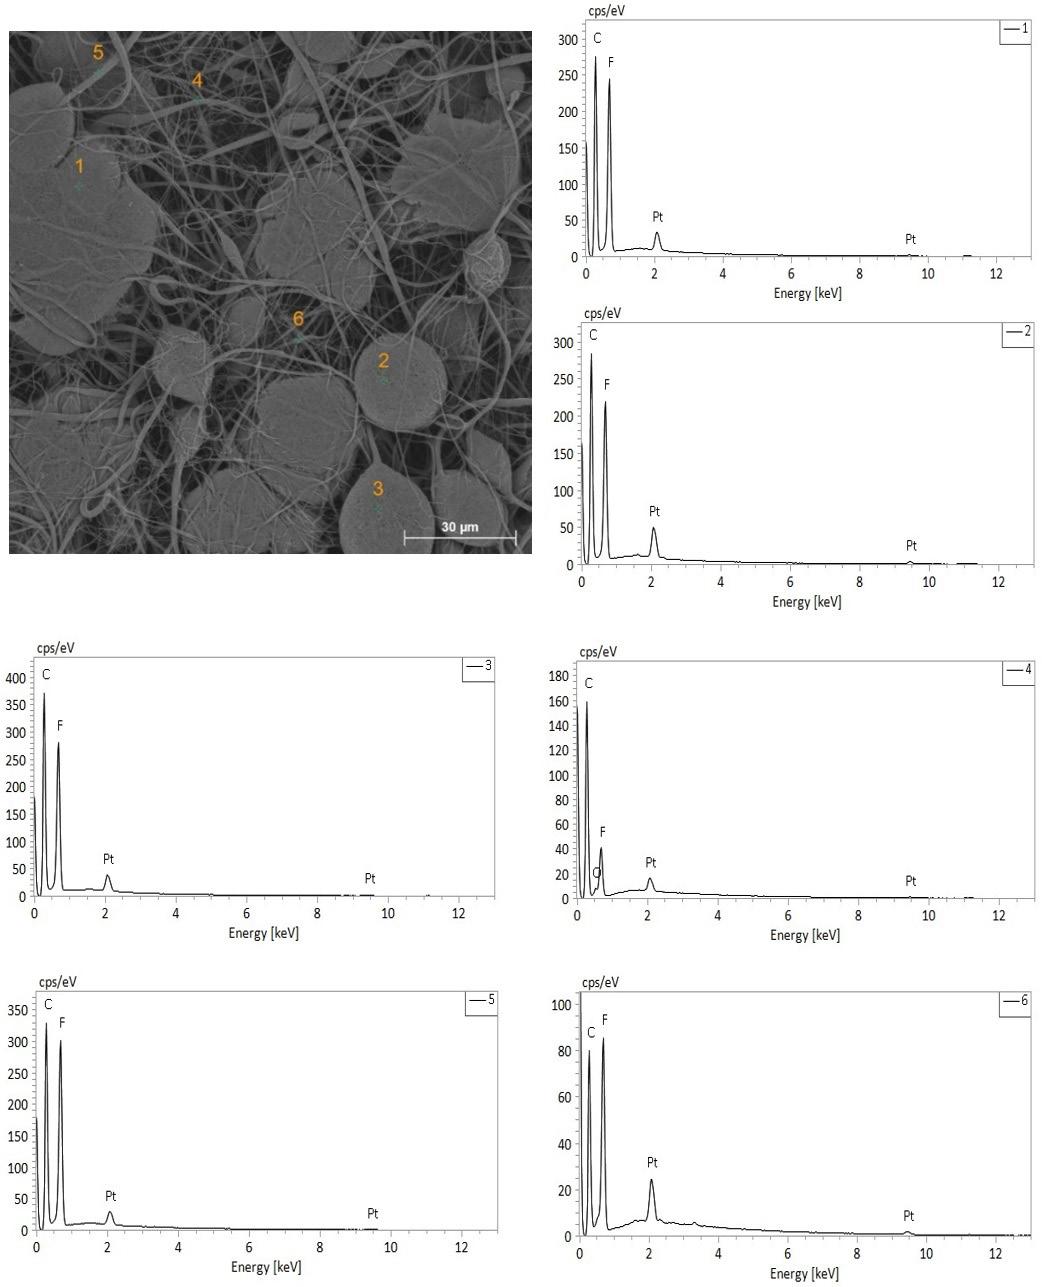
987 cm-1 were identified in the spectrum of fibers, which refer to the α-phase[13,30,40]. The characteristic bands of the β-phase, responsible for the piezoelectric properties, appear at 441 cm-1, 510 cm-1, 745 cm-1, 840 cm-1, and 1280 cm-1 When one compares the peaks at 840 and 1275 cm-1 to that at 766 cm-1, in our work (840 and 1280 cm-1 to that at
763 cm-1), it is noticeable that most of the α-phase in the raw powder was converted to β-phase[10]. The FTIR analysis confirm the formation of the β-phase and the bands designed for this phase are also intense and well-defined. According to literature[9,38,42], there is no evidence of formation of γ-phase in solution
Polímeros, 33(1), e20230011, 2023 5/8
Figure 4. Selected points in PVDF sample and EDX spectrum of the six selected points.
4. Conclusions
The solution of polyvinylidene fluoride (PVDF 18 wt.%) was explored to obtain nanofibers by electrospinning technique. For the physical-chemical characterization of these membranes; AFM, SEM, EDX, Raman, and FTIR spectroscopy techniques were used. AFM showed that the typical radius for the electrospun nanofiber was 150 nm. From SEM, sample showed few incidences of imperfections and good formation, in addition to being continuous with nanometric diameters and randomly deposited on the substrate. In addition, EDX showed the mapping that the elemental chemical composition of the beads, and the part of the fibers are similar. Raman spectroscopy and FTIR revealed information about the α, β crystalline phases, and the details of the chemical bonds in the structure of the samples. The parameters used in the shyntesis (1800 mg of PVDF, 2.5 ml of acetone, and 7.5 ml of DMF); as well as in electrospinning (applied voltage of 15 kV, distance between the needle and the grounded collector of 15 cm), were assertive for the development of nanofibrous materials for application purposes as piezoelectric material.
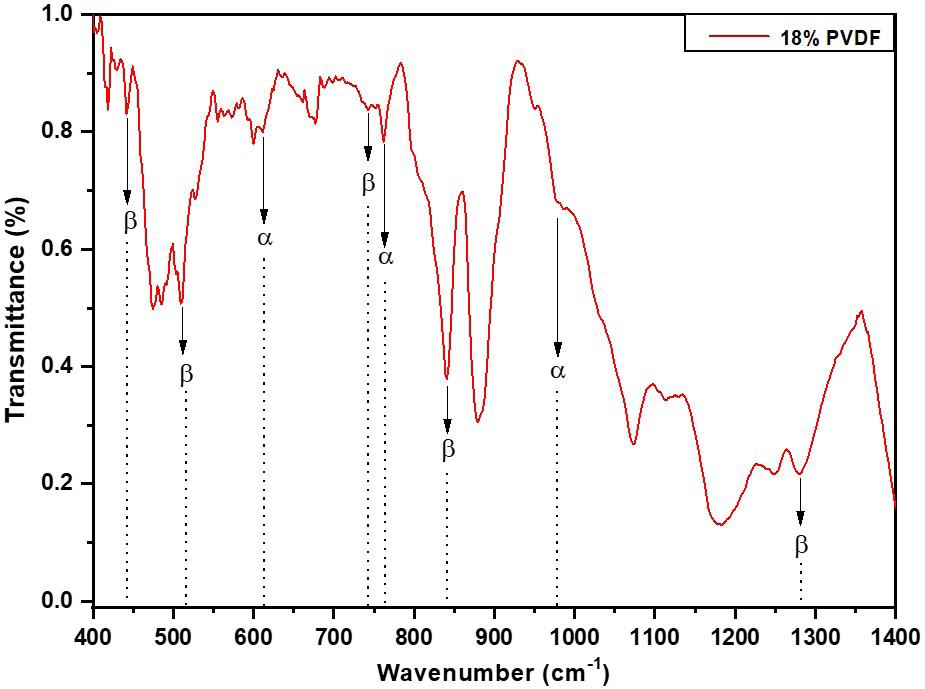
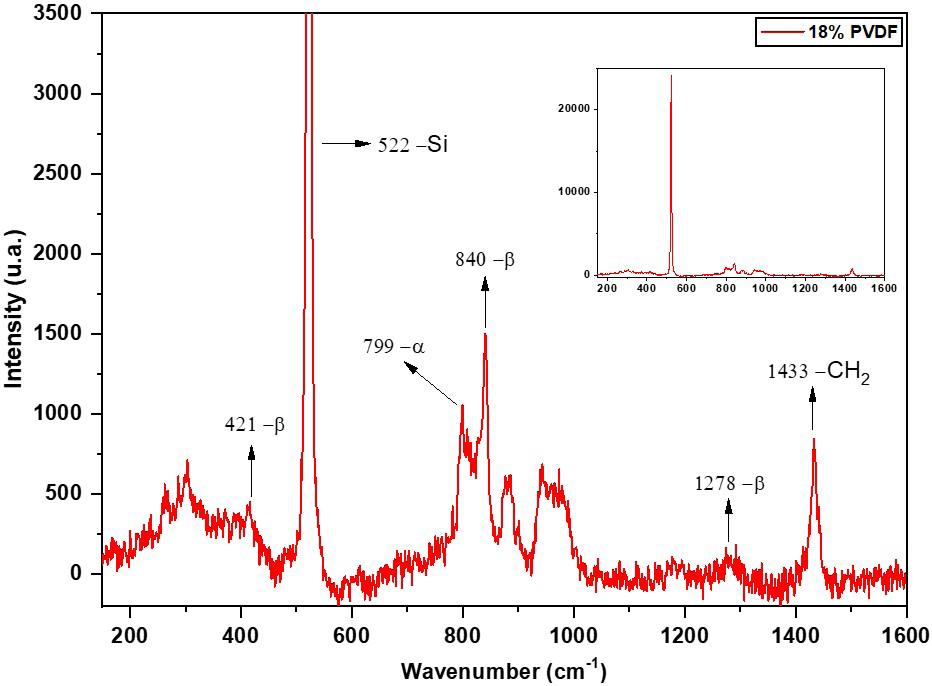
5. Author’s Contribution
• Conceptualization – José Augusto Souza Gomes da Silva; Ana Neilde Rodrigues da Silva; Neilo Marcos Trindade.
• Data curation – José Augusto Souza Gomes da Silva; Ana Neilde Rodrigues da Silva.
• Formal analysis – José Augusto Souza Gomes da Silva; Ana Neilde Rodrigues da Silva.
• Funding acquisition – Carina Ulsen; Neilo Marcos Trindade.
• Investigation – José Augusto Souza Gomes da Silva; Walace Rodrigues da Silva Júnior; Ana Neilde Rodrigues da Silva; Carina Ulsen; Roseli Künzel; José Roberto Ribeiro Bortoleto; Emanuel Benedito de Melo.
• Methodology – José Augusto Souza Gomes da Silva; Ana Neilde Rodrigues da Silva; Neilo Marcos Trindade.
• Project administration – José Augusto Souza Gomes da Silva; Ana Neilde Rodrigues da Silva; Neilo Marcos Trindade.
• Resources – Ana Neilde Rodrigues da Silva; Carina Ulsen; Neilo Marcos Trindade.
• Software – NA.
• Supervision – Ana Neilde Rodrigues da Silva; Neilo Marcos Trindade.
• Validation – José Augusto Souza Gomes da Silva.
• Visualization – José Augusto Souza Gomes da Silva.
• Writing – original draft – José Augusto Souza Gomes da Silva; Walace Rodrigues da Silva Júnior; Neilo Marcos Trindade.
• Writing – review & editing – José Augusto Souza Gomes da Silva; Walace Rodrigues da Silva Júnior; Ana Neilde Rodrigues da Silva; Carina Ulsen; Roseli Künzel; José Roberto Ribeiro Bortoleto; Neilo Marcos Trindade.
6. Acknowledgements
N. M. Trindade is grateful to Fundação de Ámparo à Pesquisa do Estado de São Paulo – FAPESP (#2019/059153) and Conselho Nacional de Desenvolvimento Científico e Tecnológico – CNPq (#409338/2021-4). W. R. S. Júnior thanks to Coordenação de Aperfeiçoamento de Pessoal de Nível Superior – CAPES. The authors are grateful to Núcleo de Instrumentação para Pesquisa e Ensino da Universidade Federal de São Paulo – NIPE-Unifesp and Faculdade de Tecnologia do Estado de São Paulo – FATEC for experimental support.
7. References
1. Martins, P., Lopes, A. C., & Lanceros-Mendez, S. (2014). Electroactive phases of poly(vinylidene fluoride): Determination, processing and applications. Progress in Polymer Science, 39(4), 683-706 http://dx.doi.org/10.1016/j.progpolymsci.2013.07.006
2 He, Z., Rault, F., Lewandowski, M., Mohsenzadeh, E., & Salaün, F. (2021). Electrospun PVDF nanofibers for piezoelectric applications: a review of the influence of electrospinning parameters on the β phase and crystallinity enhancement.
Silva, J. A. S. G., Silva Júnior, W. R., Silva, A. N. R., Künzel, R., Bortoleto, J. R. R., Melo, E. B., Ulsen, C., & Trindade, N. M. Polímeros, 33(1), e20230011, 2023 6/8
Figure 5. Raman spectrum obtained of the PVDF sample. The inset shows the spectrum measured of a silicon standard.
Figure 6. FTIR spectrum obtained from PVDF sample.
Structural characterization of polymeric nano-fibers of polyvinylidene fluoride (PVDF)
Polymers, 13(2), 174 http://dx.doi.org/10.3390/polym13020174 PMid:33418962.
3 Nalwa, H. S. (1995). Ferroelectric polymers Boca Raton: CRC Press http://dx.doi.org/10.1201/9781482295450
4 Kalimuldina, G., Turdakyn, N., Abay, I., Medeubayev, A., Nurpeissova, A., Adair, D., & Bakenov, Z. (2020). A review of piezoelectric PVDF film by electrospinning and its applications. Sensors, 20(18), 5214 http://dx.doi.org/10.3390/s20185214 PMid:32932744.
5 Ribeiro, C., Costa, C. M., Correia, D. M., Nunes-Pereira, J., Oliveira, J., Martins, P., Gonçalves, R., Cardoso, V. F., & Lanceros-Méndez, S. (2018). Electroactive poly(vinylidene fluoride)-based structures for advanced applications. Nature Protocols , 13 ( 4 ), 681 - 704 . http://dx.doi.org/10.1038/ nprot.2017.157. PMid:29543796.
6 Lin, Y., Zhang, Y., Zhang, F., Zhang, M., Li, D., Deng, G., Guan, L., & Dong, M. (2021). Studies on the electrostatic effects of stretched PVDF films and nanofibers. Nanoscale Research Letters, 16(1), 79 http://dx.doi.org/10.1186/s11671021-03536-9 PMid:33939029.
7 Pan, C.-T., Dutt, K., Yen, C.-K., Kumar, A., Kaushik, A. C., Wei, D.-Q., Kumar, A., Wen, Z.-H., Hsu, W.-H., & Shiue, Y.-L. (2022). Characterization of piezoelectric properties of Ag-NPs doped PVDF nanocomposite fibres membrane prepared by near field electrospinning. Combinatorial Chemistry & High Throughput Screening, 25(4), 720-729 http://dx.doi.org/10. 2174/1386207324666210302100728 PMid:33653246.
8 Gade, H., Bokka, S., & Chase, G. G. (2021). Polarization treatments of electrospun PVDF fiber mats. Polymer, 212, 123152 http://dx.doi.org/10.1016/j.polymer.2020.123152
9 Singh, R. K., Lye, S. W., & Miao, J. (2021). Holistic investigation of the electrospinning parameters for high percentage of β-phase in PVDF nanofibers. Polymer, 214, 123366. http:// dx.doi.org/10.1016/j.polymer.2020.123366
10 Gade, H., Nikam, S., Chase, G. G., & Reneker, D. H. (2021). Effect of electrospinning conditions on β-phase and surface charge potential of PVDF fibers. Polymer, 228, 123902 http:// dx.doi.org/10.1016/j.polymer.2021.123902
11 Dashtizad, S., Alizadeh, P., & Yourdkhani, A. (2021). Improving piezoelectric properties of PVDF fibers by compositing with BaTiO3-Ag particles prepared by sol-gel method and photochemical reaction. Journal of Alloys and Compounds, 883, 160810 http://dx.doi.org/10.1016/j.jallcom.2021.160810
12 Ma, J., Zhang, Q., Lin, K., Zhou, L., & Ni, Z. (2018). Piezoelectric and optoelectronic properties of electrospinning hybrid PVDF and ZnO nanofibers. Materials Research Express, 5(3), 035057 http://dx.doi.org/10.1088/2053-1591/aab747
13 Costa, L. M. M., Bretas, R. E. S., & Gregorio, R. Fo. (2009). Characterization of β-PVDF films prepared at different conditions. Polímeros: Ciência e Tecnologia, 19(3), 183-189. http://dx.doi.org/10.1590/S0104-14282009000300005.
14 Lederle, F., Härter, C., & Beuermann, S. (2020). Inducing β phase crystallinity of PVDF homopolymer, blends and block copolymers by anti-solvent crystallization. Journal of Fluorine Chemistry, 234, 109522 http://dx.doi.org/10.1016/j. jfluchem.2020.109522
15 Ma, W., Zhang, J., Chen, S., & Wang, X. (2008). Crystalline phase formation of poly(vinylidene fluoride) from tetrahydrofuran/N,N‐dimethylformamide mixed solutions. Journal of Macromolecular Science, Part B: Physics, 47(3), 434-449 http://dx.doi.org/10.1080/00222340801954811
16 Nunes-Pereira, J., Costa, P., & Lanceros-Mendez, S. (2018). Piezoelectric energy production. In I. Dincer (Ed.), Comprehensive energy systems (pp. 380-415). Amsterdam: Elsevier http:// dx.doi.org/10.1016/B978-0-12-809597-3.00324-2
17 Sencadas, V., Moreira, M. V., Lanceros-Méndez, S., Pouzada, A. S., & Gregório, R. Fo. (2006). α- to β transformation on PVDF films obtained by uniaxial stretch. Materials Science Forum, 514-516, 872-876 http://dx.doi.org/10.4028/www. scientific.net/MSF.514-516.872
18. Garg, K., & Bowlin, G. L. (2011). Electrospinning jets and nanofibrous structures. Biomicrofluidics, 5(1), 13403 http:// dx.doi.org/10.1063/1.3567097 PMid:21522493.
19 Huang, Z.-M., Zhang, Y.-Z., Kotaki, M., & Ramakrishna, S. (2003). A review on polymer nanofibers by electrospinning and their applications in nanocomposites. Composites Science and Technology, 63(15), 2223-2253 http://dx.doi.org/10.1016/ S0266-3538(03)00178-7
20 Zhang, R., Zhang, T., Cai, Y., Zhu, X., Han, Q., Li, Y., Liu, Y., Wang, A., & Lan, G. (2019). Synthesis and characterization of a spun membrane with modified Al 2O 3 Journal of Plastic Film & Sheeting , 35 (4), 380-400. http://dx.doi. org/10.1177/8756087919840684
21 Kumar, C. N., Prabhakar, M. N., & Song, J.-I. (2021). Synthesis of vinyl ester resin-carrying PVDF green nanofibers for selfhealing applications. Scientific Reports, 11(1), 908 http:// dx.doi.org/10.1038/s41598-020-78706-3 PMid:33441603.
22 Russo, F., Ursino, C., Avruscio, E., Desiderio, G., Perrone, A., Santoro, S., Galiano, F., & Figoli, A. (2020). Innovative Poly (Vinylidene Fluoride) (PVDF) electrospun nanofiber membrane preparation using DMSO as a low toxicity solvent. Membranes, 10(3), 36 http://dx.doi.org/10.3390/membranes10030036 PMid:32110883.
23 Costa, R. G. F., Oliveira, J. E., Paula, G. F., Picciani, P. H. S., Medeiros, E. S., Ribeiro, C., & Mattoso, L. H. C. (2012). Electrospinning of polymers in solution: part I: theoretical foundation. Polímeros: Ciência e Tecnologia, 22(2), 170-177 http://dx.doi.org/10.1590/S0104-14282012005000026
24 Gibson, P. W., Schreuder-Gibson, H. L., & Rivin, D. (1999). Electrospun fiber mats: transport properties. AIChE Journal, 45(1), 190-195 http://dx.doi.org/10.1002/aic.690450116
25 Agueda, J. R. S., Madrid, J., Mondragon, J. M., Lim, J., Tan, A., Wang, I., Duguran, N., & Bondoc, A. (2021). Synthesis and characterization of electrospun Polyvinylidene Fluoride-based (PVDF) scaffolds for renal bioengineering. In International Conference on Biomedical Engineering - ICoBE 2021 (p. 012005). Bristol: IOP Publishing
26 Mercante, L. A., Andre, R. S., Macedo, J. B., Pavinatto, A., & Correa, D. S. (2021). Electrospun nanofibers and their applications: advances in the last decade. Quimica Nova, 44(6), 717-736.
27 Alhasssan, Z. A., Burezq, Y. S., Nair, R., & Shehata, N. (2018). Polyvinylidene difluoride piezoelectric electrospun nanofibers: review in synthesis, fabrication, characterizations, and applications. Journal of Nanomaterials, 2018, 8164185 http://dx.doi.org/10.1155/2018/8164185
28 Costa, R. G. F., Oliveira, J. E., Paula, G. F., Picciani, P. H. S., Medeiros, E. S., Ribeiro, C., & Mattoso, L. H. C. (2012). Electrospinning of polymers in solution: part II: applications and perspectives. Polimeros: Ciência e Tecnologia, 22(2), 178185 http://dx.doi.org/10.1590/S0104-14282012005000018
29 Kaspar, P., Sobola, D., Částková, K., Knápek, A., Burda, D., Orudzhev, F., Dallaev, R., Tofel, P., Trčka, T., Grmela, L., & Hadaš, Z. (2020). Characterization of Polyvinylidene Fluoride (PVDF) electrospun fibers doped by carbon flakes. Polymers, 12(12), 2766 http://dx.doi.org/10.3390/polym12122766 PMid:33255198.
30 Sánchez, J. A. G., Furlan, R., López, R., Fachini, E., & Silva, A. N. R. (2014). Piezoelectric effect in nanofibers deposited with magnetic field assisted electrospinning using solutions with PVDF and Fe3O4 nanoparticles. In 29th Symposium on
Polímeros, 33(1), e20230011, 2023 7/8
Silva, J. A. S. G., Silva Júnior, W. R., Silva, A. N. R., Künzel, R., Bortoleto, J. R. R., Melo, E. B., Ulsen, C., & Trindade, N. M.
Microelectronics Technology and Devices (SBMicro 2014) (pp. 1-3). New York: IEEE
31 Persano, L., Camposeo, A., Tekmen, C., & Pisignano, D. (2013). Industrial upscaling of electrospinning and applications of polymer nanofibers: a review. Macromolecular Materials and Engineering, 298(5), 504-520 http://dx.doi.org/10.1002/ mame.201200290
32 Bhardwaj, N., & Kundu, S. C. (2010). Electrospinning: a fascinating fiber fabrication technique. Biotechnology Advances, 28(3), 325-347. http://dx.doi.org/10.1016/j.biotechadv.2010.01.004. PMid:20100560.
33 Gomes, D. S., Silva, A. N. R., Morimoto, N. I., Mendes, L. T. F., Furlan, R., & Ramos, I. (2007). Characterization of an electrospinning process using different PAN/DMF concentrations. Polímeros: Ciência e Tecnologia, 17(3), 206-211 http://dx.doi. org/10.1590/S0104-14282007000300009
34 Sengupta, D., Kottapalli, A. G. P., Chen, S. H., Miao, J. M., Kwok, C. Y., Triantafyllou, M. S., Warkiani, M. E., & Asadnia, M. (2017). Characterization of single polyvinylidene fluoride (PVDF) nanofiber for flow sensing applications. AIP Advances, 7(10), 105205 http://dx.doi.org/10.1063/1.4994968
35 Furlan, R., Rosado, J. A., & Silva, A. N. (2010). Study of formation of oriented fibers using injection of polymeric solutions inside electric fields defined by two parallel suspended electrodes. ECS Transactions, 31(1), 251-257. http://dx.doi.org/10.1149/1.3474167.
36 Lima, R. R., Shimahara, A. I., Silva, A. N. R., & Silva, M. L. P. (2014). Arranjo simples e desmontável para a produção de nanofibras. Boletim Técnico da Faculdade de Tecnologia de São Paulo, 37, 971.
37 Uchinokura, K., Sekine, T., & Matsuura, E. (1972). Raman scattering by silicon. Solid State Communications, 11(1), 4749 http://dx.doi.org/10.1016/0038-1098(72)91127-1
38 Du, X., Zhou, Z., Zhang, Z., Yao, L., Zhang, Q., & Yang, H. (2022). Porous, multi-layered piezoelectric composites based on highly oriented PZT/PVDF electrospinning fibers for high-performance piezoelectric nanogenerators. Journal of Advanced Ceramics, 11(2), 331-344 http://dx.doi.org/10.1007/ s40145-021-0537-3.
39 Fong, H., Chun, I., & Reneker, D. H. (1999). Beaded nanofibers formed during electrospinning. Polymer, 40(16), 4585-4592 http://dx.doi.org/10.1016/S0032-3861(99)00068-3.
40 Sánchez, J. A. G., Furlan, R., Valle, R. L., Valle, P., & Silva, A. N. R. (2013). Influence of a magnetic field in the electrospinning of nanofibers using solutions with PVDF, DMF, acetone and Fe3O4 nanoparticles. In 28th Symposium on Microelectronics Technology and Devices (SBMicro 2013) (pp. 1-3). New York: IEEE
41 Kim, N. K., Lin, R. J. T., Fakirov, S., Aw, K., & Bhattacharyya, D. (2014). Nanofibrillar Poly(vinylidene fluoride): preparation and functional properties. International Journal of Polymeric Materials and Polymeric Biomaterials, 63(1), 23-32 http:// dx.doi.org/10.1080/00914037.2013.769244
42 Szewczyk, P. K., Gradys, A., Kim, S. K., Persano, L., Marzec, M., Kryshtal, A., Busolo, T., Toncelli, A., Pisignano, D., Bernasik, A., Kar-Narayan, S., Sajkiewicz, P., & Stachewicz, U. (2020). Enhanced piezoelectricity of electrospun polyvinylidene fluoride fibers for energy harvesting. ACS Applied Materials & Interfaces, 12(11), 13575-13583 http://dx.doi.org/10.1021/ acsami.0c02578 PMid:32090543.
Received: Dec. 21, 2022
Revised: Mar. 29, 2023
Accepted: Apr. 13, 2023
Polímeros, 33(1), e20230011, 2023 8/8


São Paulo 994 St. São Carlos, SP, Brazil, 13560-340 Phone: +55 16 3374-3949 Email: abpol@abpol.org.br 2021 2023