
HowcanDataVisualizationhelpthePharmaceutical&Lifesciencesindustry?
Editor’s Note: Resolve all your queries about how Pharmaceutical and Lifesciences industry will profit from data visualization. Learn about use cases, applications, implementations, and dashboards for pharmaceutical industry.

Meta description: Understand top 5 ways in which Data Visualization helps Pharma and Lifesciences with sample dashboards and real-life examples. Also know the need for analytics adoption in pharma.
Humansarevisualbeings–thisissomethingwekeephearing.Butincaseyou’rewonderingifthis isreallytrue.Takealookattheinfographic belowandwhatifthedatawaspresentedlikethis Casesconfirmed:2MintheUSAandActiveCasesare1.4M.andsoon.Whatdoyouthinkwould’ve beenmoreeffective?Clearly:TheInfographic.So,let’stakeadatavisualizationjourney understandingtheneedforandimportanceof datavisualizationinpharma,themultipletypesof dashboards,andtheirapplications.
Butbeforewegointothetypesofdashboardsandvisualizations,let’stakeastepback andlookat whydatavisualizationsareneededforthepharmaindustry.Thoughyoumightbeboredofhearing this,butCOVID-19haschangedtheway peoplelookatthepharmaceuticalandlifesciences industry.Theyareexpectingrapidresponsesinvaccinedevelopment, lowercosts,andmore.For allofthesetohappenitisimportanttobringtransparencyandvisibilityintotheoperationsnot justforsalesandmarketingbutalsothesupplyandvaluechainsuchthattheoperational efficiencyoftheentireorganizationgoesup.
NeedforAnalyticsadoptioninPharmaceuticalindustry
AccordingtoMcKinsey,AdvancedanalyticscanhelppharmacompaniesimprovetheirEBITDAby 45-75%.Andthoughmanypharmacompanieshavemadesignificantinvestmentsinpeople, projects,anddata,theyareunabletounderstandthegranularitiesinthedatawitharelativevalue itpresents.AndthoughtheyarelookingtoestablishCentresofExcellence(CoE) theyareunableto moveoutofthelegacysystemsandimplementinnovationthroughouttheentireorganization.
Butifyou’rethinkingwhat theuseofsuchanalyticsadoptionwouldbe,herearesomestatsfor you:
InManufacturing&SupplyChain,Analyticscanhelpwith:
- 5-10%Procurementsavings
- 10-20%Conversioncost
- 10-15%Bettercostofquality
InCommercialsandFinance,Analyticscanhelpwith:

- 5-10%Netrevenueimprovement
- 10-20%Spendreductionandreallocation
- 5-10%Increaseinpersistency
And,thesearejustthe tipoftheiceberg,everyaspectofpharmasupplychaincanbeimproved andimpactedwithanalytics.Ifyou’reinterestedtoknowmoreabout Analyticsuse-casesfor Pharmayoucankeepscrollingaswewilltalkaboutanalytics examplesindifferentpartsofthe pharmavaluechain. Butwhyarewetalkingaboutanalyticswhenwearetalkingabout visualization?Itisbecausewegointotheinteriorsandthefaçadeof abuildingyouneedtotalka littleaboutthefoundationandtheplan.Only forabuildingwithwell-designedconstructionyou canseegreatexteriorsandinteriors.
Nowthatwe’vespokenabouttheneedofanalyticsadoptionandhowitcanhelp,let’stakealook athowaclearvisualizationforlifesciencesandpharma wouldlooklike:
Top5waysDataVisualizationhelpsPharma&Lifesciences
85%ofhealthexecutivesacknowledgethattechnologyhasbecomeaninextricablepartofthe humanexperience.EvenDataVisualizationhasbecomeanessentialtoolforrevealinginsights buriedincomplexdataeveninpharmaandalsobioinformatics.Thoughwearenotgoingdeep intothedatavisualizationforbiopharma,wecantalkabout themultiplewaysinwhichData visualizationhelpspharmaandlife sciencesintheiroperations. Inadditiontotheapplications anduseswealsotalkaboutafewKPIsthatcanbeusedbypharmaexpertsintheirdashboards. PleasenotethattheKPIslistisnot exhaustivebutjustasmallsubset.
1. Transformingcare&vaccinemanagement
InHealthcare,continuityofcareisimportantandisacriticalfocusforcompanies. Right fromanalysingthebedspacestothe improvingthepatientexperienceforhealthcare companiesandtoInventoryanddistributionmanagementofvaccinesforpharma companies,datavisualizationcanhelpincreatingdetailed dashboardsforoptimizing hospitalresourcesandmanagingthedistributionandadministrationprocesses of vaccines.
SomeoftheKPIsthatcanbeusedondashboardsabout careandvaccinemanagement are:
• Vaccinationrates:%ofpatientsbrokendownbydemographics
• Timelinessofcare:Timetakenforcarebrokendownbyserviceandproviders
• ReadmissionandInfectionrates
• Costperpatient
• ComplianceandNon-compliancerates
2. SupplyChainmanagement
Disruptionsinmanufacturing,logistics,andsupplychainmanagementhavebecomemore commonafterthepandemicandcompaniesarealwayslookingforwaystoreducethem. Butbecauseoflackofvisibilityintoinventoryandspendmanagement,andpoormaster datamanagementmakedecisionmakingandinsightsa tediousprocess. Assuch pharma giantscanreinventtheirsupplychain tokeepmonitoringtheirKPIsandshifttoautomatic reporting.
SomeoftheKPIsthatcanbeusedbysupplychainexpertsintheirdashboards:
• InventoryTurnoverratio
• OrderFulfilmentcycletime
• CostofgoodssoldandROI
• Leadtimeandon-timedelivery
• Logisticsandtransportationcostsperunit
3. InternalResourceImprovement
Pharmaconsistsofmanynodesw.r.t.boththemanufacturingandproductionprocesses whichareupdatedwithalotofsensorswhicharemonitoredinreal-time.Suchsensors andprocessorsdatacanbeanalyzedatregularintervalstoidentifymajorsourcesoflossor safetyissuesforarootcauseanalysis.Byanalysingthedowntimeandsafetyflagsat multipleproductionlevelsandfacilitiestofindandeliminateanyrecurring issues.
SomeoftheKPIsthatcanbeusedformeasuringimprovedresourceallotmentare:
• RecallRates
• EventReporting
• Safetyspendsandliabilityclaims
• Complianceandnon-compliancerates
• %ofRootCauseAnalysisincidents
4. Improvedclinicaltrials
80%ofUSClinicaltrialsfailtomeetpatientenrolmentdeadlines. Witheffectivedata visualization,youcankeepatrackofcriticalpointsofstudyand progressofthedata.With dashboardsyoucan,seereal-timeinsightsonthetrial’sprogress,summarizeresults instantlywithkeyKPIsyouaretrackingforthetrail, trackpotentialrisks,anditerate reportsbasedonnewupdateddatawithouttheneedtocreatethesamefromscratch.
SomeoftheKPIsthatcanbeusedin thesedashboardsare:
• Enrolmentrates
• Dataquality
• Protocoldeviances
• Regulatorycompliance
• Timetocompletion
5. FinancialImpactanalysis
Financialimpactofscenarioscanbelinkedwithadvancedanalyticsmetricsto visualizationapplicationslikePowerBI,Qlik,Tableau,etc.toshowcasemetricswhichcan’t betraditionallyshowedinvisualizations Youcandrilldownyourdatatogranularlevels to identifynewsourcesofrevenueandperformcost-impactanalysiswithcompelling dashboards.

SomeoftheKPIsthatcanbeusedinthemeasurementoffinancial impactinfinancial dashboardsare:
• Research&Developmentspend
• COGS&Cashflow
• GrossandNetprofitmargins
• Operatingexpenseratio
• ReturnonAssets
Thoughthesearejust afewofthetopicswherein analyticscanhelppharmaceuticalindustry,in realityonceimplementedalloftheseinsightscanhelpexecutives makedecisionsfaster.Insome companies,implementationofdatavisualizationcanhelpthemreducetheir reportingtimefrom daysandhourstominutesandsecondsreducingthetimelagindecisionmaking. Butstill companiesfaceissueswiththeimplementation:39%ofhealthcaremanufacturersstruggletoscale updigitalinitiativesbeyondthepilotphase and49%havecomplicationsintegratingtheirlegacy systemsaccordingtoresearchbyTableau.Itshowsthattheyare strugglingwithinternaladoption andchangemanagementforvisualizationimplementationwhichwecanhelpwith.
Ifyou’reinterestedtoknowmore,youcancheckoutourblogwith8wayshowpharmacompanies canensuresuccesswithanalytics.
SampleDashboards
WorkforceAnalytics
OEE-OverallEquipmentEfficiencyforMachinery
HospitalDataAnalysis
Incaseyouwanttolookatothervisualizationsforotherfunctionsandindustries,youcantakea lookatoursolutiontemplate.
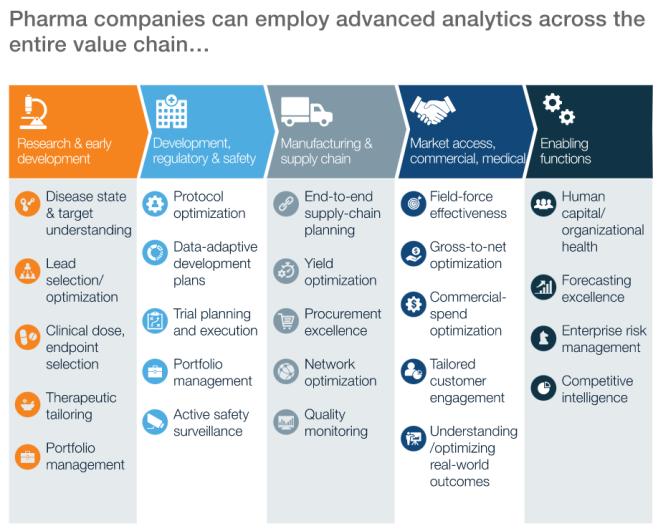
ApplicationsofAnalyticsinPharma
Thoughwe’vecoveredtheapplicationsofpharmainvisualizationabove,itisnottheendofthe list.Therearemoreandmoreusecasesbeingcreatedforpharmainbothanalyticsand visualizationevery day.Forexample,youcanlookattheinfographicbelow:
AnalyticscanhelpwithallthefunctionsacrosssupplychainwithResearch&Development, Manufacturing,SupplyChain,Commercials,Finance,Functionalenablement,andmore.
TypesofDataVisualizationdashboards

Nowthatwe’vestudiedthewhyandthehow,let’stalkaboutthewhatalso.Bynowyoumusthave understoodtheneedforandimportanceof analyticsandvisualizationinpharmaceuticalandlife sciencesindustry.So,let’slookatthemultiplewaysinwhich youcanmakeandleveragethe dashboards:

1. OperationalDashboards:Thesedashboardsareforimprovingvisibilityintothe operationsonaday-to-daybasis,thereforusefulforshortterm.Thesedashboardsare mostlyusedatmanagerialleveltoanalysetheoperations.
2. AnalyticalDashboards:Asthenamesuggeststhesedashboardsareusedtopresentthe analysisofthedatacaptured.Thesearegenerallyusedbytheexecutivelevelemployees anddataanalysts.
3. StrategicDashboards:Strategicdashboardscoverthehigh-levelKPIsandupdatesofthe dataandareusefulfordecision-makingandgoalsettinginthelongterm.Theseare normallyforC-suiteexecutives.

Eventhoughthesearethebroadtermsandtheiruses,thereisnohardandfastruleastowho shouldusewhat,itultimatelydependsontheindustry,organization,andthelevelsofhierarchy. Youcanalsoaddotherkindsofdashboardslikeatacticaldashboard,whichisusefultotrack performance.
Here’saninfographicsummarizingwhatthedashboardsstandforandhow youcanleverage themforyourorganization.
Reference:DataVisualizationinCPG
InConclusion:Transformyour PharmadatawithDataVisualization
Peoplelikeseeingthingsratherthanreadinglengthy paragraphsandtables.Makeyourdata interestingwithcharts,graphs,bars,andmore.Giveyourdatathespacetobreatheandhelpyour executivesworkonyourdatarightfromproduction&clinicaltrialstoinventorymanagementand supplychainmanagement.Ifyou’reinterestedinPharmaAnalyticsandVisualization,wecanhelp youwithit!
P.S.Ifyou’reinterestedinknowingmoreaboutdesigningdashboardsyoucanrefertoourblog withbestpracticesforPowerBIVisualizations