Poindexter Village Market Study and Operating Plan Options
Prepared by: ConsultEcon, Inc.
In Association with: Renter Mentor
Prepared for: Ohio History Connection
National Afro-American Museum and Cultural Center
February 2023
ConsultEcon, Inc. Management & Economic Insight February 14, 2023
ConsultEcon, Inc. Management & Economic Insight February 14, 2023 Poindexter Village i TABLE OF CONTENTS Section Page TABLE OF CONTENTS i LIST OF TABLES ii LIST OF FIGURES iv EXECUTIVE SUMMARY 1 Section I INTRODUCTION AND ASSUMPTIONS I-1 Section II PROJECT DESCRIPTION AND SITE REVIEW II-1 Section III RESIDENT MARKET CONTEXT III-1 Section IV TOURIST MARKET IV-1 Section V LOCAL ATTRACTIONS AND COMPETITIVE CONTEXT V-1 Section VI PRECEDENTS AND CASE STUDIES VI-1 Section VII ALTERNATIVE DEVELOPMENT SCENARIOS VII-1 Section VIII ATTENDANCE AND OPERATING POTENTIAL VIII-1 Appendix A ACTIVE AFRICAN AMERICAN MUSEUMS A-1
ConsultEcon, Inc. Management & Economic Insight February 14, 2023 Poindexter Village ii
Table Page Table 1 Summary of Costs in a Stable Year of Operations in Current Dollars Alternative Development Scenarios Poindexter Village 7 Table III-1 Drive Time and Population Relative to Other Ohio Metro Areas, 2022 Poindexter Village III-3 Table III -2 Population Trend in the Resident Market Area, 2020, 2022, 2027 Poindexter Village III-6 Table III-3 Median Age and Percent of Population by Age Group in the Resident Market Area, 2012 Poindexter Village III-7 Table III-4 Estimated Number of School Age Children in Resident Market Area, 2022 & 2027 Poindexter Village III-8 Table III-5 Resident Market Household Profile, 2022 Poindexter Village III-9 Table III-6 Percent of Resident Market Area Households by Income Group, 2022 Poindexter Village III-10 Table III-7 Resident Market Area Educational Attainment, 2022 Poindexter Village III-11 Table III-8 Resident Market Race and Ethnicity, 2022 and Projected 2027 Poindexter Village III-12 Table V-1 Characteristics of Selected Visitor Attractions in Columbus, OH V-2 Table VII-1 Programs of Spaces Alternative Development Scenarios Poindexter Village VII-2 Table VII-2 Illustrative and Conceptual Construction Cost Estimates Alternative Development Scenarios Poindexter Village VII-3 Table VIII-1 Visitation Assumptions by Type in a Stable Year of Operations Alternative Development Scenarios Poindexter Village VIII-3
LIST OF TABLES
ConsultEcon, Inc. Management & Economic Insight February 14, 2023 Poindexter Village iii
OF
Table Page Table VIII-2 Summary Annual Visitation by Type in a Stable Year of Operations Alternative Development Scenarios Poindexter Village VIII-4
VIII-3 Selected Pro Forma Operating Assumptions in a Stable Year of Operation Alternative Development Scenarios Poindexter Village VIII-5
VIII-4 Per Capita Earned Revenue Assumptions in a Stable Year of Operations in Current Dollars Alternative Development Scenarios Poindexter Village VIII-6 Table VIII-5 Illustrative Staffing Profile and Personnel Cost Assumptions in Current Dollars Alternative Development Scenarios Poindexter Village VIII-7 Table VIII-6 Estimated Operating Expenses in a Stable Year of Operations in Current Dollars Alternative Development Scenarios Poindexter Village VIII-8
LIST
TABLES (continued)
Table
Table
VIII-7 Summary of Revenue and
Stable Year of Operations in Current Dollars Baseline and Alternative Development Scenarios Poindexter Village VIII-9
VIII-8 Summ ary of Costs in a Stable Year of Operations in Current Dollars Alternative Development Scenarios Poindexter Village VIII-10 Table A-1 List of Active African American Museums 1
Table
Expenses in a
Table
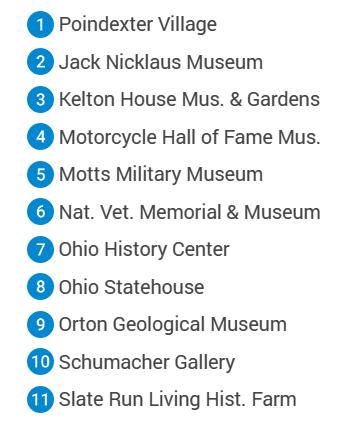
ConsultEcon, Inc. Management & Economic Insight February 14, 2023 Poindexter Village iv LIST OF FIGURES Figure Page Figure II-1 Map of Central Ohio Including Columbus and the Highway Network II-2 Figure II-2 Columbus Area Map with Poindexter Village Location II-4 Figure II-3 Aerial Photograph of the Poindexter Village Site II-5 Figure III -1 Map of Ohio with Locations of Ohio Metropolitan Areas III-2 Figure III-2 Map of Resident Market Area Drive Times Poindexter Village III-4 Figure III-3 Map of Resident Market Area Walk Times Poindexter Village III-5 Figure IV-1 Overnight Visitors’ Race and Ethnicity Compared to the United States Columbus, Ohio IV-4 Figure IV-2 Daytime Visitors’ Race and Ethnicity Compared to the United States Columbus, Ohio IV-5 Figure IV-3 Importance of African American Culture in Destination Choice IV-6 Figure V-1 Map of Selected Visitor Attractions V-5 Figure VI-1 African American Museum of Iowa Renovated Exterior Drawing VI-5 Figure VI-2 Albany Civil Rights Institute, Interior View VI-6 Figure VI-3 Banneker-Douglass Museum Interior VI-7 Figure VI-4 Evansville African American Museum Exterior VI-8 Figure VI-5 Harriet Beecher Stowe House Museum Exterior VI-9 Figure VI-6 Ohio History Center Exterior VI-10 Figure VI-7 The Lower East Side Tenement Museum Exterior VI-11 Figure VI-8 National Afro American Museum and Cultural Center Museum Exterior VI-12 Figure VI-9 The National Building Museum Exterior VI-13
ConsultEcon, Inc. Management & Economic Insight February 14, 2023 Poindexter Village v
OF FIGURES Figure Page Figure VI-10 The Northwest African American Museum Exterior VI-14 Figure VI-11 Project Row Houses Exterior VI-15 Figure VI-12 Project Row Houses Community Engagement VI-15 Figure VI-13 Rebuild Foundation/Theaster Gates Exterior VI-16 Figure VI-14 Riley House Museum of African American History & Culture Exterior VI-17 Figure VI-15 Smokey Hollow Commemoration VI-18 Figure VI-16 Smokey Hollow Commemoration Sideview VI-18 Figure VI-17 Wing Luke Museum Exterior VI-19 Figure VI-18 Zora Neale Hurston National Museum of Fine Arts Gallery VI-20
LIST
EXECUTIVE SUMMARY
ConsultEcon, Inc. was retained by the Ohio History Connection as part of a multi-disciplinary team with Renter Mentor to prepare a market study and evaluation of alternative development scenarios for the proposed Poindexter Village.
Organizational Overview
The Ohio History Connection (OHC) is a statewide history organization with the mission to spark discovery of Ohio’s stories. As a 501(c)(3) nonprofit organization originally chartered in 1885, OHC is focused on preserving and sharing Ohio’s history and heritage. This includes housing the state historic preservation office, the official state archives, local history office and managing more than 50 sites and museums across Ohio, including a flagship state history museum campus in the state capitol Columbus.
Poindexter Village: Past, Present and Future
Poindexter Village is an historic site and a future museum and cultural learning center managed by the Ohio History Connection through the National Afro-American Museum and Cultural Center with its main museum in Wilberforce, OH Poindexter Village’s mission and vision are to build on the rich, untold story of the African American experience in its neighborhood and beyond in order to nurture understanding, inspire success, inform action, and empower future generations to build the strong, vibrant, and just communities.
Poindexter Village was named after Rev. James Poindexter, a community leader in Columbus, Ohio. The village was dedicated by President Franklin D. Roosevelt on October 12, 1940 as one of the country’s first public housing projects. The Poindexter Village is a community that represents an important facet of the history of public housing in the United States and demonstrates the state of Ohio’s place in the national story of the Great Migration.
The Ohio History Connection is preserving Poindexter Village because it aligns with its mission to tell Ohio stories to shape the future. The vision of the project is to tell the story of Poindexter Village related to its residents and the larger story of public housing and the Great Migration in the United States. The story of Poindexter Village is a story and a place worth preserving and sharing with others.
Poindexter Village Buildings and Campus
Poindexter Village campus includes 1.42 acres, with vehicular circulation and parking areas, and a pedestrian alley that bisect two apartment buildings which include approximately 12,000 square feet of interior space. These are apartment building 1 on 290 N. Champion Avenue and apartment building 2 on 1297 Granville Street. Poindexter Village campus is adjacent to Union Grove Baptist Church, a potential partner for Poindexter Village with whom
ConsultEcon, Inc. Management & Economic Insight February 14, 2023 Poindexter Village 1
they share an alley. The alley and sidewalks allow for site pedestrian circulation and places for programs, events, and interpretive experiences.
Regional Context
The location for the Poindexter Village campus is east of the Columbus’ downtown and cultural district on the other side the interchange of I-71. It is in the Historic Bronzeville or Near East Side neighborhood.
In 2022, the Columbus metro area was estimated to contain 2.2 million residents, which is approximately 19 percent of the State’s total population of 11.8 million. The museum will bolster public awareness of the neighborhood it celebrates Poindexter Village’s visibility can be enhanced through additional signage, especially positioned next to the highway to increase Poindexter Village’s public awareness and to communicate its brand.
Resident Markets
The Resident Market Area for Poindexter Village is defined as the area within a 60-minute drive time from the site Within the Resident Market Area, the markets are further broken out into the Primary Market Area (the area within a 15-minute drive), the Secondary Market Area (15 to 30-minute drive), and the Tertiary Market Area (30 to 60-minute drive). This Resident Market Area had the following characteristics in 2022:
♦ The total Resident Market Area population is estimated at 2.5 million in 2022. This market area population is projected to grow by 2.2 percent by the year 2027.
♦ The median age in the Resident Market Area is estimated at 37.8 years – slightly younger than the State and the Country as a whole but older than the city of Columbus. The population is split between those under and over 35 years old, which is similar to the city of Columbus, the state, and the country as a whole. The Primary Market Area is comparatively younger than the other parts of the Resident Market Area with a median age of 33.6.
♦ There were an estimated 616,800 children between the ages of 0 and 17 in the Total Resident Market Area in 2022, a number that is projected to decrease by 8.4 percent by the year 2027 This is a significant decrease compared to the state of Ohio at -0.8 percent and the United States that has neither a growth nor decline rate.
♦ Most of the resident market area has at least a high school education. Approximately 37.6 percent of the total resident market area has a bachelor’s degree or a graduate degree.
♦ The Resident Market area has approximately 14.6 percent of its population who identify as African American –and the Primary Market has the greatest share of African American residents, with 31.5 percent. The City of Columbus and Franklin County have relatively high concentrations of African American populations – at 28.3 and 22.8 percent, respectively. The Columbus Metropolitan Statistical Area, the
ConsultEcon, Inc. Management & Economic Insight February 14, 2023 Poindexter Village 2
state of Ohio, and the United States had lower proportions of residents who identified as African American at 15.8, 12.6, and 12.4 percent respectively.
♦ There are an estimated 607,000 households in the Resident Market Area, of which 61.2 percent are identified as family households. Within the Resident Market Area, the Primary Market Area has the lowest proportion of family households to total households and an average household size of 2.27.
♦ The median household income in the Resident Market Area is $70,500, which is slightly more than Franklin County, the City of Columbus, and the state, but slightly less than the city’s metropolitan statistical area and the U.S. In the Resident Market Area, 25.2 percent of households earn $100,000 or more per year, which is a smaller proportion than Franklin County, the City of Columbus, Columbus’ metropolitan statistical area, the state, and the country as a whole.
♦ The area with the lowest income levels is the Primary Market Area, where the median household income was $54,327. In the Primary Market Area, 45.4 percent of households earn less than $50,000, and another 18.9 percent earn between $50,000 and $74,999, for a total of 64.3 percent of households earning less than $74,999, compared to 57.6 percent of households in the state as a whole and 51.3 percent of households in the United States.
Tourist Markets
Tourists will make up an important segment of visitors to Poindexter Village. Columbus has a robust tourism market that was growing in 2019 and is rebounding after the pandemic. In 2019, Columbus had 43 million day and overnight visitors, which was an increase of 2.7 percent or 1.1 million visitors from 2018. The most recent data from 2021 shows a decrease in visitor volume due to the COVID-19 pandemic. However, more recent hotel data indicate that Columbus tourism continues to recover. In 2022, hotel occupancy was 58.6 percent, which is a 13.1 percent increase from 2021 Bed tax collections from 2022 totaled more than $48.6 million, which is up 45 percent from 2021.
Overnight Visitor Volume
In 2019, overnight visits grew by 300,000 to 9.9 million a 3 percent increase over 2018 in 2021, there were 8.6 million overnight visitors. The number of overnight visits decreased 13.0 percent or 1.3 million. While Columbus is having fewer overnight visitors, overnight trips are being extended. The average length of stay has also increased slightly from 2.4 nights in 2019 to 2.5 nights in in 2021
Overnight Trip Characteristics
In 2021, the main purpose for travelers to plan an overnight trip to Columbus was to visit friends and relatives at 53.0 percent followed by leisure visits like concerts or sporting events at 37.0 percent. Business-leisure trips and business trips like attending a convention were the
ConsultEcon, Inc. Management & Economic Insight February 14, 2023 Poindexter Village 3
least common trip purposes at 5.0 percent each respectively. Building a base of resident visitation will draw visiting friends and relatives to Poindexter Village. The top five activities that visitors experienced in Columbus were shopping, attending a celebration, sightseeing, the zoo, and a bar or nightclub.
African American Overnight Visitors
Poindexter Village will appeal to African American travelers to Columbus, a key visitor segment. Columbus overnight visitors were slightly less diverse than the U.S. travelers overall, with 84 percent white visitors and 12 percent African American visitors compared to the country’s typical overnight visitor composition of 78 percent white and 15 percent African American Based on the overnight visitor volume and the percent of tourists that are African American Columbus drew over 1 million visitors in 2021.
African American Day Visitors
Unlike overnight trips, day trip visits grew by 2.7 percent or 900,000 between 2019 and 2021
In 2021, there were 34.1 million day-trip visitors to the city. Columbus’ day visitors were 10 percent African Americans compared to the country’s typical day-trippers that were 14 percent African American. Based on these data, there are an estimated 3.4 million African American day trip visitors to the area
Trends in African American Tourism
According to Mandala Research, African American travelers in the United States spent $63 billion dollars in 2018. 1 Seventeen percent of African Americans take one or more international trips and also travel locally more than six times per year. The study in 2018 concluded that food-related activities were popular after African American travelers arrived at their destination. Nearly half of the travelers ate local or regional cuisine. African American tourists were interested in local arts and culture and activities related to African American topics (12%), family reunion travelers (22%). In addition, business travelers were more entertainment oriented and enjoyed local food and activities (36%).
Interest in African American Cultural Attractions
American tourists as a whole are interested in African American cultural attractions regardless of their race or ethnicity. According to Mandala Research 2, more than a third of all U.S. travelers (36%) say that “the availability of African American cultural, historic sites and attractions” is either “very important” (19%) or “somewhat important” (17%) in their choice of leisure destination. Further, learning more about the African American experience was a strong motivator for approximately a quarter (23%) of United States travelers to take a trip. African Americans (39%) and Millennials (28%) in particular are much more likely consider it “ very important” to their choice of destination.
1 Black Travelers Research 2018, Virginia Tourism Corporation.
2 2020 Report Market for Gullah Geechee Heritage Tourism, Gullah Geechee Cultural Heritage Corridor.
ConsultEcon, Inc. Management & Economic Insight February 14, 2023 Poindexter Village 4
Local Attractions
The major attractions in Columbus include the Columbus Zoo and Aquarium, COSI (the Center of Science and Industry), Franklin Park Conservatory and Botanical Garden, the Wexner Center for the Arts at The Ohio State University, and the Columbus Museum of Art. These attractions range in attendance from 2.3 million at the Zoo to about 200,000 at the Museum of Art. Smaller attractions in Columbus generally have lower attendance of 40,000 or below. These attractions include historic attractions and houses, such as the Thurber House, and special interest museums including the Motorcycle Hall of Fame. Ticket prices for adults typically range between $7.00 (at the Kelton House Museum & Gardens) and $25.00 (at the Zoo and COSI), though there are several free attractions, and discounts are sometimes offered for local residents Most area attractions are in the downtown area or on the campus of The Ohio State University Few attractions are outside of the center of the city such as the Zoo, the Motorcycle Hall of Fame, the Motts Military Museum and Slate Run Historic Farm.
The attractions most like Poindexter Village are regional, historic house museums and museums related to African American history and culture. Historic houses include the Kelton House Museum & Gardens and the Thurber House. Both sites use the historical significance of the residence to tell a larger historical narrative. In terms of African American history and culture, the Frank W. Hale, Jr. Black Cultural Center, a part of The Ohio State University’s Office of Diversity and Inclusion, and the King Arts Complex emphasize the art and culture of the African American community. While the Frank W. Hale, Jr. Black Cultural Center is broader in its focus, the King Arts Complex celebrates local art and hosts community events.
In addition to historic house museums and regional cultural centers, visitors are often interested in seeing local neighborhoods. Visitors can walk or be chauffeured via bus or van to see downtown and the surrounding historic neighborhoods, German Village, or customized themed tours.
Review of African American and Housing Museums
Within the past two decades, the number of African American focused museums has increased dramatically. In the era of the Civil Rights Movement there was an increase in the number of African American focused museums these were general heritage and culture museums. However, more recently narrowly focused museums have opened closely focused on topics such as the Civil Rights Movement, Slavery, Jim Crow South, or notable African American Americans. In addition, there is an interest in museums interpreting historic homes and housing There are many single-family house museums and a small number of housing museums in located in historic multi-family housing, like the Lower East Side Tenement Museum and the Public Housing Museum in Chicago, now under construction. This trend of narrowed focus and increased public interest in African American museums and cultural centers and in housing museums bodes well and is indicative of the potential market support for Poindexter Village. There are many African American museums currently open in the U.S., so it is important that Poindexter Village be differentiated and offer important and compelling content and programs.
ConsultEcon, Inc. Management & Economic Insight February 14, 2023 Poindexter Village 5
Two Alternative Development Scenarios with and without Union Grove
There are two alternative development scenarios evaluated in this analysis. They differ in their program space utilization based on the inclusion and exclusion of Union Grove Church They range in size and scale of total building area and total estimated construction cost. As planning and design advances, the program of spaces and operating potential of the proposed Poindexter Village development will need to be revisited and updated.
Total building area for alternative development scenarios are as follows:
♦ Scenario #1: 16,800 total square feet
♦ Scenario #2: 11,600 total square feet
Total construction costs are estimated at:
♦ Scenario #1: $5.46 million @ $325 per square foot cost
♦ Scenario #2: $4.35 million @ $375 per square foot cost
Visitation and Operating Potential of Scenario with Union Grove
The visitation and operating potential of Scenario #1 includes:
♦ Visitation ranges +/-20% of midrange 17,000.
♦ Earned revenue potential is estimated at $171,000 in current dollar value at midrange visitation.
♦ Staffing includes 4.5 new full-time staff positions.
♦ Operating budget estimated at $495,000 in current dollar value.
♦ Contributed revenue requirement for breakeven operations, or the difference between earned revenue and the operating budget, is $324,000.
Visitation and Operating Potential of Scenario without Union Grove
The visitation and operating potential of Scenario #2 includes:
♦ Visitation ranges +/-20% of midrange 11,000.
♦ Earned revenue potential is estimated at $111,000 in current dollar value at midrange visitation.
♦ Staffing includes 3.5 new full-time staff positions.
♦ Operating budget estimated at $381,000 in current dollar value.
♦ Contributed revenue requirement for breakeven operations, or the difference between earned revenue and the operating budget is $270,000.
ConsultEcon, Inc. Management & Economic Insight February 14, 2023 Poindexter Village 6
Cost and Benefits of Alternative Development Scenarios
Data in Table 1 summarize costs of the project, including construction costs, staffing requirement, and profile of operations for Poindexter Village
Table 1
Summary of Costs in a Stable Year of Operations in Current Dollars Alternative Development Scenarios
Poindexter Village
Source:
Benefits of Poindexter Village
In addition to the above costs, the project will provide the following benefits, in no order.
♦ Capitalization of OHC
♦ New visitation and audiences for OHC historic sites and museums
♦ New operating revenues to OHC (and potentially the James Preston Poindexter Foundation, depending on their mission, capacity, programs developed, costs and funding availability)
o Earned revenue growth
o Contributed revenue growth
♦ Improved educational offerings for Columbus and Ohio residents
♦ Opportunity to preserve and revitalize Union Grove while expanding OHC sites, facilities and programming
♦ Opportunity to develop community tours, events, programs and partnerships with neighborhood African American arts, culture, and heritage organizations to tell a comprehensive story, expand audiences and community impact
ConsultEcon, Inc. Management & Economic Insight February 14, 2023 Poindexter Village 7
Scenario #1 with Union Grove Scenario #2 without Union Grove Construction $5,460,000 $4,350,000 Staff 4.5 3.5 Operations
Village $495,000 $381,000 Alternate Scenarios
Poindexter
Ohio History Connection (OHC) and ConsultEcon, Inc.
♦ Community, city and state partnership and investment in the future of Columbus’ historic African American neighborhood that has experienced sustained disinvestment over the past century
♦ New city and regional tourism offering focused on African American arts, culture and heritage
♦ Promotion of community cohesion, diversity and inclusion
♦ Community pride, quality of life amenity / community resource
Based on the proposed visitor experience, programs and events, Poindexter Village has the potential to increase visitation, revenues, staffing, and overall operations for OHC. Poindexter Village needs sufficient capital and operating support from OHC to become a sustainable operation that has the capacity to achieve the mission and vision for the project. The renovation of the historic structures and creation of a museum and cultural learning center will appeal to multiple audience segments, such as neighborhood and regional residents and tourists, including African American and non-African American people
Recommended Next Steps
OHC will need to continue to develop concepts and formulate plans to implement the project There has been considerable community outreach and support for the Poindexter Village redevelopment project to date. With the new opportunity presented by Union Grove church to expand the scope and impact of the Poindexter Village project, interpretive and other plans will need be updated to consider these facilities and how ultimately Poindexter Village will physically and operationally relate to the church Based on current planning to date through this report, following are recommended next steps for OHC to take. As planning and design advance, the operating analyses in this report will need to be updated.
♦ Develop a working agreement / memorandum of understanding with the Union Grove Church. Potential early items to agree to include: use of church for Poindexter Village programs before opening and commitment to engage church leadership in planning for church use and interpretation as part of the Poindexter Village project.
♦ Fundraising feasibility analysis to answer the question, what is the potential for OHC to raise capital funds outside of the state funding process from other governmental sources, foundations and private philanthropy?
♦ Develop visitor experience / exhibit plans / cost estimates, in conjunction with site and building plans.
♦ Advance site and building plans / cost estimates, in conjunction with visitor experience and exhibit plans.
♦ Develop pre-opening plan for organization ramp up to project opening. Budget for pre-opening programs and events.
ConsultEcon, Inc. Management & Economic Insight February 14, 2023 Poindexter Village 8
Section I
INTRODUCTION AND ASSUMPTIONS
ConsultEcon, Inc. was retained by the Ohio History Connection as part of a multi-disciplinary team with Renter Mentor to prepare a market study and evaluation of alternative development scenarios for the proposed Poindexter Village in Columbus, Ohio.
Assumptions
In preparing this report, the following assumptions were made. This study is qualified in its entirety by these assumptions.
1. The size and design of Poindexter Village will serve to create a high quality, stimulating attraction with broad-based audience appeal and a distinctive image. Poindexter Village will be a unique attraction in the region and the nation. This distinction will give it further visibility as a “must-see” attraction The entrances to the site will be highly visible and well signed. Additional land on the site will be used in a manner advantageous to the success of the project.
2. The facility will be competently and effectively managed. An aggressive promotional campaign will be developed and implemented. This program will be targeted to prime visitor markets. The admission price for the elements of the facility will be consistent with the entertainment and educational value offered, and with current attraction admissions prices for other comparable visitor attractions.
3. There will be no physical constraints to impede visitors to Poindexter Village, such as major construction activity Changes in economic conditions such as a major recession or major environmental problems that would negatively affect operations and visitation will not occur in the near future.
4. Every reasonable effort has been made in order that the data contained in this study reflect the most accurate and timely information possible and it is believed to be reliable. This study is based on estimates, assumptions and other information developed by ConsultEcon, Inc. from its independent research efforts, general knowledge of the industry, and consultations with the client No responsibility is assumed for inaccuracies in reporting by the client, its agents and representatives, or any other data source used in the preparation of this study. No warranty or representation is made that any of the projected values or results contained in this study will actually be achieved There will usually be differences between forecasted or projected results and actual results because events and circumstances usually do not
ConsultEcon, Inc. Management & Economic Insight February 14, 2023 Poindexter Village I-1
occur as expected. Other factors not considered in the study may influence actual results.
5. Possession of this report does not carry with it the right of publication. This report will be presented to third parties in its entirety and no abstracting of the report will be made without first obtaining permission of ConsultEcon, Inc., which consent will not be unreasonably withheld.
6. This report may not be used for any purpose other than that for which it was prepared. Neither all nor any part of the contents of this study shall be disseminated to the public through advertising media, news media or any other public means of communication without the prior consent of ConsultEcon, Inc.
7. This report was prepared during August 2022 through February 2023 It represents data available at that time.
ConsultEcon, Inc. Management & Economic Insight February 14, 2023 Poindexter Village I-2
Section II
PROJECT DESCRIPTION AND SITE REVIEW
This section reviews the site of the Poindexter Village in Columbus, Ohio from a market and economic perspective as an input into the master planning Important attributes of an attraction such as Poindexter Village include its location, accessibility, visibility, site size and quality, adjacent uses, nearby amenities and availability of parking. Optimizing these factors is integral to successful project planning and implementation
Regional Context
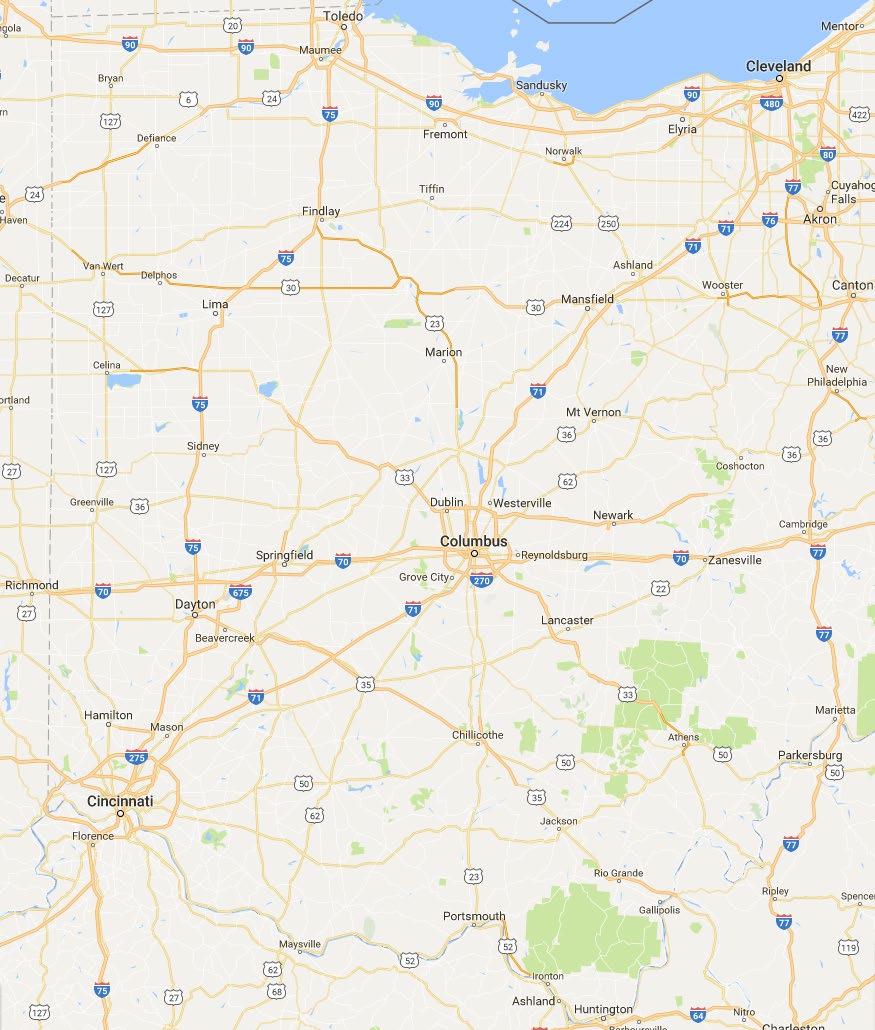
Columbus is the state capital and largest city in Ohio The Columbus metropolitan area encompasses 10 counties in central Ohio. In 2022, the city of Columbus had an estimated population of 928,000. The Columbus metro area was estimated to contain 2.2 million residents, which is approximately 19 percent of the State’s total population of 11.8 million Columbus lies in the middle of the State of Ohio at the crossroads of a number of interstate highways, including I-70, which runs east-west between Pittsburgh Pennsylvania and Indianapolis, Indiana, and I-71, which runs north-south connecting Columbus to large Ohio cities including Cleveland and Cincinnati. Figure II-1 shows a regional map of Columbus.
ConsultEcon, Inc. Management & Economic Insight February 14, 2023 Poindexter Village II-1
ConsultEcon, Inc. Management & Economic Insight February 14, 2023 Poindexter Village II-2
Figure II-1
Map of Central Ohio Including Columbus and the Highway Network
Source: Google Maps
Location and Site
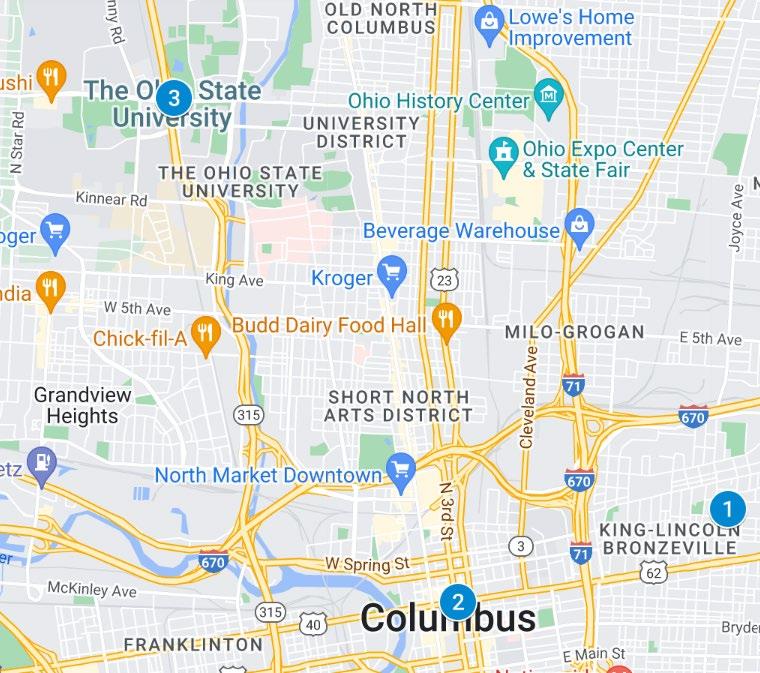
The location for the Poindexter Village campus is east of the Columbus’ downtown on the other side the interchange of I-71. It is in the Historic Bronzeville or Near East Side neighborhood. Figure II-2 is a map showing the campus location in relation to the downtown and Ohio State University to the west and northwest of the site respectively. The downtown, with its government and business district, and the state’s flagship public university are important destinations within the Columbus area for residents and visitors alike.
Site Size and Qualities
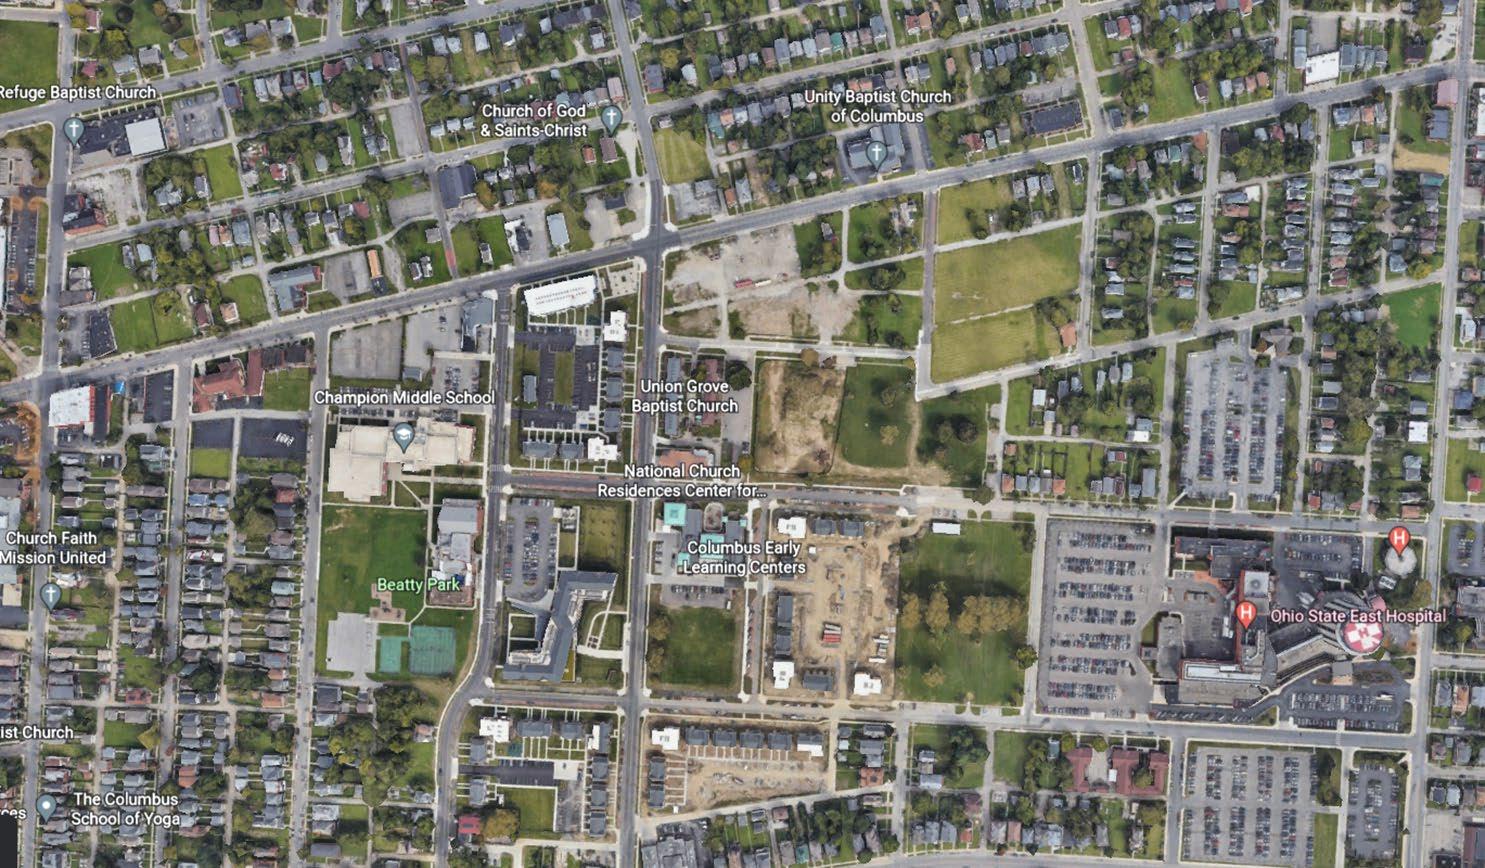
Poindexter Village’s campus is approximately 12,000 square feet of interior space with four primary elements: apartment building 1 on 290 N. Champion Avenue, apartment building 2 on 1297 Granville Street, the vehicular circulation and parking areas, and alley that bisects the two buildings. It is also near Union Grove Baptist Church, a potential partner for Poindexter Village. There is no entry approach and limited parking on-site, while the alley and sidewalks allow for pedestrian experiences. Figure II-3 provides an aerial photograph of the Ohio History Center and Village site.
ConsultEcon, Inc. Management & Economic Insight February 14, 2023 Poindexter Village II-3

ConsultEcon, Inc. Management & Economic Insight February 14, 2023 Poindexter Village II-4
Figure II-2
Columbus Area Map with Poindexter Village Location
Source: Google Maps
Existing Facilities
Following is an overview of the existing facilities.
♦ Poindexter Village Buildings 1&2 – Two of the original apartment buildings encompassing 9,400 gross square feet (SF) of total building area. Currently, the buildings are vacant with intentions to develop interpretive, educational, and staff space.
♦ (In Negotiation) Union Grove Baptist Church—A historically significant local church adjacent to the Poindexter Village. If Poindexter Village partners with Union Grove, the museum would be able to use Union Grove as temporary gallery, classroom, and performing spaces. The museum would also be able to utilize the church’s kitchen for events. This would add approximately 4,700 square feet to Poindexter Village’s available space.
ConsultEcon, Inc. Management & Economic Insight February 14, 2023 Poindexter Village II-5
Figure II-3
Aerial Photograph of the Poindexter Village Site
Note:
This is an older aerial
shot,
but it is the most up to date available. Source: Google Maps
Opportunity to Improve the Visitor Arrival Experience
Today, the Poindexter Village site was designed with limited parking because less residents owned cars and were more inclined to take public transportation. The need for additional parking will need to be addressed without taking away from the integrity of site and disrupting residents This adaptation was to better suit the needs of visitors and staff Converting Poindexter Village from a residential to a museum space will involve a central orientation space like a visitor center. Best practices in museum design and planning, as exemplified locally by COSI and many others nationally, indicate that lobbies offer visitors clear visual cues and directional signage to navigate to quickly and easily where they want to go Poindexter Village as currently configured may be confusing for visitors due to its original purpose as a residential community. Enhanced facilities should offer Poindexter Village the opportunity to improve the visitor arrival experience, visitor pathways for entry, reception, and orientation These places of arrival should be both functional and impress upon visitors the brand promise, organizational identity and what they will find inside the Poindexter Village. The historic buildings’ entrances have step and the apartments’ second floors are only accessible via stairs.
Site Accessibility
The location of the Poindexter Village is highly accessible due to its proximity to public transportation and its proximity to a large residential population in the Columbus metropolitan area. Public transit options are good with three bus stops within a short walk of the site.
Parking
Poindexter Village has one parking lot that is also shared by the Union Grove congregation. It is unfinished with no designated handicapped parking spots. Additional parking will be necessary to avoid encroaching on adjacent residential parking spaces.
ConsultEcon, Inc. Management & Economic Insight February 14, 2023 Poindexter Village II-6
Adjacent and Nearby Uses
The Main Campus is surrounded by a mix of uses. To its west and north is a highway, a major barrier to connectivity to Downtown Columbus that lies on the other site of the highway To the east are regionally serving public facilities, including the Columbus Metropolitan Library: Martin Luther King Branch, Eldon & Elsie Ward Family YMCA, and various schools and churches. South of the site is predominantly residential Overall, the large scale public assembly uses and the highway are barriers to connectivity to the adjacent areas and so adjacent uses are not supportive to the public museum use Commercial food service and hospitality are supportive of the public museum use; however, the existing commercial offerings consist of only few businesses at a low end of the pricing spectrum.
Summary
Poindexter Village is somewhat accessible and visible to resident. However, the location is partially visible to tourist markets because of its location in the state capital in the center of Ohio but it is disconnected to the Downtown Columbus due to the I-71 and I-670 Interchange. Local public awareness is high due to its importance to the local community, but it is not known to tourists In 2022, the city of Columbus had an estimated population of 928,000 The Columbus metro area was estimated to contain 2.2 million residents, which is approximately 19 percent of the State’s total population of 11.8 million. Poindexter Village’s visibility can be enhanced through additional signage and potentially based on the Master Plan also have the potential to bolster OHC’s public awareness and communicate its brand. Poindexter Village’s campus is approximately 12,000 square feet of interior space with four primary elements: apartment building 1 on 290 N. Champion Avenue, apartment building 2 on 1297 Granville Street, the vehicular circulation and parking areas, and alley that bisects the two buildings. It is also near Union Grove Baptist Church, a potential partner for Poindexter Village. There is no entry approach and limited parking on-site, while the alley and sidewalks allow for pedestrian experiences.
ConsultEcon, Inc. Management & Economic Insight February 14, 2023 Poindexter Village II-7
RESIDENT MARKET CONTEXT
This section summarizes the resident market analysis for the Poindexter Village. The facility primarily serves Columbus Metropolitan Area residents as well as other Ohio residents and tourists. Ultimately, the geographic reach and available markets for educational visitor attractions depends on the size, quality, and type of products and services offered, the accessibility and location of the attraction, the presence of other competitive attractions, regional transportation networks, and the marketing efforts of the organization. Thus the changes in visitor experience, signage and visibility, marketing, and operations that are the outcomes of the Master planning effort can affect the markets served by the Poindexter Village.
The Resident Market Area for this type of attraction is defined as the area whose residents would visit the Poindexter Village as a primary purpose or as an important part of a day trip. Resident Markets are analyzed within a “gravity model” context, which means that the closer residents live to an attraction, the more likely they are to visit On its periphery, the resident market changes over to the visitor – or tourist – market.
As Ohio’s State Capitol, as well as its location in the center of the State, Columbus has the potential to attract visitors on day and overnight trips from around the State. Ohio has 14 Metropolitan Statistical Areas, including Columbus. Figure III-1 is a map of Ohio that shows the locations of these Metropolitan areas and highway connections Data in Table III -1 include the relationship of Columbus to other metropolitan areas, including population, driving distance, and drive time.
ConsultEcon, Inc. Management & Economic Insight February 14, 2023 Poindexter Village III-1
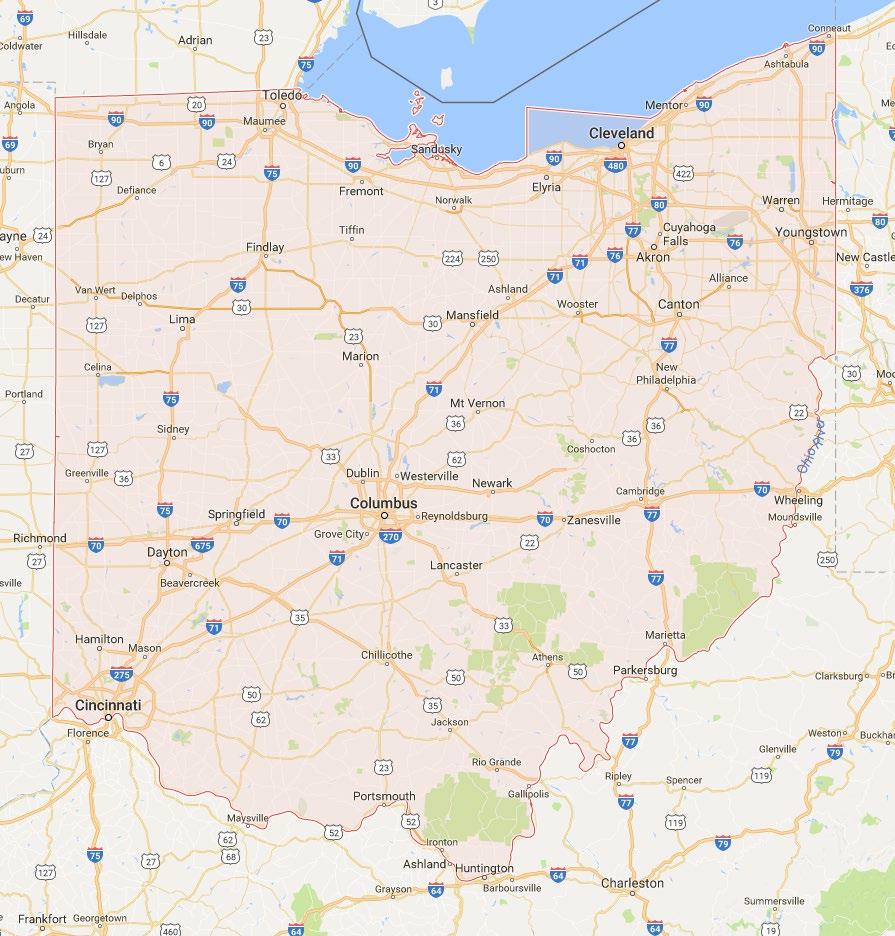
Source: U.S. Census Bureau; Google Maps; ConsultEcon, Inc.
ConsultEcon, Inc. Management & Economic Insight February 14, 2023 Poindexter Village III-2
Figure III -1
Map of Ohio with Locations of Ohio Metropolitan Areas
Table III-1
Drive Time and Population Relative to Other Ohio Metro Areas, 2022 Poindexter Village
Source: ESRI, Google Maps, and ConsultEcon, Inc.
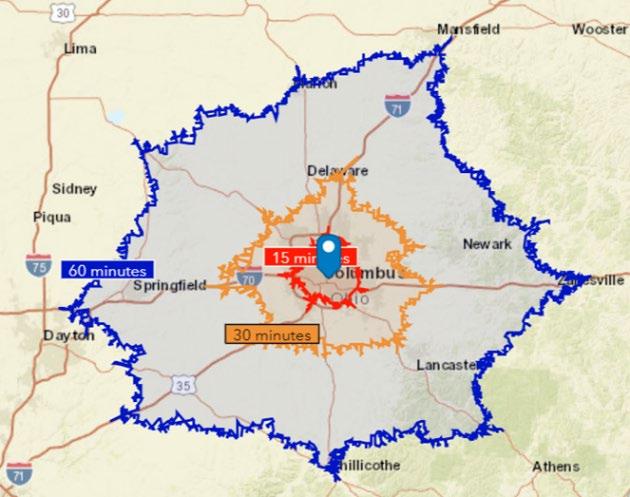
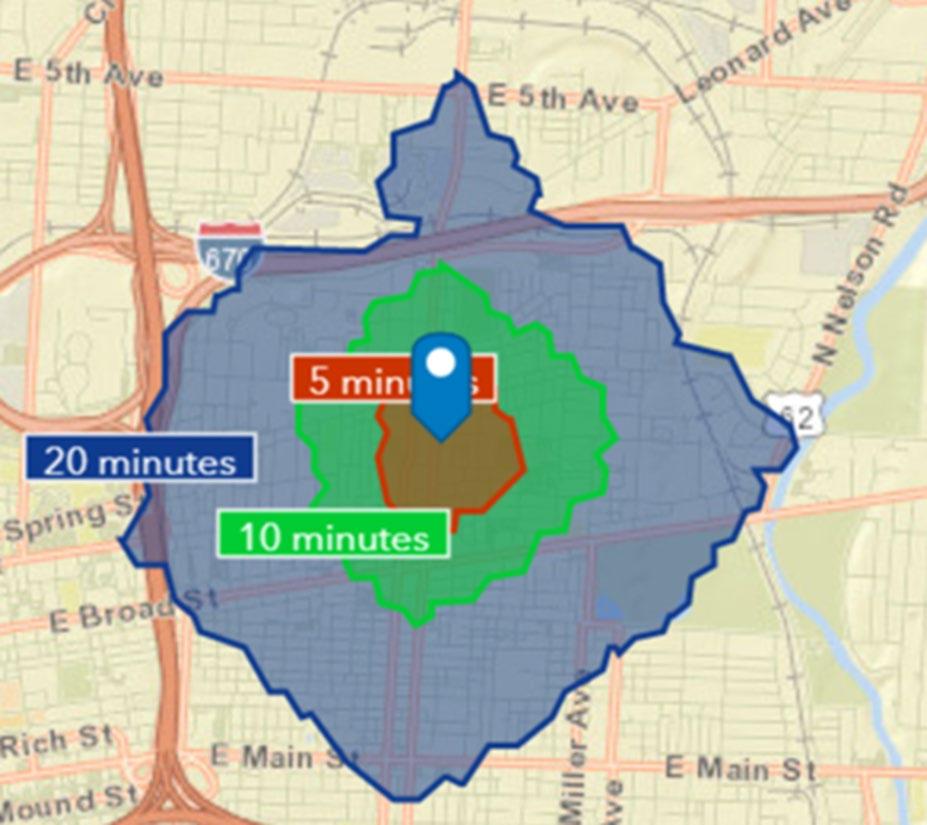
The resident market area for Poindexter Village is defined in terms of regional geographic designations. The resident market area is defined based on the gravity model. This posits that visitors are most likely to visit the closer they in proximity to the museum. The market is defined as 0 to 15, 15 to 30, and 30 to 60-minute drive times from the Poindexter Village location. The resident market is also defined by a 0 to 5, 5 to 10, and 10 to 15-minute walk. The resident market area is also compared to the population demographics in the State of Ohio, and the United States as a whole. Figure III-2 and Figure III-3 is a map showing the extent of the resident market areas by drive time and walk time respectively.
ConsultEcon, Inc. Management & Economic Insight February 14, 2023 Poindexter Village III-3
City Population Distance (Miles) Drive Time Springfield 134,983 46 47 min Mansfield 124,549 66 1 hr 1 min Dayton 814,233 71 1 hr 6 min Lima 101,445 92 1 hr 37 min Cincinnati 2,274,659 107 1 hr 43 min Akron 699,833 125 1 hr 53 min Canton-Massillon 399,776 128 1 hr 59 min Cleveland 2,083,095 143 2 hr 23 min Toledo 643,611 144 2 hr 25 min Youngstown-Warren 534,551 172 1 hr 35 min Columbus 2,187,034
Map of Resident Market Area Drive Times
Poindexter Village
ConsultEcon, Inc. Management & Economic Insight February 14, 2023 Poindexter Village III-4
Figure III-2
Source: ESRI; ConsultEcon, Inc. Market Area Color Definition 2020 Population 2022 Population 2027 Population Primary Market Area 0- to 15Minute Drive 556,594 568,855 581,700 Secondary Market Area 15- to 30Minute Drive 1,039,387 1,027,126 1,095,410 Tertiary Market Area 30- to 60Minute Drive 865,133 912,341 885450 Total Resident Market Area 0- to 60Minute Drive 2,461,114 2,508,322 2,562,560
Inc.
Source: ESRI and ConsultEcon,
Map of Resident Market Area Walk Times
ConsultEcon, Inc. Management & Economic Insight February 14, 2023 Poindexter Village III-5
Figure III-3
Source: ESRI; ConsultEcon, Inc. Definition Color 2020 Population 2022 Population 2027 Population 0- to 5Minute Walk 898 1,007 1,081 5- to 10Minute Walk 2,581 2,688 2,774 10- to 20Minute Walk 9,742 10,259 10,807 0- to 20Minute Walk 13,221 13,954 14,662 Source: ESRI and ConsultEcon, Inc.
Poindexter Village
Data in Table III-2 summarize the population trend in the Resident Market Area. The data show that the total Resident Market Area is estimated at 2.5 million in 2022. This market area population is projected to grow by 2.2 percent by the year 2027 This is a much higher rate of growth compared to the State as a whole and a slightly higher growth rate projected for the United States as a whole. The bulk of this growth is projected in the Secondary Market Area, where the population is projected to grow 2 7 percent by 2027
Source: ESRI forecasts for 2022 and 2027 and ConsultEcon, Inc.
Data in Table III-3 summarize the age profile in the Resident Market Area. The data show that the median age in the Resident Market Area is estimated at 37.8 years – slightly younger than the State and the Country as a whole but older than the city of Columbus. The population is split between those under and over 35 years old, which is similar to the city of Columbus, the state, and the country as a whole. The Primary Market Area is comparatively younger than the other parts of the Resident Market Area with a median age of 33.6
ConsultEcon, Inc. Management & Economic Insight February 14, 2023 Poindexter Village III-6
Table III -2
Population Trend in the Resident Market Area, 2020, 2022, 2027 Poindexter Village
Market Area 2020 2022 2027 Percent Change, 2022-2027 2022 Percent to Total Resident Market Area Primary Market Area (0-15 Minute Drive Time) 556,594 568,855 581,700 2.3% 22.7% Secondary Market Area (15-30 Minute Drive Time) 1,039,387 1,066,894 1,095,410 2.7% 42.5% Tertiary Market Area (30-60 Minute Drive Time) 865,133 872,573 885,450 1.5% 34.8% Total Resident Market Area (60-Minute Drive Time) 2,461,114 2,508,322 2,562,560 2.2% 100.0% Franklin County, Ohio 1,323,807 1,354,579 1,383,219 2.1% City of Columbus 905,768 927,811 948,592 2.2% City of Columbus MSA 2,138,926 2,187,034 2,242,591 2.5% State of Ohio 11,799,448 11,820,906 11,829,083 0.1% United States 331,449,281 335,707,897 339,902,796 1.2%
Median Age and Percent of Population by Age Group in the Resident Market Area, 2012 Poindexter Village
Source: ESRI and ConsultEcon, Inc.
Data in Table III-4 summarize the age profile of children under the age of 18 in the Resident Market Area. The data show that there were an estimated 616,823 children between the ages of 0 and 17 in the Total Resident Market Area in 2022, a number that is projected to decrease by 8.4 percent by the year 2027 This is a significant decrease compared to the state of Ohio at -0.8% and the United States that has neither a growth nor decline rate at 0%. In the Resident Market Area, the area with the largest projected growth is the Tertiary Market Area, where the population of children is projected to grow 1.0 percent by 2027, particularly among children ages 0 to 3 and ages 13 to 17. However, the Primary Market Area is demonstrating a particularly significant decrease by 30.7 percent.
ConsultEcon, Inc. Management & Economic Insight February 14, 2023 Poindexter Village III-7
Table III-3
Market Area Median Age 0 to 17 18 to 24 25 to 34 35 to 54 55+ Primary Market Area 33.6 21.3% 14.5% 16.4% 25.0% 25.0% Secondary Market Area NA 21.5% 8.4% 12.4% 24.9% 32.8% Tertiary Market NA 22.4% 9.8% 14.1% 25.4% 28.3% Total Resident Market Area 37.8 22.4% 9.8% 14.1% 25.4% 28.3% City of Columbus 33.7 22.4% 12.4% 17.2% 24.9% 23.0% Franklin County, Ohio 35.6 22.3% 11.2% 15.7% 25.0% 25.8% City of Columbus MSA 37.2 22.6% 10.0% 14.3% 25.6% 27.4% State of Ohio 40.6 21.1% 8.9% 13.0% 24.4% 32.6% United States 38.9 21.9% 9.0% 14.0% 24.9% 30.3%
Estimated Number of School Age Children in Resident Market Area, 2022 & 2027
Poindexter Village
Source: ESRI forecasts for 2022 and 2027; and ConsultEcon, Inc.
Data in Table III-5 summarize the household profile of the Resident Market Area. The data show that there are an estimated 607,000 households in the Resident Market Area, of which 61.2 percent are identified as family households This proportion of family households is slightly higher than the city of Columbus and Franklin County. However, it is slightly lower than the State and the Country as a whole Within the Resident Market Area, the Primary Market Area has the lowest proportion of family households to total households and an average household size of 2.27. The Secondary and Tertiary Market areas have a higher ratio of family households, with 64.9 and 656.9 percent of total households.
ConsultEcon, Inc. Management & Economic Insight February 14, 2023 Poindexter Village III-8
Table III-4
Ages 0-3 Ages 4-6 Ages 7-9 Ages 10-12 Ages 13-17 Total Ages 0-17 2022 Primary Market Area 26,791 19,594 19,345 18,722 36,605 176,870 Secondary Market Area 54,329 42,192 42,915 44,023 69,158 252,617 Tertiary Market 38,868 30,587 31,305 32,177 54,399 187,336 Total Resident Market Area 119,988 92,373 93,565 94,922 160,162 616,823 City of Columbus 48,248 35,102 34,561 32,746 57,511 208,168 Franklin County, Ohio 67,142 50,133 50,021 49,460 85,372 302,127 City of Columbus MSA 109,219 82,298 82,490 83,806 141,015 498,829 State of Ohio 524,731 407,297 414,172 427,070 724,849 2,498,118 United States 15,664,026 12,080,601 12,246,892 12,503,815 20,969,414 73,464,747 2027 Primary Market Area 27,634 19,759 19,276 18,675 37,178 122,521 Secondary Market Area 56,086 42,475 42,680 43,482 68,295 253,018 Tertiary Market 39,306 30,657 31,246 32,959 55,012 189,180 Total Resident Market Area 123,025 92,891 93,202 95,116 160,484 564,718 Franklin County, Ohio 69,151 50,377 49,634 48,938 85,373 303,473 State of Ohio 524,071 402,237 406,829 426,575 717,942 2,477,654 United States 15,919,097 12,040,581 12,091,210 12,495,523 20,882,351 73,428,762 % Change 2022-2027 Primary Market Area 3.1% 0.8% -0.4% -0.3% 1.6% -30.7% Secondary Market Area 3.2% 0.7% -0.5% -1.2% -1.2% 0.2% Tertiary Market 1.1% 0.2% -0.2% 2.4% 1.1% 1.0% Total Resident Market Area 2.5% 0.6% -0.4% 0.2% 0.2% -8.4% Franklin County, Ohio 3.0% 0.5% -0.8% -1.1% 0.0% 0.0 State of Ohio -0.1% -1.2% -1.8% -0.1% -1.0% -0.8% United States 1.6% -0.3% -1.3% -0.1% -0.4% 0.0%
Table III-5
Resident Market Household Profile, 2022
Poindexter Village
Data in Table III-6 summarize the income profile in the Resident Market Area The data show that the median household income in the Resident Market Area is $70,500, which is slightly more than Franklin County, the city of Columbus, and the state, but slightly less than the city’s metropolitan statistical area and the U.S. as a whole In the Resident Market Area, 25.2 percent of households earn $100,000 or more per year, which is a lower proportion than Franklin County, the city of Columbus, the city of Columbus’ metropolitan statistical area, the state, and the country as a whole The area in the Resident Market Area with the highest affluence is the Secondary Market Area, where 44.1 percent of households are earning more than $100,000. Conversely, the area with the lowest income levels is the Primary Market Area, where the median household income was $54,327. In the Primary Market Area, 45.4 percent of households earn less than $50,000, and another 18.9 percent earn between $50,000 and $74,999, for a total of 64.3 percent of households earning less than $74,999, compared to 57.6 percent of households in the State as a whole and 51.3 percent of households in the United States.
ConsultEcon, Inc. Management & Economic Insight February 14, 2023 Poindexter Village III-9
Estimated Number of Households Estimated Number of Family Households 1/ Percent of Families to Total Households Average Household Size Primary Market Area 240,280 113,017 47.0% 2.27 Secondary Market Area 411,717 267,090 64.9% 2.56 Tertiary Market Area 338,649 226,627 66.9% 2.51 Total Resident Market Area 990,646 606,734 61.2% 0.00 City of Columbus 391,617 195,929 50.0% 2.30 Franklin County, Ohio 553,310 305,235 55.2% 2.39 City of Columbus MSA 861,292 523,734 60.8% 2.48 State of Ohio 4,831,463 3,001,956 62.1% 2.38 United States 128,657,669 83,407,414 64.8% 2.55
ConsultEcon, Inc.
Source: ESRI and
1/ Family Households are defined by ESRI as households in which one or more persons in the household are related to the head of household by birth, marriage, or adoption.
Table III-6
Percent of Resident Market Area Households by Income Group, 2022 Poindexter Village
Educational Attainment
Educational attainment is correlated with attendance at museums – numerous national consumer surveys over the years have found that respondents with higher educational attainment are more interested in such attractions Data in Table III-7 show the highest level of educational attainment for the adult population over 25 years old in the Resident Market Area. Approximately 7.5 percent of the adult population have educational attainment below a high school diploma or an alternative credential in the total resident market area. This is similar to Franklin County (7.4%) and the City of Columbus Metropolitan Statistical Area (7.1%), but it lower than the State of Ohio (8.2%), the City of Columbus (8.5%), and the United States as a whole (10%). Conversely, 37.6 percent of the total resident market area has a bachelor’s degree or a graduate degree. This is similar to the country (35.1%), the City of Columbus Metropolitan Statistical Area (40.0%), and the City of Columbus (40.1%) However, it is lower than Franklin County (43.5%). Therefore, the majority of the resident market area has at least a high school education. Poindexter Village will have to market exhibits targeted to audiences in the two smaller categories of educational attainment below a high school degree and those with a bachelor’s or graduate degree differently than the majority of the resident market area.
ConsultEcon, Inc. Management & Economic Insight February 14, 2023 Poindexter Village III-10
Median Household Income Less than $50,000 $50,000 to $74,999 $75,000 to $99,999 $100,000 to $149,999 $150,000+ Primary Market Area $54,327 45.4% 18.9% 11.2% 13.0% 11.4% Secondary Market Area NA 24.3% 17.8% 13.7% 21.3% 22.8% Tertiary Market NA 37.2% 19.3% 14.0% 17.0% 12.5% Total Resident Market Area $70,492 38.6% 21.2% 15.0% 20.3% 4.9% Franklin County, Ohio $68,297 34.7% 19.1% 12.9% 17.2% 16.0% City of Columbus $60,220 39.7% 18.5% 13.1% 16.0% 10.9% City of Columbus MSA $72,599 32.8% 18.5% 12.9% 18.2% 17.6% State of Ohio $62,419 39.0% 18.6% 13.4% 15.9% 13.0% United States $72,414 34.4% 16.9% 13.2% 17.2% 18.3% Source: ESRI and ConsultEcon, Inc.
Table III-7
Resident Market Area Educational Attainment, 2022
Poindexter Village
Race and Ethnicity
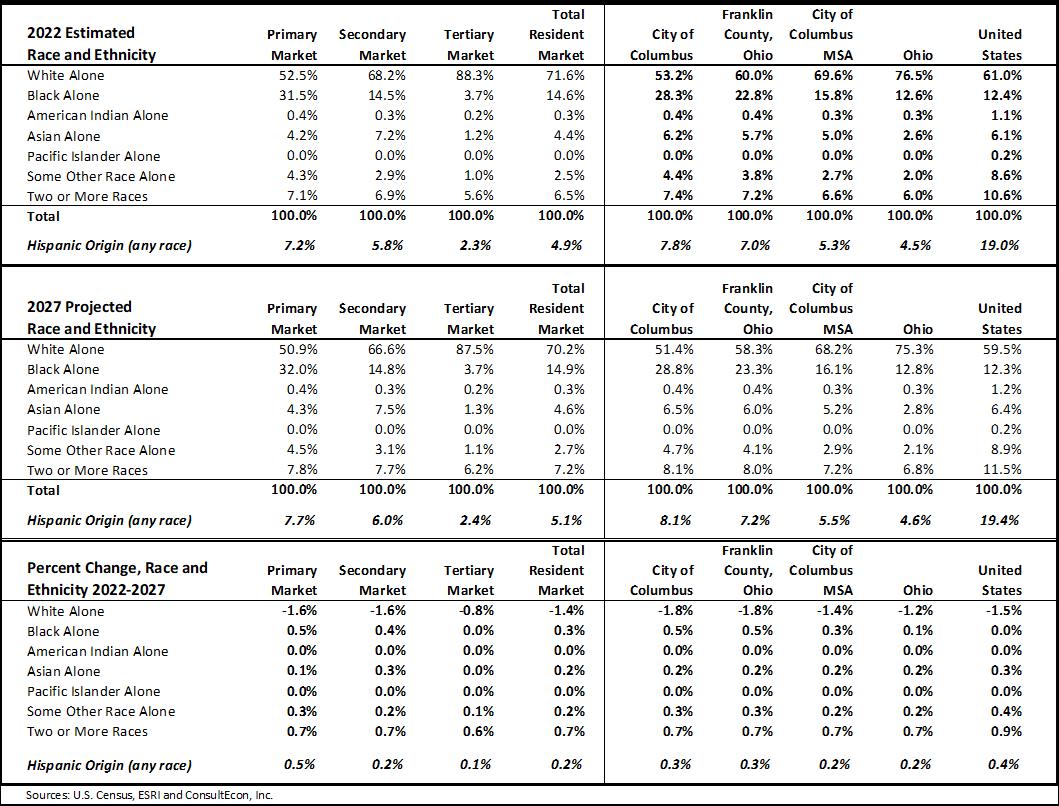
The Resident Market area where Poindexter Village is located has approximately 14.6 percent of its population who identify as African American –and the Primary Market has the greatest concentration of African Americans, with 31.5 percent. The City of Columbus Franklin County have relatively high concentrations of African American populations – at 28.3 and 22.8 percent, respectively. The city of Columbus’ metropolitan statistical area, the state of Ohio, and the United States had almost half the concentration of residents who identified as African American at 15.8, 12.6, and 12.4 percent respectively While the country and the state are expected to have little to no growth in the African American population by 2027, the Primary and Secondary Markets’ African American populations are expected to grow by 0.5 and 0.4 percent Data in Table III-8 show the Resident Market Race and Ethnicity profile for 2022, 2027, and the percent change between 2022 and 2027.
ConsultEcon, Inc. Management & Economic Insight February 14, 2023 Poindexter Village III-11
Market Area No High School Diploma High School Diploma / Alternative Credential Some College Associate's Degree Bachelor's Degree Graduate / Professional Degree Primary Market Area 10.3% 26.2% 17.9% 6.9% 24.2% 14.5% Secondary Market Area 5.2% 22.0% 17.0% 8.0% 30.7% 17.2% Tertiary Market 8.5% 38.0% 18.9% 9.8% 16.2% 8.5% Total Resident Market Area 7.5% 28.7% 17.9% 8.4% 24.1% 13.5% City of Columbus 8.5% 25.0% 18.4% 7.9% 26.3% 13.8% Franklin County, Ohio 7.4% 24.0% 17.5% 7.6% 27.7% 15.8% City of Columbus MSA 7.1% 27.1% 17.6% 8.2% 25.7% 14.3% State of Ohio 8.2% 32.6% 18.5% 9.6% 19.5% 11.6% United States 10.0% 27.1% 18.3% 9.4% 21.7% 13.4%
Sources: ESRI and ConsultEcon, Inc.
Note: Percentages reflect the highest level of education attainment reached by adult populations (Age 25 and older) in the Resident Market Areas.
Resident Market Race and Ethnicity, 2022 and Projected 2027
Poindexter Village
Resident Market Summary
The Resident Market Area for Poindexter Village is defined as the area within a 60-minute drive time from the site. Within the Resident Market Area, the markets are further broken out into the Primary Market Area (the area within a 15-minute drive), the Secondary Market Area (the area within a 15 to 30-minute drive), and the Tertiary Market Area (the area within a 30 to 60-minute drive) This Resident Market Area had the following characteristics in 2022:
ConsultEcon, Inc. Management & Economic Insight February 14, 2023 Poindexter Village III-12
Table III-8
♦ The total Resident Market Area population is estimated at 2.5 million in 2022. This market area population is projected to grow by 2.2 percent by the year 2027.
♦ The median age in the Resident Market Area is estimated at 37.8 years – slightly younger than the State and the Country as a whole but older than the city of Columbus. The population is split between those under and over 35 years old, which is similar to the city of Columbus, the state, and the country as a whole. The Primary Market Area is comparatively younger than the other parts of the Resident Market Area with a median age of 33.6.
♦ There were an estimated 616,823 children between the ages of 0 and 17 in the Total Resident Market Area in 2022, a number that is projected to decrease by 8.4 percent by the year 2027. This is a significant decrease compared to the state of Ohio at -0.8 percent and the United States that has neither a growth nor decline rate.
♦ Most of the resident market area has at least a high school education. Approximately 37.6 percent of the total resident market area has a bachelor’s degree or a graduate degree.
♦ The Resident Market area has approximately 14.6 percent of its population who identify as African American –and the Primary Market has the greatest share of African American residents, with 31.5 percent. The City of Columbus and Franklin County have relatively high concentrations of African American populations – at 28.3 and 22.8 percent, respectively. The Columbus Metropolitan Statistical Area, the state of Ohio, and the United States had lower proportions of residents who identified as African American at 15.8, 12.6, and 12.4 percent respectively.
♦ There are an estimated 607,000 households in the Resident Market Area, of which 61.2 percent are identified as family households. Within the Resident Market Area, the Primary Market Area has the lowest proportion of family households to total households and an average household size of 2.27.
♦ The median household income in the Resident Market Area is $70,500, which is slightly more than Franklin County, the city of Columbus, and the state, but slightly less than the city’s metropolitan statistical area and the U.S. In the Resident Market Area, 25.2 percent of households earn $100,000 or more per year, which is a smaller proportion than Franklin County, the city of Columbus, the city of Columbus’ metropolitan statistical area, the state, and the country as a whole.
♦ The area with the lowest income levels is the Primary Market Area, where the median household income was $54,327. In the Primary Market Area, 45.4 percent of households earn less than $50,000, and another 18.9 percent earn between $50,000 and $74,999, for a total of 64.3 percent of households earning less than $74,999, compared to 57.6 percent of households in the State as a whole and 51.3 percent of households in the United States.
ConsultEcon, Inc. Management & Economic Insight February 14, 2023 Poindexter Village III-13
Section IV
TOURIST MARKET
This section provides a summary of the tourist markets available to the Poindexter Village. Tourists will be an important source of visitation to Poindexter Village under the Master Plan, including those within Ohio and from out of state, as well as both day and overnight visitors. There is a substantial visitor market available to draw from, Experience Columbus, the destination marketing organization, is interested in promoting the city’s tourism and African American experience to all tourist audiences. Poindexter Village can become a must-see attraction in the Greater Columbus Area and can add to the critical mass of things to see and do at the Village and strengthen the tourism offering Tourist market segments available to the Poindexter Village include:
♦ Destination leisure visitors to Greater Columbus;
♦ Individuals visiting friends and relatives (VFRs) in the area;
♦ Business travelers, who may find time in their schedule for a visit
♦ Business travelers attending a conference, who may participate in social events hosted by Poindexter Village; and,
♦ Pass-through visitors.
These tourist market segments will be comprised of both overnight and day-trip visitors. Many of the day-trip visitors, however, will be drawn from the defined Resident Market Area and some will be drawn from beyond the Resident Market Area.
Ohio Tourism
In 2021, Tourism is an important driver in the Ohio economy, generating an estimated $47 billion in sales. This is up 22 percent compared to 2020. The state has seen an increase in visitation since 2020 (201 million), but it is has not returned to 2019 levels (226 million). In 2021, Ohio welcomed 219 million visitors, including 40 million overnight visits. 3 This
3 TourismOhio, “2021 Tourism Economic Impacts,” 1-2.
ConsultEcon, Inc. Management & Economic Insight February 14, 2023 Poindexter Village IV-1
represents an increase over 2020 levels, when the state welcomed 34 million overnight visits. Overall, direct spending by visitors in 2021 was estimated at $35 billion dollars.
Columbus Tourism
Tourists, from within Ohio and from out of state, make up an important segment of visitors to Poindexter Village Key drivers for visitation include conventions, trade shows, sporting events and leisure visits. The top events hosted in Columbus were the Plexus Worldwide, Arnold Sports Festival, American Foundry Society, National Collegiate Bowling Championship, and the USA Volleyball’s Ohio Valley Region. The following section provides an overview of characteristics of these visitors, based on Longwoods International national survey of travelers.
Visitor Volume
Columbus has a robust tourism market that was growing in 2019 and is rebounding after the pandemic. In 2019, Columbus had 43 million day and overnight visitors, which was an increase of 2.7 percent or 1.1 million visitors from 2018. The most recent data from 2021 shows a slight decrease in tourism due to the COVID-19 pandemic There were 42.7 million day and overnight tourists visited Columbus in 2021, which was a decrease of 0.7 percent from 2019. Hotel market data indicate that Columbus tourism continued to recover. In 2022, hotel occupancy was 58.6 percent, which is a 13.1 percent increase from 2021 and bed tax collections from 2022 totaled more than $48.6 million, which is up 45 percent from 2021. 4
Overnight Visitors
The city of Columbus had a growing overnight visitor market prior to the pandemic and is starting to recover. In 2019, overnight visits were 9.9 million a 3 percent increase over 2018. in 2021, there were 8.6 million overnight visitors, a decrease 13.0 percent or 1.3 million visitors. However, between 2019 and 2021, day trip visits grew by 2.7 percent or 900,000.
The average length of stay has also increased slightly from 2.4 nights in 2019 to 2.5 nights in 4 Experience
ConsultEcon, Inc. Management & Economic Insight February 14, 2023 Poindexter Village IV-2
Greater
& Visitors
Columbus,
Columbus Convention
Bureau
in 2021. While Columbus is having fewer overnight visitors, overnight trips are being extended.
Overnight Trip Characteristics
In 2021, the main purpose of overnight visitors to Columbus was to visit friends and relatives at 53.0 percent followed by leisure visits like concerts or sporting events at 37.0 percent. Business-leisure trips and business trips like attending a convention were the least common trip purposes at 5.0 percent each. The top five activities that overnight visitors experienced in Columbus were shopping, attending a celebration, sightseeing, the zoo, and a bar or nightclub. The average travel party size was 2.6 persons.
African American Overnight Visitors
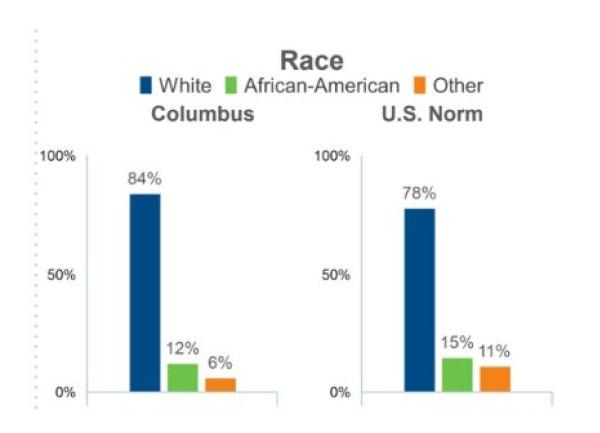
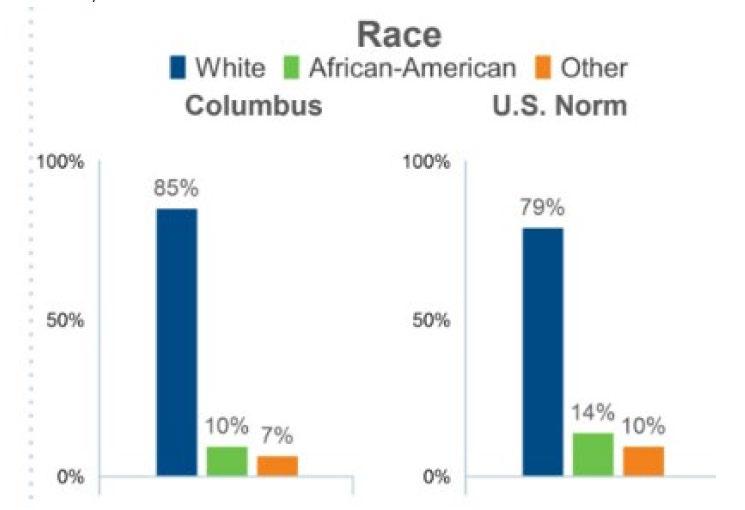
Poindexter Village will appeal to African American travelers to Columbus, a key visitor segment. Columbus overnight visitors were slightly less diverse than the U.S. travelers overall, with 84 percent white visitors and 12 percent African American visitors compared to the country’s typical overnight visitor composition of 78 percent white and 15 percent African American Based on the overnight visitor volume and the percent of tourists that are African American Columbus drew over 1 million visitors in 2021. Data in Figure IV-1 summarizes the race and ethnicity of visitor volumes for overnight parties to Columbus and compares it to the United States.
ConsultEcon, Inc. Management & Economic Insight February 14, 2023 Poindexter Village IV-3
Overnight Visitors’ Race and Ethnicity Compared to the United States Columbus, Ohio
Source: Longwoods International, 2021
Note: The Longwoods International report does not equal to 100% because it is rounding for a small sample size.
African American Day Visitors
Unlike overnight trips, day trip visits grew by 2.7 percent or 900,000 between 2019 and 2021. In 2021, there were 34.1 million day-trip visitors to the city. Columbus’ day visitors were 10 percent African Americans compared to the country’s typical day-trippers that were 14 percent African American. Based on these data, there are an estimated 3.4 million African American visitors to the area. Data in Figure IV-2 summarizes the race and ethnicity of visitor volumes for day-trip parties to Columbus and compares it to the United States.
ConsultEcon, Inc. Management & Economic Insight February 14, 2023 Poindexter Village IV-4
Figure IV-1
Daytime Visitors’ Race and Ethnicity Compared to the United States Columbus, Ohio
Source: Longwoods International, 2021
Trends in African American Tourism
According to Mandala Research, African American travelers in the United States spent $63 billion dollars in 2018. 5 Seventeen percent of African Americans take one or more international trips and also travel locally more than six times per year. The study in 2018 concluded that food-related activities were popular after African American travelers arrived at their destination. Nearly half of the travelers ate local or regional cuisine. African American tourists were interested in local arts and culture and activities related to African American topics (12%), family reunion travelers (22%). In addition, business travelers were more entertainment oriented and enjoyed local food and activities (36%).
ConsultEcon, Inc. Management & Economic Insight February 14, 2023 Poindexter Village IV-5
Figure IV-2
Note: The Longwoods International report does not equal to 100% because it is rounding for a small sample size.
5 Black Travelers Research 2018, Virginia Tourism Corporation.
Interest in African American Cultural Attractions
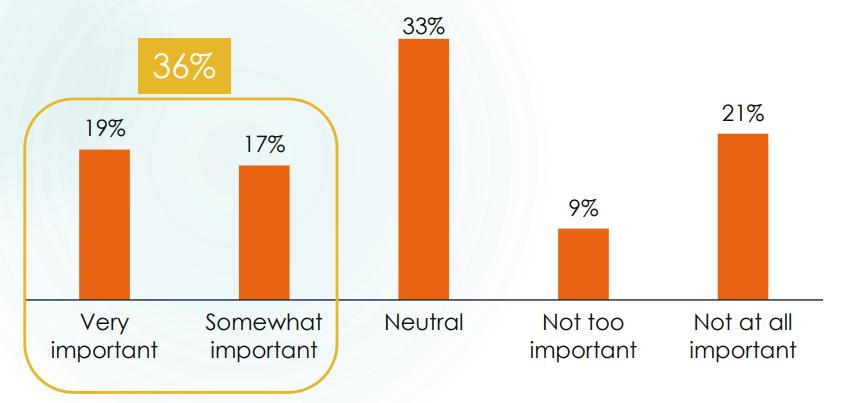
American tourists as a whole are interested in African American cultural attractions regardless of their race or ethnicity. According to Mandala Research 6, more than a third of all U.S. travelers (36%) say that “the availability of African American cultural, historic sites and attractions” is either “very important” (19%) or “somewhat important” (17%) in their choice of leisure destination, as shown in Figure IV-3 7 Further, learning more about the African American experience was a strong motivator for approximately a quarter (23%) of United States travelers to take a trip. African Americans (39%) and Millennials (28%) in particular are much more likely consider it “very important” to their choice of destination.
Importance of African American Culture in Destination Choice
ConsultEcon, Inc. Management & Economic Insight February 14, 2023 Poindexter Village IV-6
Figure IV-3
Source: Mandala Study for the Gullah Geechee Heritage Corridor
6 2020 Report Market for Gullah Geechee Heritage Tourism, Gullah Geechee Cultural Heritage Corridor.
7 2020 Report Market for Gullah Geechee Heritage Tourism, Gullah Geechee Cultural Heritage Corridor.
Summary
Tourists will make up an important segment of visitors for Poindexter Village, both from within Ohio and from out of state, as well as both day and overnight visitors. Columbus had an estimated 42.7 million visitors annually in 2019, of whom 8.6 million are overnight visitors and 34.1 million are day-trip visitors. Columbus overnight visitors were 84 percent white and 12 percent African American visitors, or about 1 million overnight trips from African American travelers. Tourism in the Columbus area is now rebounding from the impacts of the COVID pandemic on travel and tourism
ConsultEcon, Inc. Management & Economic Insight February 14, 2023 Poindexter Village IV-7
Section V
LOCAL ATTRACTIONS AND COMPETITIVE CONTEXT
This section summarizes the key visitor attractions in Columbus, Ohio, that may be considered competitive with or complementary to the offerings at the Poindexter Village
The major attractions in Columbus include the Columbus Zoo and Aquarium, COSI (the Center of Science and Industry), Franklin Park Conservatory and Botanical Garden, the Wexner Center for the Arts at The Ohio State University, and the Columbus Museum of Art. These attractions range in attendance from 2.3 million at the Zoo to about 200,000 at the Museum of Art Smaller attractions in Columbus generally have lower attendance of 40,000 or below
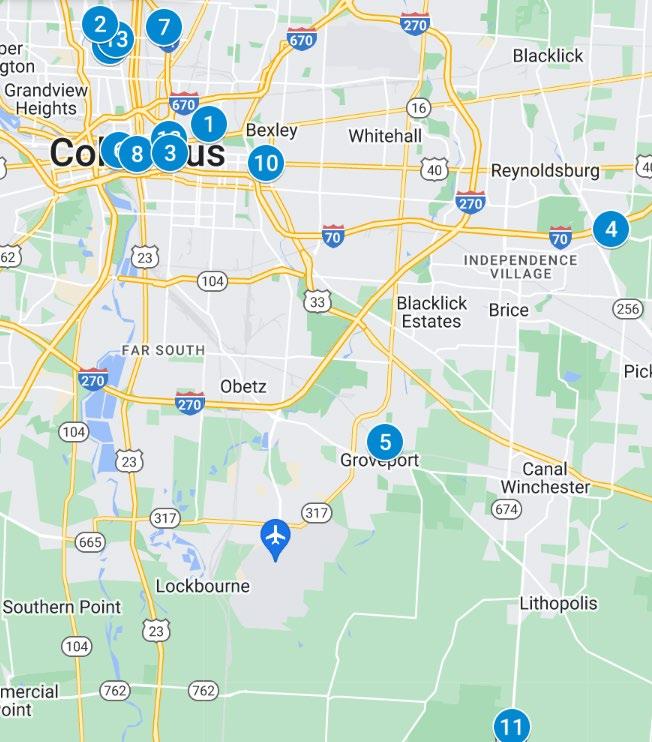
These attractions include historic attractions and houses, like the Thurber House, and special interest museums like the Motorcycle Hall of Fame. Ticket prices for adults typically range between $7.00 (at the Kelton House Museum & Gardens) and $25.00 (at the Zoo and COSI), though there are a number of free attractions and discounts are offered for local residents. Most area attractions are located in the downtown area or on the campus of The Ohio State University Few attractions are in more remote locations, such as the Zoo, the Motorcycle Hall of Fame, the Motts Military Museum and Slate Run Historic Farm. Data in Table V-1 summarize the characteristics of selected visitor attractions in and around Columbus, Ohio. Figure V-1 is a map showing the locations of these selected attractions.
ConsultEcon, Inc. Management & Economic Insight February 14, 2023 Poindexter Village V-1
Facility
Ohio History Center
Table V-1
Characteristics of Selected Visitor Attractions in Columbus, OH
Location / Drive
Time From Ohio History Center and Village Annual Attendance Admission Pricing Description
800 E. 17th Ave, Columbus, OH 43211
108,000 (OMD)
Adult: $16.00
Child (4–12): $10.00
Senior (60+): $14.00
Member & Child (3 & under): Free
Columbus Zoo and Aquarium
4850 W Powell Rd, Powell, OH 43065
2,322,934 (OMD)
COSI (Center of Science and Industry)
333 W Broad St, Columbus, OH 43215
Franklin Park Conservatory and Botanical Gardens
Wexner Center for the Arts
1777 E. Broad St., Columbus, OH 43203
627,833 (OMD)
Adult: $24.99
Child (3-9 & Senior (60+): $18.99
Under 3: Free
Discounted admission for Franklin County Residents
Adult: $25.00
Youth (2-12): $20.00
History museum with library, permanent & temporary exhibitions related to archaeology, natural history, art & artifacts of Ohio.
Opened in 1927, this zoo and aquarium is renowned for its animal exhibits, as well as its charismatic director, Jack Hanna, who led the zoo from 1978 to 1992.
This 320,000 SF science center, designed by Arata Isozaki, features science exhibits, as well as laboratory space for strategic partnerships with organizations like OSU.
Columbus Museum of Art
The Ohio State University, 1871 N High St, Columbus, OH 43210
275,000 (OMD est.)
190,380 (OMD)
General Admission: $22.00
Seniors (60+): $19.00
Children (3-12): $15.00
Free
Built in 1895, this conservatory features over 400 species of plants, as well as 90 acres of outdoor botanical gardens.
On the campus of OSU, this contemporary arts center features a collection of art in galleries, as well as landmark architecture, performance spaces, and a film theater.
480 E Broad St, Columbus, OH 43215
200,000 (OMD est.)
Adult: $18.00
Seniors (60+), Students (18+) & children (417): $9.00
Children (0-3): Free
Free Admission Sunday
This museum features an emphasis on nineteenth and early 20th century American and European works, as well as local, contemporary, and folk art.
ConsultEcon, Inc. Management & Economic Insight February 14, 2023 Poindexter Village V-2
Slate Run Living Historical Farm
Motorcycle Hall of Fame Museum
Table V-1 (Continued) Characteristics of Selected Visitor Attractions in Columbus,
1375 State Rte. 674 N. Canal Winchester OH 43110
13515 Yarmouth Dr, Pickerington, OH 43147
Motts Military Museum
Orton Geological Museum, OSU
Schumacher Gallery, Capital University
Central Ohio Fire Museum
Kelton House Museum & Gardens
5075 South Hamilton Rd. Groveport, Ohio 43125-9336
The Ohio State University, 144-150 Hagerty Dr, Columbus, OH 43210
2199 E Main St, Columbus, OH 43209
15,000
586 E Town St, Columbus, OH 43215
12,000 (OMD)
Free This attraction features an 1880s farm, interpreted by living history costumed interpreters, operated by Columbus MetroParks.
Adults: $10.00
Students: $3.00
Seniors: $8.00
Children 11 and younger: Free
Adults: $10.00
Seniors/Veterans with ID: $8.00
Students: $5.00
Children 5 and under: FREE
Home of the American Motorcycle Heritage Foundation, this museum and hall of fame celebrates and preserves the heritage of motorcycling.
This museum features collections of documents and artifacts, interpreting the importance of America’s military.
Free Part of OSU’s school of Earth Sciences, this natural history museum features a collection of rocks, minerals and fossils.
Free Gallery associated with Capital University featuring 2,500 works over 2000 years of cultural history.
Adults $8.00
Seniors $7.00
Children $6.00
Adults: $7.00
Seniors: $5.00
Students (K-12): $3.00
Historic 1908 Fire Station and exhibits about firefighting history and fire safety
Operated by the Junior League of Columbus, this 1852 house museum interprets Columbus and Underground Railroad history.
ConsultEcon, Inc. Management & Economic Insight February 14, 2023 Poindexter Village V-3
Facility
Time
History Center and
Annual Attendance Admission Pricing Description
OH
Location / Drive
From Ohio
Village
40,000
(OMD est.)
(OMD)
11,927
(OMD)
10,000 (OMD)
260
10,000 (OMD est.)
N 4th St, Columbus, OH 43215
9,035 (OMD)
Table V-1 (Continued)
Characteristics of Selected Visitor Attractions in Columbus, OH
Location / Drive
Facility
Jack Nicklaus Museum
Thurber House
Ohio Statehouse
Time From Ohio History Center and Village Annual Attendance Admission Pricing Description
The Ohio State University, 2355 Olentangy River Rd, Columbus, OH 43210
77 Jefferson Ave, Columbus, OH 43215
1 Capitol Square, Columbus, OH 43215
National Veterans Memorial and Museum
300 W Broad St, Columbus, OH 43215
Not Available Adult: $10.00
Students (with ID): $5.00
Not Available General admission: Free
Guided Tours:
Adults: $4.00
Not Available Free
Columbus Cultural Arts Center
Frank W. Hale, Jr. Black Cultural Center
139 W. Main St. Columbus OH 43215
154 W. 12th Ave. Columbus OH 43210
Not Available Adult (18-64): $18.00
Senior (65+): $16.00
College w/ID: $13.00
Youth (5-17): $11.00
Child under 5 Free
50,000 (OMD)
Gallery admission is Free; charge for classes & workshops
Not Available Not available
A 24,000 SF educational and historical museum interpreting the history of Golf and a notable player from Columbus.
Historic house museum dedicated to humorist, author, and New Yorker cartoonist, James Thurber.
Among the oldest working statehouses in the U.S., the historic Greek Revival building is open for free tours during the week.
Opened in Fall 2018,, this 53,000 SF museum interprets the living history of Veterans in the U.S
Center for Cultural & Visual Arts, consisting of galleries, classrooms, conducting lectures, readings, special events.
Cultural center featuring works by local national & international artists, paintings, sculpture. (OSU Office of Diversity and Inclusion)
Source: Official Museum Directory (OMD), Nov. 2022; ConsultEcon, Inc.
ConsultEcon, Inc. Management & Economic Insight February 14, 2023 Poindexter Village V-4
ConsultEcon, Inc. Management & Economic Insight February 14, 2023 Poindexter Village V-5
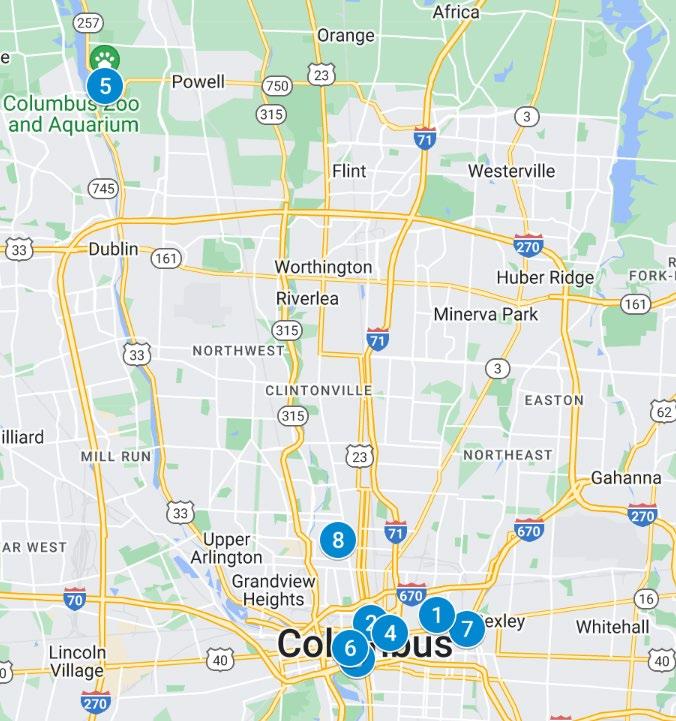
Figure V-1
Map of Selected Visitor Attractions
Source: Google Maps and ConsultEcon, Inc.
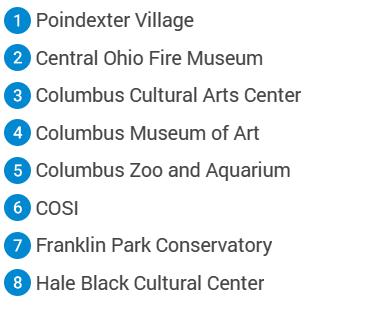
Map of Selected Visitor Attractions

ConsultEcon, Inc. Management & Economic Insight February 14, 2023 Poindexter Village V-6
Figure V-1 (Continued)
Source: Google Maps and ConsultEcon, Inc.
Section VI
PRECEDENTS AND CASE STUDIES
This section provides an overview of African American and housing related museums and historic sites, and fifteen case studies on comparable institutions with elements of comparability with Poindexter Village. The overview of these African American related museums and historic sites; the individual institution profiles and the lessons learned will provide insights for the development of the proposed Poindexter Village
Museums dedicated to the African American experience have existed for over sixty years, but within the past two decades (1995 to 2015), the number of active African American museums has doubled. Within this time frame, the museums have grown not only in number but have generally evolved to be larger, accredited institutions with higher attendance; rather than the small, volunteer-run, heritage organizations model that were more typical, particularly in the Southern states. Geographically, African American related museums have spread from mostly southern locations to have a greater presence in the Mid-Atlantic, Mid-West, and the Western regions
The expansion and mainstreaming of the African American museum model across the United States is necessary and timely for education and fostering an understanding of African American history and culture. This expansion in the number, size and offerings of these institutions has occurred in parallel with an increased interest in the subject, which is best illustrated by the approximate 8.5 million visitors to the National Museum of African American History and Culture in Washington D.C. since its opening in 2016. 8 An important trend has been to have more narrowly focused institutions. New museums are opening that are specifically dedicated to slavery, the Jim Crow south, the civil rights movement, or to honor African Americans. Additionally, African American museums have augmented their museum roles by incorporating more public and community outreach to become essential
8 Smithsonian Newsdesk Visitor Statistics, 2016 to 2018: newsdesk.si.edu/about/stats. Note that this total accounts for 2022 as of July.
ConsultEcon, Inc. Management & Economic Insight February 14, 2023 Poindexter Village VI-1
organization in their communities. This is achieved by including flexible space that can be used for lectures, performances, meetings, etc.; and by creating programming and reaching out to the community
Overview of African American Museums
Following is an overview of museums dedicated to the African American experience including a chart of the number of museums that have opened and remain active today. There are now approximately 200 active African American museums in the United States These museums generally have themes including heritage, art and culture, personality, and or are topic specific slavery or civil rights. The complete list of active African American Museums can be found in Appendix A.
Public Housing Museums
Along with African American museums, housing is a popular topic for visitors Tourists are interested in gaining insight into the past through relatable experiences like housing. Visitors are able to make connections to their own lives through seeing historic homes and related to artifacts Typically, housing museums are smaller institutions memorializing an individual. However, there are larger institutions that celebrate many people including generations of families in a particular residential building or neighborhood. The Lower East Side Tenement Museum was founded in 1988, and it interprets the historical significance of multiple families and the Lower East Side’s history as a whole. It remains a popular attraction with 218,000 visitors per year. Housing museums continue to be built with an emphasis on the entire community like the newly opened National Housing Museum in Chicago, IL.
Location
There is a concentration of African American Museums in the Southern and Mid-Atlantic region of the United States. The Midwest and the West are less densely populated with African American Museums. Albeit, the vast majority of museums located in the south are
ConsultEcon, Inc. Management & Economic Insight February 14, 2023 Poindexter Village VI-2
relatively small, volunteer-run organizations, rather than the large scale, accredited, museums that have been more recently built.
Development Timeline
The first museum in the group of museums to open was the Old Slave Mart Museum in Charleston, South Carolina in 1938 For a few decades there were no additional museum openings but in the post-Civil Rights era there was a dramatic increase in museum openings. In the past two decades (1995 to 2015), the number of active African American museums has doubled, and more museums have opened in the in the 2020s There also has been a trend of renovations of older facilities in the past decade.
Museum Theme
The major themes for African American museums are Heritage, History, Culture, Art, Personality, and Civil Rights Heritage museums, which focus on general African American history, have been the most popular museum theme, and the first few opened in the 1960s in the era of the Civil Rights movement.
Museum Size
Referring to Table A-1, show a sample of African American Museums by facility size. The majority of African American Museums are below 65,000 SF There is one museum, the National Museum of African American History and Culture located in Washington D.C. that is larger than 200,000 SF. Generally, the African American Museum facility sizes are small to mid-sized in comparison to similar history and art museums in the United States.
Theme / Interpretive Focus
The majority of museums are heritage museums, which are classified as general museums dedicated to the African American experience. Museums dedicated to honoring the civil rights movement are predominantly in the south at significant sites of the movement
ConsultEcon, Inc. Management & Economic Insight February 14, 2023 Poindexter Village VI-3
Case Studies and Criteria for Comparable Institutions
Based on the industry review, there were many museums and institutions that could be comparable to Poindexter Village Fifteen institutions were selected for review: These fifteen institutions were selected based on the criteria below:
♦ Geographical location
♦ Content inclusive of African American history, housing, and/or historically significant churches
♦ Community-oriented facilities
♦ Physical characteristics of museum
♦ Resident and tourism market context
The museums profiled include:
♦ African American Historical Museum & Cultural Center of Iowa, Cedar Rapids, IA
♦ Albany Civil Rights Institute, Albany, GA
♦ Banneker-Douglass Museum, Annapolis, MD
♦ Evansville African American Museum, Evansville, IN
♦ Harriet Beecher Stowe House, Cincinnati, OH
♦ Ohio History Center, Columbus, OH
♦ Lower East Side Tenement Museum, New York, NY
♦ National Afro American Museum and Cultural Center, Wilberforce, OH
♦ National Public Housing Museum, Chicago, IL
♦ Northwest African American Museum, Seattle, WA
♦ Project Row Houses, Houston, TX
♦ Rebuild Foundation/Theaster Gates, Chicago, IL
♦ Riley House Museum of African American History & Culture, Tallahassee, FL
♦ Wing Luke Museum, Seattle, WA
♦ Zora Neale Hurston National Museum of Fine Arts, Eatonville, FL
ConsultEcon, Inc. Management & Economic Insight February 14, 2023 Poindexter Village VI-4
African American Historical Museum & Cultural Center of Iowa, Cedar Rapids, IA
The African American Historical Museum & Cultural Center of Iowa was chosen because it is a regional, African American history museum that has a strong oral history program The museum’s budget was $474,000 in 2019 with 10 full-time and 3 part-time paid employees. It is also under renovation, which demonstrates the continued investment and interest in the museum by the local community Refer to Figure VI-1 to see a rendering of the museum’s new exterior after renovation. The museum can serve as an example as Poindexter Village starts its own renovation process.
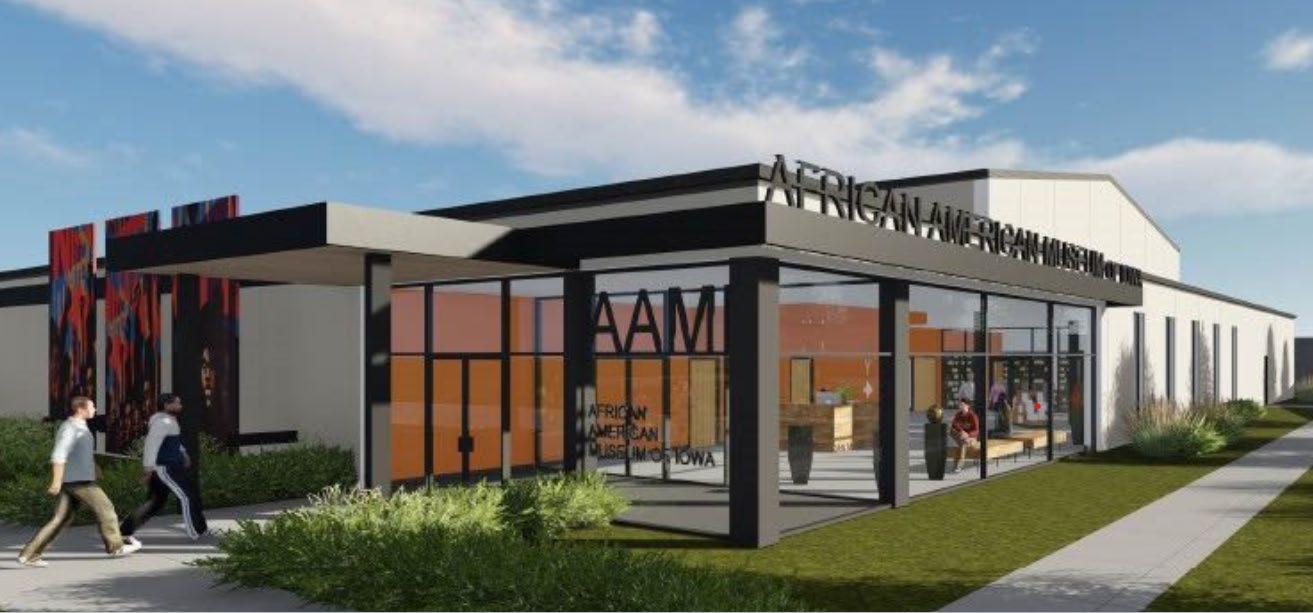
ConsultEcon, Inc. Management & Economic Insight February 14, 2023 Poindexter Village VI-5
Figure VI-1
African American Museum of Iowa Renovated Exterior Drawing
Source: African American Museum of Iowa Facility Website
Albany Civil Rights Institute, Albany, GA
Albany Civil Rights Institute is a museum about the civil rights movement. It is also housed in a historically significant church. The museum uses artifacts and the building itself to tell African American history. However, the use of the historic church has caused a limitation in space; the museum is only 12,000 SF. Refer to Figure VI-2 for a photograph of the museum’s interior In 2019, it had a budget of $340,000 with 1 full-time and 6 part-time paid staff. The museum charges $6 for adults and has a visitation of approximately 6,500 visitors per year This museum shares Poindexter Village’s challenge of utilizing limited space in a historic site while telling a regional and national history.
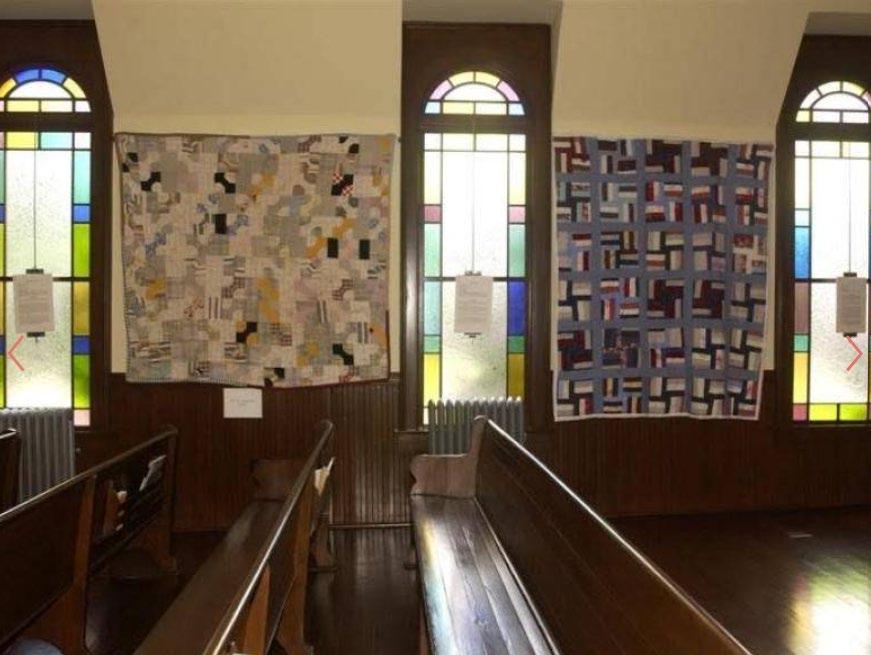
Source: Explore Georgia
ConsultEcon, Inc. Management & Economic Insight February 14, 2023 Poindexter Village VI-6
Figure VI-2
Albany Civil Rights Institute, Interior View
Banneker-Douglass Museum, Annapolis, MD
The Banneker-Douglass Museum is the state of Maryland’s official museum of African American Heritage The state transformed a historically significant church into the museum, and it focuses on the local history of the African American community. See Figure VI-3 for a photograph showing how the church’s exterior has been incorporated into the museum’s space The museum is state-run, so the budget is unknown. However, it has a support group that had a budget of $46,500 in 2020. The museum also does not charge admission because of its status as a state-run facility This museum has been able to effectively transform a historic church into a regional museum.
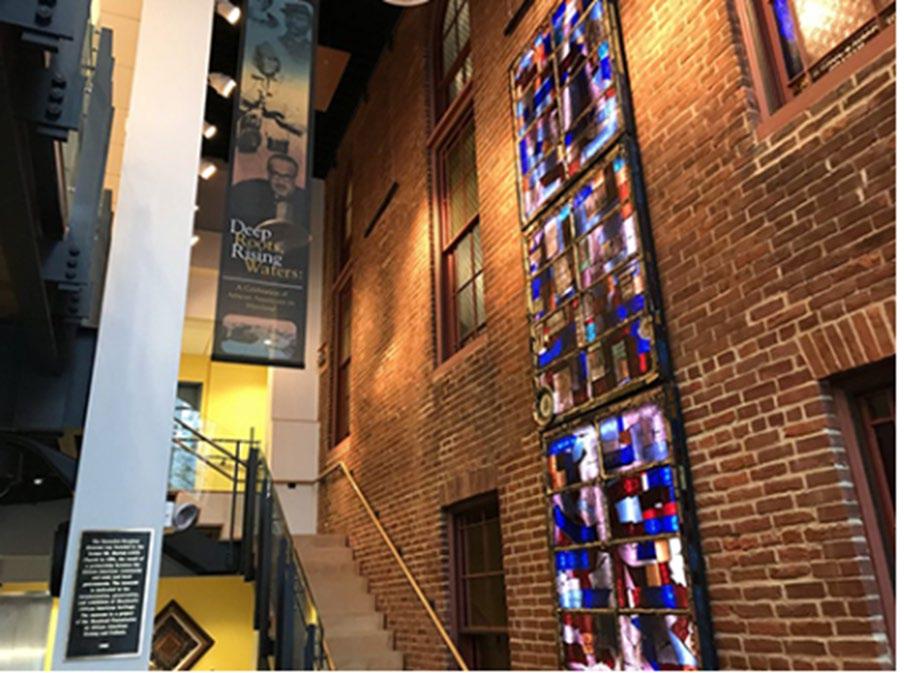
ConsultEcon, Inc. Management & Economic Insight February 14, 2023 Poindexter Village VI-7
Figure VI-3
Banneker-Douglass Museum Interior
Source: Banneker-Douglass Facility Website
Evansville African American Museum, Evansville, IL
The Evansville African American Museum is an African American museum located in a historically African American community in one of the nation’s first housing projects Refer to Figure VI-4 for the museum’s exterior that draws the visitor to the main entrance. In 2019, the museum had a budget of $392,000 with 2 full-time and 3 part-time staff. The museum received approximately 4,000 visitors per year The Evansville African American Museum and Poindexter Village both celebrate the history of public housing, especially within the context of African American history These museums are also regional in focus and are both located in the Midwest.
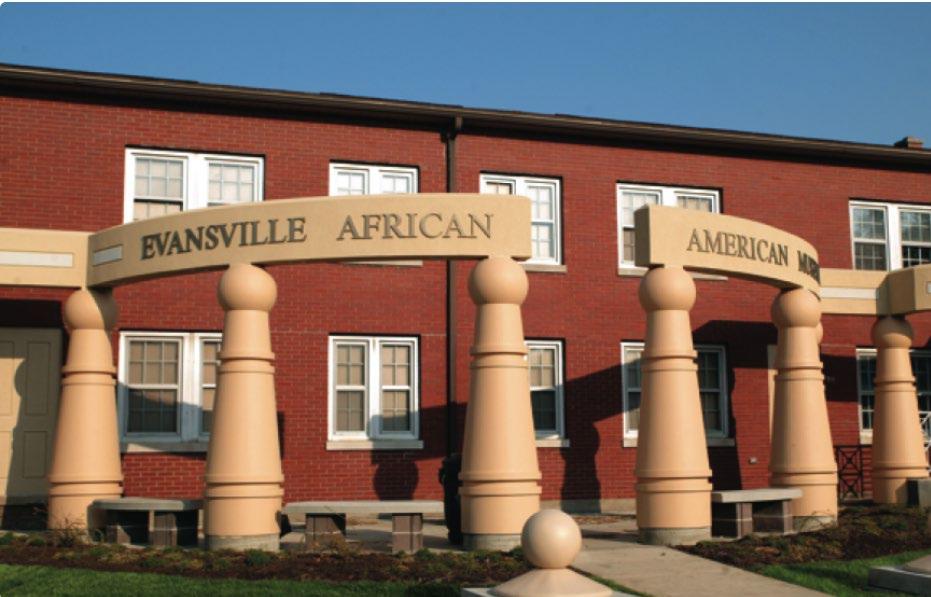
Source: Visit Evansville
ConsultEcon, Inc. Management & Economic Insight February 14, 2023 Poindexter Village VI-8
Figure VI-4
Evansville African American Museum Exterior
Harriet Beecher Stowe House, Cincinnati, OH
Harriet Beecher Stowe House is an Ohio Historic Connection’s historic site with African American interpretation It is a small historic home with only 3,900 SF of total space. In 2020, the museum’s budget was $107,000 with 1 full-time and 4 part-time paid staff. The museum charges $6 for admission. The museum drew 4,900 visitors in 2020. Poindexter Village and Harriet Beecher Stowe House are two historic residencies with limited space for interpretation.
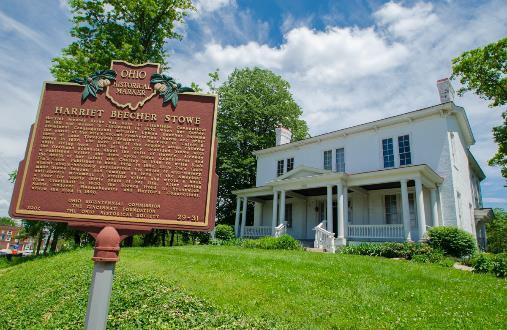
Source: cincinnatirefined.com
ConsultEcon, Inc. Management & Economic Insight February 14, 2023 Poindexter Village VI-9
Figure VI-5
Harriet Beecher Stowe House Museum Exterior
Ohio History Center, Columbus, OH
The Ohio History Center is a state history museum with an outdoor village, which has exhibits and programs The Ohio History Center is an Ohio History Connection site with an annual visitation of 109,000 visitors in 2016. It charges $16 for admission and has a significantly large facility size at 278,000 SF. While Poindexter Village is significantly smaller and was not originally built to be a museum, the Ohio History Center is also managed by the Ohio History Connection and is located in the same city.
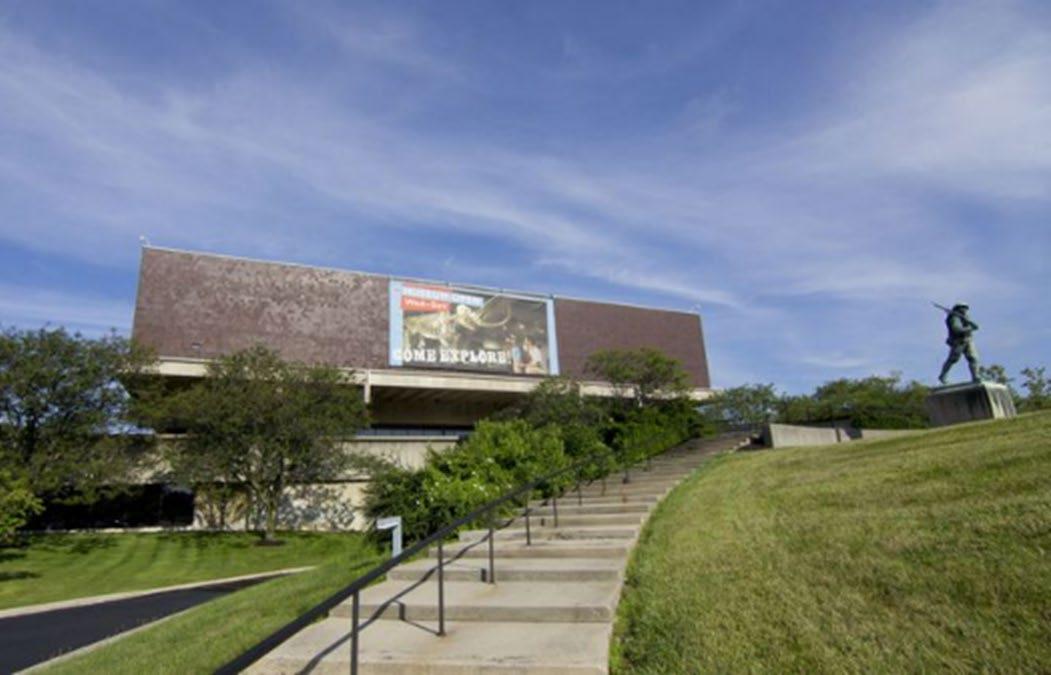
ConsultEcon, Inc. Management & Economic Insight February 14, 2023 Poindexter Village VI-10
Figure VI-6
Ohio History Center Exterior
Source: Smithsonian Magazine
Lower East Side Tenement Museum, New York, NY
The Lower East Side Tenement Museum uses historic tenements to tell the story of working-class residents in New York City In 2020, the museum had a budget of $10.4 million with 58 full-time and 81 part-time paid staff. The museum charges $30, which is largely due to its market context in New York city. The museum draws 218,000 visitors per year The museum and Poindexter Village both have historic sites that tell the story of public housing. While the market context may differ, Poindexter Village can glean from the Lower East Side Tenement Museum’s ability to utilize a small amount of space to tell a regional and national story.
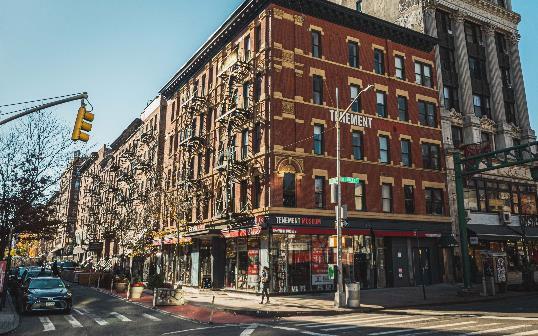
Source: tripsavvy.com
ConsultEcon, Inc. Management & Economic Insight February 14, 2023 Poindexter Village VI-11
Figure VI-7
The Lower East Side Tenement Museum Exterior
National Afro American Museum and Cultural Center, Wilberforce, OH
National Afro American Museum and Cultural Center is also an Ohio History Connection museum that interprets African American history locally and nationally Poindexter Village is under the museum in the Ohio History Connection’s organization chart. The museum has 7 full-time and 1 part-time paid staff and an admission price of $6. It draws approximately 2,000 visitors per year While the National Afro American Museum and Cultural Center differs in scale and was built to serve as a museum, Poindexter Village can look to the museum for its interpretation and as another museum managed under the Ohio History Connection.
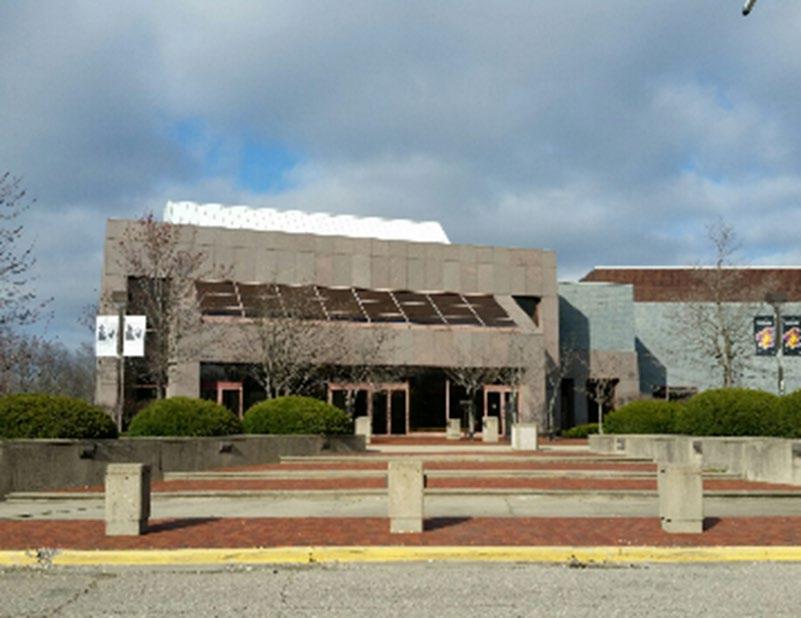
Source: artsinohio.com
ConsultEcon, Inc. Management & Economic Insight February 14, 2023 Poindexter Village VI-12
Figure VI-8
National Afro American Museum and Cultural Center Museum Exterior
National Public Housing Museum, Chicago, IL
The National Public Housing Museum is a museum that tells the story of public housing in the United States In 2019, it had a budget of $415,000 and had 2 full-time and 1 part-time paid staff. It is a newly built facility with 80,800 SF of total space. Despite the museum’s size, Poindexter can look to the museum’s incorporation of community stories to tell the story of public housing on a local and national scale.
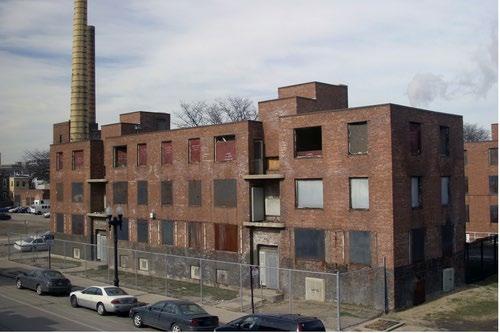
ConsultEcon, Inc. Management & Economic Insight February 14, 2023 Poindexter Village VI-13
Figure VI-9
The National Building Museum Exterior
Source: National Public Housing Museum Facility Website
Northwest African American Museum, Seattle, WA
The Northwest African American Museum is an African American history and culture museum that is community-oriented in its interpretation and events The museum is the former Colman School building. In 2019, it had a budget of $1.2 million and 8 full-time and 4 part-time paid staff. The museum’s annual visitation is 20,500 visitors. It is currently under renovation will reopen on Martin Luther King, Jr. Day in 2023 Like Poindexter Village, the Northwest African American Museum has transformed a historic site and interprets local African American history with a focus on community engagement.
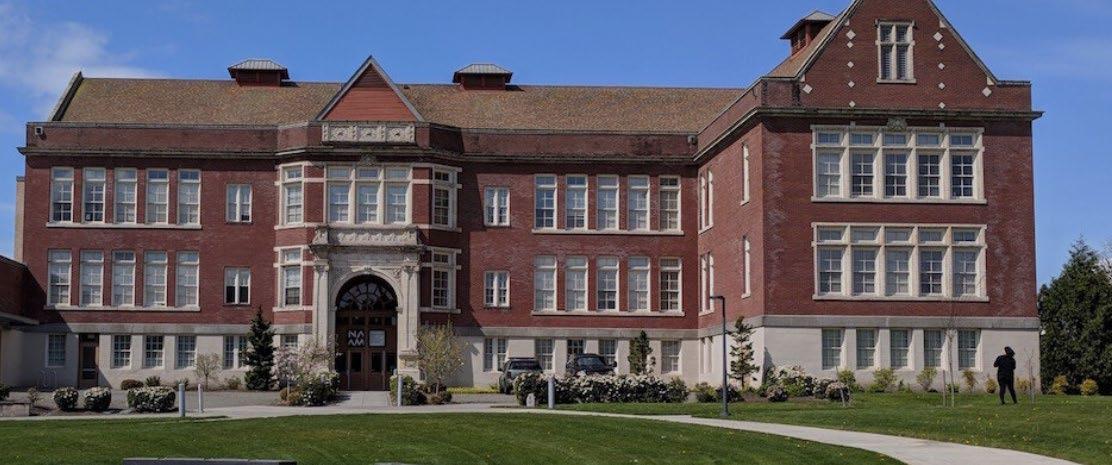
Source: Northwest African American Museum Facility Website
Project Row Houses, Houston, TX
Project Row Houses is a community platform for art and neighborhood development. There is an emphasis on cultural identity and its impact on the urban landscape It is located in one of the city’s oldest African American neighborhoods encompassing 5 city blocks and houses 39 structures as a center for community-enriching activities like art programs and neighborhood development activities Like Poindexter Village, Project Row Houses is in a historically African American neighborhood and supports community enrichment.
ConsultEcon, Inc. Management & Economic Insight February 14, 2023 Poindexter Village VI-14
Figure VI-10
The Northwest African American Museum Exterior
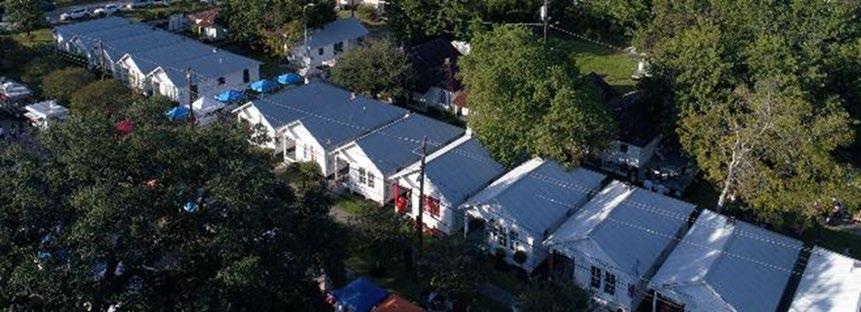
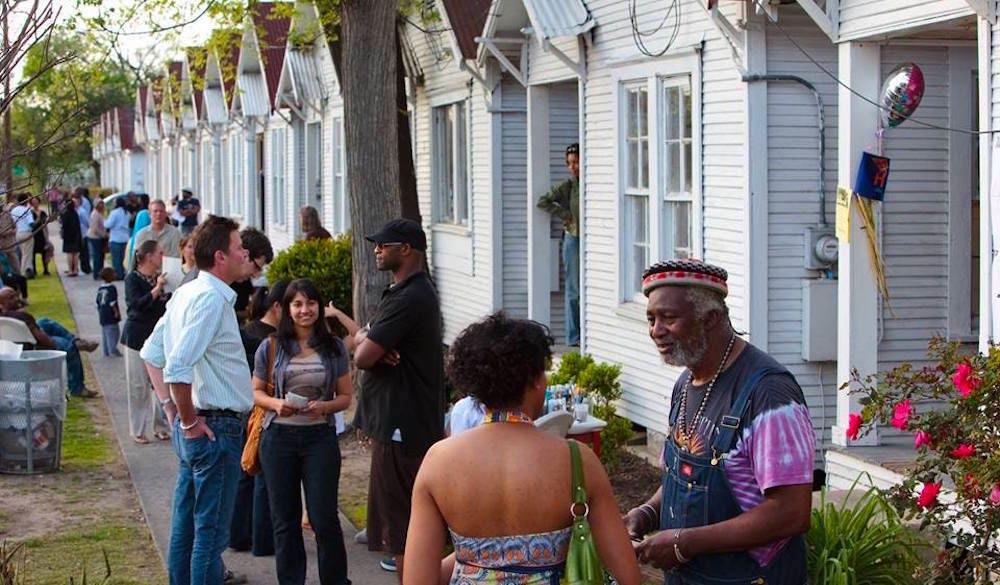
ConsultEcon, Inc. Management & Economic Insight February 14, 2023 Poindexter Village VI-15
Figure VI-11
Project Row Houses Exterior
Source: Project Row Houses Facility Website
Figure VI-12
Project Row Houses Community Engagement
Source: Project Row Houses Facility Website
Rebuild Foundation/Theaster Gates, Chicago, IL
Rebuild Foundation/Theaster Gates is an artist-led, community-based platform for art, cultural development, and neighborhood transformation The Rebuild Foundation’s projects support artists and strengthen communities thorough creating cultural amenities, free art programming, and developing affordable housing, studio, and live-work space. It supports African American communities, especially in creative endeavors like the arts.
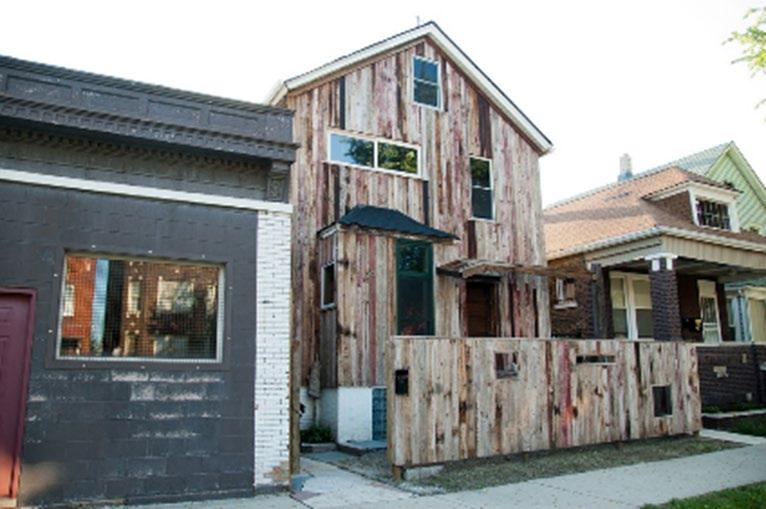
ConsultEcon, Inc. Management & Economic Insight February 14, 2023 Poindexter Village VI-16
Figure VI-13
Rebuild Foundation/Theaster Gates Exterior
Source: burnaway.org
Riley House Museum of African American History & Culture, Tallahassee, FL
Riley House Museum of African American History & Culture is an African American house museum that uses connected space (The Smokey Hollow Commemoration) for its programming. It only has 900 SF of exhibit space, but it has added an adjacent outdoor space for community programming and interpretation. In 2019, the museum had a budget of $463,000 and 3 full-time and 2 part-time paid employees The museum charges $5 for admission and draws approximately 8,000 visitors annually. Poindexter Village can look to the Riley House Museum of African American History & Culture as a historic house with limited interior space that has been able to creatively expand its interpretation space.
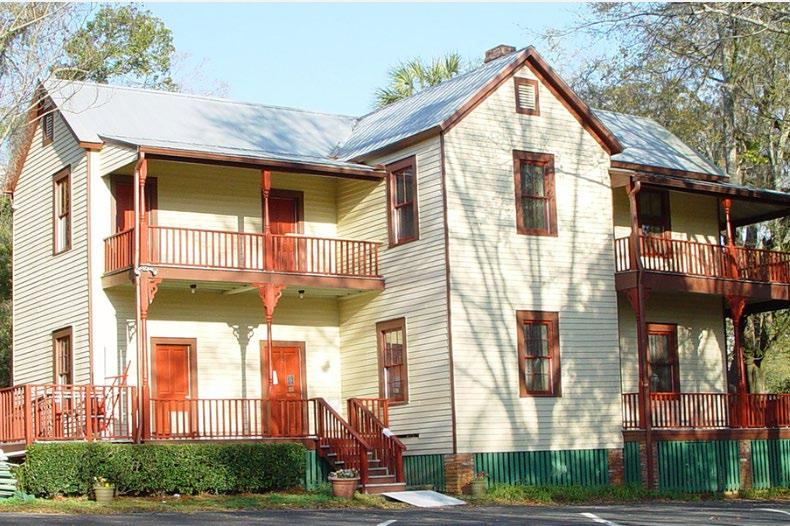
ConsultEcon, Inc. Management & Economic Insight February 14, 2023 Poindexter Village VI-17
Figure VI-14
Riley House Museum of African American History & Culture Exterior
Source: Visit Tallahassee
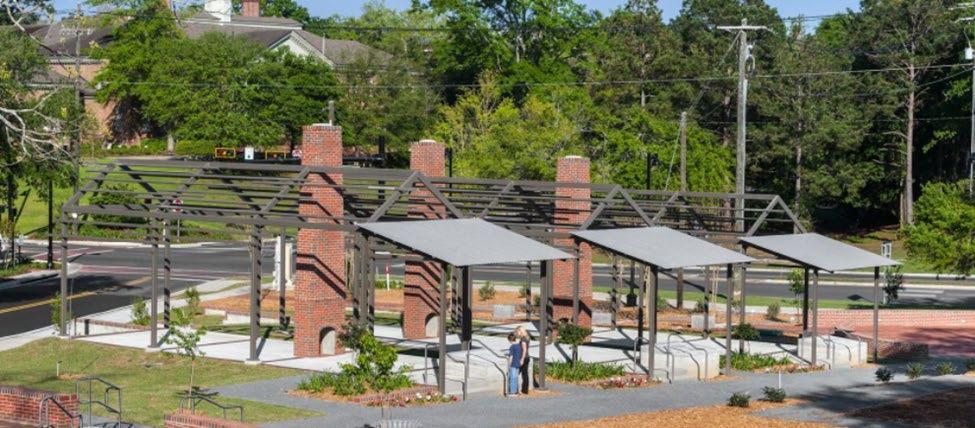

ConsultEcon, Inc. Management & Economic Insight February 14, 2023 Poindexter Village VI-18
Figure VI-15
Smokey Hollow Commemoration
Source: Architect Magazine
Figure VI-16
Smokey Hollow Commemoration Sideview
Source: Architect Magazine
Wing Luke Museum, Seattle, WA
The Wing Luke Museum is a smaller museum with a neighborhood approach to interpretation The museum tells stories of Asian American, Native Hawaiian, and Pacific Islanders within the context of the local neighborhood. The facility is 60,000 SF and charges $17 for general admission. In 2019, the museum had a budget of $2.8 million with 14 full-time and 7 part-time paid employees The museum attracts 45,000 visitors annually Like Poindexter, it tells the story of minorities within a local context.
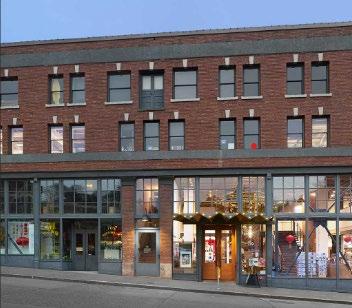
Source: Seattle Attractions
ConsultEcon, Inc. Management & Economic Insight February 14, 2023 Poindexter Village VI-19
Figure VI-17
Wing Luke Museum Exterior
Zora Neale Hurston National Museum of Fine Arts, Eatonville, FL
The Zora Neale Hurston National Museum of Fine Arts is a gallery space for artists of African descent It is the only venue within 400 miles that showcases work of from Africa and/or the Diaspora. It has presented nearly fifty exhibitions since 1990. Like Poindexter Village, it is dedicated to advocating for African American creativity, especially in the arts.
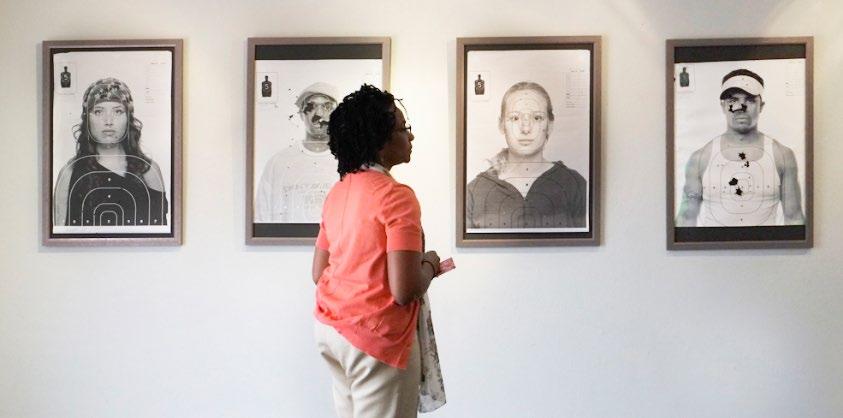
Source: Facility Website
Comparable Institutions Summary
Currently in the United States, there are approximately 200 institutions and museums dedicated to the African American Experience These Museums have gained traction in the mainstream in the recent decade from 1990 to 2010 the number of openings doubled the initial number since the first museum opened in 1938.
Specifically, in the Midwestern region, there are only a few African American museums; most are concentrated in the mid-Atlantic and Southern region of the country. Poindexter Village has an opportunity to fill a niche nationally by creating a museum focused on the Central Ohio African American community and public housing. The following case studies were selected for their geographic context, museum content and format, project
ConsultEcon, Inc. Management & Economic Insight February 14, 2023 Poindexter Village VI-20
Figure VI-18
Zora Neale Hurston National Museum of Fine Arts Gallery
development, and size of facility, and onsite attendance. Additionally, the Charles H. Wright and DuSable Museum are located in the Midwest, and they are among the original U.S. African American museums The most recent African American museums are Niagara Falls Underground Railroad Museum (2018), The Legacy Museum (2018), and the National Museum of African American Music (2019). These museums are more narrow in focus unlike institutions that have opened up earlier.
Along with African American museums, housing is a popular topic for visitors. Tourists are interested in gaining insight into the past through relatable experiences like housing Visitors are able to make connections to their own lives through seeing historic homes and related to artifacts. There are a plethora of house museums memorializing individuals but public housing for communities is also of interest to visitors. Institutions related to housing included in the case studies are:
♦ Harriet Beecher Stowe House, Cincinnati, OH
♦ Lower East Side Tenement Museum, New York, NY
♦ National Public Housing Museum, Chicago, IL
♦ Riley House Museum of African American History & Culture, Tallahassee, FL
All fifteen institutions and museums are well established in their respective cities and are successful in attracting attendance and revenues.
The selected comparable institutions:
♦ African American Historical Museum & Cultural Center of Iowa, Cedar Rapids, IA
♦ Albany Civil Rights Institute, Albany, GA
♦ Banneker-Douglass Museum, Annapolis, MD
♦ Evansville African American Museum, Evansville, IN
♦ Harriet Beecher Stowe House, Cincinnati, OH
♦ Ohio History Center, Columbus, OH
♦ Lower East Side Tenement Museum, New York, NY
♦ National Afro American Museum and Cultural Center, Wilberforce, OH
ConsultEcon, Inc. Management & Economic Insight February 14, 2023 Poindexter Village VI-21
♦ National Public Housing Museum, Chicago, IL
♦ Northwest African American Museum, Seattle, WA
♦ Project Row Houses, Houston, TX
♦ Rebuild Foundation/Theaster Gates, Chicago, IL
♦ Riley House Museum of African American History & Culture, Tallahassee, FL
♦ Wing Luke Museum, Seattle, WA
♦ Zora Neale Hurston National Museum of Fine Arts, Eatonville, FL
The institutions all operate on fairly lean budgets, varying from $107,000 to $10.0 million dollars in operating expenses with the majority of budgets being less than $1.0 million annually These budgets support upwards of 3,900 square feet and 4,900 guests per year These nonprofit institutions are substantially reliant on donations, grants and/or government funding because their earned revenues do not cover their operating costs which is typical of history and cultural museums Additionally, these organizations have a prominent place in their city and often offer special events like concerts, lectures and meetings, offer school-age programming, and do community outreach in addition to traditional museum operations
Based on the existing market in the Midwest and the reviewed comparable institutions, it is likely that Poindexter Village will be able to achieve market success, due to the importance and relevance of its content, its niche position, and due to its prominence in the Columbus community.
Summary and Conclusions
Within the past two decades, the number of African American focused museums has increased dramatically. In the era of the Civil Rights Movement there was an increase in the number of African American focused museums these were general heritage and culture museums However, more recently narrowly focused museums have opened dedicated solely to the Civil Rights Movement, Slavery, Jim Crow South, or notable African American Americans. Also, there is a proven interest in house museums demonstrated by individual
ConsultEcon, Inc. Management & Economic Insight February 14, 2023 Poindexter Village VI-22
house museums and larger community housing museums like the Lower East Side Tenement Museum. This trend of narrowed focus and interest in public housing bodes well with the proposed Poindexter Village because there are many African American museums currently open in the U.S., so it is important that Poindexter Village be differentiated and offer important and compelling content and programs.
ConsultEcon, Inc. Management & Economic Insight February 14, 2023 Poindexter Village VI-23
Section VII
ALTERNATIVE DEVELOPMENT SCENARIOS
Based on the market analysis, current museum concept and programming, and community outreach and engagement conducted by OHC and Renter Mentor, OHC and the consultant team identified two alternative development scenarios for future operations evaluation and comparative purposes:
♦ Scenario #1: Renovating Building 1 and Building 2
♦ Scenario #2: Renovating Building 1 and 2 with Union Grove Partnership
Data in Table VII-1 shows the program of spaces for two alternative development scenarios.
Total building area for alternative development scenarios are as follows:
♦ Scenario #1: 16,800 total square feet
♦ Scenario #2: 11,600 total square feet
Total Construction Cost
Based on comparable projects completed by OHC, and average per square foot construction cost is used to evaluate the magnitude of scale of total construction cost for the alternative development scenarios As shown by data in Table VII-2, total construction costs are estimated at:
♦ Scenario #1: $5.46 million
♦ Scenario #2: $4.35 million
Construction cost materials and labor inflation has been high in recent years, and so these construction cost estimates are for illustrative and conceptual purposes only and subject to architectural and exhibit design and cost estimating.
ConsultEcon, Inc. Management & Economic Insight February 14, 2023 Poindexter Village VII-1
ConsultEcon, Inc. Management & Economic Insight February 14, 2023 Poindexter Village VII-2
Table VII-1
Poindexter Village Program Areas Public or Non-Public Scenario #1 with Union Grove Scenario #2 without Union Grove Difference between Scenarios #1 and #2 Building 1 Gallery Public 4,440 3,690 750 Temporary Gallery Public 750 Total Building 1 4,440 4,440 750 Building 2 Digital Lab (1st and 2nd) Public 1,430 1,430 0 Research Center Public 715 715 0 Library/Archive Storage (2nd Floor) Non-Public 1,430 1,430 0 Coworking Space Non-Public (members?) 715 715 0 Offices/Meeting Rooms (1st and 2nd) Non-Public 1,430 1,430 0 Classroom 0 750 -750 Theater Public 750 0 750 Total Building 2 6,470 6,470 0 Union Grove Temporary Gallery Public 1,600 0 1,600 Classroom Public 1,000 0 1,000 Kitchen Non-Public 480 0 480 Performing Space Public 1,600 0 1,600 Total Union Grove 4,680 0 4,680 Visitor Center Gift Shop Public 600 300 300 Restrooms Public 600 400 200 Total Visitor Center 1,200 700 500 TOTAL INTERIOR BUILDING SF 16,790 11,610 5,930
Square Feet
Programs of Spaces Alternative Development Scenarios
Source: Ohio History Connection and ConsultEcon, Inc.
Illustrative and Conceptual Construction Cost Estimates
Alternative Development Scenarios
Poindexter Village
Program Area
Scenario #1 with Union Grove
Scenario #2 without Union Grove
Total Building Area 16,790 11,610
Assumed Construction
Cost per Square Foot 1/ $325 $375
Total Construction Cost (Rounded) $5,460,000 $4,350,000
1/ Source: Ohio History Connection comparable project costs.
Source: Ohio History Connection and ConsultEcon, Inc.
Summary
There are two alternative development scenarios evaluated in this analysis They range in size and scale of total building area and total estimated construction cost. As planning and design advances, the program of spaces and operating potential of the proposed Poindexter Village development will need to be revisited and updated,
ConsultEcon, Inc. Management & Economic Insight February 14, 2023 Poindexter Village VII-3
Table VII-2
Section VIII
ATTENDANCE AND OPERATING POTENTIAL
The evaluation of attendance and operating potential of alternative development scenarios for Poindexter Village is based on: the proposed program, interpretive and architectural concepts and plans and construction cost budget for the project established by the Ohio History Connection (OHC); the size and characteristics of the resident and tourist markets; the location of the Poindexter Village in Columbus; the competitive context in the Columbus region as a whole; the experience of the historic site and museum industries as a whole, including the experience of local cultural and heritage attractions and precedents in comparably sized metro markets
Attendance and Operating Assumptions
As a non-profit heritage attraction and educational organization, Poindexter Village will operate under the norms of such facilities nationally, adjusted for local conditions. As a department within a museum in the OHC system, Poindexter Village will benefit from the organization’s existing operations which will offer administrative, marketing, and fundraising support to sustain the Poindexter Village operation. Operating assumptions used in this analysis are as follows:
♦ Poindexter Village is assumed to operate as a department of the National Afro American Museum, which is part of the OHC system of historic sites and museums As such, this analysis does not include any property or corporate taxes, nor does it include depreciation, bond or mortgage payments, or management fees. It focuses on estimating net operating revenue.
♦ Poindexter Village renovations and any new facilities will be well designed and constructed. It will be of a scale in size and in quality to be recognized as a must-see attraction in Columbus For analytical purposes, this operations analysis is based on the preliminary project description in Section VII.
♦ The visitation and operations analyses focus on comparing future stable year of operations for each of the alternative scenarios.
♦ Poindexter Village will be open year-round, five or six days a week, closed also for major holidays, including Thanksgiving and Christmas Day.
ConsultEcon, Inc. Management & Economic Insight February 14, 2023 Poindexter Village VIII-1
♦ Poindexter Village will be open between 9 am and 5 or 6 pm. In addition, special events and facility rentals will occur after-hours at the facility when they do not disrupt regular visitation or programs.
♦ Poindexter Village will have the appropriate staff infrastructure to support project development, implementation and operations. The facility, its exhibits, finishes, mechanical equipment and support systems will be well maintained to minimize insurance risks and unexpected repair and maintenance expenditures. Maintaining the exhibits, program materials, grounds, and facility in excellent condition is key to customer satisfaction The facility will be used for facility rentals, special events and cultural activities after hours to promote community engagement and generate additional revenue. Educational groups will be encouraged to visit and will receive a worthwhile and enjoyable educational experience. Community outreach and collaborations with other organizations will be cornerstones of the programming effort.
♦ Poindexter Village will develop an aggressive marketing program to achieve and maintain attendance and interest. Pricing for programs and experiences will be commensurate with the overall experience and value delivered. The Poindexter Village will also provide dynamic, repeatable and effective educational programs and engaging, entertaining and continually evolving interpretive content Changing programs and exhibits are essential to attracting new visitors and to maintaining repeat visitation.
♦ Poindexter Village will operate on a schedule of changing exhibitions, interpretive and educational programming, events and community outreach that will be further explored in subsequent exhibit and architectural design planning.
Annual Visitation
Data in Table VIII-1 show the estimated annual visitation in a stable year of operations for the alternative development scenarios. Stabilized visitation levels are typically achieved in the second or third year after project opening Based on the assumptions in this report and the current stages of project design and development, a preliminary range of visitation potential for the alternative development scenarios has been established. The evaluation of visitation potential identified for the project is the mid-range of a range of market response, but it also reflects the project program/scale, the characteristics and size of the resident market population base as well as the characteristics of the available tourism markets. Data in Table VIII-2 provide a summary of the visitation by type.
ConsultEcon, Inc. Management & Economic Insight February 14, 2023 Poindexter Village VIII-2
ConsultEcon, Inc. Management & Economic Insight February 14, 2023 Poindexter Village VIII-3
Assumptions by
Type of Visit Weeks per Year Days per Week Events per Day Avg. Visits Per Program Total Visits Walk in Visits 1/ Self-Guided Tour 50 5 1 20 5,000 Guided Tour 50 5 2 10 5,000 Scheduled Visits School Group 12 4 2 30 2,880 Other Group 50 2 1 15 1,500 Program Visits Gatherings 12 1 1 50 600 Events 3 1 1 200 600 Cultural Learning Center Geneaology 50 5 1 1 250 Co-Working / Incubation Digital Collections Lab To be determined based on future program planning Oral History Studio and community outreach Other Visits Facility Rentals 50 1 1 30 1,500 Total Visits, Mid Range 17,330 Vistation Range (rounded) Low Range -20% 13,900 Mid Range 17,300 High Range 20% 20,800 1/ Assumed to be open approximately 50 weeks per year, 5 days per week. Source: ConsultEcon, Inc.
Table VIII-1 Visitation
Type in a Stable Year of Operations Alternative Development Scenarios Poindexter Village
Summary Annual Visitation by Type in a Stable Year of Operations Alternative Development Scenarios
Poindexter Village
Alternate Scenarios
1/ Does not include Outreach - i.e. participants in off-site programs.
2/ Geneology program only. Additional program visitation to be determined. Source: ConsultEcon, Inc.
Selected Operating Assumptions
Data in Table VIII-3 show selected pro forma operating assumptions for the alternative development scenarios.
ConsultEcon, Inc. Management & Economic Insight February 14, 2023 Poindexter Village VIII-4
Table VIII-2
Visitation by Type 1/ Scenario #1 with Union Grove Scenario #2 without Union Grove Scenario #2 as a Percent of Scenario #1 Walk in 10,000 7,500 75% Group 4,380 2,190 50% Programs 1,200 600 50% Cultural Learning Center 2/ 250 250 100% Facility Rental 1,500 750 50% Total Visitors 17,330 11,290 Percent to Total Visitors Walk in 58% 66% Group 25% 19% Programs 7% 5% Cultural Learning Center 1% 2% Facility Rental 9% 7% Total Visitors 100% 100%
Table VIII-3
Selected Pro Forma Operating Assumptions in a Stable Year of Operation Alternative Development Scenarios
Poindexter Village
Source: Ohio History Connection and ConsultEcon, Inc.
Per Capita Revenue
Data in Table VIII-4 provide assumptions about per capita sources of revenue, including all earned revenue (program) sources of revenue and the donation box collections. Contributed revenue from OHC is not include in the table but is assumed to provide the difference between revenue generated onsite and the operating budget.
ConsultEcon, Inc. Management & Economic Insight February 14, 2023 Poindexter Village VIII-5
Scenario #1 with Union Grove Scenario #2 without Union Grove Total Building Area 16,790 11,610 Total Visitors 17,330 11,290 Onsite Staff 4.50 3.50 Average Full Time Equivalent Salary $48,000 $49,000 Alternate Scenarios
ConsultEcon, Inc. Management & Economic Insight February 14, 2023 Poindexter Village VIII-6
Poindexter Village Avg. Price Basis Scenario #1 with Union Grove Scenario #2 without Union Grove Earned Revenue Admissions Fees $8.00 General Admission 10,000 7,500 Group $4.00 School Group 4,380 2,190 Programs $10.00 Other Group 1,200 600 Event Rentals $15.00 Building Use 1,500 750 Gift Shop Income, Net $1.25 Total Visitors 17,330 11,290 Donation Box $1.00 Total Visitors 17,330 11,290 Earned Revenue Total Earned Revenue Admissions Fees $80,000 $60,000 Group 17,520 8,760 Programs 12,000 6,000 Event Rentals 22,500 11,250 Gift Shop Income, Net 21,663 14,113 Donation Box 17,330 11,290 Total Earned Revenue $171,013 $111,413 Source: ConsultEcon, Inc. Alternate Scenarios Earned Revenue Factors
Table VIII-4 Per Capita Earned Revenue Assumptions in a Stable Year of Operations in Current Dollars Alternative Development Scenarios
Illustrative Staffing Profile
Data in Table VIII-5 show the staffing requirement for the alternative development scenarios. The staff is assumed to be focused on site operations and that OHC administrative, fundraising and marketing, among other, staff would be employed to support and sustain the operations of Poindexter Village.
Illustrative Staffing Profile and Personnel Cost Assumptions in Current Dollars
1/ Average based on mix of positions and average salaries for each position as reported in the American Alliance of Museum's Salary Survey, 2017. Salaries increased to reflect 20 percent inflation between 2017 and 2023.
Source: ConsultEcon, Inc.
ConsultEcon, Inc. Management & Economic Insight February 14, 2023 Poindexter Village VIII-7
Table VIII-5
Alternative Development Scenarios Poindexter Village Positions Scenario #1 with Union Grove Scenario #2 without Union Grove Executive Director 1.00 1.00 Programs / Marketing Coordinator 1.00 0.50 Facilities / Maintenance / Custodial Coordinator 0.50 0.50 Events / Facility Rental 1.00 0.50 Educator 1.00 1.00 Total FTE 4.50 3.50 Average Salary per FTE (rounded) $57,000 $59,000 Personnel Costs 1/ Total Salaries / Wages $258,000 $207,600 Taxes / Fringe / Benefits Rate @ 25% of salaries 64,500 51,900 Total Salaries and Taxes / Fringe / Benefits $322,500 $259,500
Alternate
Scenarios
Operating Expenses
Data in Table VIII-6 show the estimated operating expenses for the alternative development scenarios.
Table VIII-6
ConsultEcon, Inc. Management & Economic Insight February 14, 2023 Poindexter Village VIII-8
Estimated Operating Expenses in a Stable Year of Operations in Current Dollars Alternative Development Scenarios Poindexter Village Types of Expenses Amount Unit Scenario #1 with Union Grove Scenario #2 without Union Grove Staff in FTE 4.50 3.50 Building Area 16,790 11,610 Visitation 17,330 11,290 Personnel (Friends Only) Salaries and Wages $258,000 $207,600 Taxes, Fringe and Benefits 64,500 51,900 Total Personnel $322,500 $259,500 Other Costs Direct Program Costs $1.00 per Program Visit $1,200 $600 Changing Exhibits budget 15,000 12,000 Exhibit Maintenance / Reinvestment $1.00 per Attendee 17,330 11,290 Professional Fees $1,500 per FTE 6,750 5,250 Utilities $2.00 per SF 33,580 23,220 Maintenance $1.00 per SF 16,790 11,610 Janitorial $1.00 per SF 16,790 11,610 Grounds budget 10,000 8,000 Insurance $1.00 per SF 16,790 11,610 Marketing $1.00 per Attendee 17,330 11,290 Office Costs $750 per FTE 3,375 2,625 Training and Development $500 per FTE 2,250 1,750 Misc. Costs 10% of operating costs 15,719 11,086 Total Other Friends Costs $172,904 $121,941 Total Operating Expenses $495,404 $381,441 Source: ConsultEcon, Inc. Alternate Scenarios
Net Operating Income
Data in Table VIII-7 show a summary of revenue and expenses for the alternative development scenarios
Table VIII-7
Summary of Revenue and Expenses in a Stable Year of Operations in Current Dollars Baseline and Alternative Development Scenarios
1/ The difference between the estimated operating expenses and the revenue potential. There is assumed to be potential to increase sources of contributed, non-earned revenue, such as government and private gifts, OHC and other grants, in-kind and other donations, and proceeds from investments and interest, above the amounts included in this analysis.
Source: ConsultEcon, Inc.
ConsultEcon, Inc. Management & Economic Insight February 14, 2023 Poindexter Village VIII-9
Poindexter Village Scenario #1 with Union Grove Scenario #2 without Union Grove Total Visitation 17,330 11,290 Revenue Earned Revenue $171,013 $111,413 Contributed and Other Revenue 324,388 269,988 Total Revenue $495,400 $381,400 Operating Expenses $495,400 $381,400 Net Operating Income 1/ $0 $0 Alternate Scenarios
Cost and Benefits of Alternative Development Scenarios
Data in Table VIII-8 summarize costs of the project, including construction costs, staffing requirement, and operating budget
Table VIII-8
Poindexter
Source: Ohio History Connection (OHC) and ConsultEcon, Inc.
ConsultEcon, Inc. Management & Economic Insight February 14, 2023 Poindexter Village VIII-10
Summary of Costs in a Stable Year of Operations in Current Dollars Alternative Development Scenarios Poindexter Village Scenario #1 with Union Grove Scenario #2 without Union Grove Construction $5,460,000 $4,350,000 Staff 4.5 3.5 Operations
Alternate Scenarios
Village $495,000 $381,000
Benefits
In addition to the above costs, the project will provide in the following benefits.
♦ Capitalization of OHC
♦ New visitation and audiences for OHC historic sites and museums
♦ New operating revenues to OHC (and potentially the James Preston Poindexter Foundation, depending on their mission, capacity, programs developed, costs and funding availability)
o Earned revenue growth
o Contributed revenue growth
♦ Improved educational offerings for Columbus and Ohio residents
♦ Community pride, quality of life amenity / community resource
♦ New city and regional tourism offering focused on African American arts, culture and heritage
♦ Promotion of community cohesion, diversity and inclusion
♦ Opportunity to preserve and revitalize Union Grove while expanding OHC sites, facilities and programming
♦ Opportunity to develop community tours, events, programs and partnerships with neighborhood African American arts, culture, and heritage organizations to tell a comprehensive story, expand audiences and community impact
♦ Community, city and state partnership and investment in the future of Columbus’ historic African American neighborhood that has experienced sustained disinvestment over the past century
Summary
Based on the proposed visitor experience, programs and events, Poindexter Village has the potential to increase visitation, revenues, staffing, and overall operations for OHC. Poindexter Village needs sufficient capital and operating support from OHC to become a sustainable operation that has the capacity to achieve the mission and vision for the project The renovation of the historic structures and creation of museum and cultural learning center will appeal to multiple audience segments, residents and tourists, African American and nonAfrican American.
ConsultEcon, Inc. Management & Economic Insight February 14, 2023 Poindexter Village VIII-11
Appendix A
ACTIVE AFRICAN AMERICAN MUSEUMS
Table A-1
List of Active African American Museums
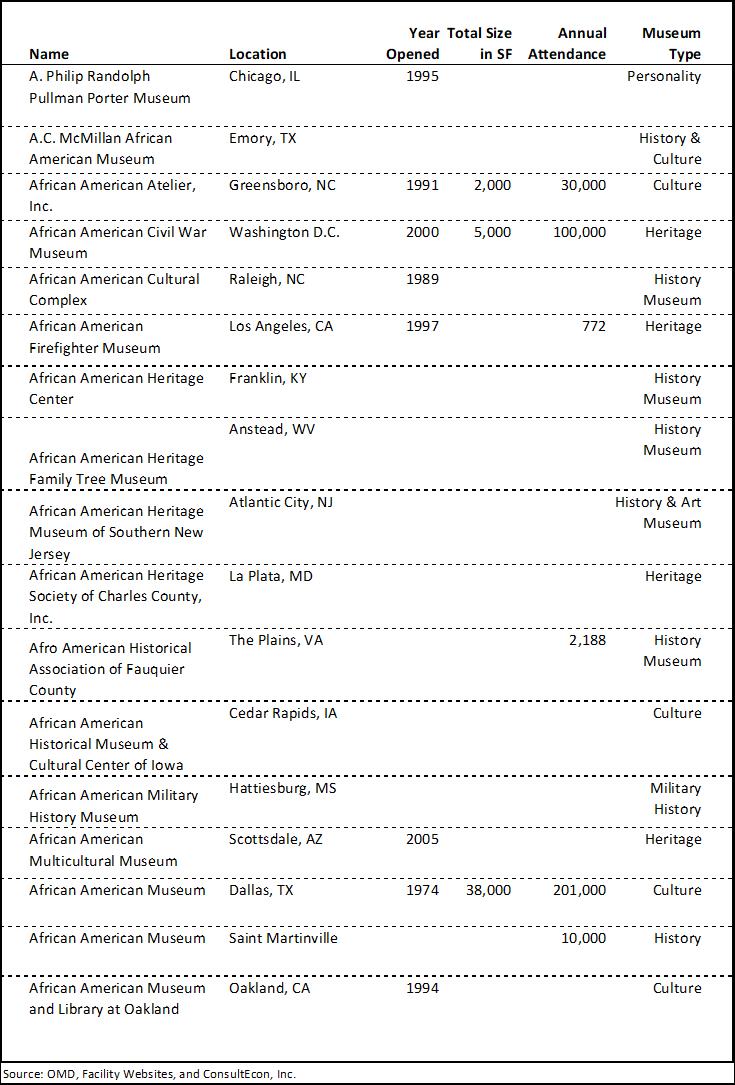
ConsultEcon, Inc. Management & Economic Insight February 14, 2023 Poindexter Village A-1
Source:
Table A-1 (continued)
List of Active African American Museums
ConsultEcon, Inc. Management & Economic Insight February 14, 2023 Poindexter Village A-2
Name Location Year Opened Total Size in SF Annual Attendance Museum Type African American Museum of Nassau County Hempstead, NY 5,583 Culture African American Museum in Philadelphia Philadelphia, PA 1976 80,000 Heritage African American Historical Museum & Cultural Center of Iowa Cedar Rapids, IA 2003 4,200 10,772 Heritage African American Museum of Nassau County Hempstead, NY 1970 6,000 Heritage African American Museum of the Arts DeLand, FL 1994 1,200 5,000 Culture Afro-American Historical Society Museum Jersey City, NJ 1984 7,500 Heritage Alabama State Black Archives Research Center and Museum Huntsville, AL 1990 Heritage Albany Civil Rights Institute Albany, GA 2008 12,315 6,500 Civil Rights Anacostia Museum Washington D.C. 1967 54,000 Heritage Anne Spencer House and Garden Museum Lynchburg, VA 1977 1,000 Personality APEX (African American Panoramic Experience) Museum Atlanta, GA 1978 7,500 65,000 Heritage Armstead Tasker Johnson High School Museum Montross, VA 300 History Arna Bontemps African American Museum Alexandria, LA Historic Site Arthur "Smokestack" Hardy Fire Museum Baltimore, MD 1995 Heritage
OMD, Facility Websites, and ConsultEcon, Inc.
Table A-1 (continued)
List of Active African American Museums
ConsultEcon, Inc. Management & Economic Insight February 14, 2023 Poindexter Village A-3
Name Location Year Opened Total Size in SF Annual Attendance Museum Type August Wilson Center For African American Culture Pittsburgh, PA 2009 65,000 27,000 Culture Avery Research Center for African American History & Culture Charleston, SC 8,500 History & Research Baltimore's Black American Museum Baltimore, MD History & culture B.B. King Museum Indianola, MS 2008 20,000 12,000 Culture Banneker-Douglass Museum Annapolis, MD 1984 7,539 Heritage Bellamy Mansion Museum of History and Design Arts Wilmington, NC 15,000 History Benjamin Banneker Historical Park & Museum Catonsville, MD 40,000 History Birmingham Civil Rights Institute Birmingham, AL 1992 58,000 145,000 Civil Rights Black American West Museum and Heritage Center Denver, CO 1971 12,500 Heritage
History Gallery Elizabethtown, KY History Black History Gallery McComb, MS History
History Museum and Cultural Center of Virginia Richmond, VA 1988 Heritage
Holocaust Museum of Slavery Lawnside, NJ History Blue and Gray Museum Fitzgerald, GA 1,396 History Boyds Negro School Museum Boyds, MD 144 History Brazos Valley African American Museum Bryan, TX 2006 Heritage Source: OMD, Facility Websites, and ConsultEcon, Inc.
Black
Black
Black
Table
(continued) List of Active African American Museums
ConsultEcon, Inc. Management & Economic Insight February 14, 2023 Poindexter Village A-4
Name Location Year Opened Total Size in SF Annual Attendance Museum Type Buffalo Soldiers National Museum Houston, TX 2000 23,500 20,000 Heritage Calaboose African American History Museum San Marcos, TX History California African American Museum Los Angeles, CA 1981 75,000 Heritage Carthage Civil War Museum Carthage, MO History Catoctin Center for Regional Studies Frederick, MD History Center for Civil and Human Rights Atlanta, GA 2014 63,000 200,000 Civil Rights Central Pennsylvania African American Museum Reading, PA History & Culture Charles H. Chipman Cultural Center Salisbury, MD Culture Charles H. Wright Museum of African American History Detroit, MI 1965 125,000 150,000 Culture Charlotte Hawkins Brown Museum Sedalia, NC 13,000 History Chattanooga African American Museum Chattanooga, TN History Cherry Hospital Museum Goldsboro, NC 500 History Christiansted National Historic Site St. Croix, VI 100,000 History Clemson Area African American Museum Clemson, SC 2010 Heritage Community Folk Art Center Syracuse, NY Art Corinth Civil War Interpretive Center Corinth, MS History
OMD, Facility Websites, and ConsultEcon, Inc.
A-1
Source:
List of Active African American Museums
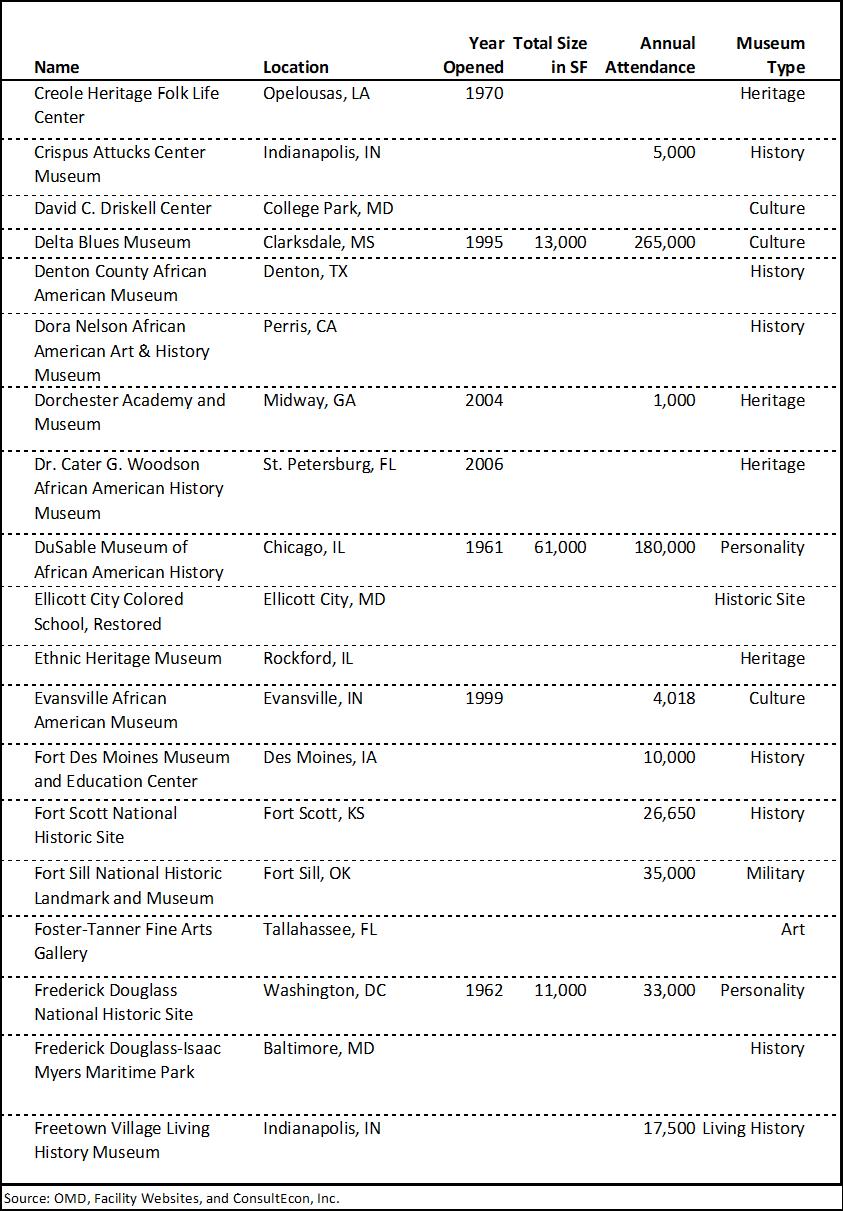
ConsultEcon, Inc. Management & Economic Insight February 14, 2023 Poindexter Village A-5
Table A-1 (continued)
List of Active African American Museums
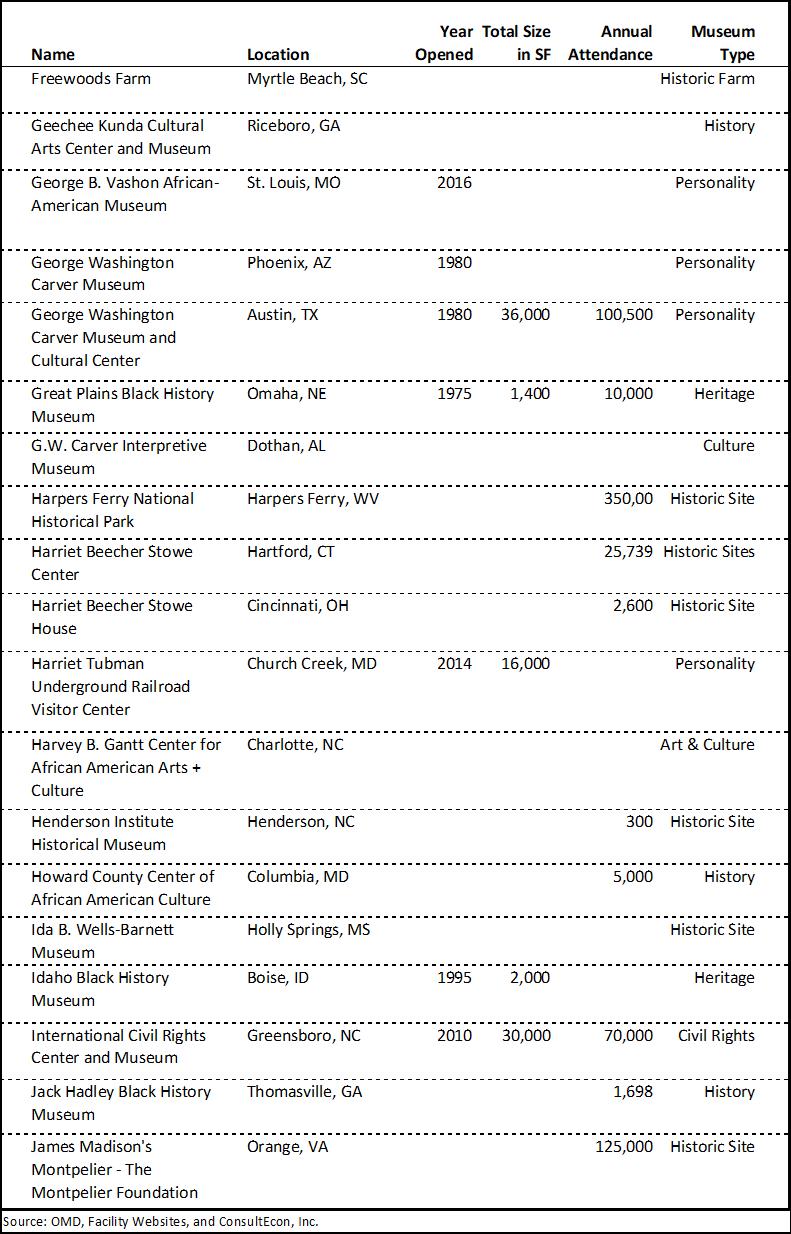
ConsultEcon, Inc. Management & Economic Insight February 14, 2023 Poindexter Village A-6
Table A-1 (continued)
List of Active African American Museums
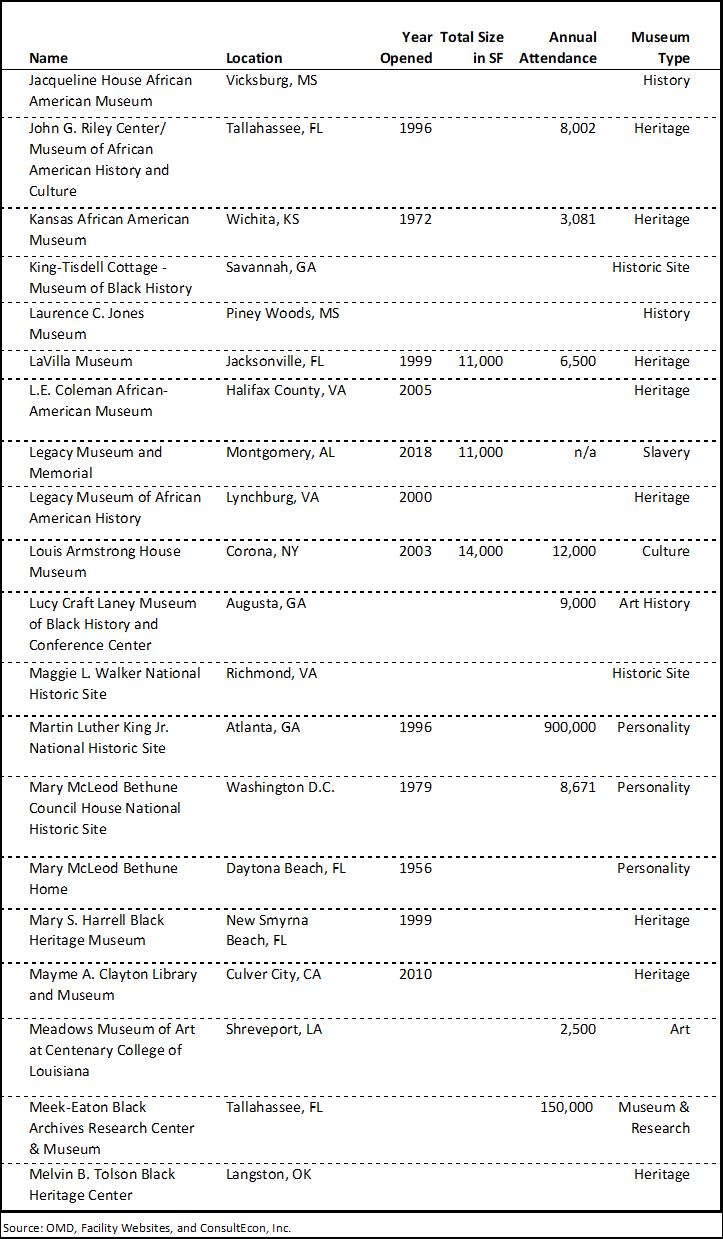
ConsultEcon, Inc. Management & Economic Insight February 14, 2023 Poindexter Village A-7
Table A-1 (continued)
List of Active African American Museums
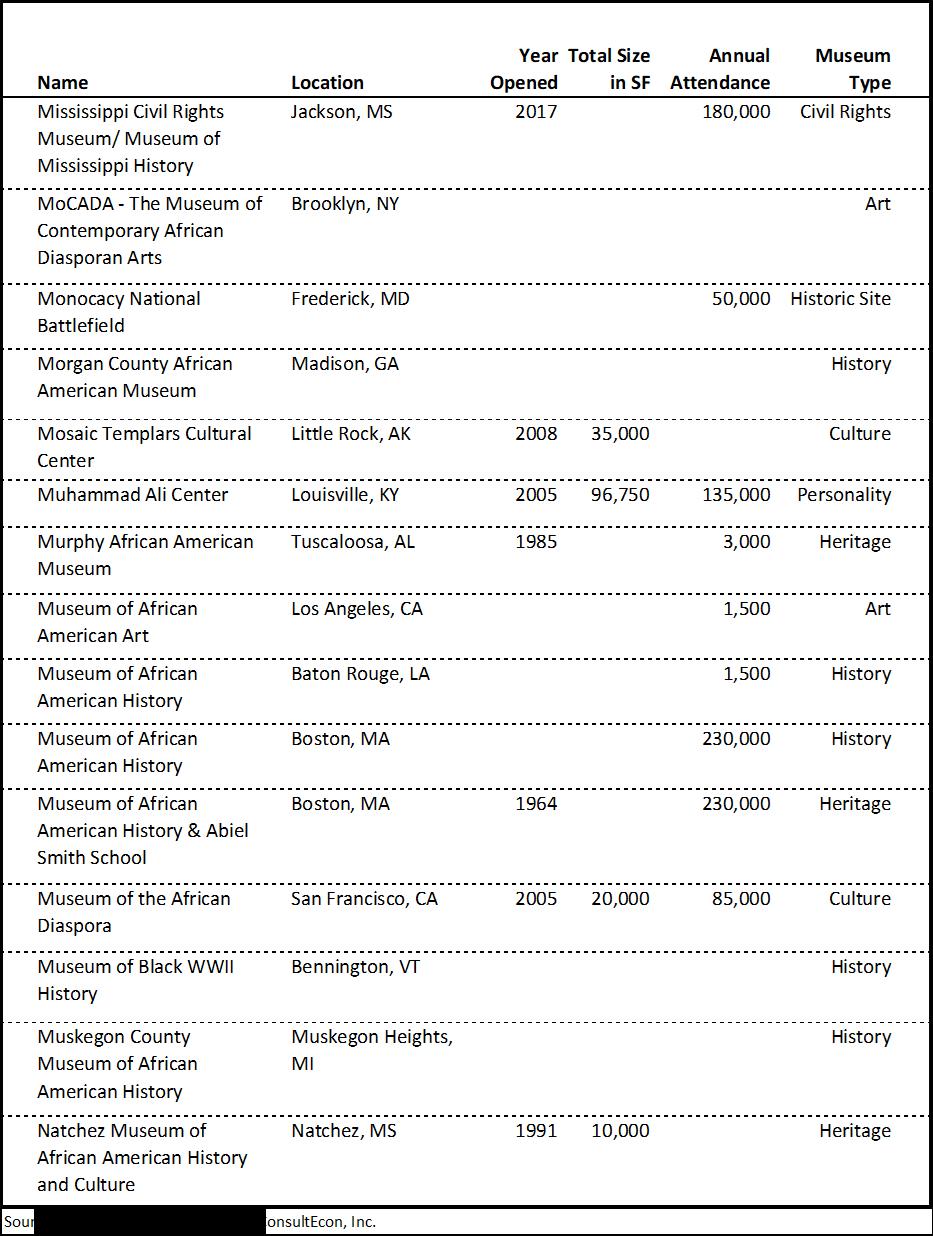
ConsultEcon, Inc. Management & Economic Insight February 14, 2023 Poindexter Village A-8
Table A-1 (continued)
List of Active African American Museums
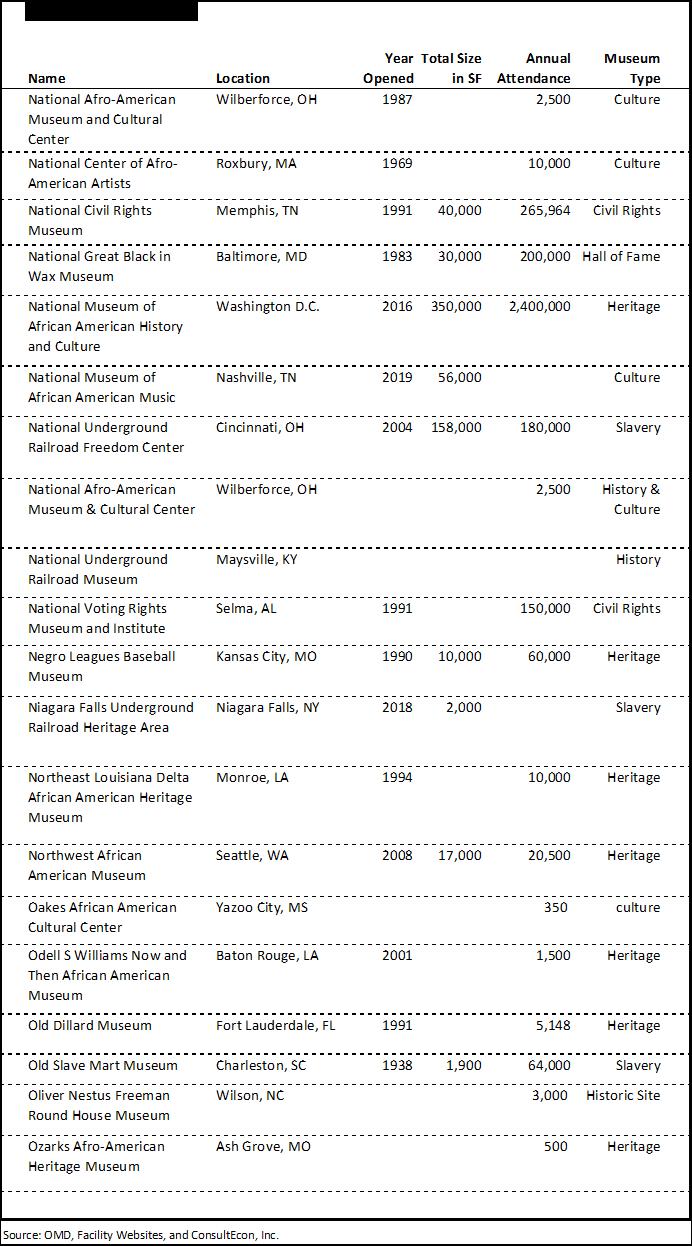
ConsultEcon, Inc. Management & Economic Insight February 14, 2023 Poindexter Village A-9
Table A-1 (continued)
Paul
Penn
Table
List of Active African American Museums
ConsultEcon, Inc. Management & Economic Insight February 14, 2023 Poindexter Village A-10
A-1 (continued)
Name Location Year Opened Total Size in SF Annual Attendance Museum Type
African Historical
Springfield, MA History
Pan
Museum USA
Laurence
Dayton, OH 1,200 Memorial
Dunbar State Memorial
W.
Saint Helena Island, SC 30,000 Historic Site/Memori al
National Battlefield Petersburg, VA Historic Site Prince Georges African American Museum and Cultural Center North Brentwood, MD 2010 4,000 Culture Redcliffe Plantation State Historic Site Beech Island, SC 5,000 Historic site Reginald F. Lewis Museum of Maryland African American History and Culture Baltimore, MD 2005 82,000 50,000 Heritage Riley House Museum of African American History & Culture Tallahassee, FL 8,002 History & Culture Ritz Theatre and Museum Jacksonville, FL 6,500 Theater & Museum River Road African American Museum Donaldsonville, LA 1994 9,000 10,000 Heritage Rosa Parks Library and Museum Montgomery, AL 2000 12,700 50,095 Personality Rosetta C. Baldwin African American Museum High Point, NC Historic Site
Center, Inc. National Historic Landmark/York
Bailey Museum
Petersburg
Museum & African Art Gallery, Inc.
History
Sandy Spring Slave
Sandy Spring, MD
& Art Museum
Source: OMD, Facility Websites, and ConsultEcon, Inc.
List of Active African American Museums
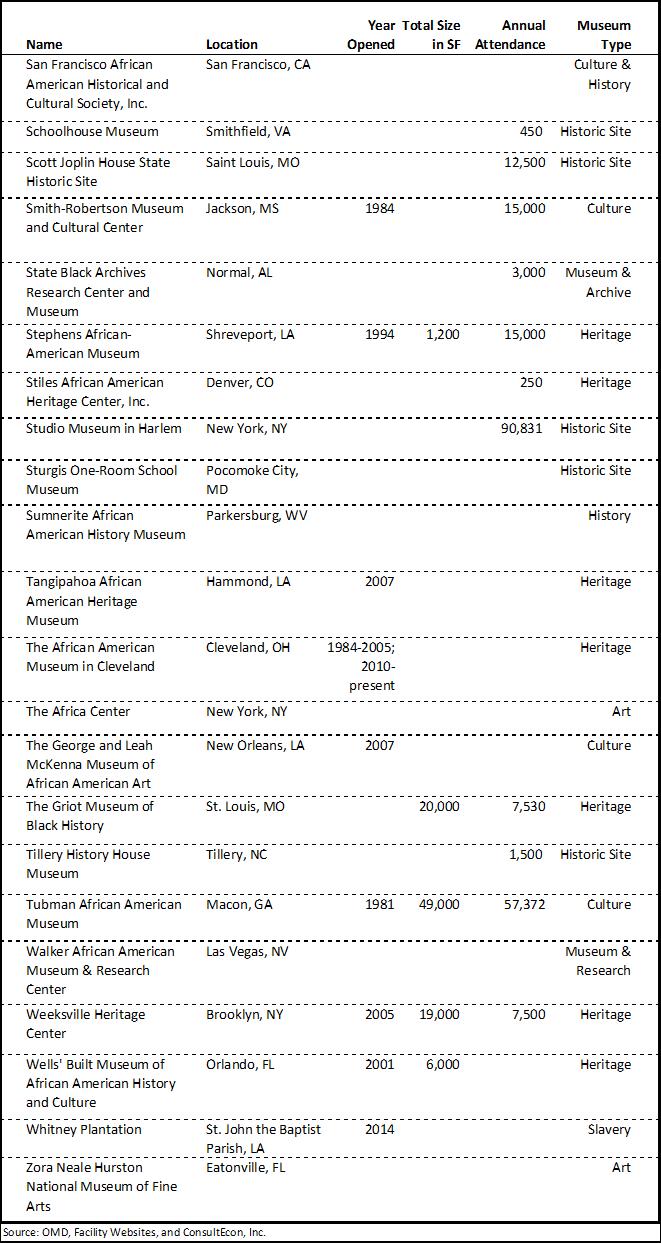
ConsultEcon, Inc. Management & Economic Insight February 14, 2023 Poindexter Village A-11
Table A-1 (continued)
