1 minute read
Figure 6: Population and Employment by TAZ (2045


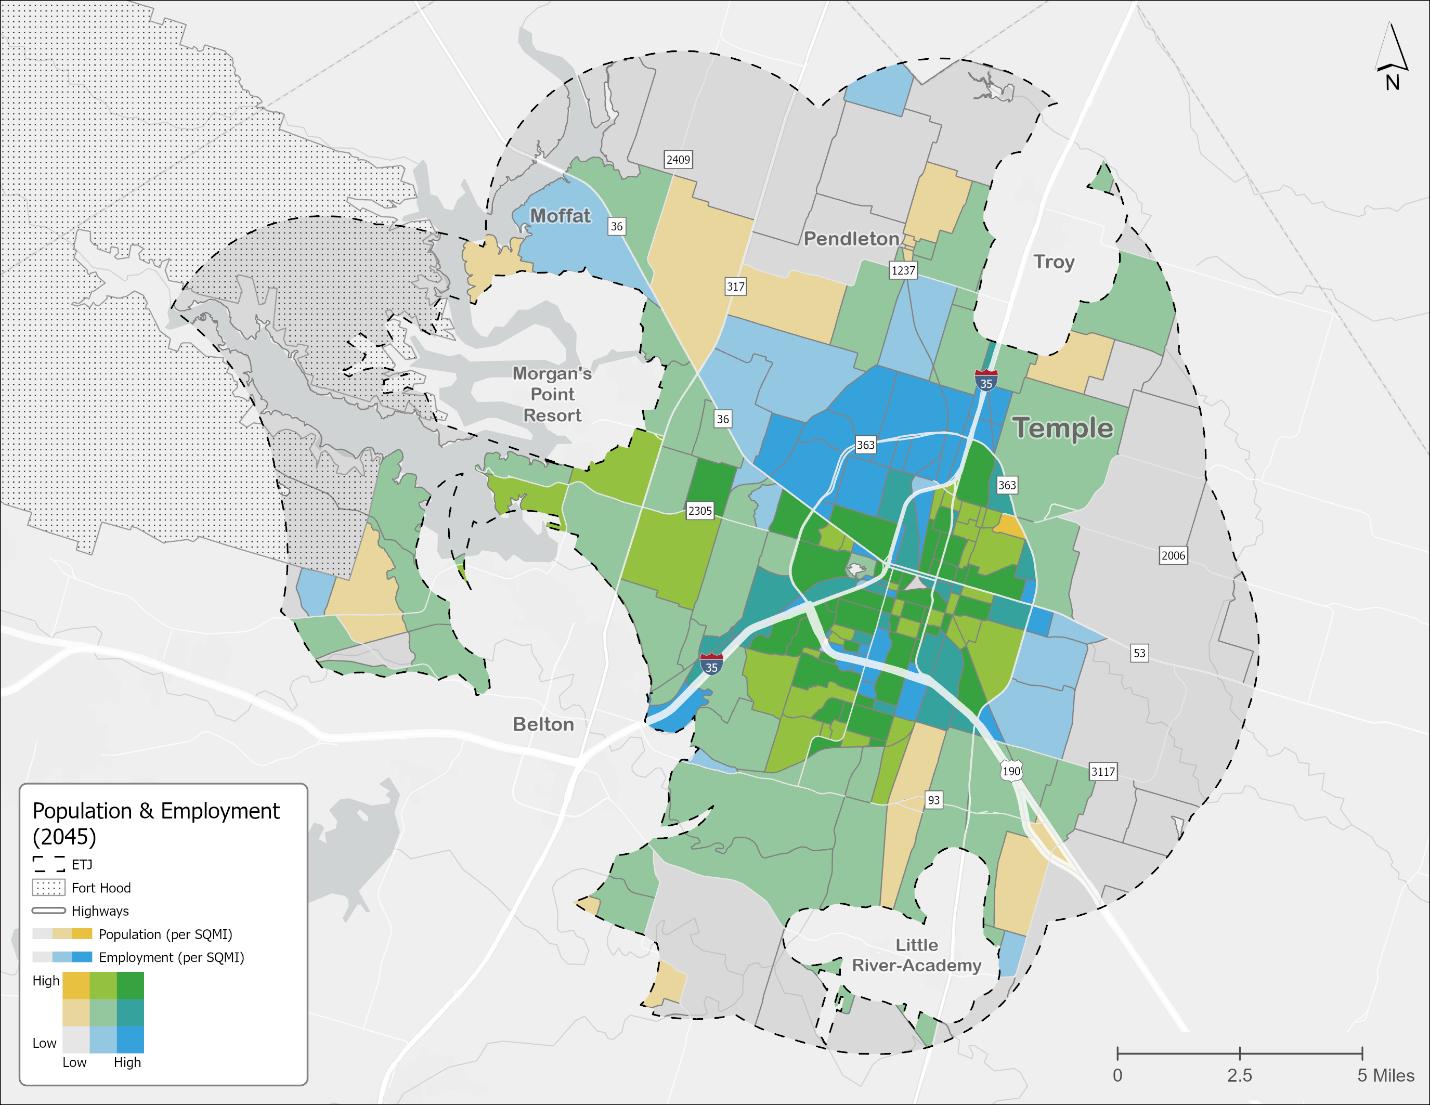
Figure 6 shows population and employment density (per square mile) within the Temple MMP study area as projected for 2045 by traffic analysis zones (TAZ).
Figure 6: Population and Employment by TAZ (2045)
Source: American Community Survey (ACS) 5 YR (2019) +Projected populations use TexPACK V 2.4 KT
Trends identified in the map include:
• Growth will expand into the ETJ. • Population and employment will grow in parts of Temple adjacent to communities (e.g., Belton,
Troy). • Population will increase north of downtown. • Population and employment within Loop 363 will increase. • Employment will increase to the northwest of downtown, specifically around Loop 363. • Employment will continue to grow along I-35.


