REMOTE-CONTROLLED TECHNOLOGY ASSESSMENT FOR SAFER CONSTRUCTION

Page 42

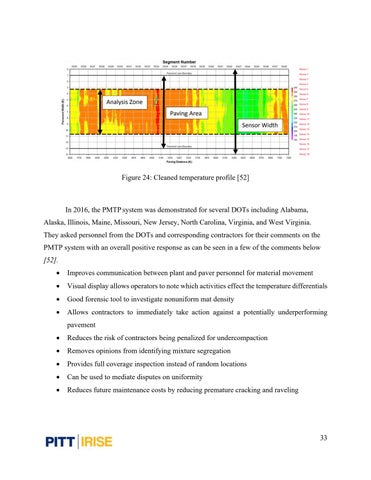
Figure 24: Cleaned temperature profile [52]

In 2016, the PMTP system was demonstrated for several DOTs including Alabama, Alaska, Illinois, Maine, Missouri, New Jersey, North Carolina, Virginia, and West Virginia. They asked personnel from the DOTs and corresponding contractors for their comments on the PMTP system with an overall positive response as can be seen in a few of the comments below [52]. •

Improves communication between plant and paver personnel for material movement

Visual display allows operators to note which activities effect the temperature differentials

Good forensic tool to investigate nonuniform mat density

Allows contractors to immediately take action against a potentially underperforming pavement

Reduces the risk of contractors being penalized for undercompaction

Removes opinions from identifying mixture segregation

Provides full coverage inspection instead of random locations

Can be used to mediate disputes on uniformity

Reduces future maintenance costs by reducing premature cracking and raveling

33


Turn static files into dynamic content formats.

Create a flipbook

Articles inside

Appendix B: Technology Transfer Workshops

14min
pages 91-100

Appendix A: IRISE survey

1min
pages 89-90

References

13min
pages 82-88

operated cart

1min
pages 80-81

Figure 38: AIPV system layout [97

4min
pages 67-69

accuracy tests: (a) following accuracy, (b)lane changing, (c) roundabout operation, (e) minimum turn radius, (f) U-turn [86

12min
pages 71-79

Figure 35: Impact testing of TMA on a tractor [89

1min
page 64

Figure 37: AIPV system overview [95

1min
page 66

Figure 36: Accident involving IPV of the Virginia DOT [92

1min
page 65

Figure 33: Dielectric Maps from Joint Surveys of I-95 near Pittsfield, Maine [63

1min
page 59

Figure 32: Joint survey [63

1min
pages 57-58

Figure 27: A prototype of MnDOT remotely operated rolling asphalt density meter

6min
pages 50-53

Figure 30: Real-time data visualization and comparison with cores [63

1min
page 55

Figure 31: Cherryfield, Maine calibration model [63

1min
page 56

Figure 24: Cleaned temperature profile [52

4min
pages 42-44

Figure 23: Examples of Pave Project ManagerTM detailed reports with temperature profiles and paver speed or time diagram [53

1min
pages 40-41

Figure 25: PDP instrument background principle of operation [73

1min
page 48

Table 3: Specification recommendations for LaDOTD [48

5min
pages 45-47

Figure 22: On-board computer output for real time feedback [53

1min
page 39

Figure 19: Temperature segregation identified with thermal imaging [47

1min
page 35

Figure 6: Conduit remote inspection using (a) crawler robot (b) UAS [22

1min
page 22

Figure 5: Marker placement with (a) manual method and (b) automated system [19

2min
pages 20-21

Figure 21: Infrared sensors attached to paver for real-time thermal data acquisition [52,53

1min
page 38

Figure 20: Distress due to temperature segregation causing inadequate compaction [50

3min
pages 36-37

Figure 9: Infrared sensors attached to paver for real-time thermal data acquisition [26] and the latest version of IR temperature scanners [27

1min
page 25

Figure 18: Autonomous impact protection vehicle [44

2min
pages 33-34

Figure 4: Example of bridge deck demolition using a remote-controlled robot [15

1min
page 19
Issuu converts static files into: digital portfolios, online yearbooks, online catalogs, digital photo albums and more. Sign up and create your flipbook.
REMOTE-CONTROLLED TECHNOLOGY ASSESSMENT FOR SAFER CONSTRUCTION by PITT | SWANSON School of Engineering - Issuu