University of Pittsburgh, Fiscal Year 2024 Greenhouse Gas Inventory, Pittsburgh Campus
University of Pittsburgh, Pittsburgh Campus
Greenhouse Gas Inventory
Fiscal Year 2024
Federica Geremicca
PhD Candidate, Department of Civil & Environmental Engineering
Isabella Cicco Graduate Research Student, Department of Civil & Environmental Engineering
Aurora Sharrard, PhD
Assistant Vice Chancellor for Sustainability, Office of Sustainability
Melissa M. Bilec, PhD
Co-Director, Mascaro Center for Sustainable Innovation
George M. & Eva M. Bevier Professor, Department of Civil & Environmental Engineering
June 30, 2025
University of Pittsburgh, Pittsburgh Campus
Greenhouse Gas Inventory
Background
Pitt GHG Emissions Inventory History
1) Past GHG Inventories
• Fiscal Year 2008 - GHG Inventory Baseline Year
• Fiscal Years 2011, 2014, & 2017 – Triennial inventories
• Fiscal Years 2019, 2020, 2021, 2022, 2023, & 2024 – Annual inventories starting with Fiscal Year 2019
• Fiscal Years 2020, 2021, & 2022 were impacted by the global COVID-19 pandemic
• Lead Authors - Graduate Students, Civil & Environmental Engineering
• Faculty Advisor - Melissa M. Bilec, PhD, Co-Director, Mascaro Center for Sustainable Innovation; George M. & Eva M. Bevier Professor, Department of Civil & Environmental Engineering
• Collaborations & Internal review by University Finance & Operations
• FY19 forward - University Sustainability staff co-author.
2) University of Pittsburgh GHG Emissions Reduction Goals
• 50% reduction by 2030 below Fiscal Year 2008
• Adopted in 2018
• Carbon neutrality by 2037
• Adopted in 2020
• Pitt ClimateAction Plan published in 2022
Acronyms
Acronym
Definition
AASHE Association for theAdvancement of Sustainability in Higher Education
BBP Bellefield Boiler Plant (Pitt purchases steam from this off-campus facility)
CH4 Methane
CO2 Carbon dioxide
CO2e Carbon dioxide equivalents
COVID-19 Coronavirus disease 2019
CSSP Carrillo Street Steam Plant (Pitt makes steam at this on-campus facility)
FERA Fuel & Energy-Related Emissions
FTE Full Time Equivalent
FY FiscalYear
GHG Greenhouse Gas
GWP Global Warming Potential
LEED Leadership in Energy and Environmental Design
• User-friendly, all-in-one carbon and nitrogen-accounting tool designed for higher education campuses.
• Affordable, online solution to track, analyze, & enhance sustainability efforts across the entire campus.
• Algorithms grounded in Greenhouse Gas Protocol standards & backed by two decades of experience with the Campus Carbon Calculator, CarbonMAP, & Nitrogen Footprint Tool.
• UNHsimap.org/home
• Mission - To assist institutions, colleges, and universities in monitoring their environmental footprints, enabling them to achieve their sustainability goals efficiently & effectively.
• Assists users in establishing a baseline, benchmarking performance, generating reports, setting goals, analyzing year-over-year progress, & accessing resources.
• As a signatory Second Nature’s Climate Leadership Commitments & reflecting best practice in higher education GHG inventorying & benchmarking, the University of Pittsburgh uses SIMAP to publicly report our GHG emissions data.
Pittsburgh Campus Greenhouse Gas Inventory Fiscal Year 2024 RESULTS
Executive Summary: FY24 GHG Emissions
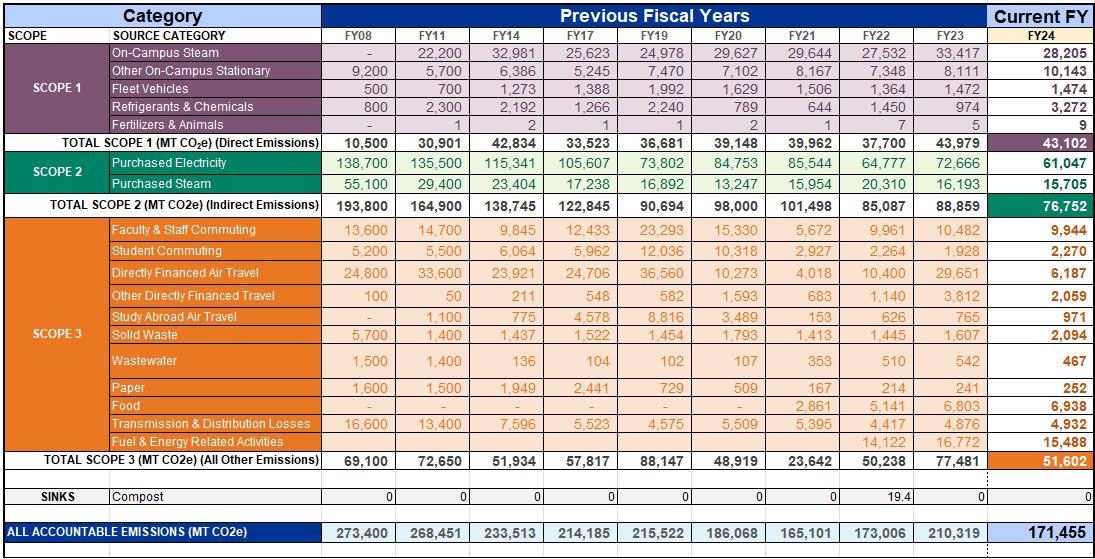
• The University of Pittsburgh’s Pittsburgh campus FY24 GHG emissions were:
• 171,455 MT CO2e
• 20% decrease from FY19 (prepandemic)
• 18% decrease from FY22.
• Decreases occurred in on-campus & purchased steam, purchased electricity, faculty & staff commuting, directly financed air & ground travel, wastewater, and FERA.
• The largest decrease occurred PittSponsored Air Travel (Scope 3) due to data collection error correction.
• GHG emissions are 37.3% below Pitt’s FY08 baseline and are on track to meet the University’s goal of 50% reduction by 2030.
GHG Inventory Overview FY24
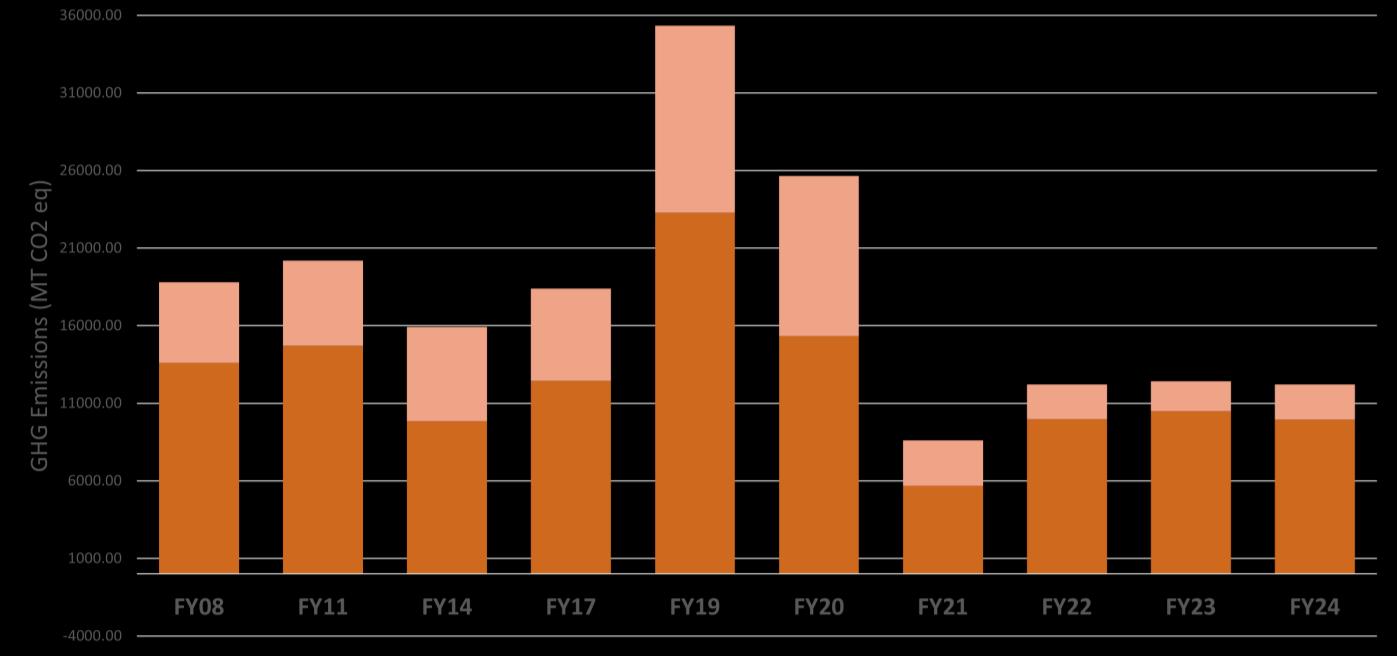
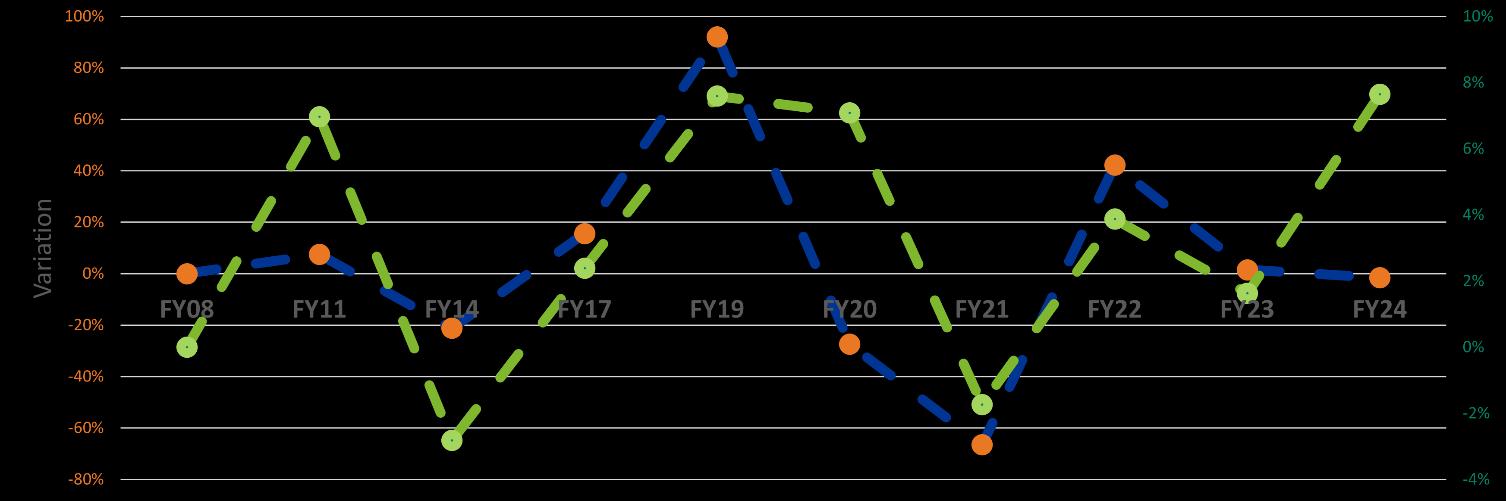
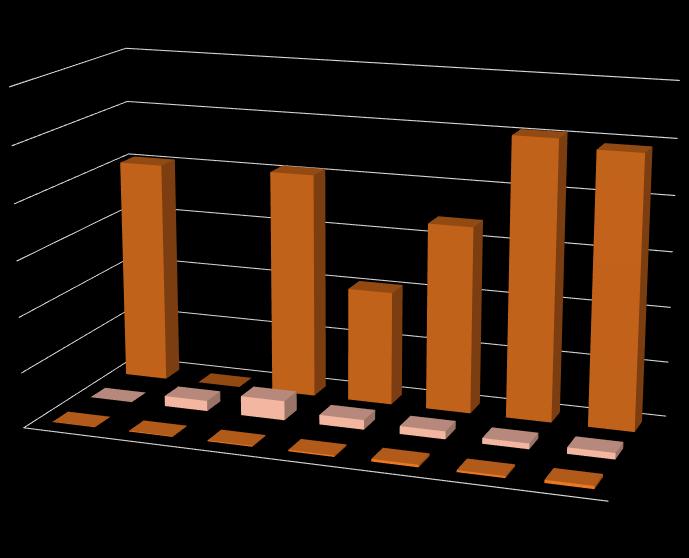
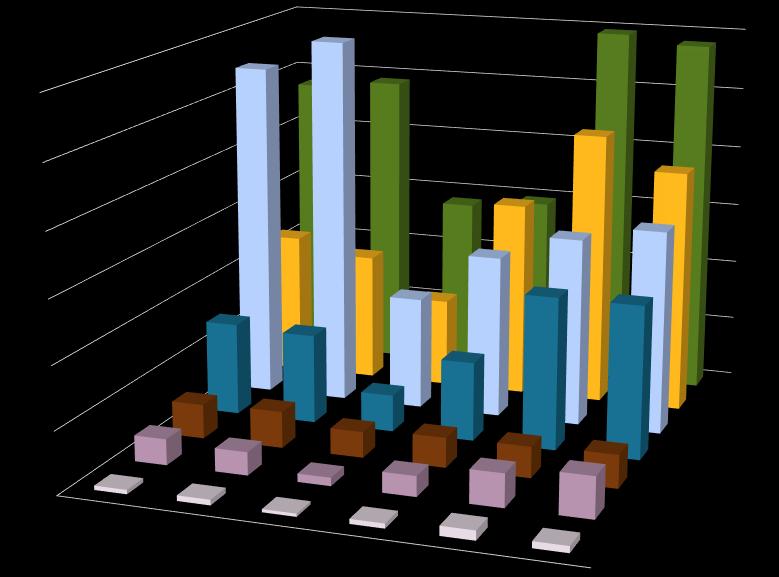
YEAR-TO-YEAR Overview - By Scope
TOTAL SCOPE 1 (MT CO2e) (Direct Emissions)
TOTAL SCOPE 2 (MT CO2e) (Indirect Emissions)
TOTAL SCOPE 3 (MT CO2e) (All Other Emissions) Variation From FY08
GHG Inventory Overview FY24
TOTAL SCOPE 1 (MT CO2e) (Direct Emissions)
TOTAL SCOPE 2 (MT CO2e) (Indirect Emissions)
TOTAL SCOPE 3 (MT CO2e) (All Other Emissions) Variation From FY08
GHG Inventory Overview
Notable FY24 Changes
Gaucho SolarActivation – The Gaucho Solar facility started producing electricity. Pitt purchases all electricity from this local solar farm, which totaled 33,071,592 kWh in FY24. Though Pitt traded Gaucho’s RECs for national Greene certified RECs (to invest in sustainable campus improvements in the built environment), the resulting 108% increase in renewable electricity over FY23 was a primary driver of reducing GHG emissions.
Heating Degree Days – Combined steam consumption decreased in part due to a 9% reduction in days that required heating in FY24.
Data Collection Correction – Due to a data collection error, directly financed air travel was double-counted in FY23, causing a marked increase in reported air travel emissions.The error was corrected in FY24 & reported air travel emissions are now more accurate.
Natural Gas Use – Natural gas consumption for buildings was inexplicably up despite building square footage holding relatively steady.
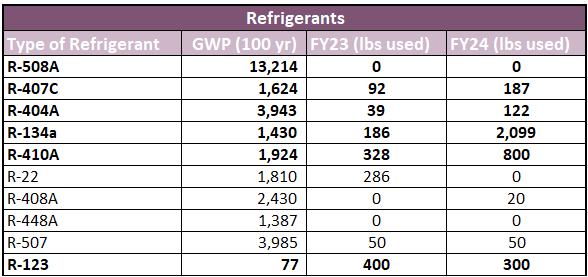
Maintenance with Higher GWP Refrigerants – There was a substantial increase in refrigerant use due to large maintenance projects at the RIDC Building and Victoria Hall, for which higher GWP refrigerants (i.e., R-410A and R-134A) were required, contributing to increased emissions. Varies year to year.
University Overview: Square Footage
YEAR-TO-YEAR Building Utilities per SF
Buildings
Fiscal Year Gross Square Feet
• 484,793 SF less than FY23
• 4% decrease
• 1,932,814 SF more than FY08
• 21% increase
FY24 Building List
FY24 Building List, Continued
University Overview: LEED
University of Pittsburgh
Certified Buildings
LEED Certified Buildings Since 2020
Building Name Certification Year
Clapp Hall Renovation Silver 2020
Public Health Renovations Silver 2021
Salk Hall Renovation Platinum 2023
Peterson Sports Complex Addition Tracking Silver
Scaife Hall Addition & Renovation Tracking Gold
Hillman Library Renovation Tracking Platinum
Arena & Sports Performance Center Tracking Gold In Construction
BioForge at Hazelwood Green Tracking Gold In Construction
Crawford Hall Renovation Tracking Gold In Construction
Fifth & Halket Tracking Gold In Construction
Recreation & Wellness Center Tracking Gold In Construction
University Overview: FY24 Leased Non-Pitt Owned Buildings
Leased space is an optional Scope 3 category & NOT included in Pitt’s GHG Inventory boundary; it is included here for context & trend analysis.
The University had 128 leases covering 1,610,750 square feet of space in in non-Pitt-owned buildings in Pennsylvania.
This leased space had an estimated 40,586 MT CO2e of GHG Emissions in FY24 (equivalent to 24% of total FY24 emissions).
NOTE: Leased space energy use was estimated using square footage, primary space use type, & national average energy use intensity based on primary use.
Pitt Leased Space In Buildings Owned by Others
University Overview: FY24 Population & Student Housing
• Compared to the FY08 baseline, fleet vehicle emissions increased more than any other category.
• Pitt’s steam is primarily provided by the on-campus CSSP, subsidized by purchased steam from the off-campus BBP .
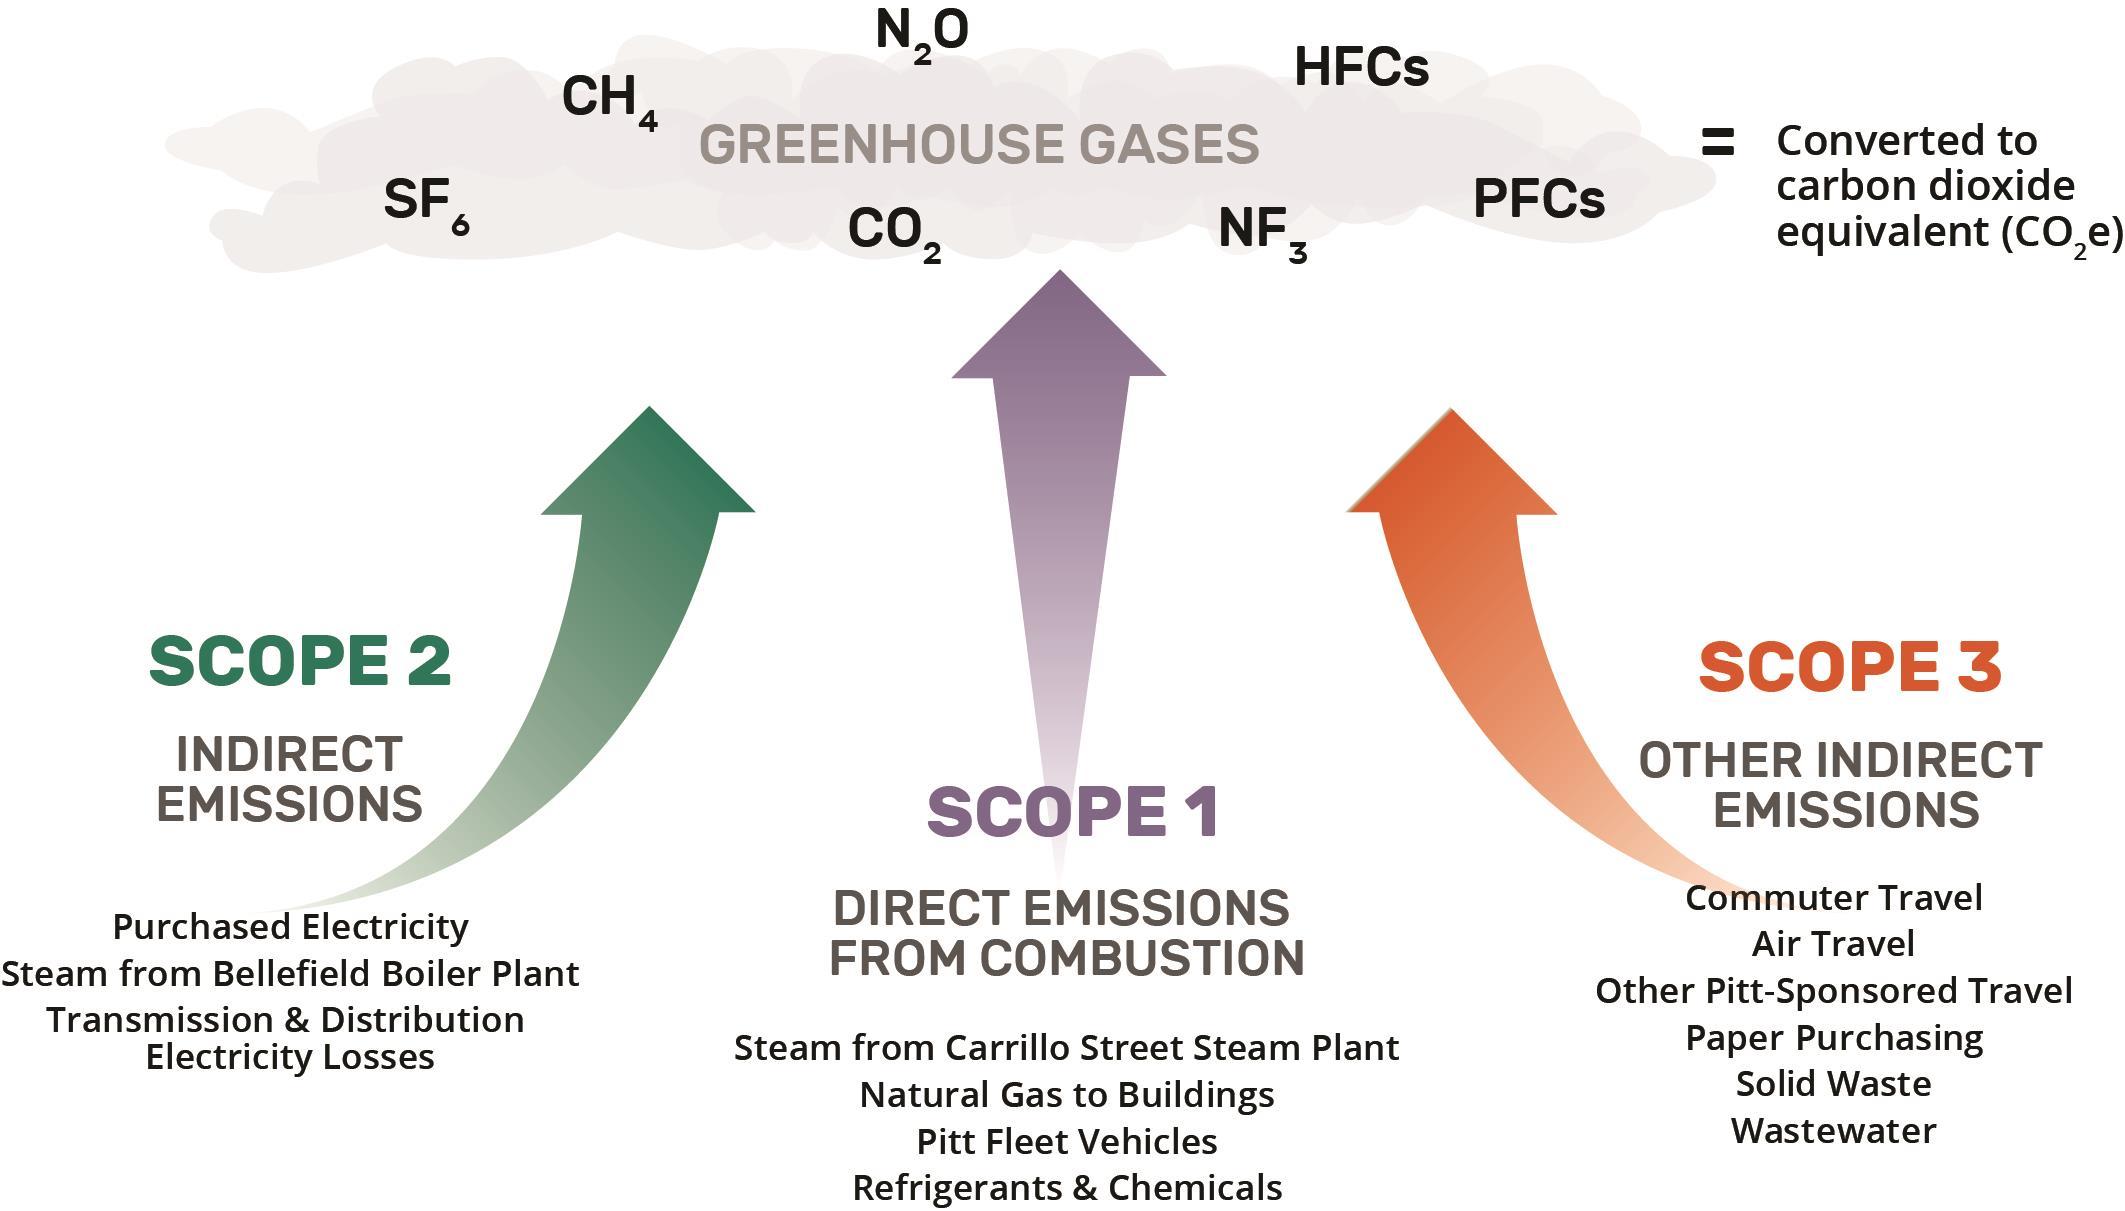
SCOPE 1 EMISSIONS - On-Campus Stationary Sources
NOTES
• Pitt has Steam emissions in both Scope 1 & 2.
• Scope 1 = On-Campus Carrillo Street Steam Plant
• Scope 2 = Purchased from Bellefield Boiler Plant
• Left figure shows Scope 1 GHG emissions only.
• Right figure shows total steam emissions
Total Steam Used On-Campus Carrillo Steam Plant
+ Purchased Steam from Bellefield Boiler Plant (klbs)
Compared to FY23, Heating Degree Days decreased 9% & building square footage decreased 4%.
Natural Gas
6% of Total Emissions
SCOPE 1 EMISSIONS – Natural Gas
Fleet Vehicle Fuel Use & Emissions
1% of Total Emissions
Year-To-Year Comparison Fleet Fuel Type
SCOPE 1 EMISSIONS – Fleet Vehicles
NOTES
• Despite being externally contracted, University shuttles are included in this category.
• In FY21, Shuttles shifted from biodiesel to propane.
Scope 1: Minor Sources FY24 Trends
SCOPE 1 - Emissions Trends Minor Sources
NOTES
• Refrigerant use varies widely year over year.
• FY22 forward shows correction of fertilizer data entry error.
Refrigerants
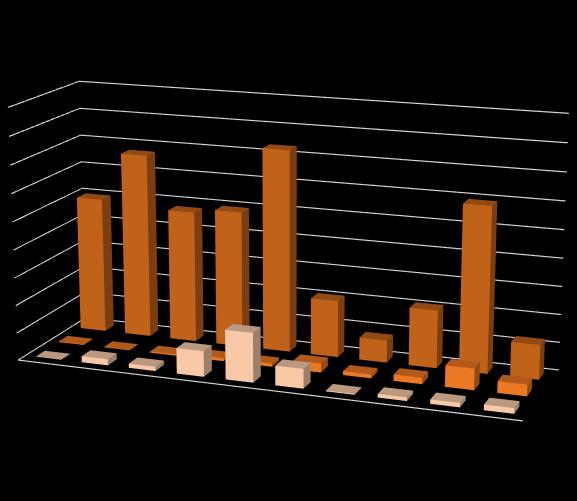
Year-To-Year Comparison Refrigerants Used
SCOPE 1 EMISSIONS - Refrigerants
NOTES
• Refrigerant use varies widely year-over-year.
• Refrigerant use & emissions increased due to 2 large maintenance projects (RIDC & Victoria).
• Since FY08, Pitt has switched to refrigerants with lower GWP.
• Notable shifts in usage
Fertilizers
SCOPE 1 EMISSIONS - Fertilizers
NOTES
• Less fertilizer was used in FY24 compared to FY21.
• Nitrogen content in fertilizer increased in FY24, causing emissions to increase.
• FY08 – FY21 results include a data entry error relating to nitrogen content; FY22 forward, fertilizer use & emissions appear larger due to correction of this error.
SCOPE 2
INDIRECT EMISSIONS
Scope 2 FY24 Trends
Scope 2 FY24 Trends
SCOPE 2 - Emissions Trends
Purchased Electricity
NOTES
• FY24 electricity use decreased from FY19 (pre-pandemic year) but increased from FY23.
• Despite square footage growth from FY08 to present, 56% decrease in electricity-related GHG emissions due to both building efficiency projects & renewable procurement.
On-Campus Solar & REC Procurement
NOTES
• Prior to FY19, only minor REC procurement.
• In FY24, Gaucho Solar farm came online on July 1, 2023, & generated 33,071,592 kWh of electricity.
• Pitt’s goal is 50% renewable electricity by 2030 & 100% by 2037.
Purchased Steam & Relative Emissions
Year-To-Year Steam Purchased from Off-Campus Bellefield Boiler Plant (klbs)
NOTES
• In FY24, purchased steam use & GHG emissions decreased because there were fewer heating degree days.
• Total steam use decreased (Scope 1 + 2).
SCOPE 3
OTHER INDIRECT EMISSIONS
Scope 3 FY24 Trends – Travel
NOTES
• Scope 3 emissions have returned to pre-pandemic levels.
• FY24 Travel GHG emissions were influenced by a very large decrease in Directly Financed Air Travel caused by a FY23 data aberration
Scope 3 FY24 Trends – Travel
NOTE
• FY20-22 PandemicInfluenced
• FY22 & FY24Personal car travel reimbursement data not provided.
Directly Financed Travel & Study Abroad
NOTES
• Not adjusted for inflation.
• FY11, FY14, & FY19 - Athletics data not provided.
• Growth in Athletics air travel linked to increased ACC geography.
NOTES
• Not adjusted for inflation
• FY21 & FY22 –Pandemicinfluenced
• FY22 & FY24Personal car travel reimbursement data not provided.
Directly Financed Travel & Study Abroad
Faculty & Staff
Students
5.4% of Total Emissions
Ryan
John Senter, Jason Rickel, Emily Duchene & Lauren Leonard
Scope 3 FY24 Trends – Commuting
SCOPE 3 - Emissions Trends - Commuting
Other Indirect
Commuting is 7% of FY24 GHG Emissions
(-2% from FY23)
NOTES
• Commuting assumptions (& thus GHG emissions) had little variation between
FY22 - FY24
• Faculty & staff commuting emissions decreased slightly due to an increase in onroad electric vehicles (assumed to equal Pennsylvania average).
• Student commuting emissions increased in part due to an increase in student population, and thus students living off / further from campus.
Commuting
7% of Total Emissions
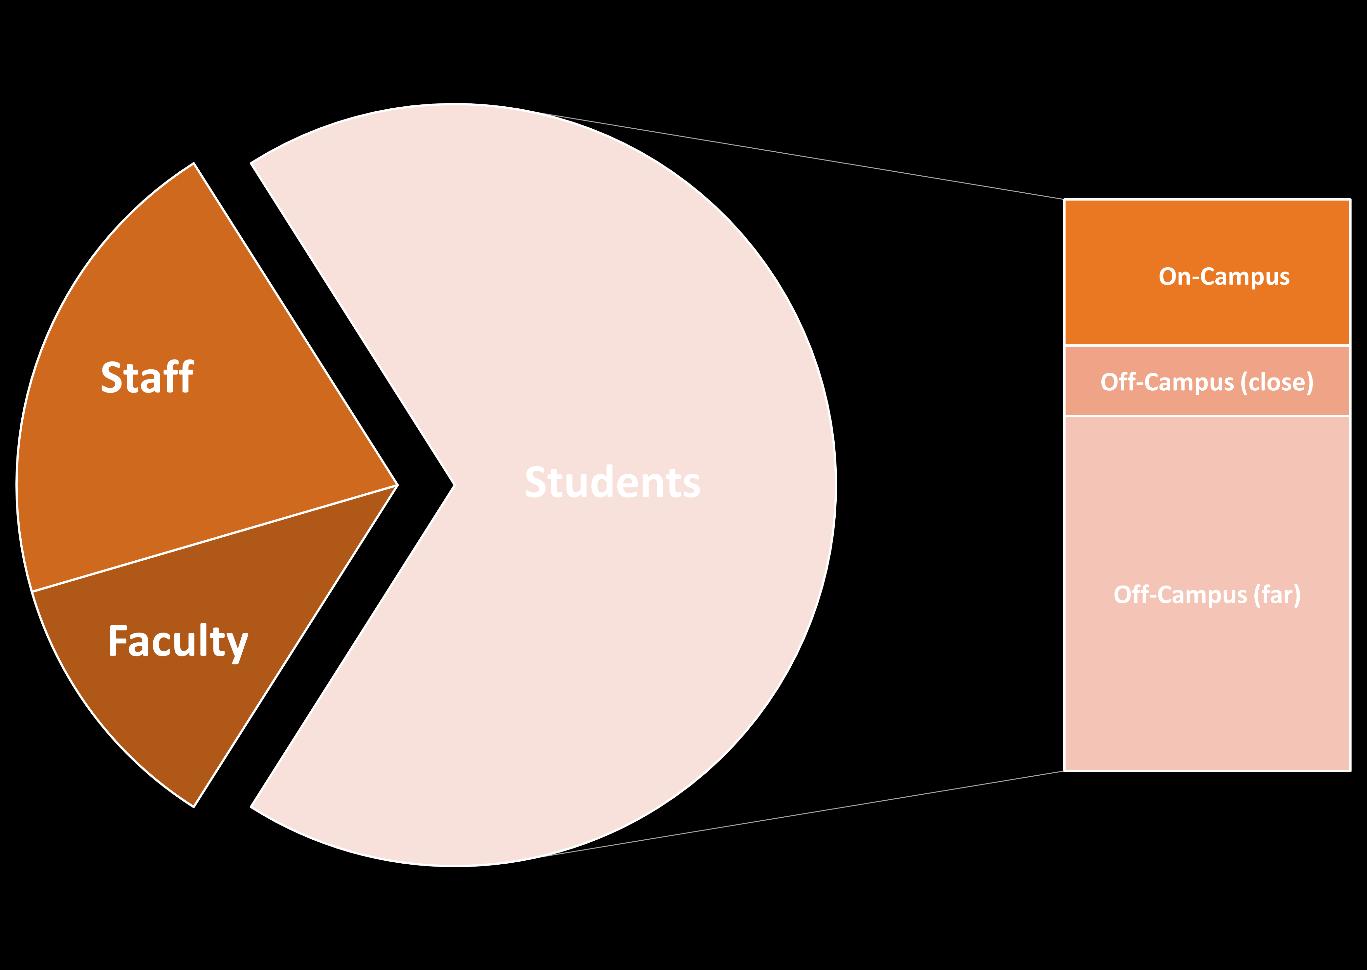
DATA NOTES
• Most commuting emissions are due to faculty & staff.
• FY24 Students = 68% of total population, but only 19% of commuting GHG emissions (assuming various residence locations)
• Since FY22, assumptions have been based on Pitt commuter survey results.
• Since FY21, formal staff flex work arrangements are reflected.
SCOPE 3 – Commuting Emissions
STUDENTS
FACULTY & STAFF
Commuting Emissions – Yearly Variations
Commuting: Trends & COVID-19 Assumptions
STAFF
ASSUMPTIONS
o Telecommuting: Staff 23%, Faculty 19%. Students 0%
o Fall 2022 Commuter Survey informed process; updated survey planned for Fall 2025
o Info on POGOH Bike Share, Incline, & Scooters added into considerations.
STUDENTS
Scope 3 FY24 Trends: Waste, Paper, &
Food
6% of FY24 GHG Emissions
(+6% from FY23)
NOTE
Since FY19, all categories have been consistent except Food, which was pandemicinfluenced.
SCOPE 3 – EMISSION TRENDS
Solid Waste & Wastewater
Year-To-Year Solid Waste Landfilled & Recycled
Food Purchased Food Recovered Food Composted
SCOPE 3 EMISSIONS - Food
DATA NOTES
• Food emissions category added in FY21.
• FY21 & FY22 food volume served was pandemic-influenced.
• Compost activities include both food & yard waste & are not calculated as a carbon offset.
SCOPE 3 EMISSIONS - Food
DATA NOTES
• Food emissions increased despite a slight decrease in food purchased.
• More foods with higher GHG impact were purchased in FY24, including meats & dairy.
Paper
Year-To-Year Comparison
Total Paper Purchased
NOTE: Reductions since FY17 due to behavior change from reducing on-campus printing (and thus paper use & associated GHG emissions).
of
SCOPE 3 EMISSIONS - Paper
Emissions -84% since FY08
FERA: Fuel- & Energy-Related Emissions
FERA Emissions (MT CO2e)
• New Scope 3 category in FY22
• Automatically calculated by SIMAP for Scope 1 Stationary Sources & Scope 2 Purchased Electricity
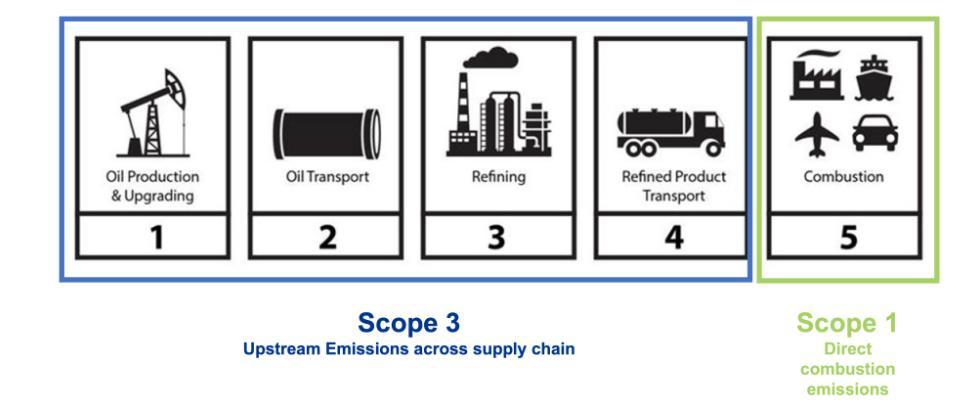
• FERAaccounts for all upstream emissions for Scope 1 stationary sources (e.g., direct combustion of fuel or generation of energy); for Pitt, this includes:
• Natural gas combustion from the Carrillo Street Steam Plant
• Gasoline, diesel, and propane fuel used for fleet vehicles, shuttles, & backup generators.
• At 9% of total GHG emissions, FERA had a significant effect on FY24 emissions, mostly due to natural gas & on-campus steam.
Figure: Lifecycle Stages Included in Scope 3 FERA vs. Scope 1.
Scope 3: Category Inclusion Notes
In FY22, SIMAP released updated functionalities of Scope 3 accounting. All 15 GHG Protocol Categories are now included in the software.
SUMMARY
& COMPARISONS
GHG Inventory Overview FY24
GHG Inventory Year-To-Year Overview – By Scope
from FY 23
TOTAL SCOPE 1 (MT CO2e) (Direct Emissions)
TOTAL SCOPE 2 (MT CO2e) (Indirect Emissions)
TOTAL SCOPE 3 (MT CO2e) (All Other Emissions) Variation From FY08
1) Population Growth – Is driving commuting emissions up & influences square footage requirements, in Pitt-owned buildings on- and off-campus, in addition to leased spaces.
2) Energy Use by Buildings - Is not significantly decreasing, despite the overall decrease in GHG emissions.
3) Heating - Natural Gas use increases need to be analyzed & controlled; an in-depth steam analysis is recommended in future years to help reduce steam use & possible GHG emissions reduction.
4) Renewable Electricity – Procurement is increasing in line with goals, which decreased Scope 2 emissions.
5) Future Needs to Focus On: a) Update commuter survey, b) Reduce GHG emissions from fleet vehicles, & c) Determine Athletics travel emissions reduction strategy.
Future GHG Emissions Reduction
Recommendations
1) Growth - Pitt's continued growth in physical space & population size will outpace efforts focused on reducing GHG emissions; as a result, a redoubling of efforts will be needed across all categories. Ensure building list is accurate.
2) Purchased Electricity - Remains the University’s largest GHG emissions category.
a) More aggressive building energy efficiency retrofits are needed for more buildings more quickly.
b) Energy use intensity performance goals for all existing buildings should be revisited, as should efforts to achieve them .
c) Energy performance goals for new buildings should be as rigorous as possible.
d) On- and off-campus renewable electricity generation projects and procurement should advance quickly.
3) Clean Energy - To assist with clean energy sourcing, building systems and components should shift away from natural gas & steam when possible.
4) Steam – Despite steam use & emissions decreasing in FY24, steam use is still above FY08 levels and has trended upwards overall.
a) Recommend analysis of steam use at both the steam system and building scales to facilitate future operational focus on steam use reduction.
5) Travel – Air travel is consistently a large contributor to overall emissions and not expected to decrease substantially in future years.
a) Athletics air travel is expected to grow with the expansion of the ACC geography.
b) Increased and focused engagement with the Pitt community is needed regarding avoiding air travel or shifting air travel to ground travel, along with travel carbon offsets.
c) Ensure SIMAP air travel data is accurate to ensure precision & that all contributors are correctly accounted for.
6) Academics - Pitt's research & academic community offers tremendous opportunities for innovation & collaboration. Strategically tapping these resources could lead to important reductions & longer-term cultural shifts.
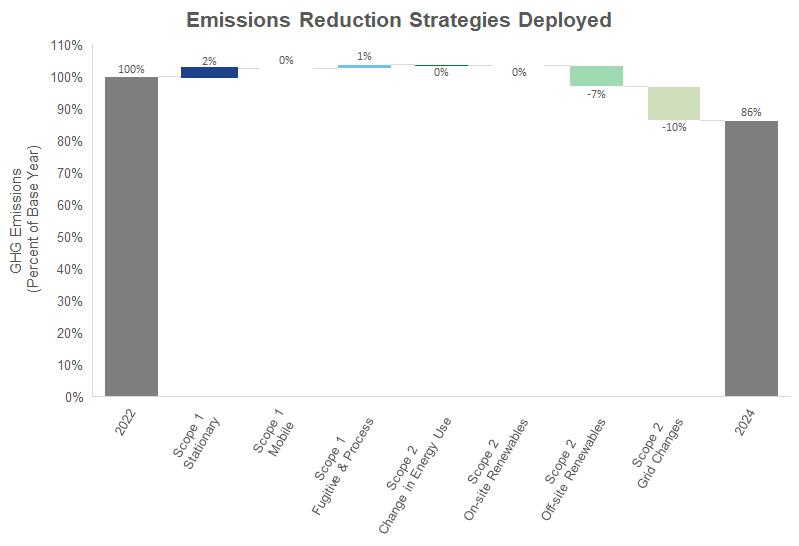
DOE Better Climate Challenge
FY22 to FY24 Summary (Scope 1 & 2 only)
University GHG Emissions Benchmarks
Sorted By Net Emissions
FY24 GHG Emissions Inventory Results
References
1) University of Pittsburgh GHG Inventory Reports
• Fiscal Year 2008, 2011, 2014, 2017, 2019 through 2024
• Sustainable.pitt.edu/Commitments-Reports/
2) Pitt SIMAP Public GHG Emissions Disclosure
• UNHsimap.org/public/institution/728
3) Greenhouse Gas Protocol
• GHGprotocol.org/standards-guidance
4) Pitt Sustainability GHG Emissions Dashboard
• Sustainable.pitt.edu/Dashboard/
FY24 GHG Inventory Authors
Please contact the authors with questions or requests:
Federica Geremicca
PhD Candidate, Department of Civil & Environmental Engineering feg28@pitt.edu
Isabella Cicco
Graduate Research Student, Department of Civil & Civil Environmental Engineering iac11@pitt.edu
Melissa M. Bilec, PhD
Co-Director, Mascaro Center for Sustainable Innovation
George M. & Eva M. Bevier Professor, Department of Civil & Environmental Engineering mbilec@pitt.edu
Aurora Sharrard, PhD
Assistant Vice Chancellor for Sustainability, Office of Sustainability asharrard@pitt.edu