

Greater Hazelwood Neighborhood Profile Report, 2020


Introduction
Greater Hazelwood is a community that has a rich history and a vibrant future. Formerly home to the Iroquois, this community in Pittsburgh, Pennsylvania is located along the Monongahela River, where hazelnut trees once flourished. In 1758, the Stanwix Treaty came to fruition, which signed over rights to the land from the Native Americans to the British 1. Although little development happened for several years, the rise of the railroad and steel industries took hold, transforming Pittsburgh, and Hazelwood, into an urban industrial community.
Home to the Jones and Laughlin Steel Corporation (J&L Mill) and the Baltimore and Ohio Railroad (B&O), these industries changed the trajectory of Greater Hazelwood to become a booming mill town. With a population of over 33,000 people during the height of the steel industry, this community also experienced an expanding commercial service industry 2 and many notable developments such as Pittsburgh’s first parklet (1949) 3, the Glenwood Bridge (1897) 4, and the Hot Metal Bridge (1887) 5
As a global economy emerged, Pittsburgh’s steel industry’s competitiveness lagged. Eventually, the steel industry collapsed, and the J&L Mill ceased operations in 19971. Greater Hazelwood experienced a significant loss of population and commercial service which is still reflected today. However, the story for Greater Hazelwood is one of resilience and opportunity to once again become the hub of economic advancement for the city and region.
Greater Hazelwood will be at the center of Pittsburgh’s next major transformation, with Hazelwood Green, the former site of the J&L Mill, at the forefront of Pittsburgh’s growth as a regional hub for robotics, advanced manufacturing, and, specific to the University of Pittsburgh, the life sciences industries.
Originally, data for Greater Hazelwood consisted of Hazelwood and Glenwood, but, overtime, the census tracts have shifted, and today, census data exists for Hazelwood and Glen Hazel which is reflected in this report as well as the 2010 Hazelwood Neighborhood Profile report 6. As Greater Hazelwood and the Greater Pittsburgh community move towards new opportunities for economic growth, it is important to capture data along the way as we look to the past to inform the future. This report, based on 2020 Census data, provides the opportunity to reflect and evaluate where the community is today and what possibilities for growth and change await.


1 “The site’s history”, Hazelwood Green, 2024, https://www.almono.org/thehistory
2 TARR, JOEL A., and DENISE Di PASQUALE. “The Mill Town in the Industrial City: Pittsburgh’s Hazelwood.” Urbanism Past & Present 7, no. 1 (13) (1982): 1–14. http://www.jstor.org/stable/44403627
3 ‘’Future Hazelwood Parklet Site’’, Historic Pittsburgh, University of Pittsburgh Library system, 2024 https://historicpittsburgh.org/islandora/object/pitt%3AMSP285.B019.F12.I01
4 JaQuay Carter, “The OLD GLENWOOD BRIDGE is one of the most interesting, historically speaking, of the first five bridges built in Allegheny County”, Facebook, December 4, 2021, https://www.facebook.com/groups/hazelwoodhistory/posts/the- old- glenwood-bridgeis-one-of-the- most -interesting- historically-speaking-of- /5106762162684394/
5 “Hot Metal Bridge”, Great Allegheny Passage Conservancy, 2024, https://gaptrail.org/amenities/hot -metal- bridge/
6 “The Hazelwood Neighborhood, 2010”, University Center for Social and Urban Research, University of Pittsburgh, 2012, https://ucsur.pitt.edu/files/nrep/2010/Hazelwood%20Neighborhood%20Profile%202010.pdf
Table
Table
Table
Table
Table
Table
Table
Table
Table
Table
Table
Table 15: Primary Jobs by Place of Residence - Worker Age, 2010, 2021
Table 16: Primary Jobs by Place of Residence - Earnings, 2010, 2021
Table
Table
Table
Table
Table
Table
Table
Data Notes
This document reports the combined totals for the Hazelwood and Glen Hazel neighborhoods, which will be referred to as the Greater Hazelwood Neighborhood.
Figure 2 shows the 2020 Census Tract boundaries, which have been used to compile data about the neighborhood from several data sources used in this report. Hazelwood data presented in this report is from the 2018-22 American Community Survey and includes Glen Hazel. Data from this report came from federal, state, and local data sources, including:
● United States Census - The U.S. Census Bureau released the first detailed data from the 2020 Decennial Census of Population and Housing known as PL 94-171 data and includes the final census enumeration of the population by race and ethnicity for counties, municipalities, and smaller levels of geography. https://data.wprdc.org/dataset/2020census-redistricting-data-extracts
● American Community Survey 5-Year Estimates (2022) - The American Community Survey (ACS) is an ongoing nationwide survey that provides data every year. The ACS covers a broad range of topics about the social, economic, demographic, and housing characteristics of the U.S. population. https://www.census.gov/data.html
● Longitudinal Employer-Household Dynamics (LEHD) Origin-Destination Employment Statistics - a partially synthetic data set that describes geographic patterns of jobs by a person’s place of work and place of residence. This data also establishes the connection between the two enabling analysis of local employment and commuting. https://onthemap.ces.census.gov/
● Office of Property Assessments in Allegheny County - In order to manage the property tax system, Allegheny County maintains parcel data pertaining to land use, valuation, sales, abatements, and building characteristics (if residential) by parcel. https://data.wprdc.org/dataset/property-assessments
● United States Postal Service Vacant Address Data - The U.S. Department of Housing and Urban Development (HUD) has an agreement with the United States Postal Service (USPS) to receive and publish quarterly aggregate data on addresses identified by the USPS as vacant. The USPS disaggregates data by use of the property (residential, commercial, industrial), length of vacancy, and distinguishes between properties ready for occupancy (classified as “vacant”), and those not ready for occupancy due to uninhabitable conditions or ongoing construction (classified as “no-stat”). https://www.huduser.gov/portal/datasets/usps.html
● Pittsburgh Public Schools (PPS) - Dataset includes enrollment data for Pittsburgh Public Schools. It excludes data on charter schools or students enrolled in private or parochial schools and students attending a cyber or virtual school option not operated by PPS. Data
is presented by school, feeder pattern / attendance boundary, and by neighborhood. Dataset extracted from the Pittsburgh Public Schools data system in January 2021. https://data.wprdc.org/dataset/pittsburgh-public-schools-enrollment
Important Note: Quantitative data only tells part of the story. We recommend thinking of this data as a tool to bring people together to spur discussion, inform questions, and build relationships.
Contact Our Team:
Greater Hazelwood Neighborhood Commitment Director, Heidi Ward, haw221@pitt.edu
Neighborhood Commitments is a program housed in the University of Pittsburgh’s Office of Engagement and Community Affairs.
Geography


Figure 1: City of Pittsburgh by Neighborhood
Hazelwood and Glen Hazel
2020 Census Tracts Neighborhood and Tracts
Figure 2: Hazelwood and Glen Hazel Neighborhoods by 2020 Census Tracts
About ECA and the WPRDC
Office of Engagement and Community Affairs (ECA)
The Office of Engagement and Community Affairs champions community engagement efforts across the Pitt system. ECA facilitates strategic community initiatives, leads the University’s placebased engagements in the City of Pittsburgh, collaborates with the Provost’s Office to support engaged scholarship, maintains positive relationships with the neighbors and organizations closest to our campus footprint, and ensures that Pitt is a partner and asset to communities, locally to globally.
Pitt’s Neighborhood Commitments are the University’s flagship place-based community partnerships. The commitments, focused on the Oakland, Homewood, Hill District, and Greater Hazelwood neighborhoods of Pittsburgh, provide long-term commitments of staffing, infrastructure, and coordination to facilitate mutually beneficial collaborations between Pitt and the local community.
The Oakland neighborhood commitment is anchored by the Pittsburgh campus. The Homewood and Hill District neighborhood commitments are anchored by Community Engagement Centers vibrant, welcoming facilities that facilitate engaged scholarship, engaged learning, capacitybuilding, and economic inclusion. A third Community Engagement Center is planned for the Greater Hazelwood neighborhood, which will have a priority focus on harnessing the nearby life sciences corridor (and Pitt’s BioForge) for community-scale opportunities in education, workforce development, and inclusive community development.
Western Pennsylvania Regional Data Center (WPRDC)
Since 2015, the Western Pennsylvania Regional Data Center, part of the University Center for Social and Urban Research, provides a shared technological and legal infrastructure to support research, analysis, decision making, and community engagement. Its mission is to help people find and use data about their communities. The initiative is managed by the University of Pittsburgh Center for Urban and Social Research, in partnership with Allegheny County and the City of Pittsburgh.
Key Findings: Population
The population in Greater Hazelwood has fallen by 10% between 2010 and 2020. According to data from the 2020 Census, 4,548 people called Greater Hazelwood home. When compared to the City, the population in Greater Hazelwood is overrepresented by people under 18 and over 65.
Race
The population is also more racially diverse than the City as a whole, with a nearly even balance of Black and White residents. Fewer than ten percent of residents identified as some other race or more than one race. Greater Hazelwood also had a small share of Hispanic/Latino residents (less than 3%).
● The Greater Hazelwood population decreased by about 10% between 2010 and 2020 from 5,033 to 4,548. The City of Pittsburgh's total population decreased by 1% over the same time (Table 1).
● Since 2010, the number of Black residents has increased in Greater Hazelwood’s population. As of 2020, approximately 48 percent of Hazelwood’s residents identify as African American or Black alone, compared to a city-wide 23 percent (Table 2).
● Between 2010 and 2020, the proportion of Greater Hazelwood’s residents identifying as Black alone and White alone both decreased while the proportion of every other racial group increased (Table 4, Figure 4).

Figure 3: 2020 Population by Race and Ethnicity

Figure 4: Change in Population by Race and Ethnicity
Age
● Greater Hazelwood has a median age of 40.5 as of 2021 which is older than the city median of 33.5. About a quarter of the population is over 65 years old which is higher than the city’s 15 percent. The proportion of the population under 18 years of age is 24 percent compared to Pittsburgh’s 14.6 percent (Table 5).
● 26 percent of Hazelwood households had a resident under 18 years old, compared to 18 percent of all City households (Table 6). 73 percent of the neighborhood’s households with children under age 18 were headed by a female householder with no husband present (Table 6).

Figure 5: Age
Key Findings: Income and Employment
Income
Nearly two in three Greater Hazelwood residents had incomes below or near the official poverty line. About 770 people worked in the neighborhood, and half of these workers were employed in the Health Care and Social Assistance industry. About 1,500 neighborhood residents were employed.
● The proportion of residents living below the poverty line is about 36% with about 62% living under 200% of the poverty line (Table 8), which means that a significant majority of the community is living with financial insecurity.
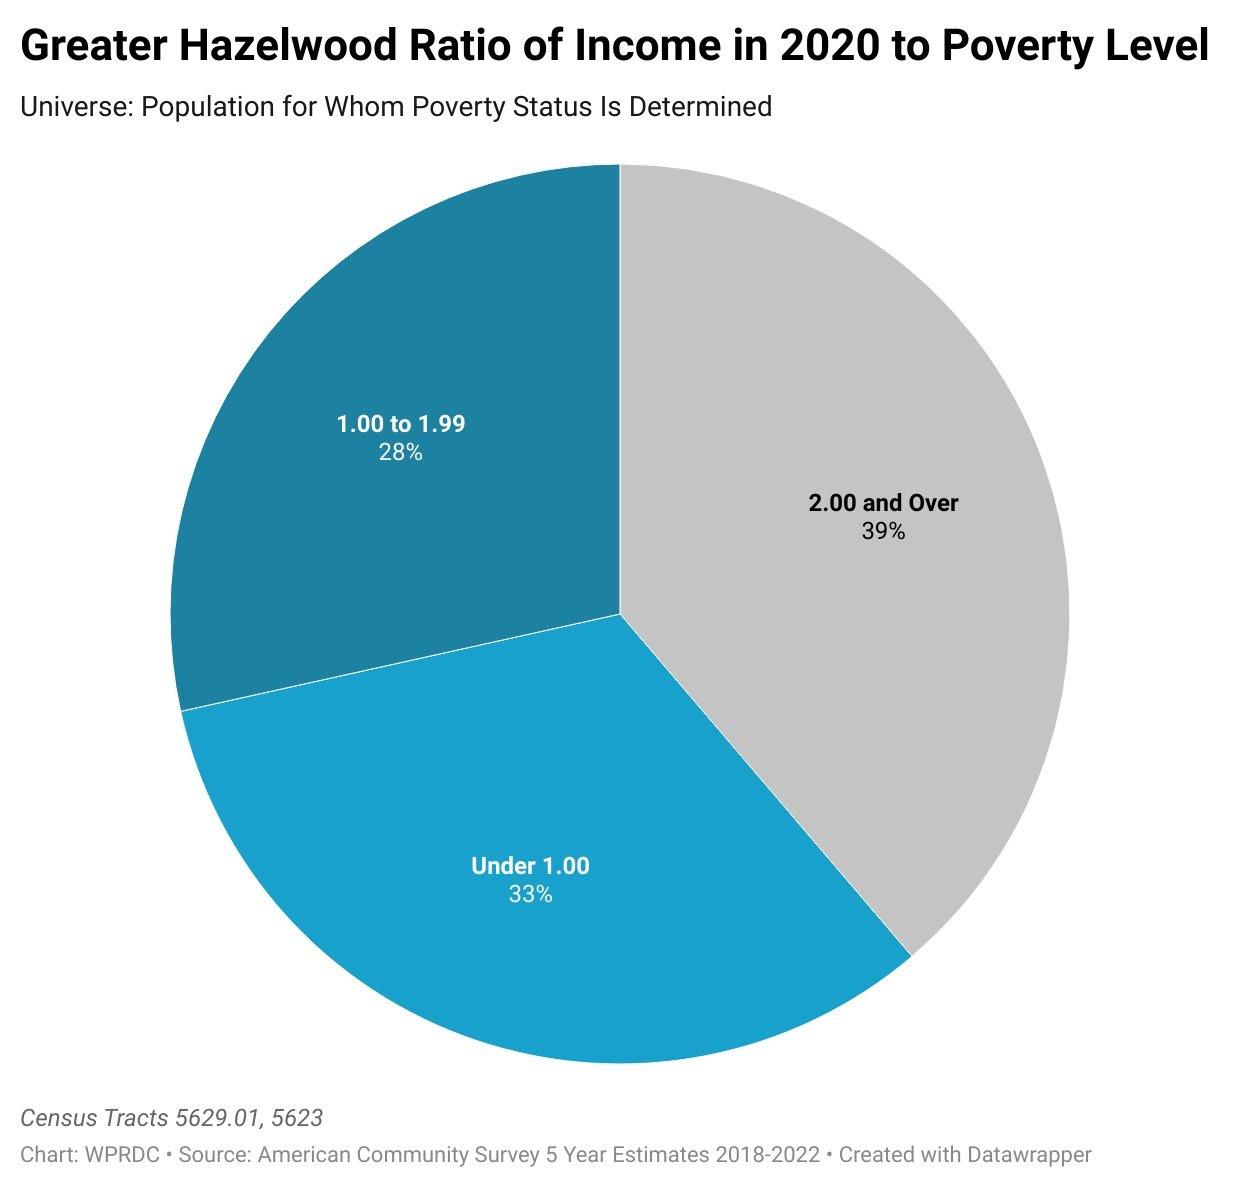
6: Ratio of Income to Poverty Level
● The Census tract that includes the Glen Hazel housing community reported a median household income below $26,000. Over the same period, the median household income in the City exceeded $60,000. The median income of households in the neighborhood’s other tract was $52,000 in 2022 (Table 7).
Figure
Jobs by Place of Work
The term “primary jobs” refers to both public and private-sector jobs, one job per worker. A primary job is the highest paying job for an individual worker.
● In 2021, 770 Primary jobs were located in Greater Hazelwood. This number of primary jobs decreased from 2,017 jobs in 2010 (Table 9, Figure 6).
● In 2021, 60 percent of jobs located in Greater Hazelwood paid over $3,333 per month, as did 69 percent of all jobs located in the City (Table 11).
● In 2021, the “health care and social assistance” industry accounted for half of the jobs by place of work in Greater Hazelwood. In the City of Pittsburgh, this industry accounts for 25 percent (Table 12).
● Of the 770 primary jobs located in Greater Hazelwood, 23 percent were held by people who identify as Black or African American (Table 13).

Figure 7: Primary Jobs Over Time
Jobs by Place of Residence
● 1,514 primary jobs were held by Greater Hazelwood residents in 2021. Overall, these numbers were lower in 2021 compared to 1,875 jobs in 2010 (Table 14).
● 46 percent of Greater Hazelwood residents and 60 percent of City residents held a job paying at least $3,333 per month in 2021 (Table 16).
● Greater Hazelwood’s workforce was employed in a similar mix of industries as all workers living in the City. In 2021, the “health care/social assistance” industry employed 23 percent of neighborhood residents. The “accommodation and food service” and “retail trade” combined employed another 20 percent of residents (Table 17).
● Other industries employing over five percent of residents include “educational services,” “finance and insurance,” “professional, scientific, and technical services,” and “administration and support,” “public administration”, and “finance and insurance.” (Table 17)
● 39 percent of the 1,514 jobs filled by Hazelwood and Glen Hazel residents in 2021 were held by people who identify as Black or African American (Table 18).
● 52 percent of all workers living in the Hazelwood neighborhood worked at a job located in the City of Pittsburgh (Table 19). 10 percent of these commuted to the Downtown area and about 5 percent to the Oakland area (Table 20). About 6 percent of workers lived and worked in Greater Hazelwood (Table 21).
Key Findings: Education and Transportation
Half of Greater Hazelwood’s residents with a job worked within City limits. 18% of workers relied on public transit, while two in three drove. When compared to the City, residents of working age were half as likely to have completed a Bachelor’s degree.
● Nine percent of Greater Hazelwood residents ages 25 to 64 did not complete their high school education, and 12 percent had completed at least a Bachelor’s degree. Comparable figures for the City were 5 percent with less than a high school education, and 27 percent with at least a Bachelor’s degree (Table 19).
● In Greater Hazelwood, the unemployment rate of 13 percent was higher than the City of Pittsburgh’s rate of 6 percent (Table 22).
● 18 percent of Hazelwood residents commuted to work by public transportation, a share larger than the City of Pittsburgh (13 percent). 66 percent of neighborhood residents commuted by car, truck, or van and 8.5 percent worked at home compared to City of Pittsburgh 18 percent (Table 20).

8: Means of Transportation to Work
Figure
Note: Data was accessed through OnTheMap, a web-based mapping and reporting application that shows where workers are employed and where they live. The data are based on tabulated and modeled administrative data, which are subject to error. Learn more about synthetic data through the following report: Understanding Synthetic Data (https://www.urban.org/research/publication/understanding-synthetic-data).
Pittsburgh Public School Feeder Patterns
A feeder school is the assigned Pittsburgh Public School for the neighborhood. Nonfeeder schools include PPS schools that are not their "feeder" or assigned school. Hazelwood feeder schools include Minadeo PreK-5, Sterrett 6-8, Mifflin PreK-8, Greenfield PreK-8, and Allderdice 9-12. This data is only for Pittsburgh Public schools - not for charter or non-public schools.
● 53 percent of K-5 students in the neighborhood attended the feeder school and 36 percent attended a non-feeder school.
● 58 percent of 6-8 students attended the feeder and 31 percent attended a non-feeder.
● 67 percent of the high school students attended the feeder school with 23 percent attending a non-feeder school (Table 23, Figure 8).

Figure 9: Pittsburgh Public Feeder Patterns
Key Findings: Housing, Markets, and Real Estate
Housing prices in Greater Hazelwood trailed those in the City of Pittsburgh. A little less than half of the units were owner-occupied, and about one of every five units were vacant. At least half of the neighborhood’s housing units were built before the U.S. entered World War Two.
● The Greater Hazelwood neighborhood has a total of 2,464 housing units with 1,966 units occupied. 44 percent (873) of occupied housing units are owner occupied while 56 percent (1,093) are occupied by renters (Table 25).
● As of March 2024, for the Greater Hazelwood neighborhood, there were 2,947 total residential addresses. Of the 2,947 addresses, there are 820 vacant residential addresses. Of these vacant addresses, 626 addresses were classified as “No-stat vacant residential” and 192 were classified as “vacant addresses” 7 (Table 26). About 20% of housing units are vacant (Table 25).
● In 2021, the Hazelwood neighborhood's average residential sales price was $97,150 which is lower than the City of Pittsburgh average of $202,750. In order to make these comparable, the average residential sales price has been adjusted to account for inflation. The totals are calculated in 2021 dollars. (Table 24).
● The median year a structure was built is 1940. Of the occupied units in Greater Hazelwood, 50 percent were built prior to 1940. 72 percent of occupied units were built prior to 1960 (Table 25).
● The average delinquent property had a cumulative City tax delinquency of $3,073. 27 percent of Hazelwood’s 718 City tax delinquent parcels were vacant land (Table 28).
● 42 percent of Greater Hazelwood households spend more than thirty percent of their income on housing costs compared to the City of Pittsburgh’s 30 percent (Table 25). Almost 40 percent of renters in Greater Hazelwood are spending more than 50 percent of their income on housing costs (Table 29).
7 “No-stat vacant residential” indicates residential housing vacancy but may also indicate other conditions such as a home under construction, two addresses merged, served by a post office box, demolished, or some other condition. “Vacant” indicates vacancy longer than 90 days.
Demographics
Source: https://data.wprdc.org/dataset/2020-census-redistricting-data-extracts
Table 2. Population by Race and Ethnicity, 2010
Source: https://data.wprdc.org/dataset/2020-census-redistricting -data-extracts
Table 3. Population by Race and Ethnicity, 2020
Source: https://data.wprdc.org/dataset/2020-census-redistricting -data-extracts
Table 4. Population Change by Race and Ethnicity, 2010-2020
Source: https://data.wprdc.org/dataset/2020-census-redistricting-data-extracts
Table 5. Age, 2022
Source: Social Explorer Tables: ACS 2022 (5-Year Estimates) (SE), ACS 2022 (5-Year Estimates), Social Explorer; U.S. Census Bureau
6. Households by Presence of People Under 18 Years by Household Type
Source: Social Explorer Tables: ACS 2022 (5-Year Estimates) (SE), ACS 2022 (5-Year Estimates), Social Explorer; U.S. Census Bureau
Income
Source: Social Explorer Tables: ACS 2022 (5-Year Estimates) (SE), ACS 2022 (5-Year Estimates), Social Explorer; U.S. Census Bureau
Table
Table 7. Median Household Income, 2022
Table 8. Ratio of Income to Poverty Level, 2022
Source: Social Explorer Tables: ACS 2022 (5-Year Estimates) (SE), ACS 2022 (5-Year Estimates), Social Explorer; U.S. Census Bureau
Table 9. Number of Primary Jobs by Place of Work, Hazelwood and the City of Pittsburgh, 2010-2021
Source: U.S. Census Bureau, OnTheMap Application and LEHD Origin-Destination Employment Statistics (Beginning of Quarter Employment, 2nd Quarter of 2002- 2021).
Table 10. Primary Jobs by Place of Work - Worker Age, 2010-2021
Source: U.S. Census Bureau, OnTheMap Application and LEHD Origin-Destination Employment Statistics (Beginning of Quarter Employment, 2nd Quarter of 2002- 2021).
Table 11. Primary Jobs by Place of Work - Earnings, 2010-2021
Source: U.S. Census Bureau, OnTheMap Application and LEHD Origin-Destination Employment Statistics (Beginning of Quarter Employment, 2nd Quarter of 2002- 2021).
Table 12. Primary Jobs by Place of Work - NAICS Industry Sector
Source: U.S. Census Bureau, OnTheMap Application and LEHD Origin-Destination Employment Statistics (Beginning of Quarter Employment, 2nd Quarter of 2002- 2021).
Table 13. Primary Jobs by Place of Work - Race and Ethnicity
Source: U.S. Census Bureau, OnTheMap Application and LEHD Origin-Destination Employment Statistics (Beginning of Quarter Employment, 2nd Quarter of 2002- 2021).
Table 14. Primary Jobs by Place of Residence, 2010, 2021
Primary Jobs
Source: U.S. Census Bureau, OnTheMap Application and LEHD Origin-Destination Employment Statistics (Beginning of Quarter Employment, 2nd Quarter of 2002- 2021).
Table 15. Primary Jobs by Place of Residence - Worker Age, 2010, 2021
Source: U.S. Census Bureau, OnTheMap Application and LEHD Origin-Destination Employment Statistics (Beginning of Quarter Employment, 2nd Quarter of 2002- 2021).
Table 16. Primary Jobs by Place of Residence - Earnings, 2010, 2021
Source: U.S. Census Bureau, OnTheMap Application and LEHD Origin-Destination Employment Statistics (Beginning of Quarter Employment, 2nd Quarter of 2002- 2021).
Table 17. Primary Jobs by Place of Residence - NAICS sector
Source: U.S. Census Bureau, OnTheMap Application and LEHD Origin-Destination Employment Statistics (Beginning of Quarter Employment, 2nd Quarter of 2002- 2021).
Table 18. Primary Jobs by Place of Residence - Worker Race/Ethnicity
Source: U.S. Census Bureau, OnTheMap Application and LEHD Origin-Destination Employment Statistics (Beginning of Quarter Employment, 2nd Quarter of 2002- 2021).
Table 19. Job Counts by Census Tracts Where Workers are Employed - Primary Jobs
Source: U.S. Census Bureau, OnTheMap Application and LEHD Origin-Destination Employment Statistics (Beginning of Quarter Employment, 2nd Quarter of 2002- 2021).
Table 20. Job Counts by County Subdivisions Where Workers
Source: U.S. Census Bureau, OnTheMap Application and LEHD Origin-Destination Employment Statistics (Beginning of Quarter Employment, 2nd Quarter of 2002- 2021)
Table 21. In-Area Employment Efficiency - Primary Jobs
Source: U.S. Census Bureau, OnTheMap Application and LEHD Origin-Destination Employment Statistics (Beginning of Quarter Employment, 2nd Quarter of 2002- 2021)
Table 22. Educational Attainment, 2022
Greater Hazelwood residents age 25-64 without a high school education
Greater Hazelwood residents age 25-64 with some college
Hazelwood residents age 25-64 with a Bachelor's degree
City of Pittsburgh residents age 25-64 without a high school education
City of Pittsburgh residents age 25-64 with some college
City of Pittsburgh residents age 25-64 with a Bachelor's degree
Source: Social Explorer Tables: ACS 2022 (5-Year Estimates) (SE), ACS 2022 (5-Year Estimates), Social Explorer; U.S. Census Bureau
Table 23. Means of Transportation to Work, 2022
Source: Social Explorer Tables: ACS 2022 (5-Year Estimates) (SE), ACS 2022 (5-Year Estimates), Social Explorer; U.S. Census Bureau
Table 24. Labor Force for Population 16 Years and Over, 2022
Source: Social Explorer Tables: ACS 2022 (5-Year Estimates) (SE), ACS 2022 (5-Year Estimates), Social Explorer; U.S. Census Bureau
Table 25. Unemployment Rate for Civilian Population in Labor Force 16 Years and Over, 2022
Source: Social Explorer Tables: ACS 2022 (5-Year Estimates) (SE), ACS 2022 (5-Year Estimates), Social Explorer; U.S. Census Bureau
Table 26. Pittsburgh Public Enrollment by school and neighborhood - all grades 2020-2021
Greater Hazelwood Neighborhood
Source: Pittsburgh Public Schools accessed through WPRDC https://data.wprdc.org/dataset/pittsburgh-public-schools- enrollment
Table 28. Occupied Housing Units by Year Structure Built and Median Year
Source: Social Explorer Tables: ACS 2022 (5-Year Estimates) (SE), ACS 2022 (5-Year Estimates), Social Explorer; U.S. Census Bureau
Table 29. USPS Residential addresses, March 2024
Table 30. Households by Household Type
Table 31. City Property Tax Delinquency
Cumulative Delinquency
Source: City of Pittsburgh accessed through WPRDC https://data.wprdc.org/dataset/city-of- pittsburgh-property-taxdelinquency/resource/ed0d1550-c300-4114- 865c-82dc7c23235b
Table 32. Housing Costs As A Percentage Of Household Income In The Past 12 Months
Calculated
Source: Social Explorer Tables: ACS 2022 (5-Year Estimates) (SE), ACS 2022 (5-Year Estimates), Social Explorer; U.S. Census Bureau
Important Note: Quantitative data only tells part of the story. We recommend thinking of this data as a tool to bring people together to spur discussion, inform questions, and build relationships.
Contact Our Team:
Greater Hazelwood Neighborhood Commitment Director, Heidi Ward, haw221@pitt.edu
Neighborhood Commitments is a program housed in the University of Pittsburgh’s Office of Engagement and Community Affairs.