Australian Listed Dealer comparison Pitcher Partners Motor Industry Services September 2022

Despite this, the automotive reporting season was dominated by commentary around the improved performance by previous acquisitions, as well as the listed’s plans to continue to grow in a supply constrained market. With most analysts not expecting the supply issues to be resolved in the coming year, how do the big listed groups get bigger without overpaying and over capitalising on dealership assets trading at inflated earnings?
JunesummaryExecutive2022results
This is the first iteration of the Pitcher Partners Motor Industry Services – Australian Listed Dealer Comparison and it could not have come at a more interesting time to be in the industry.
2
The listed groups Eagers Automotive (ASX:APE), Autosports Group (ASX:ASG) and Peter Warren Automotive Holdings (ASX:PWR) have so far weathered the COVID-19 pandemic and supply shortage ‘Chipdemic era’ with relative ease.
Throw into the mix the two biggest disruptions to dealerships in the last 100 years; Electric Vehicles (EVs) along with the significant infrastructure spend that is required and the agency sales model, the future is a bit cloudier and more uncertain than the relative sunshine (and profits) of today.
Revenues and volumes may be down on pre COVID-19 levels (2019) but gross margins are elevated and profits are double and triple what they have been in the past, up to 3.43% (profit % on sales, PoS) – a 6.84% improvement on the previous corresponding period (pcp).
New vehicle sales in the six months to June 2022 were down by 5.2% in comparison to June 2021 per VFacts for the Australian market. This is a significant 11.1% decline since June 2018. That’s 67,000 less new vehicle sales in only the first half of the year for the Australian market.

What will happen with volumes?
EVs will fundamentally change the franchise dealership landscape. Putting the issue of significant investment in infrastructure aside, the EV dealer of the future will look markedly different to the franchise dealer of today. Click here to read our article on 'Making money in an EV world'
Australian new motor vehicle sales decreased by 5.22% for the first six months of 2022 to 537,858 units compared to the pcp at June 2021. Assuming the current supply constraints continue, annualised volumes are expected to be largely in line with the unit volume sold in 2019 – 1,062,867. Interestingly, but not unexpected, is the level of order bank that the three listed companies are continuing to build. APE has seen their order bank grow approximately 330% since December 2020 1 , PWR is up 98% since June 20212 and ASG is writing 25% more orders than delivery, approximately equal to a 4,000 new car increase in ASG's order bank3. Going forward, what is most interesting is what will come first – loss of orders as consumers cannot afford orders placed over six months ago or sufficient supply increases to satisfy demand whilst market conditions are still buoyant.
No one can really quantify what the impact of the agency model will be in these early days. What is abundantly clear, however, is that whatever shape or form an agency agreement takes, it must result in a win-win-win situation. The consumer needs to win by having a better overall purchasing experience, the car brand needs to win by getting more customer access, more control of the sales process and more margin, and the dealers need to win by maintaining their business profitability and be able to continue to service their local community.
Business sales have suffered the most down 12.8% with Rental (down 4.6%) the next most impacted as dealers focussed on more profitable private sales. Government and Private sales continue to be the best performers, down only 1.5% and 1.0% respectively driven by moderate increases in SUV sales.
Electric Vehicles (EVs)
Continued aggregation
1 Eagers Automotive Limited, '1H 2022 Results' Eagers Automotive Limited, 2research/1.0/file/2924-02558024-2A1393263?access_token=83ff96335c2d45a094df02a206a39ff4,https://cdn-api.markitdigital.com/apiman-gateway/ASX/asx-(accessed12September2022).PeterWarrenAutomotiveHoldingsLimited,'FY22ResultsPresentation'
3
First half volumes for SA was down 3.2%, TAS marginally lower and NT was the best performing market being flat on pcp.
Impact from agency
Heavy commercial vehicles were the only segment to record an increase on pcp, up 7.8% driven by government incentives such as instant asset write off. This was primarily due to heavy duty and medium duty trucks increasing by a significant 19.5% and 11.9% respectively. Light duty trucks account for approximately 50% of the segment and were up a modest 0.6%.
The following are common questions we've encountered most in the last six months.
Consolidation of the market will heat up as the big continue to get bigger. In our view, in order to compete in an EV and agency era, the major players will need to increase their size to at least $3.0bn in revenue with efficient operating expense management and optimal capital structures. This will mean that as the industry transforms and supply returns, there will be many dealer groups looking at their succession plans.
2022 results and 2022/23 outlook
New vehicle sales were down across all states. However, the biggest declines from pcp were the ACT (down 9.3%), NSW (down 6.6%), Queensland (down 6.4%) and Western Australia (down 6.1%).
Tesla began reporting sales figures to VFacts in 2022. The estimated 2021 impact on market volume is an increase of 5,149 units or 0.7% per VFacts. According to Drive, this figure is actually 12,058 or 1.7% of the market by using registration data4
VIC performed relatively well, only reducing 2.9% after a positive start in the first three months compared with the prior year when lockdowns were still in place.
Peter Warren Automotive Holdings Limited, 3a39ff4,markitdigital.com/apiman-gateway/ASX/asx-research/1.0/file/2924-02558832-2A1393760?access_token=83ff96335c2d45a094df02a206https://cdn-api.(accessed12September2022).AutosportsGroupLimited,'2022FYPresentation' Autosports Group Limited, 4research/1.0/file/2924-02557356-2A1392900?access_token=83ff96335c2d45a094df02a206a39ff4,https://cdn-api.markitdigital.com/apiman-gateway/ASX/asx-(accessed12September2022).J.Dowling,'Exclusive:TeslaAustraliasalesin2021revealedstatebystate' Drive, https://www.drive.com.au/news/exclusive-teslaaustralia-sales-in-2021-revealed-state-by-state/, (accessed 12 September 2022).
Australian consumer sentiment is already below the bottom of what was experienced during interest rate rises due to inflation in 1994, the dot-com bubble of 2000 and the Global Financial Crisis in 2009.
Inflation and wage growth
Interest rates
The availability of cheap consumer debt over the last eight years has driven a surge in house prices, and contributed to significant increases in home loan debt and average loan size, as well as car finance. As interest rates increase and historically low fixed rates mature in the next 6-18 months, the effect on discretionary spending will see a downward pressure or demand for new vehicles.
CBA1 expects headline inflation to peak at 6.5% in Q3 2022 before reducing to within its target, whilst wages growth will lag at 3.25%. In a tightening market, new vehicle sales are one of the first items to be impacted as consumers rein in the purse strings. This provides opportunities for dealers who pivot to used cars.
Current market conditions
RBA lifting rates quickly – now at 1.85%, peak of 2.60% 7.46.35.24.13.0580540500460420Jan 15 Jul 17 Jan 20 Jul 22 Thousands $Abn % CBA(f)
4
This is a lead indicator to potential headwinds in future trading periods.
Source:
ABS, CBA AU: REAL GDP & UNEMPLOYMENT (quarterly)GDP,lhsUnemployment rate, rhs 43210 Jan 19 Jan 20 Jan 21 Jan 22 Jan 23 Jan 24 % RBA CASH RATE FORECAST CBA cash rate target forecast % Source: RBA, CBA Actual Peak (15 June) Current (19 August) Inflation data has been very strong 6.04.02.00.06.04.02.00.0Mar 08 Mar 12 Mar 16 Mar 20 Mar 24 % % CBA(f) TrimmedHeadlineCPI CBA FORECAST: CPI (annual % change) Source: ABS, CBA 630-3-3036Mar 05 Mar 10 Mar 15 Mar 20 INFLATION (annual % change) % Non Discretionarydiscretionary % Source: ABS Discretionaryextobacco -3036Sep 09 Sep 12 GOODS & SERVICES (annual Source: ABS % Wages data less strong 0.0 1.0 ProfWholesaleConstrManufRentalServicesCommunicCult&RecFinanceAllAdminGovadminTransportAccomPers&othRetailHealthEducationUtilitiesMining WAGE PRICE (annual % change, % 2.52.01.51.02.52.01.51.0Jul 13 Jan 15 Jul 16 Jan 18 Jul 19 Jan 21 Jul 22 %% CBA wage Indicatorrate WageIndexPrice CBA WAGE INDICATOR (annual % change) Source: CBA now? 1401201008060Index CBA 12011010090801201101009080 1 13 25 37 49 61 73 Months after first rate hike CONSUMER SENTIMENT (over various rate hike cycles) Aug 94 May 02 Oct 09 Nov 99 Current cycle (May 22) Index Index Source: WBC MI, CBA 6420-2-4-612011010090807060Jan 00 Jan 06 Jan 12 Jan 18 CONSUMER SENTIMENT & CONSUMPTION GROWTH Index % Source: WBC/MI, ABS Annual sentimentConsumergrowthconsumption(rhs)(lhs) 1 B. Allen, Inflation, interest rates and what happens now (Australia: Commonwealth Bank of Australia, 2022).

The key macroeconomic headwinds dealer groups will face in the next 12 months include:
Consumer sentiment
4003002001000Jan 06 Thousands '000 JobSearch,Source:80060040020008006004002000Nov 10 Nov 13 Nov 16 Nov 19 Nov 22
ABS Jul
Unemployed '000 vacanciesjob
Due to constricted migration, the Australian labour market is currently at its inflection point where there are more job vacancies than available people. A result of this will be higher than average wage growth as companies compete for talent. This tension will not ease until overseas migration returns to pre COVID-19 levels.
5
AUSTRALIA: PETROL PRICES
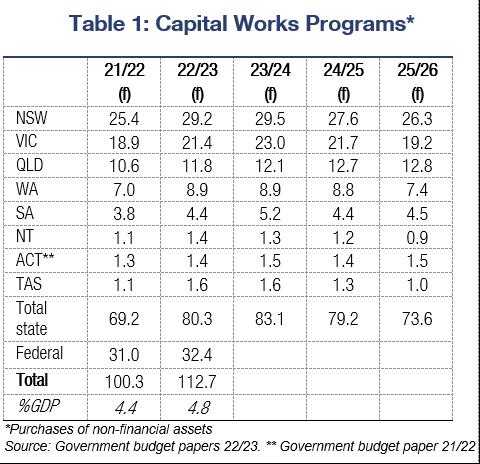
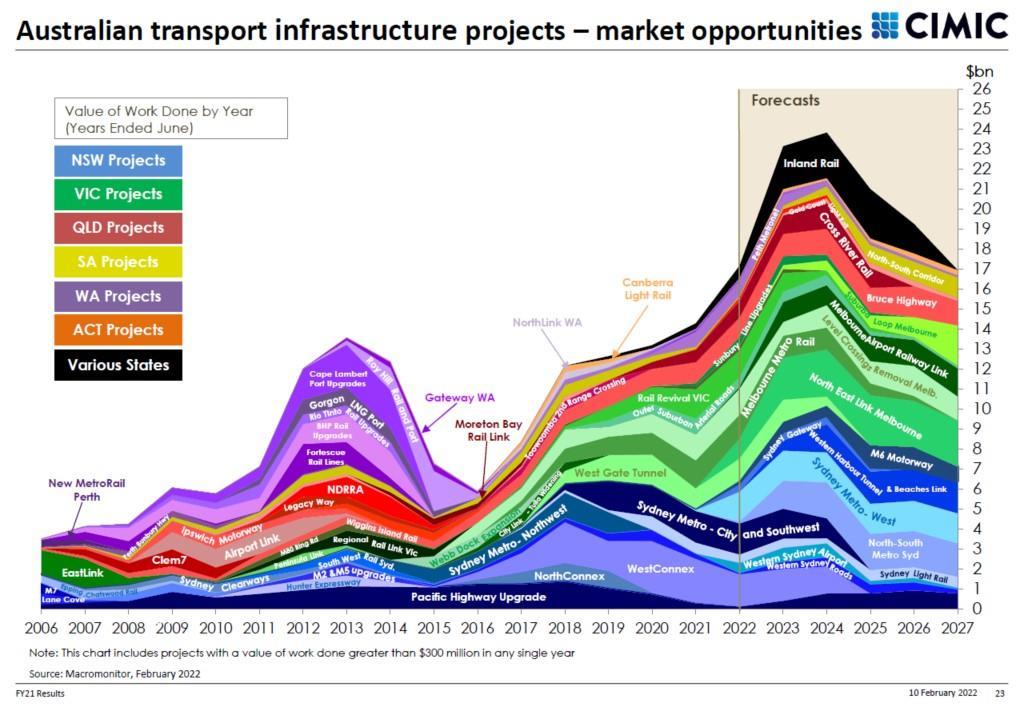
Plenty of public investment and infrastructure in the pipeline
VACANCIES & UNEMPLOYED
has been very strong %20151050-5 19517014512095Jan 19 Jan 20 Jan 21 Jan 22 Jan 23 c/l Source: AIP, CBA, Bloomberg
CBA (f) 201510-505 NSW VIC QLD SA WA Tas ACT NT AU
Source: CBA, state budget papers, electricity market regulators
ABS
Current market conditions (continued)
Source: 22
State and Federal governments have committed to significant infrastructure programs across the country. This government spending will underpin the economy and provide a baseline of activity, its intended purpose during times of uncertainty. This spending is not expected to peak until 2024, and therefore any downturn in private new car sales can be offset by fleet and rental customers
Employment
Fuel prices
'000
2022/23 ELECTRICITY PRICES (consumer price % change after rebate)
Ongoing conflict in the Ukraine has inflated oil, and therefore fuel prices. Without a resolution to the conflict or relaxation of trade sanctions, petrol prices can be expected to remain high as global demand is stretching supply chains and resources.
… and labour demand exceptionally
Infrastructure spend
6 Listed Dealer Groups consolidated performance vs Resultspcp snapshot Average Cash Conversion Cycle days 40.5 Cash Conversion improved primarily due to better collections and improved inventory turnover. days Interest Coverage Ratio 6.3 Interest Coverage increased by 44.5% on the back of improved earnings and lower floorplan costs. X Total Debt to Equity % 9.2% Total Debt to Equity decreased significantly due to reduction in floor plan and improving earnings. EBIT AUD 3.9% EBIT decreased by 3.9% YOY, as depreciation and amortisation expenses reduce YOY. Average Inventory Days Supply Inventory Days Supply decreased by 0.3% as a result of ongoing supply contraints. 58.0days NPAT as a % of Total Revenue Statutory NPAT as a % of Total Revenue continued to increase YOY, increasing to 3.4% on average. 6.8% Total Revenue AUD 8.7% Revenue declined to 11.76bn across all listed entities on a like for like basis. EBITDA AUD 6.5% EBITDA decreased by 6.5% YOY, demonstrating proficient variable expense management when compared to the decrease in total revenue. Gross Margin 19.3% Overall, Gross Margin has increased YOY by 9.1%, despite Gross Profit ($) down by 0.4% Return on Equity 18.0% Return on equity decreased as a result of increased equity from retained earnings. Total Enterprise Value to EBIT 10.7 The weighted average Total Enterprise Value to Earnings before interest and taxes is 10.7x compared to 10.5x at June 21. X Price to Earnings per Share 10.2 The share price to earnings per share (before extraordinary items) is 10.2x compared to 8.6x at June 21. X

The interesting
M&A activity is heating up with all three groups in prime position to take on acquisition opportunities as they arise.
Total Revenue Growth YOY -11.9% -5.2% -5.2%
EBIT / Interest Exp 7.1x 6.0x 5.8x Interest Expense (63.8) (16.4) (15.5)
Average Cash Conversion Cycle 40.4 48.4 73.3
²Growth rates for the LTM period are calculated against the LTM period ending 12 months before.
Gross Profit 1,566.9 373.8 327.8
+
Total Debt/Equity 184.4% 128.8% 102.6%
The not so good
Total Revenue 8,191.1 1,876.0 1,696.6
LT Debt/Equity 100.3% 65.1% 56.0%
Liquidity Ratios
Margin % 5.8% 5.2% 5.7%
2. Parts and Service revenue significantly impacted by COVID-19 disruptions in back end operations.
Total Debt 2,122.4 579.1 491.5
Total Liabilities/Total Assets 69.9% 63.3% 56.5%
0.3x Cash from Ops. to Curr. Liab. 0.2x 0.3x 0.2x In millions of AUD, except per share items. Source: S&P Capital IQ Pro.
Working Capital 36.0 (97.5) 48.9 Current Ratio 1.0x 0.8x 1.1x Quick Ratio 0.4x 0.3x
1. Strong order bank growth, as order-write remains above deliveries for all three listed groups.
Key takeaways from the three listed groups' results include:
At a glance
Total Equity 1,150.8 449.5 479.0
Financial Performance
+ Total
¹All results are taken from the most recently filed statement for each period.
7
Net Income 293.6 53.4 56.5
– 12 Jun-30-2022Amonths 12 Jun-30-2022Amonths 12 Jun-30-2022Amonths
Common Dividends Paid (160.6) (28.1) -15.5
Margin % 19.1% 19.9% 19.3%
Total Funding Costs 5.4% 4.2% 18.1%
EBITDA 588.7 149.1 122.7 Margin % 7.2% 7.9% 7.2%
Average Days Payable Out. -23.7 -20.0 -5.3
3. Strong performances from acquisitions for all three groups.
EBIT 478.2 96.8 96.3
Inventory Turnover
The good
Capital Structure and Funding Ratios
Market Capitalization 3,459.9 420.7 439.5 Cash and Short Term Investments 326.3 100.3 52.2 Total Debt 2,122.4 579.1 491.5 Minority Interest 25.7 5.3Enterprise Value (TEV) 5,281.6 904.9 878.8 Efficiency Ratios 7.2x 6.4x 5.5x Accounts Receivable Turnover 26.9x 31.7x 30.1x
-
LTM²
12 months to 30 June 2022
Margin % 3.6% 2.8% 3.3%
Management
3. Used vehicles sales impacted by stock acquisition headwinds (trade-ins).
2. Gross margins increased with strong new and used vehicle pricing, offsetting some negative sales mix shift (weaker back end).
Average Days Sales Out. 13.6 11.5 12.1
Average Inventory Days Supply 50.5 56.9 66.5
APE ASG PWR
Australian Listed Dealer Groups comparison –
= Total
1. New vehicle revenues and volumes impacted by constrained stock.
June
Depreciation & Amort. 110.6 1.4% 52.3 2.8% 26.4 1.6%
Other Operating Exp., Total 1,112.1 13.6% 274.6 14.6% 238.8 14.1%
EBT Excl. Unusual Items 378.1 4.6% 82.8 4.4% 88.2 5.2%
Merger & Related Restruct. Charges (2.4) (2.3) Gain (Loss) On Sale Of Assets 64.8 Asset Writedown (6.9) Other Unusual Items (5.1)
Other Operating Expense/(Income) 347.7 4.2% 69.2 3.7% 33.8 2.0%
Income Tax Expense 120.8 1.5% 25.8 1.4% 24.3 1.4%
Income/(Loss) from Affiliates 1.015 -Other Non-Operating Inc. (Exp.) (13.9) - 14.5
Interest and Invest. Income 0.0 0.0% 0.1 0.0%
% of sales of sales of sales
8
Total Revenue 8,191.1 1,876.0 1,696.6
LTM –Jun-30-months122022
Earnings of Discontinued Ops. (8.0) Net Income to Company 307.1 3.7% 54.6 2.9% 56.5 3.3%
Currency AUD AUD AUD Revenue 8,179.7 1,876.0 1,695.9
12Jun-30-months2022 %
Interest And Invest. Income (Rev) 11.4 Other Revenue 0.8
Interest Expense (63.8) -0.8% (16.4) -0.9% (15.5) -0.9%
Operating Income 454.8 5.6% 99.2 5.3% 89.0 5.2% 0
at 30
Earnings from Cont. Ops. 315.1 3.8% 54.6 2.9% 56.5 3.3%
APE ASG PWR
EBT Incl. Unusual Items 435.9 5.3% 80.4 4.3% 80.8 4.8%
Gross Profit 1,566.9 19.1% 373.8 19.9% 327.8 19.3%
For the Fiscal period ending
12Jun-30-months2022 %
Minority Int. in Earnings (13.5) (1.2)
Comparison2022 Income Statement
Net Interest Exp. (63.8) -0.8% (16.4) -0.9% (15.3) -0.9%
Net Income 293.6 3.6% 53.4 2.8% 56.5 3.3% In millions of AUD, except per share items.
Cost Of Goods Sold 6,624.2 1,502.2 1,368.8
Selling General & Admin Exp. 653.8 8.0% 153.1 8.2% 178.6 10.5%
Isuzu Ute 3,457 3,964 18,789 18,805 (507) (16)
Mercedes-Benz Cars 3,909 3,330 14,456 16,141 579 (1,685) 17.39% -11.66% 4.08% 3.12% 31.10% 2.78% 2.93% -4.96%
Subaru 3,575 3,021 16,997 20,093 554 (3,096) 18.34% -18.21% 3.74%
Western Star 25 42 145 162 (17) (17) -40.48%
Chrysler 7 8 76 78 (1) (2) -12.50% -2.63% 0.01% 0.01% -2.28% 0.01% 0.01% 3.39%
McLaren 7 10 28 45 (3) (17) -30.00% -60.71% 0.01% 0.01% -21.82% 0.01% 0.01% -33.97%
Lotus 2 5 62 31 (3) 31 -60.00% 50.00% 0.00% 0.00% -55.33% 0.01% 0.01% 112.23%
GWM 2,440 2,075 8,557 7,564 365
Land Rover 404 908 2,601 3,867
Polestar 201 0 562 0 201 562 100.00% 100.00% 0.21% 0.00% 100.00% 0.11% 0.00% 100.00% Porsche 629 411 3,162 2,688 218 474 53.04% 14.99% 0.66% 0.38% 70.92% 0.61% 0.49% 24.83% RAM 633 581 2,572 1,887 52 685 8.95% 26.63% 0.66% 0.54% 21.68% 0.49% 0.34% 44.64% Renault 1,080 1,186 5,068 3,483 (106) 1,585 -8.94% 31.27% 1.13% 1.11% 1.70% 0.97% 0.63% 54.41% 8 4 33 23 4 10 100.00% 30.30% 0.01% 0.00% 123.37% 0.01% 0.00% 52.25% 692 880 3,286 5,653 (188) (2,367) -21.36% -72.03% 0.72% 0.82% -12.18% 0.63% 1.02% -38.32% SsangYong 308 295 1,443 1,421 13 22 4.41% 0.32% 0.28% 16.61% 0.28% 0.26% 7.76% 2.83% 3.27% 3.64% -10.24% 0.56% 2.15% 1.88% 14.60% 11.77% 0.89% -56.08% 2.25% 4.07% -44.84% 2.26% 4.01% -43.78% -19.25% 2.99% 3.23% -7.16% 2.70% 3.67% -26.43% 0.00% 0.00% 100.00% 0.00% 0.00% 100.00% 101.70% 3.08% 1.86% 4.02% 58.93% 5.83% 23.55% -11.72% 0.58% -47.33% 0.81% -21.47%
LDV
Jeep 659 874 3,435 3,969
Skoda
65.57% Volvo Commercial 273 152 1,042 740 121 302 79.61% 28.98% 6.39%
Rolls-Royce
Fiat 32 63 297 263 (31) 34 -49.21% 11.45% 0.03% 0.06% -43.27% 0.06% 0.05% 19.83%
Man 48 38 207 139 10 68 26.32% 32.85% 1.12% 1.00%
Ferrari 20 13 106 87 7 19 53.85% 17.92% 0.02% 0.01% 71.82% 0.02% 0.02% 29.29%
Mitsubishi 5,846 5,641 41,748 37,443 205 4,305 3.63% 10.31% 6.11% 5.28% 15.74% 8.03% 6.79% 18.32%
Genesis
32.17%
MG 4,403 4,303 24,507 19,544 100 4,963 2.32% 20.25% 4.60% 4.03% 14.28% 4.71% 3.54% 33.06%
Nissan 1,907 4,036 15,249 23,982 (2,129) (8,733) -52.75% -57.27% 1.99% 3.78% -47.23% 2.93% 4.35% -32.53%
1.52%
UD Trucks 155 68 551 292 87 259 127.94% 47.01% 3.63% 1.80%
Mercedes-Benz Vans 358 536 1,954 2,320 (178) (366) -33.21% -18.73% 0.37% 0.50% -25.40% 0.38% 0.42% -10.63%
1.11%
Peugeot 173 250 1,011 1,118 (77) (107) -30.80% -10.58% 0.18% 0.23% -22.71% 0.19% 0.20% -4.04%
Fiat Professional 49 48 336 506 1 (170) 2.08% -50.60% 0.05% 0.04% 14.01% 0.06% 0.09% -29.54%
Hyundai 8,259 7,357 38,167 38,634 902 (467)
9 VFACTS National – June 2022Market share Month YTD Variance +/- VOL % MTD % +\- YTD % +\Total market 2022 2021 2022 2021 Month YTD Month YTD Mshare 22 Mshare 21 % Mshare 22 Mshare 21 % Alfa Romeo 59 72 295 304 (13) (9) -18.06% -2.96% 0.06% 0.07% -8.48% 0.06% 0.06% 2.97% Alpine 0 1 4 6 (1) (2) -100.00% -50.00% 0.00% 0.00% -100.00% 0.00% 0.00% -29.26% Aston Martin 19 7 68 68 12 - 171.43% 0.00% 0.02% 0.01% 203.14% 0.01% 0.01% 6.12% Audi 1,618 1,608 6,308 9,013 10 (2,705) 0.62% -42.88% 1.69% 1.50% 12.38% 1.21% 1.63% -25.73% Bentley 24 21 119 108 3 11 14.29% 9.24% 0.03% 0.02% 27.64% 0.02% 0.02% 16.92% BMW 2,327 3,078 11,893 14,108 (751) (2,215) -24.40% -18.62% 2.43% 2.88% -15.57% 2.29% 2.56% -10.55%
Citroen 14 22 172 71 (8) 101 -36.36% 58.72% 0.01% 0.02% -28.93% 0.03% 0.01% 157.07%
Chevrolet 147 315 1,003 902 (168) 101 -53.33% 10.07% 0.15% 0.29% -47.88% 0.19% 0.16% 18.00%
Ford 4,972 8,456 28,562 37,883 (3,484) (9,321) -41.20% -32.63% 5.20% 7.91% -34.33% 5.49% 6.87% -19.99% 120 85 463 258 35 205 41.18% 44.28% 0.13% 0.08% 57.67% 0.09% 0.05% 90.43% 993 17.59% 11.60% 2.55% 1.94% 31.33% 1.65% 1.37% 20.05% (3,150) 6.04% -41.33% 1.08% 0.91% 18.43% 1.47% 1.95% -24.92% 12.26% -1.22% 8.63% 6.88% 25.38% 7.34% 7.00% 4.83% -12.79% -0.09% 3.61% 3.71% -2.60% 3.61% 3.41% 6.03% 100.00% 100.00% 0.01% 0.00% 100.00% 0.00% 0.00% 100.00% (178) (290) -71.49% -70.22% 0.07% 0.23% -68.15% 0.08% 0.13% -37.66% (215) (534) -24.60% -15.55% 0.69% 0.82% -15.79% 0.66% 0.72% -8.16% 7.48% 3.87% 8.86% 7.38% 20.04% 7.58% 6.87% 10.39% (4) (37) -25.00% -84.09% 0.01% 0.01% -16.24% 0.01% 0.01% -42.36% (504) (1,266) -55.51% -48.67% 0.42% 0.85% -50.31% 0.50% 0.70% -28.63% 1,033 1,725 7,173 7,184 (692) (11) -40.12% -0.15% 1.08% 1.61% -33.12% 1.38% 1.30% 5.95% 617 992 3,937 5,392 (375) (1,455) -37.80% -36.96% 0.64% 0.93% -30.53% 0.76% 0.98% -22.52%
Lamborghini 12 16 44 81
Honda 1,036 977 7,621 10,771 59
Lexus
MINI 323 570 1,637 2,098 (247) (461) -43.33% -28.16% 0.34% 0.53% -36.71% 0.31% 0.38% -17.20%
4.72%
SEA Electric 2 0 5 0 2 5 100.00% 100.00%
Maserati 79 66 313 292 13 21 19.70% 6.71% 0.08% 0.06% 33.68% 0.06% 0.05% 13.75%
1.03%
Iveco Bus 10 0 13 0 10 13
Total trucks 4,274 3,782 17,864 15,674 492 2,190 13.01% 13.97% 100.00% 100.00% 100.00% 100.00% Total market 99,974 110,664 537,858 567,468 (10,690) (29,610) -9.66% -5.22% Source: Vfacts *Tesla began reporting sales figures in 2022. Expected 2021 impact on market volume is an increase of approximately 1%.
Suzuki 2,536 1,875 11,246 9,284 661 1,962 35.25% 17.45% 2.65% 1.75% 51.06% 2.16% 1.68% 28.54% Tesla* 172 0 4,653 0 172 4,653 100.00% 100.00% 0.18% 0.00% 100.00% 0.89% 0.00% 100.00% Toyota 22,561 21,076 121,377 118,953 1,485 2,424 7.05% 2.00% 23.57% 19.72% 19.55% 23.34% 21.56% 8.28% Volkswagen 2,993 4,674 13,055 20,891 (1,681) (7,836) -35.96% -60.02% 3.13% 4.37% -28.48% 2.51% 3.79% -33.69% Volvo Car 1,174 1,083 5,772 5,439 91 333 8.40% 5.77% 1.23% 1.01% 21.07% 1.11% 0.99% 12.61% Total cars 95,700 106,882 519,994 551,794 (11,182) (31,800) -10.46% -5.76% 100.00% 100.00% 100.00% 100.00% Daf 61 69 268 257 (8) 11 -11.59% 4.10% 1.43% 1.82% -21.77% 1.50% 1.64% -8.50% Dennis Eagle 9 30 23 79 (21) (56) -70.00% -243.48% 0.21% 0.79% -73.45% 0.13% 0.50% -74.46% Freightliner 53 30 225 172 23 53 76.67% 23.56% 1.24% 0.79% 56.33% 1.26% 1.10% 14.78% Fuso 455 568 2,351 2,179 (113) 172 -19.89% 7.32% 10.65% 15.02% -29.12% 13.16% 13.90% -5.33% Hino 811 761 3,374 3,203 50 171 6.57% 5.07% 18.98% 20.12% -5.70% 18.89% 20.44% -7.58% Hyundai Commercial Vehicles 40 31 129 127 9 2 29.03% 1.55% 0.94% 0.82% 14.18% 0.72% 0.81% -10.88% International 0 4 2 19 (4) (17) -100.00% -850.00% 0.00% 0.11% -100.00% 0.01% 0.12% -90.76% Isuzu 1,521 1,085 6,043 4,768 436 1,275 40.18% 21.10% 35.59% 28.69% 24.05% 33.83% 30.42% 11.20% Iveco Trucks 224 237 808 835 (13) (27) -5.49% -3.34% 5.24% 6.27% -16.37% 4.52% 5.33% -15.10% Kenworth 298 325 1,421 1,203 (27) 218 -8.31% 15.34% 6.97% 8.59% -18.86% 7.95% 7.68% 3.64% Mack 75 66 384 294 9 90 13.64% 23.44% 1.75% 1.75%
Scania 128 122 483 576 6 (93) 4.92%
1.16%
30.66% Mercedes-Benz Trucks 96 154 403 629 (58) (226) -37.66%
Kia 8,480 7,890 39,419 37,894 590 1,525
Jaguar 71 249 413 703
Mazda 6,245 12,225 49,932 60,446 (5,980) (10,514) -48.92% -21.06% 6.53% 11.44% -42.95% 9.60% 10.95% -12.34%
Estate
Pitcher Partners has the resources and depth of expertise of a major firm, but with a boutique firm feel. We give our clients the highest level of personal service and attention. That’s the difference.
Accounting and business advisory services Audit, risk management and TaxInternalassuranceauditadviceand compliance Planning and growth Business consulting and commercial advice Business ValuationsTechnologyTaxSuperannuationSuccessionInvestmentInternationalCorporateCorporateBusinessimprovementperformancestructuringfinancegovernancebusinessadvisoryadvisoryservicesplanningservicesadvisoryandITconsulting Private wealth services
About Pitcher Partners
Financial essentials
Partners firm is also an independent member of Baker Tilly International, one of the world’s leading networks of independently owned and managed accountancy and business advisory firms. Our strong relationship with other Baker Tilly International member firms has allowed us to open many doors across borders for our clients.
We specialise in working with middle market businesses in Australia, including privately owned, foreign controlled, government owned and Not-for-Profits. Our clients require high technical standards, matched with a personal understanding and involvement in their Eachaffairs.Pitcher
planning Family office management Investment advisory services Philanthropy services Succession InsuranceTaxSuperannuationplanningstrategiesadviceandcompliance Industry specialisations PropertyMotorEducationNot-for-Profitand construction AgricultureservicesProfessionalsectorGovernmentManufacturingHealthHospitalityFoodTechnologyFintechandbeverageandagedcareandretailandthepublicandfinancial Our commercial services to businesses Sydney statistics 32 partners 300+ total staff National statistics 8th largest network of accounting and advisory firms nationally 130+ partners 1,300+ people 6memberindependentfirms
Pitcher Partners is an association of accounting and business advisory firms located in Adelaide, Brisbane, Melbourne, Newcastle, Perth and Sydney. We have a strong reputation for providing personal service and quality commercial advice to our clients across a broad range of industries.
10
Baker
Pitcher Partners is an independent member of Tilly International. strong relationship with other Baker Tilly International member particularly in Asia Pacific, provides clients with access to international networks, opportunities and expand globally.
Pitcher Partners’
expertise to
Global statistics 38,000+ $4.36bnprofessionalsexperiencedWorldwiderevenue2021(USD) Pitcher Partners is a member of the global network of Baker Tilly International Limited, the members of which are separate and independent legal entities. 6 Australianfirms 26 Latin firmsAmerican 6 NorthfirmsAmerican 24 Middle East and African firms 39 Europeanfirms 20 AsiafirmsPacific Key Baker PitcherTillyPartners
Experts across a wide range of industry and business sectors, each Baker Tilly International member firm combines high quality services and in-depth local Sharingknowledge.knowledge and resources, our business approach brings together the power of the global network to deliver exceptional results to clients globally.
11
Our global reach
firms,
Pitcher Partners
Baker Tilly International
Baker Tilly International is one of the world’s leading networks of independently owned and managed accountancy and business advisory firms united by a commitment to provide exceptional client service.
Every day, 38,000+ people in 148 territories share experiences and expertise to help privately held businesses and public interest entities meet challenges and proactively respond to opportunities. International capability and global consistency of service are central to the way we work.
pitcher.com.au Adelaide Brisbane Melbourne Newcastle Perth Sydney Pitcher Partners is an association of independent firms. Liability limited by a scheme approved under Professional Standards Legislation. Pitcher Partners is a member of the global network of Baker Tilly International Limited, the members of which are separate and independent legal entities. Australian Listed Dealerships Comparison 2022 Our Motor Industry Services teamJohn Gavljak Partner | Business Advisory and Assurance p. +61 2 8236 7759 e. john.gavljak@pitcher.com.au Steven Bragg Partner | Motor Industry Services p. +61 2 9228 2598 e. steven.bragg@pitcher.com.au Martin Booth Partner | Business Advisory and Tax Services p. +61 2 8236 7887 e. martin.booth@pitcher.com.au Wayne Pearson Consultant | Motor Industry Services m. +61 417 226 934 e. wayne.pearson@pitcher.com.au John Brockhouse Consultant | Motor Industry Services p. +61 2 8236 7717 e. john.brockhouse@pitcher.com.au Scott Hardie Consultant | Motor Industry Services m. +61 412 285 491 e. scott.hardie@pitcher.com.au Christopher Sonego Client Director | Motor Industry Services p. +61 2 9228 2208 e. christopher.sonego@pitcher.com.au Jennifer Lorman Manager | Motor Industry Services p. +61 2 9228 2545 e. jennifer.lorman@pitcher.com.au Jake Northcott Manager | Business Advisory and Tax Services p. +61 2 9228 2411 e. jake.northcott@pitcher.com.au Thomas Fahey Supervisor | Business Advisory and Tax Services p. +61 2 9228 2209 e. thomas.fahey@pitcher.com.au Michele Leali Graduate Accountant | Business Advisory and Assurance p. +61 2 9228 2481 e. michele.leali@pitcher.com.au Susan Aboulhosn Personal Assistant | Business Advisory and Assurance p. +61 2 9228 2446 e. susan.aboulhosn@pitcher.com.au Irwin Lee Senior Analyst | Business Advisory and Assurance p. +61 2 9228 2597 e. irwin.lee@pitcher.com.au Tom Hessel Cadet Analyst | Business Advisory and Assurance p. +61 2 9228 2599 e. tom.hessell@pitcher.com.au Aidan Cousin Senior Manager | Motor Industry Services p. +61 2 9881 3609 e. aidan.cousin@pitcher.com.au