

pitcher.com.au
and
Outlook October 2023 Current as of 1 October 2023
Economic
Market

The global economy continues to slow with meaningful dispersion across both developed and emerging markets. Growth in the US economy has moderated but remains relatively resilient compared to other developed countries, spurred on by resilient household spending and still supportive government spending. In contrast, the picture is markedly less positive elsewhere with rate hikes biting into consumer demand and growth materially slowing with the likes of the Eurozone flirting with recession China too continues to struggle to deal with its embattled property sector. Consumer spending growth has faded, and business confidence remains weak in the face of subdued demand.
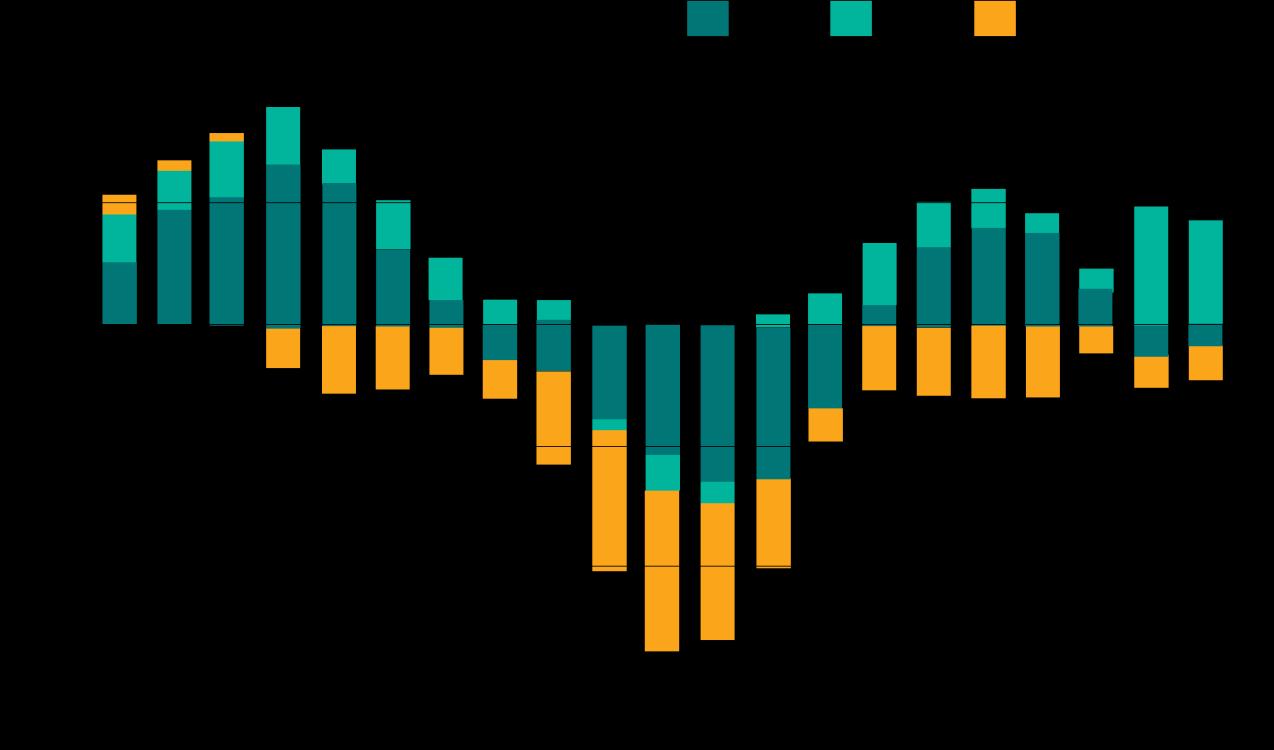
The narrative for the US economy has swung wildly over the last 18 months from a hard landing (deep recession) to soft landing (shallow recession) and more recently, no landing. Growth has surprised in its resilience led firmly by the American consumer with private consumption contributing over 1.5% to the 2.5% growth seen in the June quarter. Government spending also continues to make an impact, both direct (over 0.5% of growth for the year) and indirect
Annual change in GDP by contribution
Source: ABS
The indirect impact is coming through the spending activity that the government is increasingly enabling. A good example is the Biden Administration’s Inflation Reduction Act. This is best described as a “carrot” to entice more business investment spending supporting the energy transition (from fossil fuels to renewables) via grants and loans under favourable terms According to American Clean Power there has been over US$270 billion in investment spending announced for clean power generation and associated manufacturing projects1. This is seeing a meaningful upgrade in US renewable manufacturing capacity as illustrated below which was in a parlous state versus other countries as North America only accounted for 0.6% of global solar cell production in 2021 according to the IEA2, a space dominated by China. $270 billion in nominal spending will be a meaningful tailwind for economic growth with nominal GDP expanding
1 ‘Clean Energy Investing Report’ , American Clean Power, August 2023, https://cleanpower.org/wpcontent/uploads/2023/08/CleanEnergyInvestingReport_digital.pdf (accessed 1 October 2023).
2 ‘Solar PV Global Supply Chains’ , IEA, August 2022, https://www.iea.org/reports/solar-pv-global-supply-chains/executive-summary (accessed 1 October 2023).

Source: Clean Energy Investing Report, August 2023
These initiatives are not without cost, however, by adding pressure to the Government budget. US fiscal spending is already running at elevated levels thanks to higher social spending as inflation adjustments for higher cost-of-living increase household pensions. The chart below illustrates this with the black line reflecting US budget deficits as a percentage of GDP, which remains well above pre-pandemic levels to the tune over 3% of GDP. In addition, fiscal support is not expected to be lowered anytime soon, with the deficit forecast to stay above 5% over 2024 and into 2025.
Government deficits as percentage of GDP (Mar-08 to Mar-25)

Source: Bloomberg, actual and consensus forecasts
The backdrop for monetary policy is more nuanced. Expectations that the Federal Reserve (the Fed) is done with rate hikes appear increasingly entrenched. Inflation is helping on this front with headline CPI running at 3.7% for the year to August. This should be supported by falling rents as the cost of shelter in official terms was 7.2% but is now on a sharp downward trajectory and should converge to private sector estimates growing at only 3.2%
There are aspects of the inflation dynamic that give us pause, however. Oil prices have surged over 15% since September 2022. This will add pressure to headline CPI and given the flow-on impact with higher transport costs, it could lead to higher goods inflation as well. The labour market remains strong with vacancies still significantly above pre-pandemic levels and unemployment sitting at only 3.8%, above its recent low of 3.4% but still tight versus history which could see higher wage inflation. An uptick in headline strike action such as the United Auto Workers’ union striking across major car manufacturers3 may also keep wage costs elevated. Finally, the strength in consumer spending may continue to hold up given the scale of deficit funding currently underway, adding further pressure. This may disappoint market expectations of rate cuts.
Overall US growth has remained resilient. While there are signs of a slowdown emerging, we think the excess savings in household budgets and strong government spending support will remain powerful offsets in the near term.
The situation in the Eurozone has deteriorated in recent months. According to the HCOB Eurozone Composite PMI economic growth slowed at its fast rate since November 2020 during August4. This slowdown has been widespread with manufacturing marking 14 consecutive months of contracting activity. New orders also continue to fall across both foreign and domestic clients. Consistent with these readings, consensus forecasts for Eurozone growth continue to deteriorate with this year and next predicted to have sub-trend growth of below 1% in real terms. The probability of a recession is now moderately high, especially if any additional shocks such as an escalation in the Ukraine conflict or higher energy prices emerge.
The consumer is also challenged with retail sales dipping 0.2% in July, worse than expected, and continuing a correction in goods consumption that has been evident in recent years. Volume growth was also subdued down 2.2% for the year to July reflecting the impact of elevated inflation on underlying consumer spending.
Finally on the monetary policy front the European Central Bank (ECB) remains in a restrictive mode. It hiked rates by a further 0.25% to take the key deposit rate to 4%. This was in response to still elevated core inflation which is running at 5.3% for the year to August. Wage inflation has moderated from a recent peak of 5.9% growth in December but remains above-trend at 4.5% for the year to June5 The ECB board has indicated it expects current policy settings would see inflation return to its 2% target gradually. Growth at nearrecessionary levels would do much to accomplish this but the elevated nature of core inflation and persistence of wage inflation to date suggest increased risk further rate hikes being necessary in the near term.
In summary, the outlook for growth in Europe remains challenged by subdued demand and persistent inflation. The probability of a recession continues to increase, especially if any additional shocks such as an escalation in the Ukraine conflict or higher energy prices emerge.
The Chinese economy has continued to offer a mixed set of results in 2023 as the bounce back in activity following the lifting of coronavirus restrictions was gradually exhausted. An anaemic property market has been a major driver with new home sales by China’s largest 100 developers down 33% for the year to July6 with property prices flat (down 0.1%) for the year to August7 . This dour backdrop has fed into both retail sales and inflation results with the former growing only 2.5% for the year to July and the latter down 0.3% over the same period, the opposite problem to what we are seeing in developed economies Major developers such as Evergrande and Country Garden remain embattled however and are pursuing debt restructuring programs to remain in business with authorities reluctant to bail out the sector directly. More recently Evergrande wealth management workers were detained by police, representing the first criminal probe into the company’s failures to repay investors. This added to negative sentiment surrounding the business and may make future capital raising efforts more difficult raising the need for further government support.
3 ‘UAW strike’ , CNN, 18 September 2023, https://edition.cnn.com/business/live-news/ford-uaw-strike-stellantis-09-18-23/index.html (accessed 1 October 2023).
4 ‘HCOB Eurozone Composite PMI’ , S&P Global and HCOB, August 2023, https://www.pmi.spglobal.com/Public/Home/PressRelease/382c7872528a4f48bf03911ae648e7f1 (accessed 1 October 2023).
5 ‘Labour cost index – recent trends’ , Eurostat, 15 September 2023, https://ec.europa.eu/eurostat/statisticsexplained/index.php?title=Labour_cost_index_-_recent_trends#Overview (accessed 1 October 2023).
6 ‘Why China’s property market is in freefall’ , Australian Financial Review, 25 August 2023, https://www.afr.com/world/asia/why-china-sproperty-market-is-in-freefall-20221004p5bn4q#:~:text=China's%20property%20sales%20fell%2026.8,48%20per%20cent%20of%20GDP (accessed 1 October 2023).
7 ‘China Newly Built Housing Prices YoY change’ , Trading Economics, 15 September 2023, https://tradingeconomics.com/china/housingindex (accessed 1 October 2023).
Policy makers have responded but in a more muted fashion. The People’s Bank of China (China’s central bank) has reduced interest rates slightly and local governments have accelerated debt issuance to fund regional government projects including infrastructure
Arguably some of these initiatives bore early fruit in August. We saw both retail sales and industrial production accelerate, up 4.5% and 4.6% for the year to August8 and inflation rising to 0.1% over the same period. The question of whether this is sustained remains open, however. Authorities have not leveraged fiscal stimulus to anywhere near the same extent as in the West and given the experience for the year-to-date appear unlikely to do so. This outlook has seen many economists downgrade their growth expectations for China below the government’s 5% target for the year. Underlying measures of economic activity are also mixed. If we look at electricity production and rail freight both measures are only up 1% for the year to August implying a relatively muted reaction to policy initiatives so far.
Underlying measures of Chinese economy (Mar-06 to Aug-23)
Source: Bloomberg
The overall China picture remains one of fragility. While the surprise uptick in August is welcome it remains to be seen whether this is part of a sustained trend as retail sales were boosted by seasonal upticks in travel spending. The weaker backdrop for the property sector (20-30% of GDP according to some estimates9) will remain a near term headwind unless we see a meaningful uptick in government support from current levels.
Conclusion
Our outlook for global growth suggests weaker activity going forward. Offsets such as a resilient consumer and government fiscal support will eventually be dashed by restrictive monetary policy and still-elevated levels of inflation. Calls of “mission accomplished” on the inflation front may be premature amidst a resurgence in energy prices and persistence in wage growth amongst developed economies. This, at a minimum, is likely to keep rates higher for longer and could even foreshadow further rate hikes to curb inflation. Concerns over elevated debt levels are likely to see China stick to its current course of muddling through a weaker property market and we are less likely to see the material surge in infrastructure and investment spending that helped arrest past slowdowns. We see material downside risks for global growth persisting and while inflation has moderated, there remains real risk of it being sufficiently elevated to delay meaningful easing in interest rates for the near term.
8 ‘China’s piecemeal stimulus paying off slowly, but property still bleak and private sector ‘lacks that animal spirit’, SCMP, 15 September 2023, https://www.scmp.com/economy/china-economy/article/3234611/chinas-august-retail-sales-outpace-expectations-while-industrialproduction-accelerates (accessed 1 October 2023).
9 ‘China’s Overextended Real Estate Sector is a Systemic Problem’, Michael Pettis, 22 August 2022, https://carnegieendowment.org/chinafinancialmarkets/87751 (accessed 1 October 2023).
In recent months, the impacts of the 400-basis point interest rate hikes since May 2022 have been plain to see. Higher interest rates have reduced disposable incomes of mortgage holders. This cohort has begun to cut back on discretionary spending as evidenced by several recent earnings downgrades from prominent retailers including Harvey Norman, Adairs, Best & Less & Super Retail Group Supermarkets too have been reporting a rotation to cheaper home brand items as consumers tighten their belts10. It is perhaps no surprise then that the National accounts for the year ending 30 June (released in September) showed that the economy is in a per capita recession, as defined by two consecutive quarters of negative growth (-0.3%,0.3%)11 per capita.
Yet despite a decline in average household demand, the economy still grew over the year by 2.1%12 overall. This outcome was driven by a very strong increase in immigration. Although the average person is spending less, the total aggregate spend is still higher due to a 2.2% increase in the population, including an extra 454,400 migrants According to the latest GDP figures this impact was even higher for the June quarter with overall population growth at near 50-year highs of 2.4% as shown below with the contribution from migration in teal
It is interesting that the RBA is trying to slow the economy on the one hand by raising rates to quell demand. On the other, the government is working against the RBA by encouraging record new arrivals, which only serves to stimulates the economy (more people add to total spending)
Another example of an unintended consequence is evident in Australia’s housing crisis. Millions of Australians have been impacted by surging rents as demand for housing exceeds supply. In recognition that the rental crisis will only be solved by increasing supply, the Albanese government has announced a range of measures over the last 12 months including a $10 billion Housing Australia Future Fund13 and a national target to build
10 ‘Home brand boom: Why consumers are turning to supermarket-owned labels’ , Sydney Morning Herald, 14 may 2023, https://www.smh.com.au/business/companies/home-brand-boom-why-consumers-are-turning-to-supermarket-owned-labels-20230503p5d57e.html (accessed 1 October 2023).
11 ‘Australian National Accounts: National Income, Expenditure and Product: June 2023’ , Australian Bureau of Statistics (ABS), 6 September 2023: https://www.abs.gov.au/statistics/economy/national-accounts/australian-national-accounts-national-incomeexpenditure-and-product/jun-2023 (accessed 1 October 2023).
12 As above
13 ‘Delivering on the $10 billion Housing Australia Future Fund’ , The Hon Julie Collins MP, Minister for Housing, 11 September 2023: https://ministers.treasury.gov.au/ministers/julie-collins-2022/media-releases/delivering-10-billion-housing-australia-future-fund (accessed 1 October 2023).
1.2 million homes over 5 years from 1 July 202414. While all laudable initiatives, the increase in immigration will only make efforts to solve the housing problem even more challenging.
The immigration story is a legacy of the pandemic. In the early stages, many international students, and foreign workers on working visas went back to their homelands. The subsequent shortage of workers when Covid ended, and pent-up demand boomed, is well known. In response, the government ramped up its intake of new arrivals. Now that we have seen workers re-enter the country in droves, you would expect the labour shortage to have normalised. Indeed, in the face of weakening demand, you would expect to have seen unemployment drift materially higher.
Yet this has not been the case. Although immigration itself creates demand and jobs, it would seem the main reason why the labour market has remained tight, based on labour force data, is because of the NDIS (along with mining and professional services15). The NDIS only became fully implemented across all states just before the pandemic in 2020. There are now reportedly some 500,00016 people obtaining NDIS support, which has created a huge boom in new jobs in recent years in all the industries setup to provide support services. So, while the economy is slowing, unemployment queues have not yet materially lengthened.
Conclusion
In our view there is little doubt that the economy will continue to slow over the next six months. Household spending is likely to fade as more fixed rate mortgages roll-off onto materially higher rates, eroding savings buffers. Businesses face higher refinancing costs as debts mature, and new export orders will ease as growth in China, and the rest of the world, remains anaemic. The issue that is less clear is whether the net outcome results in an economic soft (mild increase in unemployment) or hard landing (recession that creates a sharp increase in unemployment). This remains very much contingent on the RBA and its response to inflation.
Household savings ratio (Jun-03 to Jun-23)
Source: ABS 17
14 ‘Meeting of National Cabinet – Working Together to Deliver Better Housing Outcomes’ , Prime Minister of Australia, 16 August 2023, https://www.pm.gov.au/media/meeting-national-cabinet-working-together-deliver-better-housing-outcomes (accessed 1 October 2023).
15 ‘Labour Force, Australia, Detailed: August 2023’ , ABS, 21 September 2023, https://www.abs.gov.au/statistics/labour/employment-andunemployment/labour-force-australia-detailed/latest-release (accessed 1 October 2023).
16 ‘History of the NDIS’ , National Disability Insurance Scheme (NDIS), 12 July 2023, https://www.ndis.gov.au/about-us/history-ndis (accessed 1 October 2023).
17 ‘Australian National Accounts: National Income, Expenditure and Product: June 2023’ , Australian Bureau of Statistics (ABS), 6 September 2023, https://www.abs.gov.au/statistics/economy/national-accounts/australian-national-accounts-national-incomeexpenditure-and-product/jun-2023 (accessed 1 October 2023).
On the one hand, the RBA should now be acutely aware that its policy decisions have already done enough to slow the economy. This supports the case for an interest rate cut within the next six months. On the other hand, the RBA will also be aware that a cash rate of 4.10% is only marginally above their most recent estimate of a neutral rate of 3.80%. The ‘neutral rate’ is a theoretical cash rate which is supposed to be neither restrictive nor stimulative to the economy. As the US Federal Reserve have set more restrictive rates, the consequential interest rate differential has lowered the AUD relative to the USD (and other currencies) and increased the cost of imported products, including key inputs such as oil. Further, services inflation, including rent, electricity, and insurances, remains stubbornly high.
Based on these circumstances, it would not be surprising if the RBA does not reduce rates until more evidence emerges of a softening in services inflation. As the adjustment in the price of services is typically much slower than goods, this may well delay any interest rate cut for much longer, which could increase the duration of the downturn.
The S&P/ASX 200 Total Return Index returned -0.8% over the three months and 13.5% over the year to 30 September 2023
S&P/ASX 200 Accumulation Index cumulative return (Sep-22 to Sep-23)
Recommendation: Maintain underweight
Source: S&P Global, Bloomberg
The Australian economy is showing signs of materially slowing. Higher interest rates are reducing disposable incomes and weighing on household finances as evidenced by mortgage arrears which have climbed materially above the post-GFC average. In turn, discretionary household spending has been contracting, reducing demand for labour in these sectors. Businesses too are facing escalating refinancing costs as well as grappling with higher wage and energy costs. In aggregate we would expect the domestic economy to continue to soften over the next six months. Although some of this weakness is priced into share markets, risks remain skewed to the downside with banking, retail and resources sectors all expected to underperform in the near term. The mining sector is a more nuanced story. The sector has priced in the expectation of some level of stimulus to help revive China’s ailing economy. If that does not eventuate further falls in mining stocks are inevitable given the otherwise sluggish global outlook. Given the very subdued outlook, we maintain our underweight positioning.
Our outlook for some of the major sectors of the S&P/ASX 200 is as follows:
Banks
Recommendation: Maintain underweight
The outlook for the major banks remains unchanged. On the positive front, property values have continued to bounce from their February lows, now only 4.6% off their April 2022 peak according to CoreLogic18. This is a net positive for the banks as even if unemployment conditions worsen the higher value of collateral backing their loans will help reduce losses if forced to foreclose on borrowers.
Arrears have risen however and for securitised mortgages sit at levels last seen during the pandemic, or, prior to then, the aftermath of the global financial crisis
18 ‘The value of Australia’s housing market just hit $10 trillion again. How is this possible?’, CoreLogic, 7 September 2023, https://www.corelogic.com.au/news-research/news/2023/the-value-of-australias-housing-market-just-hit-$10-trillion-again.-how-is-thispossible (accessed 1 October 2023).
Source: S&P Global
Rising mortgage repayments are guaranteed in aggregate as more households roll off cheap fixed rates to materially higher variable rates This should pressure households’ ability to meet repayments and lead to higher mortgage arrears, pressuring earnings. Consistent with our economic outlook we also anticipate a weaker labour market as the economy slows. Higher job losses will decrease household incomes and impair their ability to maintain mortgage repayments.
Bank balance sheets remain healthy with capital buffers substantially above regulated minimums, so it is unlikely that loan defaults and losses will be of the magnitude required to threaten the stability of the major banks. The outlook for earnings growth remains muted however, as illustrated in the table below.
Source: Bloomberg as at 30 September Bank valuations remain attractive with both ANZ and Westpac today below historical averages at sub 11x earnings. In contrast CBA continues to trade at a substantial premium of 18x forward earnings which remains difficult to justify.
In summary, while valuation and housing market strength are lending support to the major banks the headwinds posed by a slowing economy and more expensive funding costs lead us to maintain our underweight position.
Resources
Recommendation: Maintain underweight
The outlook for major miners remains challenged. If we look at recent comments by Rio Tinto CEO Jakob Stausholm their expectation19 is for Chinese iron ore demand to hold steady at 2023 levels into next year Stimulus announcements to date by Chinese authorities have been relatively limited with respect to infrastructure and property construction, two key sources of demand for iron ore. Another leading indicator for iron ore demand is the creation of new credit as it foreshadows new construction activity that requires natural resources to build. On this front we have not seen a material uptick in China’s credit impulse which would suggest base metal prices should rise in the near term
Iron ore prices have remained surprisingly resilient during 2023. A large part of this can be attributed to Chinese steel mills producing at above-average levels despite weakness in the construction industry.
19 ‘Rebound in steel prices key to iron ore’s rally’, AFR, 20 September 2023, https://www.afr.com/markets/commodities/rebound-in-steelprices-key-to-iron-ore-rally-20230920-p5e62k (accessed 1 October 2023).
However, the country has in recent years enforced production caps to limit carbon emissions from one of its highest polluting industries20 Given above-average production in 2023 to date there is a material risk of below average production for the rest of the year to comply with these quotas21. This forms another potential headwind for iron ore prices in the near term.
Finally, the latest S&P Global Sector PMI22 survey from August highlighted further weakness in new orders from customers as well as lower output readings, portending a further contraction in activity. Software and services were the notable exception as illustrated below.
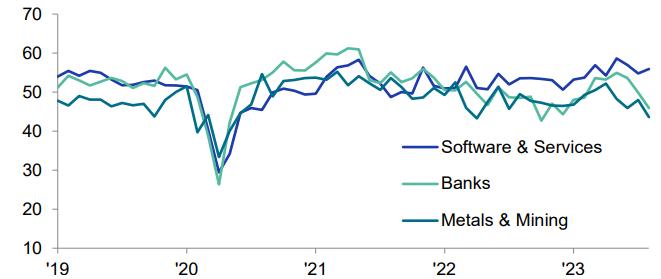
Global Sector PMI Business Activity Index
sa, >50 = growth since previous month
Source: S&P Global PMI.
Taken together a weaker outlook for the Chinese property sector coupled with potential for production caps imposed by authorities and a weaker global economic environment are all potent headwinds that should weigh on commodity prices and producer earnings, leading us to maintain our underweight view.
The retail sector surprised for the August reporting period with several stocks showing strong resilience. In one case, luxury furniture provider Nick Scali, even the CEO was taken aback describing surprise strength to end the financial year was “just not explainable”23 given the discretionary nature of their products. The overall trend for the sector remains more challenging. Per capita GDP and retail volume growth have been negative for two consecutive quarters as of June highlighting the difficulties facing the average household to maintain spending in the face of elevated inflation.
One remaining bright spot is the level of excess savings on household balance sheets as illustrated in the chart below. It does suggest a level of support for spending not present in past cycles but should be interpreted with a level of caution as the bulk of these deposits are held by wealthier Australians. In addition, population growth at 2.4% per annum, its highest level since the early 1970s will also support nominal spending levels
20 ‘China to cap 2023 steel output’, says Reuters, Steel Times International, 26 July 2023, https://www.steeltimesint.com/news/china-tocap-2023-steel-output-says-reuters#:~:text=A%20report%20from%20Dominique%20Patton,the%20world's%20top%20steel%20market'.
21 ‘Chinese steel production – defying gravity and logic? Rennie, Robert’, 25 August 2023, https://www.linkedin.com/pulse/chinese-steelproduction-defying-gravity-logic-robert-rennie (accessed 1 October 2023).
22 ‘S&P Global Sector PMI’ , S&P Global, 7 September 2023: https://www.pmi.spglobal.com/Public/Home/PressRelease/f9d79467239e45f6948da9f6c2b6e905 (accessed 1 October 2023).
23 ‘Nick Scali FY23 Earnings Call’, 11 August 2023 sourced from Bloomberg.
Australian household bank deposits versus long-term trend growth (Mar-19 to Jul-23)
Source: APRA, ABS
Finally household confidence remains at depressed levels suggesting limited “animal spirits” to spur spending aside from one-off events e.g. “Barbenheimer” (the Barbie and Oppenheimer cinematic hits) or the Women’s Football World Cup24. This suggests retailers, in aggregate, will struggle to meaningfully grow volumes without sacrificing margin by lowering prices
Household spending vs Westpac-MI Consumer Sentiment Index (Sep-93 to Sep-23)
Source: Bloomberg, ABS
This view is supported by the latest CommBank HSI release which showed anaemic or even outright negative growth for most discretionary categories for the year to August25
24 ‘Commbank Household Spending Insights: August 2023’ , Commonwealth Bank of Australia. 13 September 2023, https://www.commbank.com.au/business/latest/spending-intentions.html (accessed 1 October 2023).
Overall, while there are meaningful positives in terms of the household balance sheet and population growth, we believe these remain outweighed by the headwinds of a softening labour market, subdued household confidence and weaker real incomes with the sector likely to struggle in the year ahead.
Recommendation: Upgrade to neutral
Reporting season was a mixed bag for the AREIT sector with many challenged by a mix of higher financing costs reducing profitability and lower property valuations dragging on underlying asset values. This combination saw the majority of REITs experience share price declines.
Capitalisation rates (property net income divided by market value) have begun moving materially but remain tight versus history in some sectors, most notably industrials. Given where longer-term interest rates are currently sitting with the 10-year yield at ~4.2% we would expect further pressure on the sector’s valuations in the near term as other investment options including cash present meaningful alternatives to generating yield
The higher rate environment is also meaningfully impairing profitability. We saw this in FY24 guidance where several REITs forecast declining funds from operation (FFO, a profitability measure) due primarily to higher financing costs where leases were not indexed to inflation
Commercial real estate cap rates (Feb-10 to Jul-23)
Source: Bloomberg
In the industrial space a situation of limited new supply and still resilient demand has enabled landlords to pass through meaningful rent increases which has helped offset the harsher interest rate environment and support valuations We saw this recently with the Centuria Industrial REIT (CIP) that sold two assets for a combined $70m in September, a price in line with its 30 June valuation. This would suggest that the 22% discount that the stock is trading to its net tangible assets is perhaps unwarranted.
The picture in the office space is decidedly less positive with vacancy rates remaining elevated and sector heavyweight Dexus highlighting flight to higher-quality assets in its Annual results. This is shown in the below chart with Secondary (lower quality) buildings seeing negative net absorption (i.e. continued vacancy increases) persisting versus elevated take up of Premium sites by tenants
Net absorption by grade (4 CBDs) ‘000 square metres (rolling annual)
Source: JLL Research, 4. CBD’s includes Sydney, Melbourne, Brisbane and Perth. Interestingly the business reported that its office portfolio on a like-for-like basis grew rental income by 5.6% in FY23 pointing to a level of resilience that sentiment is currently discounting. In addition, while there is a dispersion in quality between different office REITs, the indiscriminate discounts this subsector is trading at do not appear to be matching reality. As an example, Dexus recently divested the majority of its holding in 1 Margaret St, Sydney for $293m26, in line with its latest valuation. Despite this transaction the stock still trades at a discount of over 30% to net tangible assets.
It is likely we will need to see a gradual rebalancing of the sector with tighter supply conditions until vacancies normalise. This would do much to combat the “end of the office” narrative that has been in the market since work-for-home practices were normalised during the pandemic. The reality is more nuanced with prime landlords such as Dexus still seeing meaningful retention amongst tenants. REIT management could also be doing more in the form of buybacks and other initiatives to reduce the current discounts, but this also needs to be balanced against a more costly financing regime with investors unlikely to receive higher gearing positively. In summary it appears to be a dynamic that will take time to gradually improve with limited nearterm catalysts on the horizon.
Finally in the retail sector we saw a series of mixed results. Lease renegotiations during the pandemic to take a percentage of retailer turnover bore fruit for some flagship landlords such as Scentre Group (the owner of Westfield shopping centres) which benefitted from increased foot traffic and its efforts to make centres a broader experience for consumers including eating out, one of the more resilient retail categories in the past year even amidst higher interest rates as households have increasingly preferred experiences and services consumption over goods following the lifting of lockdown restrictions. The headwind of higher financing costs and a slowing economy is expected to weigh on the sector going forward. Some segments targeting essential spending (e.g. food and other staples) are expected to remain resilient whereas more discretionary categories should struggle in line with the slowdown in broader household spending that we are seeing.
In summary, the AREIT sector is seeing sizeable dispersion with industrial still a clear leader followed by retail and the office space both in current performance and the near-term outlook. As many AREITs are trading at significant discounts to their NTA the sector appears attractive on valuation grounds. The lack of immediate catalysts gives us pause however with management reluctant to engage in material divestments and buybacks as a way of rectifying this situation. The near-term macroeconomic headwinds are something we cannot ignore, and we would expect these to weigh on investor sentiment until the economic outlook is more positive or interest rate cuts occur. Nevertheless, there is an argument that markets have already priced in much of the negativity which provides an opportunity for long term investors to buy into beaten down AREITs, at attractive prices (while sentiment remains weak). For this reason, we upgrade our positioning to neutral.
By Cameron Curko, Head of Macroeconomics & Strategy | Pitcher Partners Sydney Wealth Management +61 2 9228 2415 cameron.curko@pitcher.com.auThe MSCI World (excluding Australia) Net Total Return Index (AUD) returned -0.4% over the past three months and 21.6% over the year to 30 September 2023. Much of this return was driven by the decline in the Australian dollar with the MSCI World (excluding Australia) Net Total Return Index (hedged to AUD) returning 19.4% for the year to September, a differential of 2.2%.
MSCI World excluding Australia Net Total Return Index (Sep-22 to Sep-23)
Source: MSCI, Bloomberg Outlook
Global equities have had a resounding year led by technology names most notably those benefitting from increased interest in artificial intelligence (AI) such as Nvidia and, ChatGPT’s backer and part-owner, Microsoft. The surge of interest in AI solutions has seen earnings expectations shift materially higher for these tech names so much so that the US market is expected to see double-digit earnings growth in both 2024 and 2025.
This exuberance has been matched by a more than equal price reaction with the S&P 500 rerating from a forward multiple of 15x earnings to 18x in Sep-23, a 20% return in this case solely from investors’ willingness to pay higher earnings multiple for US stocks in aggregate.
The US market is also benefitting from the legacy of pandemic stimulus programs with household balance sheets remaining healthy and still holding meaningful excess savings even for the relatively poorer segments of society. In addition, the US economy is still being meaningfully supported by government spending which jumped 10% between October 2022 and June 2023 driven by rising social and healthcare spending that lent further support to households even as the Federal Reserve has aggressively hiked interest rates. Stronger fiscal support for households underpins demand for both goods and services supporting growth in the US market.
Elsewhere the backdrop for global equities remains more constrained with the likes of the Eurozone and China seeing weaker growth and a corresponding derating in their respective markets.
Monetary policy remains an unfavourable headwind with inflation persistence a key risk in keeping rates “higher for longer”. There is a meaningful risk that current forecasts for rate cuts in 2024 (over 1.2% estimated for the US alone) may not eventuate if inflation remains elevated. Under these circumstances, earnings are likely to be revised lower in coming quarters.
In summary, the valuation backdrop continues to see material divergence in pricing between US equities and stocks outside the US. US equities are pricing in a period of above-average earnings growth led by AI names. There are material risks in the form of tighter monetary policy, a weakening global economy with valuations offering limited margins of safety for taking on equity risk. Until these imbalances begin to normalise the prudent course of action is to remain underweight equities exposure and take advantage of more attractive returns in other asset classes such as cash, fixed income, and defensive alternatives.
In the United States, operating earnings for S&P 500 companies are currently expected to now rise by 1.5% in 2023 (compared to a 1.2% decline last quarter), and then increase by 10.2% and 9.9% in 2024 and 2025, respectively (up from 9.5% growth expectations last quarter)
Assuming conventional long-term multiples, we estimate that the United States sharemarket (as measured by the S&P 500 Index) is overvalued by almost 17% in the near-term and slightly undervalued by 0.9% in the medium-term.
Source: Bloomberg consensus estimates for 2023, 2024 and 2025 as of 30 September 2023
Source: Bloomberg. Data as at 30 September 2023.
We see material headwinds facing global equities over the near term including tighter monetary policy and a slower global economy. Valuations for the US offer an insufficient margin of safety due to this outlook and the discounts to long-term averages elsewhere are insufficient given their much smaller weighting in global markets. Accordingly, we maintain our underweight positioning.
By Cameron Curko, Head of Macroeconomics & Strategy | Pitcher Partners Sydney Wealth Management +612 9228 2415
cameron.curko@pitcher.com.au