


The Australian economy continues to slow as households, grapple with rising cost of living pressures and high interest rates. The extraordinary stimulus provided during Covid that has buffered households for so long has essentially eroded. After peaking at 24%1 following Covid relief payments in 2020, the household savings ratio has fallen sharply to just under 1%.
The early warning signs of a looming recession are now plain to see. A small, but increasing, proportion of borrowers are falling behind in their repayments. Discretionary spending has flatlined. Companies that had managed to stay afloat during the prolonged period of low interest rates and abundant stimulus are collapsing in their droves. This is no more evident than in the number of corporate insolvencies over the last 12 months which have skyrocketed. The latest ASIC figures show there were 1245 insolvency appointments in the month of May 2024 alone, a 44% increase on the previous year, and 122% more than 2022 2
Australian firms entering insolvency (rolling annual basis, Dec-99 to May-24)
Source: ASIC, PPWM calculations
It is true, that our terms of trade have held up better than we anticipated. Amid the collapse of China's real estate sector, we would have anticipated a sharp fall in demand for iron ore. However, the price movements to date have been modest. This remains unusual given the historical correlation. In our view, further downside in the iron ore price remains inevitable absent any further stimulus.
1 ‘Australian National Accounts: National Income, Expenditure and Product March 2024’ , Australia Bureau of Statistics (5 June 2024), https://www.abs.gov.au/statistics/economy/national-accounts/australian-national-accounts-national-income-expenditure-andproduct/latest-release#key-statistics, (accessed 10 June 2024).
2 ‘Insolvency statistics (current)’ , ASIC (1 July 2024), https://asic.gov.au/regulatory-resources/find-a-document/statistics/insolvencystatistics/insolvency-statistics-current/, (accessed 20 June 2024). 0 2,000 4,000 6,000 8,000 10,000 12,000
2008 2009 2010 2011 2012 2013 2014 2015 2016 2017 2018 2019 2020 2021 2022 2023
Crude steel production China residential floor space - new builds
Source: Bloomberg, PPWM calculations; NB: 12-month moving average used to smooth series
Despite these headwinds, strength in non-residential construction (road & rail projects, green infrastructure as well as a backlog of office and industrial property developments approved during Covid), elevated public spending, and cashed up self-funded retirees who have benefitted from the higher interest rate environment, have ensured that growth has not yet contracted.
Public Sector Construction Pipeline
Source: Budget paper No13, ABS Building Activity
Notwithstanding, the current drivers of growth are arguably unsustainable. Businesses will be reluctant to invest unless the consumer starts to spend again and with the unlikelihood of expansion of government initiatives given inflation concerns, the risk of a further slowdown remains high.
Despite the obvious looming headwinds, the Reserve Bank Board remains hellbent on reducing inflation at any cost. Inflation has already moderated significantly. While it is true that services inflation has remained more stubborn, the continued ability for landlords to pass through higher rents and insurers to pass through higher premiums, representing the bulk of this problem, remains limited. With this in mind, the only real concern the RBA should have is the risk of a reignition in inflation caused by a wage price spiral. This risk in our view remains remote because leading employment indicators such as job ads, and hours worked have begun to soften.
3 ‘Budget Strategy and Outlook, Budget Paper No. 1’ , p 59, Treasury (14 May 2024), https://budget.gov.au/content/bp1/download/bp1_2024-25.pdf, (accessed 10 June 2024).
Source: Seek4 Employment Report May 2024
While it is true, that the unemployment rate has yet to rise materially, unemployment is a lagging indicator. Given the slowdown at hand, it appears highly unlikely that employees will hold the upper hand in any negotiations when, in the short-term, further job losses appear inevitable.
In this context, we believe the RBA will eventually come to the realisation that inflation is no longer the number one enemy, but rather the increasing probability of an entirely avoidable recession. Fortunately, some relief is now at hand. The stage 3 tax cuts that started on 1 July have been estimated to be equivalent to 1 to 2 interest rate cuts, which should provide some support to struggling households in the short run and lessen the need to cut rates until the end of this calendar year.
For the sake of completeness, the latest RBA5 forecast suggests that the economy will grow by 2% percent in 2024-25 and 2.25% 2025-26. Given the elevated geopolitical risks and uncertainties at play, risks to these forecasts should be considered moderately high.
Source: Bloomberg
By Martin Fowler Partner, Pitcher Partners Sydney Wealth Management
p +61 2 8236 7776
e martin.fowler@pitcher.com.au
4 ‘Seek Employment Report – April 2024’ , Seek (20 May 2024), https://www.seek.com.au/about/news/employment-report-april24, (accessed 10 June 2024).
5 ‘Budget Strategy and Outlook, Budget Paper No. 1’ , p 53, Treasury (14 May 2024), https://budget.gov.au/content/bp1/download/bp1_bs-2.pdf, (accessed 10 June 2024).
Price pressures in the US continue to be a domineering concern for policymakers, both in the Federal Reserve (the Fed) and in the White House. For the latter, inflation is a key election issue in the November Presidential and Congress elections. For the former, the concern remains over when the Fed will have sufficient comfort to cut interest rates.
On this front we are seeing core inflation resuming its downward trend, albeit still elevated versus the prepandemic setting. Global supply chains have loosened following a period of disruption due to attacks hitting shipping through the Suez Canal. This should keep downward pressure on goods pricing.
US inflation leading indicators (Sep-97 to May-24)
Source: Bloomberg
Services inflation is the persistent concern for the Fed. This, unlike goods price inflation, is closely tied to labour market conditions. Wage growth is still elevated against history sitting at 4.7% for the year to March. This, however, is well down from the peak of 6.2% encountered in August 2022. We see scope for this trajectory to persist with the labour market continuing to normalise meaningfully. Labour slack is now at levels last seen prior to the pandemic with a one-for-one relationship between available jobs and unemployed persons. This dynamic should add downward pressure to wage growth and overall inflation as worker bargaining power has declined.
per unemployed person
Source: Bloomberg, PPWM calculations.
This backdrop should eventually see the Fed cut interest rates to support the broader economy. Lower rates would improve borrowing power and act as a meaningful tailwind for rate-sensitive sectors such as housing. The Fed’s articulation of being “data dependent” should translate into a willingness to act on signs of sufficient labour market weakness coupled with a firm deceleration in inflation. We believe those preconditions are emerging. The latest update by the Fed itself adds credence to this view. The May projections by the Fed Board sees at least one rate cut for this year and a further 1%-worth in 2025
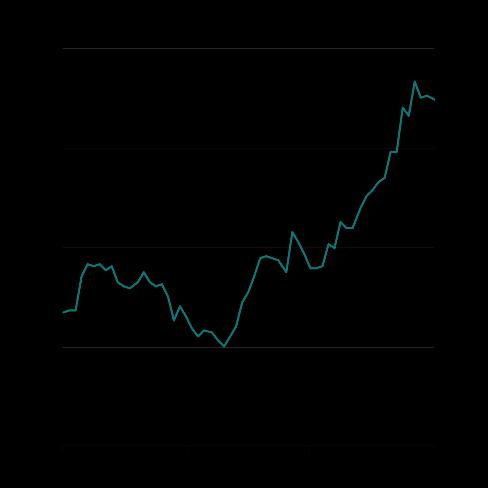
Turning to the growth backdrop we have seen the lagged impact of Fed rate hikes finally take effect on the US economy. Growth has eased in recent quarters driven by a slowdown in consumer spending which rose 2% for the year to March, a substantial deceleration from the 3.3% growth recorded for the year to December. The business sector has stepped up in recent quarters however, driven by the Inflation Reduction Act with its assortment of grants, tax incentives and other measures, driving an acceleration in investment spending by the private sector which rose 3.2% for the year to March. According to the US Treasury, factory building for the manufacturing sector alone has accounted for almost a third of investment growth since the pandemic began6. This trend is one they expect to persist with the current recovery notably above what we have seen in the average recession as depicted below.
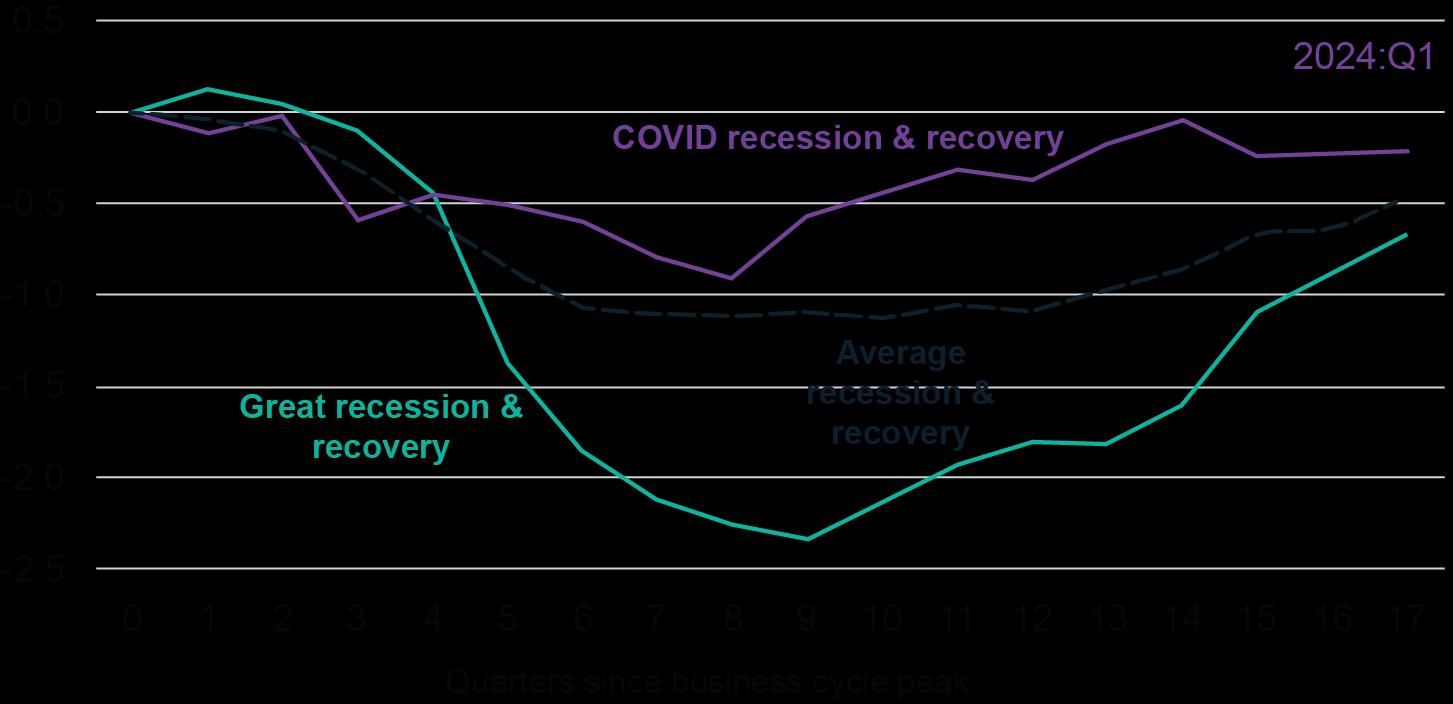
Source: US Treasury7
6 E. Von Nostrand, ‘US Business Investment in the Post-COVID Expansion’ , US Department of the Treasury (12 June 2024), https://home.treasury.gov/news/featured-stories/us-business-investment-in-the-post-covid-expansion, (accessed 13 June 2024).
7 As above
Overall, we expect the strength in private sector investment spending, together with a still stimulative fiscal policy approach, to remain supportive of growth despite the slowdown in consumer spending driven by higher interest rates
The last major consideration for the US is the prospect of Presidential and Congressional elections in November. These could reshape the policy and legislative agenda of the US government depending on the outcome. Former President Trump for example, has campaigned on a platform of reduced government spending as well as higher tariffs on imported goods. This could derail the current growth path of the economy or slow private sector spending by creating uncertainty.
In summary, the US economy is showing signs of slowing. The labour market has begun to normalise and price pressures are dissipating. This should set the stage for easing by the Federal Reserve that should help the economy avoid a recession. The looming Presidential election in November could add to policy uncertainty, particularly if we see a change from the current Biden Administration. We continue to monitor these prospects closely for their potential to impact our outlook.
The Eurozone appears to have come through the worst of its energy crisis prompted by the cessation of cheap Russian gas imports in 2022 after the latter’s invasion of Ukraine. Economic growth is expected to accelerate from current near-recessionary levels driven by a gradual recovery in consumer spending.
Key to that assessment is the European Central Bank (ECB) beginning to ease policy with its first rate cut in June taking its key deposit rate to 4.25%, down from 4.5%. Inflation in the Eurozone appears to be largely contained. This should support further rate cuts by the ECB to encourage stronger economic growth. It is important to note, also, that unlike the US, unemployment sits at almost 7% (vs 4% in the American context) This abundance of labour should limit wage growth and cap overall inflation.
Other sources of inflation remain a live concern however. A notable one is the European retaliation to Chinese “dumping” in their market. Electric vehicles are seen as an important part of the energy transition. Chinese authorities have helped created the world’s largest producers through a mix of grants and subsidies. This has led to a situation of substantial, low-cost surplus production that countries with their own auto producers are now struggling with. The European Commission has now announced tariff hikes that could lead to a retaliation cycle with China. This is a concerning situation as the EU needs China as an export market to support economic growth. An escalation here could imperil that prospect and remains an area we are monitoring closely.
Electoral uncertainty has become a factor for the region. In France, a surge in support for the far-Right opposition led by Marine Le Pen has prompted President Macron to call early Presidential and legislative elections This gambit, should it fail, could see a meaningful shift in power for the Eurozone with candidate Le Pen endorsing radical policy changes including nationalisation of key assets such as toll roads as part of a populist political agenda. France is a key member of the Eurozone and a meaningful policy shift there could destabilise household and business confidence, thwarting the economic recovery.
Finally, fiscal policy has reemerged as a sore point for the European Commission. Policymakers are looking to correct a period of supportive fiscal policy during the pandemic. Their concern is that rising debt levels could trigger a fresh sovereign debt crisis in some member states. Corrective measures here could entail meaningful cutbacks in government spending for major countries such as Italy and France. This would inevitably slow the regional recovery
On balance we are still seeing a gradual recovery emerge in Europe with decelerating inflation supporting an easing cycle by the ECB. Political and policy risks could jeopardise the recovery.
Chinese authorities continue to endorse an export-led growth model in response to weak domestic conditions even at the cost of potentially alienating trading partners. Both the US and EU have employed sanctions against Chinese electric vehicle exports and given its focus on other critical sectors such as semiconductors, this situation is likely to persist. However, there appears to be a limit on how far this growth model can be pushed, with trade barriers on the rise.
Turning to the domestic economy we see limited signs of improvement. Consumer retail sales surprised slightly, up 3.7% for the year to May. Consumer inflation remains a concern however, rising only 0.3% for the year to May. This, coupled with negative producer price inflation (declining 1.4% over the same period) suggests a continuation of weak underlying demand albeit improving marginally since the beginning of the year when we were seeing outright deflationary conditions.
A chief concern domestically remains the poor state of the property sector and the implications this has for households. Price growth remains firmly negative for the year to May and similarly, investment spending in the sector has continued to contract. Given the outsized impact of property on Chinese growth at 20% of GDP8 , it suggests a challenging backdrop remains firmly in place
China Property Sales and Investment growth (May-14 to May-24)
Source: Bloomberg
Authorities have offered limited stimulus in response. For example, the People’s Bank of China is expected to provide ~US$41b in cheap financing to local governments to buy excess housing stock in a bid to support prices. This is likely to be inadequate in our view given estimates of excess housing stock of over 20 times this magnitude9 On the policy front there remains a marked reluctance to do more to support household spending with initiatives more geared towards supporting the supply-side of the economy. This will continue to exacerbate tensions with trading partners as excess production will likely be exported and dumped on global markets given the inability of Chinese consumers to absorb these goods and services.
In summary, growth is likely to remain positive but continue to decelerate. Inflation should remain subdued thanks to the excess productive capacity of the country.
The backdrop for the global economy has largely held intact this quarter Fears of a renewed acceleration in US inflation have dissipated following recent data releases Europe and China both showcase weaker growth in their underlying economies but with some scope for optimism in the former case. In China, authorities appear content to largely abstain from intervention in their property sector as they allow excess production to support growth even at the cost of a weaker domestic economy.
8 H. Hoyle and S. Jain-Chandra, ‘China’s Real Estate Sector: Managing the Medium-Term Slowdown’ , International Monetary Fund, (2 February 2024), https://www.imf.org/en/News/Articles/2024/02/02/cf-chinas-real-estate-sector-managing-the-medium-term-slowdown, (accessed 10 June 2024).
9 L. He, ‘China is trying to end its ‘epic’ property crisis. The hard work is just beginning’, CNN (21 May 2024), https://edition.cnn.com/2024/05/21/economy/china-property-crisis-stimulus-challenges-intl-hnk/index.html, (accessed 10 June 2024).
In summary, we see enough green shoots to remain cautiously optimistic on the global economy and its potential to inflect higher from current levels. The excesses of the pandemic have wreaked havoc in cost-ofliving pressures but we are seeing signs of this easing materially. Further relief in the form of central bank rate cuts will be a welcome tailwind. Risks do linger however with household reaction to cost-of-living pressures seen in a wellspring of support for populist political agendas that may trigger further uncertainty or net negative economic policies. These remain an area we monitor closely as they could reshape our future outlook drastically.
Source: Bloomberg
By Cameron Curko Chief Investment Officer, Pitcher Partners Sydney Wealth Management
p +61 2 9228 2415 e cameron.curko@pitcher.com.au
Overview
The Australian market fell slightly in the three months to 30 June, declining 1.1%. For the year to 30 June the market rose 12.1%. This was driven by strong performance from the banking sector which rose 27.5% while the resource sector declined 1.5% for the year
S&P/ASX 200 total return (Jun-23 to Jun-24)
Source: Bloomberg
Outlook
Recommendation: Remain underweight
Valuation remains the major concern with the Australian market. Across the board we have seen sectors almost indiscriminately become more expensive and trade at a material premium to history. This dynamic has emerged despite the notable headwinds they face and the weaker earnings growth we are observing.
The premium valuations coupled with the multiple headwinds they are facing lead us to retain underweight positioning against both the banking and retail sectors. Resource stocks are a more divergent case but continue to face near-term challenges, particularly from weak domestic demand in China. We believe risks there remain skewed to the downside with a near-term catalyst such as Chinese stimulus remaining lacklustre. Accordingly, we continue to position ourselves conservatively regarding the resource sector.
Finally, we continue to see valuation upside in the broader A-REIT sector notwithstanding the strong performance in FY24. Meaningful discounts on valuation offer an attractive entry point as do signs of resilient demand particularly for industrial assets. Accordingly, we believe an overweight stance remains justified.
A-REITs only account for a comparably small part of the broader Australian market however. On our bottomup view given the underweight positioning in both banking and resource names, we believe a conservative stance remains the best course of action. Australian shares continue to lack the positive earnings growth outlook we see for global stocks. Until a meaningful improvement is observed domestically, driven perhaps by RBA easing, we believe this environment will persist in the near-term.
Table 1: S&P/ASX 200 valuation metrics as at 30 June 2024
Source: Bloomberg
NB: Dividend Yield price
The major Australian sectors remain a mixed bag, valuation-wise. Resources and listed property (excluding Goodman Group) remain at a discount to longer-term valuations. The situation for the banking and retail sectors has become more stretched however with both requiring meaningful corrections, or, alternatively, earnings improvement to justify current pricing.
Table 2: S&P/ASX 200 Sector Forward Price-Earnings Ratios as at 30 June 2024
Source: Bloomberg
Banks
Recommendation: Retain underweight position.
The outlook for banks remains mixed. While the majors are delivering operating efficiency with a mix of restructuring, redundancies and investment, they are expected to see operating costs decline over the next three years. In addition, loan quality has remained reasonable. Arrears have climbed but relative to history or the pre-pandemic period they have remained contained. This backdrop has enabled the majors to release excess capital in the form of buybacks with $5.5b announced in recent months10 . Buybacks of this scale offer material near-term support to the share price which has arguably helped spark a rally in recent months, outperforming the broader market
10 ‘The sneaky bad news in the banks’ $4.5b buyback bonanza’ , Australian Financial Review (7 May 2024), https://www.afr.com/chanticleer/the-bad-news-in-the-banks-4-5b-buyback-bonanza-20240507-p5fpjh, (accessed 10 June 2024).
However, the competitive backdrop gives us pause. Over 72% of new mortgages are originated via brokers11 Brokers look to compete in offering their clients the best rates which comes at the cost of profitability for the banking sector overall. As a result, net interest margins, the spread between the loans a bank writes and its cost of funding are expected to remain under pressure. New reports of intensified competition in business banking, with Commonwealth Bank looking to take market share12 , may only exacerbate this trend. Business banking has in recent years been a bulwark of profitability relative to retail borrowers. Heightened competition will likely pressure overall profitability as lenders compete to retain clients with lower interest rates.
In turn, the outlook for earnings growth remains muted. Across the majors, profits are expected to expand only in low single digit terms over the next two years with only NAB expected to grow ahead of inflation (consensus: 2.8% p.a.)
Table 3: Major Bank consensus earnings per share (EPS) and expected growth
Source: Bloomberg consensus estimates
The second concern is valuation. Bank share prices are historically expensive relative to their future earnings expectations. At current levels we would need to see a meaningful uptick on earnings which is not evident. Alternatively, we would need to see prices correct in double-digit territory.
Furthermore, global peers are trading at 9x 2026 expected EPS vs 16.4x for our majors. This is extremely stretched versus history. The last time we saw such a large, relative gap being March 2009 when global markets finally bottomed from the global financial crisis selloff.
11 L. Baird, ‘Can the banks fight their way out of the commodity trap?’ , Australian Financial Review (11 May 2024), https://www.afr.com/companies/financial-services/can-the-banks-fight-their-way-out-of-the-commodity-trap-20240510-p5jche, (accessed 10 June 2024).
12 L. Baird, M. Bleby, and J. Eyers, ‘CBA unveils aggressive business banking strategy to take on Macquarie’ , Australian Financial Review (17 June 2024), https://www.afr.com/companies/financial-services/cba-unveils-aggressive-business-banking-strategy-to-take-onmacquarie-20240617-p5jmdg, (accessed 18 June 2024).
2-year forward P/E ratio premium versus global peers (Jun-05 to Jun-24)
Source: Bloomberg
The above is doubly troubling with global peers expected to grow EPS at 4.8% p.a. over the next 2 years versus 1.4% p.a. in our market and with similar earnings quality as returns on equity are expected to be broadly the same according to consensus
The balance of risks remains skewed against the banking sector and we maintain our underweight positioning.
Resources
Recommendation: Retain underweight position
Resource names have seen a mixed performance during FY24 with our most important export, iron ore, down marginally over this period. The sector outlook remains problematic. On the one hand, China, the global number one producer, continues to see weakness in its property market. Investment spending in the sector, a key driver of Chinese resource consumption, fell over 10% for the first five months of 2024, relative to the same period last year13 Authorities have continued to tread a fine line with government support. These efforts in our view have remained piecemeal. The latest effort is a case in point. Approximately US$41.5b in funding from the People’s Bank of China is being made available for local governments to purchase excess housing inventory. In the context of an economy the size of China’s however this is simply inadequate to restore confidence in the sector. To illustrate, some observers have estimated total excess supply in China stands at almost US$1 trillion14 making this latest effort pale by comparison. Inventories for iron ore remain at elevated levels which should keep downward pressure on prices until we see meaningful signs of depletion.
13 R. Jennings and J. Siqi, ‘China’s property fall overshadows spending rebound in May, challenging Beijing’s economic targets’, South China Morning Post (17 June 2024), https://www.scmp.com/economy/economic-indicators/article/3266847/chinas-property-fall-outshinesspending-rebound-may-challenging-beijing-economic-targets, (accessed 18 June 2024).
14 L. He, ‘China is trying to end its ‘epic’ property crisis. The hard work is just beginning’, CNN (21 May 2024), https://edition.cnn.com/2024/05/21/economy/china-property-crisis-stimulus-challenges-intl-hnk/index.html, (accessed 10 June 2024).
Iron ore prices vs Chinese port inventory (Dec-11 to Jun-24)
Source: Bloomberg
Finally, the outlook for global industrial production is not in our view sufficiently strong to offset this weakness. Signs of a near term peak in the OECD’s leading indicator suggest a continued slowdown in the short run. This should add to downward pressure for iron ore prices.
Annual change in OECD Composite Leading Indicator (3M adv) vs Global Industrial Production (Oct-02 to Oct-22)
OECD CLI YoY (3M adv) Global industrial production YoY growth
Source: Bloomberg.
On balance we believe it remains prudent to be underweight the resource sector as downside risk in the nearterm remains heightened.
Recommendation: Retain underweight position
Discretionary spending continues to track poorly. As highlighted below, spending in nominal terms has essentially flatlined since the second half of 2023. Given the still positive inflation, retailers are, in aggregate, losing volumes in the current environment. Instead, household spending has become dominated by essential goods and services
Household spending growth split by type (Jan-20 to Apr-24)
Discretionary Essentials Total
Source: ABS
This backdrop suggests an environment where top-line sales growth is hard to come by unless a retailer is able to increase its market share meaningfully. Given the dominant presence of many listed retailers in their target markets we see this as an area with limited upside. The RBA stance of “higher for longer” interest rates is another headwind.
On the flipside we do have an assortment of government support measures commencing over the coming months. These include a mix of both State and Federal support15 ranging from electricity bill relief to the Stage 3 tax cuts. These items may provide some support to household spending limiting downside risk.
15 P. Bustamante, ‘States adding substantively to fiscal impulse and to near term uncertainty’, Westpac Economics (21 June 2024), https://www.westpaciq.com.au/economics/2024/06/21-june-2024-budget-update?ai=1718931031027&cd=69312&cid=edm, (accessed 22 June 2024).
Annual growth in household spending
to Jun-24)
Household spending YoY
Household spending (Est) Consumer Sentiment, 6M average (RHS)
Sources: ABS, Westpac
Finally, the sector trades at expensive levels relative to history. While some degree of valuation inflation is justified by the increased quality of the Wesfarmers portfolio, with the divestment of Coles we believe current levels remain difficult to justify.
On balance we believe the headwinds remain meaningful for the retail sector and this coupled with still unfavourable-valuation dynamics warrant an underweight stance.
Recommendation: Downgrade to neutral
The listed property sector continues to show meaningful divergence. All properties are being impacted by the higher interest rate environment. Financing costs continuing to rise as cheaper debt matures and is replaced by more expensive new issuance. The demand for different sectors continues to vary wildly however.
In office we see occupancy trends remain challenging with vacancy rates still not stabilising in the major capitals of Sydney and Melbourne. Other capitals are diverging however, with both Perth and Brisbane seeing vacancy rates decline. The narrative of “work from home” killing the sector remains an oversimplification in our view. Further evidence of this can be seen in stabilising cap rates with the mismatch between valuations and market pricing continuing to close. The degree of discounting in place will eventually close in our view but requires more transaction activity to form a floor on market pricing. Recent transactions16 appear to be assisting in that regard and expected easing by the RBA should also be supportive.
16 C. Kwan and N. Lenaghan, ‘Mirvac set to sell two office towers at discounts of more than 20pc’ , Australian Financial Review (19 June 2024), https://www.afr.com/property/commercial/mirvac-set-to-sell-two-office-towers-at-discounts-of-more-than-20pc-20240619-p5jn2g, (accessed 20 June 2024).
Sydney and Melbourne office vacancy rates (Mar-09 to Mar-24)
Sources: Bloomberg, Colliers International; Interpolation also used where data not reported.
Industrial assets continue to trade strongly with the majority seeing rental increases more than offset increased financing costs. The limited inflow of new supply17 is also a supportive dynamic as it reduces the availability of alternatives and keeps occupancy elevated. We believe this trend has scope to continue with still elevated population growth underpinning the sector. This dynamic is underpinning the still tight valuations (low capitalisation rates) we are witnessing which remain at near record-lows even with a meaningful increase in financing costs which would ordinarily see valuations cheapen.
Listed property sector capitalisation rates (Dec-10 to May-24)
Capitalisation rate (net operating income divided by land value)
Source: Bloomberg.
17 ‘Centuria Industrial REIT: HY24 results’ , Centuria (7 February 2024), https://cdn-api.markitdigital.com/apiman-gateway/ASX/asxresearch/1.0/file/2924-02770152-2A1503637, (accessed 10 June 2024).
Retail assets have performed well in FY24 with an outlook for low single digit growth in earnings18. While we believe there is scope for this to abate given the economic backdrop, this remains a variable proposition Within the retail sector the scale of Scentre Group (Westfield’s landlord) has been the biggest driver of performance. Excluding these premium assets, the remaining players have echoed the weakness in consumer spending highlighted above. We think the macroeconomic outlook warrants an underweight position on balance.
Valuation remains a notable support for the broad sector but requires nuanced analysis. Industrial property developer and landlord Goodman Group remains in another stratosphere from peers. Its global scale and exposure towards data centre construction has driven strong earnings growth and a bullish outlook going forward. These factors arguably justify its record high valuation of ~25x forward earnings. The sector excluding Goodman trades at a material discount to its historical valuation which should be supportive of returns going forward. In addition, easing policy by the RBA could be an important catalyst to a sector rerating. We have already witnessed the strength of this in the first half of FY24 and improved rate cut expectations could see the sector outperformance persist with A-REITs outperforming the broader market by over 10% this financial year.
We believe the strength in demand for industrial assets and valuation support for A-REITs excluding Goodman Group are potent tailwinds for the sector. Our broader macroeconomic concerns do give us pause however and these coupled with the strong price performance in FY24 lead us to adopt a cautious approach and downgrade to a neutral stance.
By Cameron Curko Chief Investment Officer, Pitcher Partners Sydney Wealth Management
p +61 2 9228 2415
e cameron.curko@pitcher.com.au
18 ‘NAB Commercial property Survey Q1 2024’ , NAB Behavioural & Industry Economics (23 May 2024), https://business.nab.com.au/wpcontent/uploads/2024/05/NAB-Commercial-Property-Survey-Q1-2024.pdf, (accessed 10 June 2024).
Global share markets rose 0.3% in the three months to 30 June and were up 19.9% for the year to 30 June. A rising Australian Dollar was a slight headwind of 0.3% for the full year with the hedged benchmark rising 20.2% by contrast
MSCI World ex Australia Net Total Return Index (Jun-23 to Jun-24)
Source: Bloomberg
Outlook
Global markets continue to surpass expectations with a meaningful acceleration in earnings growth anticipated from 4.4% in 2024 to 10% p.a. over 2025 and 2026. The key driver has been the anticipation of continued spending on artificial intelligence initiatives which has seen the US market rise almost 23% in local currency terms, far ahead of other major regions with Europe up 14% and China actually declining 10% by contrast.
Substantial growth has indisputably been priced into most of the leading technology stocks. Unlike past Bubble periods, chiefly the Dot-com Bubble of the early 2000s, this growth is not just in revenue but also earnings. This has led to these stocks trading at expensive but not outright ridiculous valuations. The Nasdaq 100 index for example traded at over 60x expected EPS in early 2001 versus a more conservative 24x multiple today. We believe the AI spending has room to run with major technology giants continuing to highlight strong client demand for their cloud offerings and in particular AI solutions across a broad swath of global commerce. In addition, the prospect of improving economic growth in regions such as Europe adds a tailwind to cyclical sectors that should not be overlooked. In summary we believe there is both a secular tailwind of AI spending coupled with a modest cyclical upswing in the global economy that justifies maintaining exposure to international equities.
The US remains the dominant player in global equities accounting for over 72% of the value in developed markets19, even after including emerging markets it still represents most of the value at almost 65%20 On the valuation front, investors have continued to reward the strength of US technology names such as Nvidia and Microsoft with strong bidding for these stocks, seeing overall market valuations stretch even further over the past year
Looking forward, the US appears substantially overvalued relative to a longer-term average multiple of 17x On a near term basis this implies a fall of almost 24% to get back to fair value and even looking further out to 2026, a decline of over 6.5% would be necessary. This view must, however, be measured against the potential for higher growth with almost 10% p.a. expected over the next few years. This may be an underestimation, however, with US growth expected to uptick along with rate cuts which would support higher earnings for cyclical stocks. It may also be understating the impact of artificial intelligence on earnings growth with many businesses flagging improved efficiency as a result of these investments. We believe a neutral stance on the US remains warranted. Recession risk appears to be contained which favours risk assets. The prospect of further interest rate hikes remains limited amidst a slowing growth environment. The labour market has also held up reasonably well through this period. Overall, while we do see some macro headwinds, we feel there are sufficient positives to warrant a neutral stance on the US market. Table 4: S&P 500 fair
Source: Bloomberg, PPWM calculations
As we turn instead to valuations elsewhere, we find the expensive paradigm in the US can be found elsewhere albeit to a less drastic degree. Global shares across both developed and emerging markets, in aggregate trade at only a slight premium to history Given an improving earnings backdrop as growth
19 ‘MSCI World ex Australia Index (USD)’ , MSCI (31 May 2024), https://www.msci.com/documents/10199/49479550-e805-4895-ba732893b1f3d60b, (accessed 10 June 2024).
20 ‘MSCI ACWI ex Australia Index (AUD)’ , MSCI (31 May 2024), https://www.msci.com/documents/10199/0f8162fc-490b-4a00-9f1b61d6e33cbd75, (accessed 10 June 2024).
accelerates in regions such as Europe, we are comfortable with maintaining exposure notwithstanding the marginal premiums to historical averages.
Table 5: Major share market forward P/E ratio (spot versus 15-year average)
Source: Bloomberg Conclusion
Recommendation: Remain neutral
Global markets have enjoyed another strong spell in FY24. The theme of Artificial intelligence has triggered an arms race amidst tech giants with growth in both new products and tools, capital spending and strong client demand. This continues to be sustainable in the near term with no discernible signs of deceleration at present. In addition, we are seeing signs of economic improvement in economies hit the hardest by tighter monetary policy with the beginning of an easing cycle expected to add a cyclical tailwind to growth in regions such as the Eurozone.
In summary we believe there is both a secular tailwind of AI spending coupled with a cyclical upswing in the global economy that justifies maintaining exposure to international equities. The pace of the valuation expansion does give us pause however, as much of the recovery has been priced in after another year of double-digit returns. We believe neutral positioning is prudent in the face of the premiums in global share markets. While there is a headwind in the expensiveness of current valuations, the profit growth dynamic remains favourable and warrants retaining exposure.
By Cameron Curko Chief Investment Officer, Pitcher Partners Sydney Wealth Management
p +61 2 9228 2415
e cameron.curko@pitcher.com.au


Jordan Kennedy Partner, Pitcher Partners Sydney Wealth Management
p +61 2 9228 2423 e jordan.kennedy@pitcher.com.au

Charlie Viola Partner | Managing Director, Pitcher Partners Sydney Wealth Management
p +61 2 8236 7798
e charlie.viola@pitcher.com.au

Andrew Wilson Principal, Pitcher Partners Sydney Wealth Management
p +61 2 9228 2455
e a.wilson@pitcher.com.au

Authors
Martin Fowler Partner, Pitcher Partners Sydney Wealth Management
p +61 2 8236 7776
e martin.fowler@pitcher.com.au

Cameron Curko Chief Investment Officer, Pitcher Partners Sydney Wealth Management
p +61 2 9228 9173
e cameron.curko@pitcher.com.au
| Brisbane | Melbourne | Newcastle | Perth | Sydney