


The post-pandemic period has tested economic convention particularly in the aftermath of interest rate hikes by the Reserve Bank (RBA). Ordinarily we would expect to see a fall in consumer spending leading to lower demand for goods and services. In reaction businesses would cut production, reduce hours and then eventually start shedding staff. The inevitable failure of over-indebted businesses crippled by higher borrowing costs, only adds to the unemployment queues.
Yet against all odds, job losses have not been a feature of this cycle. Government spending has resulted in unprecedented employment growth across the non-market sectors of the economy. In particular, demand for National Disability Insurance Scheme (NDIS) and Aged Care services have seen jobs grow by over 20% from pre-pandemic levels Meanwhile the more cyclical, market facing parts of the economy such as retail trade and hospitality have seen aggregate growth below 10% over the same period This dynamic has kept the labour market far tighter than expected with an unemployment rate of 3.9% in November compared to the 5% average in 2019. While the Federal government has recently toughened its stance on the NDIS, spending is still expected to grow annually by 8% from 1 July 20261 , which should see labour market tightness persist over the near term.
Cumulative jobs growth by sector (Feb-20 to Nov-24)
Source: ABS
A tight labour market has complicated the RBA’s decision calculus as wage growth has remained stubbornly above 3% since 2022. Although goods inflation has continued to ease after pandemic restrictions were lifted and supply chains normalised, services inflation, which has a greater linkage to wages, has remained more entrenched.
1 ‘NDIS growth target on track to be delivered’ , NDIS (12 December 2024), https://www.ndis.gov.au/news/10531-ndis-growth-target-trackbe-delivered#:~:text=%22New%20data%20shows%20recent%20Government,and%20Government%20Services%20the%20Hon, (accessed 15 December 2024)
Source: ABS
The RBA appears to be increasingly willing to look through these considerations with weaker growth data offering justification to potentially cut interest rates. In its December meeting, the governor was at pains to say the Board would consider data holistically and would not need several quarters of inflation at target levels before cutting2. Current market pricing and economist expectations suggest at least three rate cuts are expected in 2025, a view that appears reasonable in light of the RBA’s newfound dovishness. There are downside risks however, mainly in the drivers of services inflation. A tight rental market could continue adding to inflation given a still growing population and limited growth in housing supply. Higher electricity costs could also emerge if government policy shifts with these being artificially suppressed via a mix of temporary State and Federal subsidy programs. If these and other factors continue to drive elevated services inflation, there is a real risk of the RBA decision to leave rates on hold persisting further
Growth risks are worth considering with consumer spending flatlining for the September quarter, its weakest recent level of activity outside of the COVID lockdowns Consensus forecasts expect an improvement in 2025 with a mix of population growth and lower interest rates helping spur private sector spending to see the economy expand by 2% (in contrast to 2024’s 1.2%). The quality of growth in terms of GDP per capita is expected to remain under pressure with limited signs of productivity improvement to date. This is a testament to where jobs growth has originated from. The non-market sector has been the main source of jobs growth but historically has been less productive3 . Meanwhile market-facing jobs have recovered to pre-pandemic levels of productivity.
2 ‘Monetary Policy Decision’ , Reserve Bank of Australia (10 December 2024), https://www.rba.gov.au/speeches/2024/mc-gov-2024-1210.html, (accessed 12 December 2024).
3 L. von Onselen, ‘Australia’s job market does not reflect the economy’, Macrobusiness (16 December 2024), https://www.macrobusiness.com.au/2024/12/australias-job-market-does-not-reflect-the-economy/, (accessed 17 December 2024).
Australia – Labour productivity Per hour worked, Q1 2003 =100
Source: ABS, Antipodean Macro
Besides weak labour productivity, global geopolitical issues are worth considering. The incoming Trump administration has triggered concerns globally over the possible impact of a more aggressive US trade policy. For Australia the direct impact is unlikely to be particularly material. Only 3.8% of our exports were to the US in 2023 according to IMF statistics. By contrast over 11% of our imports were from the US suggesting they have more to lose in a relative sense from any tariff conflict.
The fear though is how our largest trading partner, China, might be affected. Already the President-elect has threatened to impose tariffs on Chinese goods of up to 60% when he accedes to office. Our key exports to China are natural resources including iron ore and coking coal, used in the production of steel, and thermal coal, used in the production of energy. Thermal coal demand is relatively inelastic and is unlikely to change by much. The same cannot necessarily be said for iron ore and coking coal. China is the biggest steel producer in the world and much of what is produced domestically is used in their construction sector, with additional supply exported elsewhere. With the steel hungry property and construction sector in China reeling from the failure of high-profile developers as well as from the collapse in demand due to falling property prices, China is increasingly reliant on export markets to sell its excess steel Although China only exports less than 2% of steel to the US directly, this does not include the steel used in ships, containers, vehicles and household appliances When indirect steel products are included, it has been estimated that up to 10% of total steel produced in China could be impacted by the proposed tariffs4 This presents very real downside risks to the price of Australian iron ore and coking coal.
The Australian dollar (AUD) has been highly volatile in 2024, ultimately ending the year down over 6% with the bulk of this move occurring after the Trump election win in the US. The AUD acts as a proxy for investor views on China given our close ties as a supplier to China. The incoming Trump presidency is being perceived as a net negative for Chinese prospects prompting a selloff in the AUD. In addition the cuts by the US Federal Reserve (Fed) have seen the relative gap between Australian and US rates shorten materially. All else being equal this is typically a tailwind for the higher yielding currency as it encourages speculators to capture this relative spread by borrowing in USD and buying AUD.
At these levels the AUD is trading 7.5% below its inflation-adjusted fair value of US$0.69. This does not mean any rapid adjustment is likely as we note that mean reversion of currencies typically takes several years to play out
4H. Yermolenko, ‘Potential Trump Tariffs will affect China’s indirect steel exports’, GMK (12 November 2024), https://gmk.center/en/news/potential-trump-tariffs-will-affect-chinas-indirect-steel-exports/, (accessed 13 November 2024).
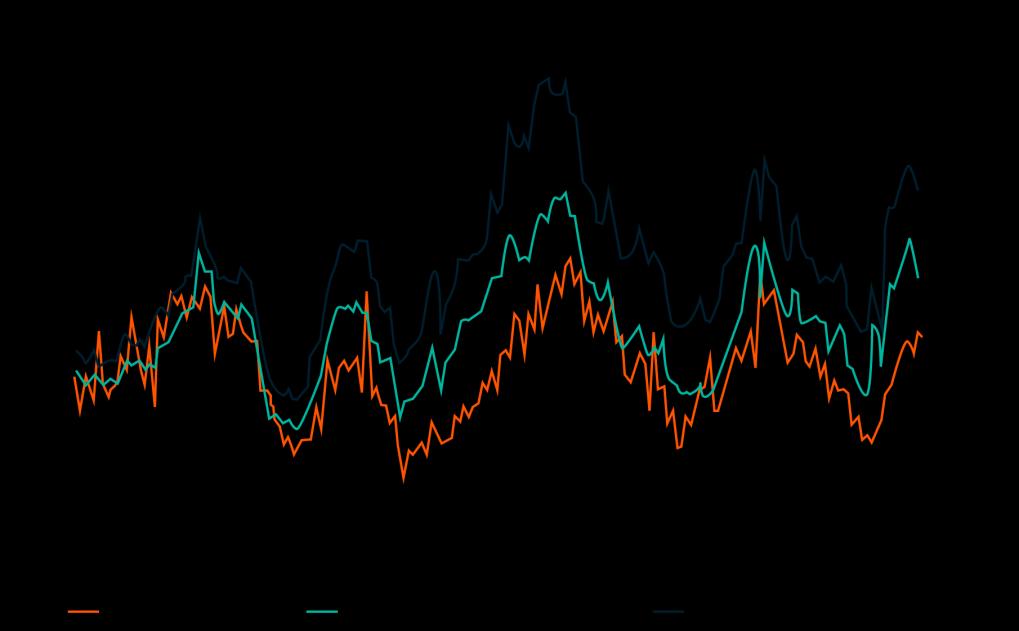
Australian-US interest rate spread versus the AUD-USD exchange rate (Dec-94 to Dec-24)
Source: Bloomberg
The Australian economy is expected to see improvement in 2025 thanks to tailwinds from lower interest rates, elevated government spending and population growth. A still-strong labour market could frustrate the RBA’s monetary policy ambitions with broad services inflation still tracking materially higher than pre-pandemic levels. Uncertainty surrounding the US President-elect’s tariff policies on the growth trajectory of our largest trading partner, China, remains a key risk.
Source: Bloomberg
By Cameron Curko CIO,
p +61 2 9228 2415
e cameron.curko@pitcher.com.au
The US is expected to see still enviable albeit slower growth in 2025 with real GDP expected to expand 2% according to consensus forecasts. Growth is expected to be supported by key Trump administration reforms including cutting the corporate tax rate to 15%, incentivising workers by extending lower individual income tax rates, exempting overtime and tips from income tax, as well as a broader deregulation agenda (cutting redtape and slashing government sector jobs)
In addition, the economy is continuing to benefit from existing tailwinds Firstly, the outgoing Biden administration’s Inflation Reduction Act stoked government support for sectors such as manufacturing which are still reaping the dividends with construction activity for the sector still materially above pre-pandemic levels. Secondly, the US government is still running deficits at an elevated rate of 6.2% of GDP as of September, over 1% above the post-global financial crisis average High levels of government spending are positive for growth in the short term although can become unsustainable over the longer term Thirdly, the Federal Reserve is maintaining an accommodative posture with 1% of rate cuts in 2024 alone. A further two cuts are expected in 2025. These will lower financing costs, improve disposable incomes of indebted households and support stronger growth conditions
Over the last 12 months inflation has been declining due to a combination of goods disinflation and lower rent and housing costs. This trajectory could be jeopardised due to the multiple growth tailwinds facing the US economy as well as the President-elect’s plans to introduce tariffs
By imposing tariffs on imported goods, Trump hopes to improve the competitiveness of US manufacturing, generating jobs for workers displaced by globalisation. But tariffs come at a cost for both the exporter and the importer. The exporter can either decide to pass on the higher costs to the end consumer or absorb part or all of the taxes. Either option typically leads to lower profits for the exporter, either through lower sales (subject to demand elasticity) due to higher prices or where the cost of tariffs costs are absorbed, lower profits due to lower margins. In aggregate, this reduces the exporting income (GDP) of the exporting nations, including key trading partners Europe and China.
In turn the importing nation is also affected. This is because the American consumer will either decide to buy the imported good at a higher price (which in aggregate is inflationary) or decide to cut back on consumption (in aggregate, lower demand leads to lower growth),or find cheaper substitutes (such as subsidised US products may become more competitive). Capital tends to flow to the most competitive source of production. Tariffs tend to reduce the need for import competing industries to innovate and reduce the cost of production, which typically leads to lower productivity.
It follows that on balance, exporting nations including Europe and China are likely to suffer from lower export income reducing their growth outcomes. Similarly, the US being the importing country, may end up being worse off due to a combination of lower demand, potentially higher inflation, higher financing costs and lower productivity.
This could see the Fed defer or even outright halt its current path of cutting interest rates. We saw a prelude of this in late December when the Fed revised its rate cut projections for 2025 from four to two5
5 D. Mercado, ‘Fed Meeting recap: Powell says central bank to be ‘cautious’ on rate cuts, rocking the market’, CNBC (19 December 2024), https://www.cnbc.com/2024/12/18/fed-meeting-live-updates-traders-await-december-interest-rate-cut.html, (accessed 20 December 2024)
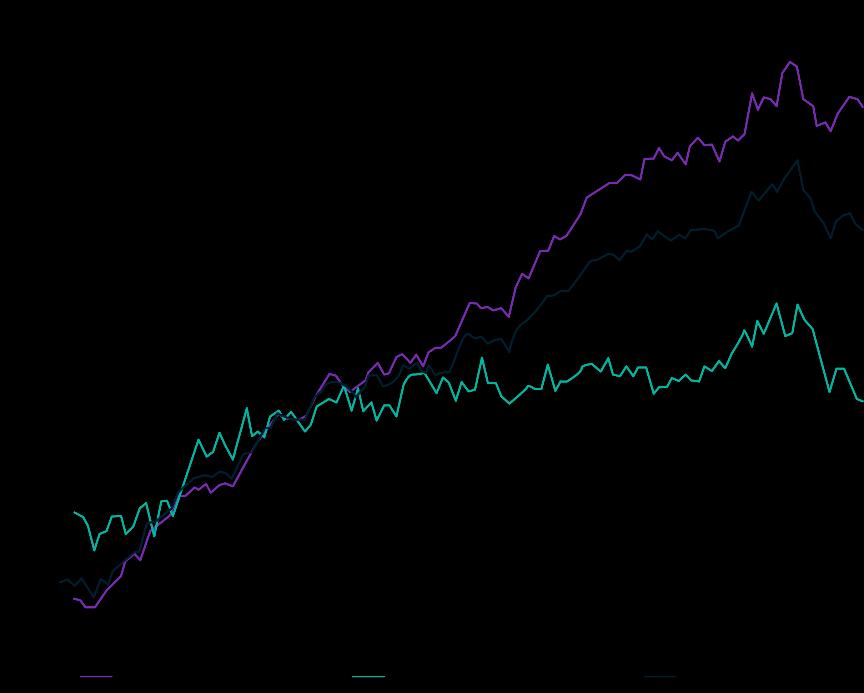
US underlying inflation metrics (Nov-14 to Nov-24)
Source: Bloomberg
In addition, the incoming President’s proposed agenda introduces a range of other risk factors. His foreign policy plans to force Ukraine to the bargaining table with Russia by cutting military funding has been said to be a high-risk strategy. The possibility of a reignited trade war with China and other major trading partners is another consideration. Moreover, the electoral promises to tackle illegal immigration could have sizeable ramifications. A withdrawal of labour supply could see the labour market retighten and drive higher inflation. Lastly the establishment of a billionaire-led advisory body, the Department of Government Efficiency (DOGE), to combat government inefficiencies could on the one hand help shrink the scale of deficit spending but, on the other hand, weaken growth by driving the removal of government employees.
In summary the outlook for the US over the course of 2025 is mixed. Multiple tailwinds could be partly offset by the imposition of tariffs that could reduce demand for goods due to higher prices and reignite inflationary pressures. This could see a more hawkish Fed emerge as a brake on growth. Finally, political uncertainty appears likely to be a feature of the US in the near term as observers try to grasp the extent and depth of the new administration’s policy agenda.
In Europe, political instability across the region continues to undermine efforts to combat weak economic growth. France is now on its fourth prime minister of the year with centrist Francois Bayrou6 looking to form a new coalition and pass a full budget for 2025. Meanwhile Germans are set to go back to the ballot box in February after Chancellor Scholz lost a vote of no-confidence in his government, ending two months of minority government after his ruling coalition collapsed.
In France, the commitment to budget repair via higher taxation and spending cuts contributed to the collapse of the previous minority government. It does highlight a material risk to EU growth where spending limits by EU authorities, designed to discourage excessive national indebtedness may, in fact, exacerbate the weaker economic growth the region is experiencing. A recent lesson of what may go wrong can be seen in the aftermath of the global financial crisis where austerity measures contributed to a “double dip” recession in Europe.7 A repeat of this experience could trigger a prolonged recession.
6 ‘Macron ally Francois Bayrou appointed new French Prime Minister’ , The Guardian (13 December 2024), https://www.theguardian.com/world/2024/dec/13/macron-ally-francois-bayrou-appointed-new-french-prime-minister, (accessed 14 December 2024).
7 ‘Eurozone recession deepened at the end of 2012’ , BBC World News (14 February 2013), https://www.bbc.com/news/business21455423, (accessed 12 December 2024).
In response to current weakness, the European Central Bank (ECB) has implemented several rate cuts in 2024 with a further four anticipated for 20258 The ECB Council has been at pains, following its last meeting, to flag its dovish note and commitment to improving regional growth. As part of these statements the prospect of even more rate cuts has been actively mooted.
One concern for the region however is whether it too may see a reignition of inflationary fears. Services inflation as was the case in the US, continues to run at elevated levels with 3.9% growth for the year to November materially higher than the 1-2% range preceding the pandemic period. Whilst goods disinflation has helped push core inflation into a 2-3% range the risk of an uptick should not be neglected.
EU headline versus services inflation metrics (Nov-14 to Nov-24)
Source: Bloomberg
In summary political turmoil is stymieing European growth ambitions with several major countries including Germany flirting with recession. The ECB is now easing aggressively which should offer a tailwind for growth but, even if successful, may trigger a newfound hawkish impetus if we do not see meaningful deceleration in inflation particularly the services sector.
Chinese authorities have taken steps this year to reinvigorate their economy via monetary stimulus. The hope was that improving credit access and lowering financing costs would help reinvigorate the economy, particularly its weakened property sector. Arguably we are beginning to see signs of this with the decline in property investment spending showing signs of troughing towards the end of this year. New house prices also saw their smallest decline in October suggesting this may be an inflection point from which property prices could begin recovering.
On the negative side of the ledger however we are seeing weakness in lending to the real economy (excluding the financial sector) which slowed for the year to November. In addition longer-term corporate loans, a sign of business confidence to invest and grow production, fell to their lowest level since 2016 in November. Taken together, these datapoints suggest that efforts to boost credit supply will be ineffective if households or businesses lack the confidence or desire to borrow more to begin with.
Household weakness remains apparent with consumer inflation flirting with negative territory Retail sales have only risen 3% for the year to November, well below the 5% growth expected by consensus forecasts. In recognition, Government authorities have noted that more vigorous support appears necessary to combat the country’s current growth slowdown. To date however there has been a meaningful lack of concrete details to support these promises increasing scepticism that this might be another “false dawn” moment for China.
8 Bloomberg consensus estimates
Finally the prospect of even worse ties with the US under President-elect Trump has become a major concern for the world’s leading exporter. The size of US trade with China (almost US$600b in 20239) highlights the riskiness of any policy shift that imperils the bulk of this trade. Chinese authorities may well need to use their promised stimulus to offer targeted economic support in response to US actions. The incoming administration has already threatened immediate 10% tariffs on Chinese goods from its accession and more may be forthcoming if a “fairer” compromise cannot be reached. This newfound aggression could substantially drag on Chinese growth given the importance of exports to the country’s economic model.
On balance, China’s economy continues to struggle against a weak demand backdrop. There are positive signs that authorities are intervening to reinvigorate growth but more is needed before we can have confidence that they will succeed. US policy is now a key source of uncertainty for the country with President Trump seen as a more aggressive leader which could see current weakness within China exacerbated by challenges to the country’s export sector.
Divergence for the global economy appears set to persist in 2025 with moderate growth expectations in the US offsetting weakness in Europe, China and Japan President Trump appears set to be a swing factor in the outlook with his policy approach potentially having significant ramifications for both trade and geopolitical relationships. Central bank easing should also support the outlook for next year. There are lingering risks however with a slowdown in the US labour market being monitored closely to see if it is a normalisation from tight levels or the start of something more ominous. A reignition of inflationary pressures which have, to be frank, not abated in areas such as the services sector is also a potential concern as it may necessitate a reversal in the interest rate easing cycle underway.
United States
Source: Bloomberg
By Cameron Curko CIO,
Pitcher Partners Sydney Wealth Management
p +61 2 9228 2415
e cameron.curko@pitcher.com.au
The Australian market was down slightly in the three months to 31 December, declining 0.8%. For the year to 31 December the market rose 11.4%. This continued to be driven by strength in the banking sector up almost 35% in 2024 while the other index heavyweight, the materials sector, has declined 13% over the same period
S&P/ASX 200 total return (Dec-23 to Dec-24)
Source: Bloomberg
Outlook
Recommendation: Remain underweight
Lofty valuations and subpar growth expectations are defining some of the largest segments of the Australians share market. The banking sector is a cause célèbre with slightly negative earnings growth expected over the next three years yet share prices have rallied over 37% in 2024. Meanwhile the mining sector is faced with still subdued demand coupled with stronger incoming supply that suggest limited scope for optimism. The market itself is trading at record highs across a range of valuation metrics suggesting heightened risk of either a correction or a spell of below-average performance until earnings catch up to recent price action. In either case, the market is facing numerous challenges not least lofty expectations that suggest caution remains the best course and we therefore retain our underweight position.
Table 1: S&P/ASX 200 valuation metrics as at 31 December 2024
Source: Bloomberg NB: Dividend Yield
The major Australian sectors have seen a mixed dynamic in performance over the December quarter Resource stocks have cheapened further after optimism over new stimulus programs in China faltered whilst a move higher in yields has seen the A-REIT sector retreat further. The commodities sector coupled with the broader A-REIT universe outside of Goodman Group are some of the few pockets of relative “value” with valuations near long-term averages. The major banks have continued their strong run trading at record high levels. Even a normalisation back to previous peak valuations implies 14% downside from current levels.
Turning to the broader market we see that, once resource names are excluded, we are trading more than 40% above the long-term average. Such a move might be warranted if we have seen a matching improvement in business quality and growth justifying this outlook. This does not appear to be the case considering both our own and consensus expectations. We continue to believe current pricing is unjustified in the face of subdued growth expectations and risks remain skewed to the downside.
Forward P/E ratio for Australian market decomposed by sector (May-05 to Dec-24)
Source: Bloomberg, PPWM calculations
Table 2: S&P/ASX 200 Sector Forward Price-Earnings Ratios as at 31 December 2024
Source: Bloomberg
Banks
Recommendation: Retain underweight position
The December quarter marked another spell where banking majors benefitted from relative weakness in investor sentiment towards resource names. This saw the sector grow even more expensive with several trading at or near record high valuations. Our banking sector is, on average, one of the most expensive globally with pricing that is difficult to justify. Risks of a correction or, at a minimum, below market performance remain elevated in our view.
On the fundamental side expected profits were revised marginally higher for FY25 (+0.9%) and lower for FY26 (-0.5%). This stands in sharp contrast to the 4.9% rise in share prices for the sector. The major banks continued to benefit from low arrears in their home mortgage books though there are signs of this abating. In its September update10 Commonwealth Bank (CBA) noted 90+ days arrears for its mortgage book back at historic average levels of 0.65% Another tailwind for the sector has been the strength in new housing credit (excluding refinancing) The strength in volumes has helped backstop profit growth but notably this has started to decelerate in recent months which may now pose a headwind.
Bank sector total return versus new housing credit growth (Dec-04 to Dec-24)
Rolling 1-year return of Major Banks Rolling annual growth of housing credit (excluding refinancing)
Source: Bloomberg, PPWM calculations
10 ‘1Q25 Trading Update’ , CBA (13 November 2024), https://www.commbank.com.au/content/dam/commbank/aboutus/shareholders/pdfs/2025-asx/September-Quarter-2024-Trading-Update.pdf, (accessed 14 November 2024).
Elevated valuations and the prospect of emerging headwinds loom over the sector. Current pricing, on balance, is unjustified and accordingly we retain our underweight stance.
Resources
Recommendation: Retain underweight position.
Actions not words will define the course of iron ore prices in the year ahead. Chinese authorities have reacted to property market weakness by easing borrowing costs and access to finance. To date these responses appear inadequate. Retail sales disappointed for the year to November, consumer inflation remains anaemic with a weak household spending dynamic and producer prices are still outright deflationary.
We have seen in recent weeks a fresh round of promises from Chinese state media and even the Politburo that more stimulus is coming down the pipeline to foster household spending. Given the reaction to the initial announcements in September with credit growth struggling to pick up meaningfully in subsequent months we believe that now more than ever a “wait and see” approach is justified. A forceful fiscal response could be an inflection point for demand given the weakness in the property market over recent years.
Current market fundamentals bode poorly for a near term recovery in prices. As shown below, Chinese iron inventories remain near cyclical highs across a range of demand proxies such as steel production or import volumes Typically you need a shortfall in a particular commodity before prices are bid higher and we see a price response.
Chinese iron ore port inventories relative to demand (2010 to 2024)
Source: Westpac Economics11
In addition, Rio Tinto’s (RIO) Simandou flagship mine as well as the Onslow operations of ASX-listed Mineral Resources (MIN) could pose a further headwind to prices by increasing supply relative to demand.
Taken together we believe the combination of elevated and incoming supply coupled with uncertainty on the demand front warrant cautious positioning on the sector and accordingly maintain our underweight stance. A meaningful shift in Chinese policy or improvement in the global growth outlook would see us reevaluate this positioning.
11 ‘Westpac Market Outlook: December 2024 – January 2025’, p 14, Westpac Economics (13 December 2024), https://library.westpaciq.com.au/content/dam/public/westpaciq/secure/economics/documents/aus/2024/12/WestpacMarketOutlookDecem ber2024-January2025.pdf, (accessed 14 December 2024).
Recommendation: Retain underweight position
Australian households have enjoyed several tailwinds in 2024 with a tight labour market seeing wages up 3.5% for the year to September. Broadened tax cuts by the Federal government also became effective from 1 July. This must be balanced however against the ongoing pressures from the RBA with housing repayments now at an estimated 10.4% of household disposable income, their highest level in the post-2009 period12. The RBA efforts have borne fruit in cyclically sensitive sectors with labour demand and jobs growth slowing rapidly from their high point in 2022
In addition, and importantly for the retail sector, we have seen a marked decline in volume growth in the past two years even with population growth north of 2% over this period. Businesses have tried to preserve margins through higher prices but this has come at the cost of contracting sales volumes as consumers pull back and reduce spending. Services spending has also diverted income that might have otherwise supported the sector with strong rental growth and cost inflation across insurance, education and healthcare all absorbing a higher proportion of the average consumer wallet.
We can see these dynamics play out in the below chart which shows the downward trend in the volume of goods consumed versus the strength in sales. This dynamic bodes poorly for retailers as, even with tax cuts boosting incomes and population growth expanding the number of potential buyers, the sector could not support continued volume expansion.
Cumulative growth of household spending (Mar-09 to Sep-24)
Source: Australian Bureau of Statistics, PPWM calculations
The earnings outlook also appears mixed with retailers trading near record-high valuations despite a clearly challenged consumer. In individual cases this can be warranted where a retailer expands its share of a flat or shrinking market. In aggregate, however, it does not appear tenable and suggests downside risks still outweigh the upside from after-tax income and population growth. We prefer to remain underweight the sector until a more favourable backdrop emerges with current valuations still a key concern.
Recommendation: Maintain neutral
The listed property sector continued to see valuations stabilise in the December quarter. The inexorable grind lower for property valuations, most notably in the office sector, appears to be slowing or outright halted. We can observe this in current capitalisation rates (the rental yield paid on the real estate) which have remained largely flat as transactions support property values.
12 ‘RBA statistics Housing Loan Payments – E13’, https://www.rba.gov.au/statistics/tables/, (accessed 12 December 2024).
The office sector remains a problematic area overall with elevated vacancy rates in major cities Sydney and Melbourne. That said, it is a sector marked by sizeable dispersion across states and within major cities. The likes of Perth and Brisbane are enjoying a relative boom phase by contrast with robust demand supporting valuations. Meanwhile vacancies remain a source of pressure in Sydney for example though this is nuanced with major landlord Dexus continuing to note the material divide in demand for office space across the central business district with the overall vacancy rate driven by weakness in the Western corridor abutting Darling Harbour. Summarising this picture it does appear that the sector is at a trough point and is unlikely to worsen further from current levels. Limited incoming supply in several capitals should also be a tailwind going forward.
sector cap rates (May-11 to Nov-24)
Source: Bloomberg
Meanwhile in the industrial sector we need to start with the bifurcation between the majors. Goodman Group is the heavyweight in listed industrial property players. It is, however, a breed apart with its global reach in typically logistic sites with a vast array of both development and funds management opportunities. Increasingly it has found another “growth engine” with the sourcing and development of data centre sites in the face of unprecedented demand from large, global technology companies. While this narrative remains intact the business should be able to continue growing earnings above 10% per annum for the medium term.
The backdrop in the broader industrial sector also remains positive as the popularity of online shopping continues to spur demand for warehouse and logistics sites. A limited supply response due to elevated financing costs has also preserved pricing power for landlords Higher rates are also offsetting much of the rental growth these businesses have experienced with the Centuria and Dexus REITs (CIP and DXI respectively) growing funds from operations (FFO) by less than 2% even though rental growth was above 6%. We are beginning to see signs of a supply response gradually emerging though it will take time to flow through to rental growth towards levels seen before the pandemic In conclusion, a mix of still subdued incoming supply and resilient demand ensures the case for industrial property remains intact. Resilient population growth meanwhile is supporting the retail sector. Heavyweights such as Westfields landlord Scentre Group (ASX: SCG) or Vicinity Centres (ASX: VCX) are still expecting FFO growth above inflation over the next few years. Increased foot traffic has been a notable feature with Scentre Group experiencing 8.7 million additional visits for 2024 year-to-date, up 2.1% on its 2023 experience13 Sector
13 ‘Scentre Group Operating Update’ , Scentre Group (7 November 2024), https://assets.ctfassets.net/0vreywxqlgab/Yf6iAgmfFDcKLcc2P5aeD/334f349c95d70bfd718cd06a4c2c6991/2024_Q3_Announcement_a nd_Presentation.pdf, (accessed 1 December 2024).
valuations have stabilised in line with the stronger demand backdrop with more stable funding costs allowing rental growth to flow through to higher earnings in contrast to the industrial experience. Overall there are sufficient grounds to remain positive on the space.
Finally sector valuations outside Goodman Group are only modestly expensive relative to their longer-term average. The Goodman case can be rationalised through the elevated earnings growth outlook it is experiencing in the near term. In addition the prospect of rate cuts in 2025 should be a notable tailwind for the sector which remains highly sensitive given the reliance on debt as a source of capital. This appears to be a reasonable setup for further growth into 2025 Consequently we upgrade our stance to overweight.
By Cameron Curko CIO, Pitcher Partners Sydney Wealth Management
p +61 2 9228 2415
e cameron.curko@pitcher.com.au
Global share markets surged by 12.1% in the three months to 31 December and were up 31.2% for calendar year 2024 This was boosted by a declining AUD which fell over 9% for the year with the hedged global market benchmark rising by 20.7% over the same period
MSCI World ex Australia net total return index (Dec-23 to Dec-24)
Source: Bloomberg
Recommendation: Maintain underweight
Global markets performed strongly in 2024 with US shares a clear standout, rising over 23% in US dollar terms following forecast earnings growth of 9%. This outperformance is expected to persist with US shares expected to grow earnings 12.3% p.a. from 2024 to 2026 whilst markets outside the US are expected to grow a more modest 6.7% p.a. over the same period.
The ongoing investment in artificial intelligence and re-election of President Trump, has stoked animal spirits for US stocks which are focusing on the benefits of his electoral promises including lower taxes and less regulation. These looming reforms, together with already elevated government spending (budget deficits) initiatives, bode well for growth
These benefits however will need to be weighed against his tariff and immigration agenda. Tariffs come at a cost for both the exporter and the importer. Exporting nations reliant on the US consumer, including Europe and China, are likely to suffer from lower export income reducing their growth outcomes The US may end up being worse off due to a combination of lower demand, potentially higher inflation, higher financing costs and lower productivity. Similarly, plans to deport illegal workers may lead to an increase in the cost of labour, adding to inflationary pressures.
Other headwinds to earnings growth include the Trump administration’s plans to unwind spending tied to President Biden’s Inflation Reduction Act which had billions in grant and tax offset entitlements; as well as plans to slash government sector jobs.
In our view the combination of these factors could challenge the rather optimistic earnings expectations, which come at a time when valuations have only become more stretched. Both the mega cap names and the
broader US market are trading at levels implying over 20% downside assuming mean reversion back to longer-term averages. Accordingly we believe prudence is advised and retain our underweight stance in the face of heightened downside risk.
The US now accounts for 75.3% of the value in developed markets14 , and, even after including emerging markets it still represents most of global market value at 67.9%15 US valuation expansion has persisted following the Trump election win with optimism over mooted tax cuts for their ability to boost corporate profits. Much of the recent expansion has been tied to US tech names including Tesla, which has risen over 54% in the December quarter as CEO Elon Musk’s ties to the incoming Trump administration are expected to benefit shareholders by easing the path to self-driving cars. In the process, it has seen its market value expand by US$460b whilst forward earnings for 2025 were revised higher by a more modest US$0.4b.
Based on 2024 consensus earnings, valuations in the US are almost 30% above their longer-term averages. Even when assuming earnings growth of 12% p a in 2025 and 2026, then valuations are still over 12% above fair value.
Source: Bloomberg, PPWM calculations
The US is somewhat anomalous in its valuation extremes with Australia emerging as a notable second place following the rally in our financial sector. Other markets, both developed and emerging are showing signs of over-valuation albeit at more modest premiums to their 15-year average. The All-Country World Index (excluding the US) includes both developed and emerging market countries and is trading at 7.8% premium to its 15-year average. The risk-return backdrop continues to be skewed more favourably in these markets given
14 ‘MSCI World ex Australia Index (AUD)’ , MSCI (29 November 2024), https://www.msci.com/documents/10199/c27eeea3-ad05-4944bef4-fbaef9ef34ec, (accessed 1 December 2024).
15 ‘MSCI ACWI ex Australia Index (AUD)’ , MSCI (29 November 2024), https://www.msci.com/documents/10199/0f8162fc-490b-4a009f1b-61d6e33cbd75, (accessed 1 December 2024).
the increasingly lofty growth expectations in the US (and pricing to match). It supports at least some diversification away from the US at a minimum.
Table 5: Major share market forward P/E ratios (spot versus 15-year average)
Source: Bloomberg Conclusion
Recommendation: Maintain underweight
Markets surged after the re-election of President-elect Donald Trump in the United States on expectations that his pro-growth agenda will prompt strong earnings growth in the world’s largest economy. Yet his signature tariff and immigration policies remain potential headwinds to growth and threaten to burst the considerable optimism priced into current valuations. In some extreme cases irrational exuberance has returned to markets with the likes of MicroStrategy being added to the Nasdaq 100 after seeing its market value grow US$36b (71.8% price increase) in the December quarter alone on speculation of President Trump supporting cryptocurrencies In addition signs of inflation resilience could see expectations of easing interest rates be dashed in the US in particular. The risk of disappointing these expectations when US stocks account for over 75% of global market value warrants maintaining underweight positioning.
By Martin Fowler Partner, Pitcher Partners Sydney Wealth Management
p +61 2 8236 7776
e martin.fowler@pitcher-nsw.com.au
By Cameron Curko CIO, Pitcher Partners Sydney Wealth Management
p +61 2 9228 2415
e cameron.curko@pitcher.com.au


Jordan Kennedy Partner, Pitcher Partners
Sydney Wealth Management
p +61 2 9228 2423 e jordan.kennedy@pitcher.com.au

Andrew Wilson Principal, Pitcher Partners
Sydney Wealth Management
p +61 2 9228 2455
e a.wilson@pitcher.com.au

Authors
Martin Fowler Partner, Pitcher Partners Sydney Wealth Management
p +61 2 8236 7776
e martin.fowler@pitcher.com.au

Cameron Curko CIO, Pitcher Partners Sydney Wealth Management
p +61 2 9228 9173
e cameron.curko@pitcher.com.au