Economic and Market Outlook


pitcher.com.au
2023 Current as at 1 January 2023
January
1

1
Inflation has dominated economic discourse over the past twelve months but in key economies including the US, it now appears to be decelerating Global supply chains blockages are easing1 , firms are building inventory levels2 and many commodity prices such as oil have fallen from recent peak levels Stickier inflationary measures remain troublesome for policymakers, however, with wage growth and the labour market holding strong most notably in the US The emphasis across the board from policymakers is that inflation remains too high, and they need to act to keep inflation expectations from households and businesses in check. The fear is that a failure to do so could lead to workers demanding higher wages and businesses increased prices, embedding a higher level of inflation permanently. This motivated a further 1.25% in rate hikes for the December quarter by the US Federal Reserve (the Fed) while the ECB has taken its main refinancing rate from 0% in July to 2.5% in early December, a major shift in such a short period as we can see illustrated below.
Major central bank policy rate (Dec-21 to Dec-22)
Source: BloombergIn Ukraine, the war with Russia continues. In recent months, Ukrainian forces have mounted a successful offensive retaking sizeable tracts of land from Russian occupiers including the major city of Kherson. There remains a marked reluctance from Russia to negotiate an end to the conflict. Given Western support has remained intact we expect the war and its consequences to persist for some time. This includes elevated energy prices from the withdrawal of global supply.
The damage has been most directly observed in Europe with elevated electricity and heating costs threatening both household and business spending. The US by contrast has been supported by the use of its government-managed energy reserves to limit energy costs for households and businesses.
Concerted efforts to hike interest rates are beginning to appear in the economic data. The decline of retail sales growth (after stripping out price effects) has the Eurozone at recessionary levels and based on recent US data (nominal retail sales falling 0.6% in the month of November) the latter may not be far behind
‘Global Supply Chain Pressure Index’, New York Federal Reserve, https://www.newyorkfed.org/research/policy/gscpi#/interactive (accessed 1 January 2023).
2 ‘S&P Global Flash US Composite PMI’ , S&P Global, https://www.pmi.spglobal.com/Public/Home/PressRelease/2449edd6ab0a49b9bd0103ecc24a28b3, (accessed 1 January 2023).
2
Current as at 1 January 2023 Advisers at Pitcher Partners Sydney Wealth Management are authorised representatives of Pitcher Partners Sydney Wealth Management Pty Ltd, AFSL number 336950.
“The Recession the world had to have?”
Annual retail sales volume growth (Dec-17 to Nov-22)
Source: Bloomberg
Overall growth prospects continued to weaken during the quarter. Expectations for 2023 growth in particular see the US flirting with recession (0.4% growth vs 0.8% expected at the end of September) with Eurozone growth now expected to decline 0.1% (versus expected growth of 0.2% previously)3. Recession risks remain elevated in our view and growth forecasts may well be revised lower in the months ahead. Commentators love to focus on the labour market to judge the economy’s health. It is true it can be a useful barometer and a relatable one to the average person. However, it can be highly flawed in judging where the economy is next headed. This is because unemployment usually begins to rise materially after a recession has already begun. Indicators such as the Conference Board Leading Economic Index by contrast tend to flag spells of weakness before a recession begins. As we can see below this (the teal line) has been decelerating since last year, suggesting a material slowdown and possible US recession.
Source: Bloomberg
Even the bond market has soured on US prospects. The yield curve has inverted in recent months which historically has been a reliable leading indicator for US recessions. Inversion occurs when investors bet on weaker growth in the future and results in long-term bond yields falling below short-term yields. This year we have seen the US 10-year yield falling below the 2-year and even the 3-month rate (when the lines in the chart below fall into negative territory) suggesting high recession risk for the year ahead.
3 Current as at 1 January 2023 Advisers at Pitcher Partners Sydney Wealth Management are authorised representatives of Pitcher Partners Sydney Wealth Management Pty Ltd, AFSL number 336950.
China is in many ways the last hope for a positive global growth thesis in 2023. Until recently, China has been stifled by the government’s “Zero Covid” policy. While Chinese authorities had gradually begun to ease restrictions, a series of nationwide protests and public discontent accelerated the move leading to the policy’s rapid abandonment. This has led to some predictable consequences with a surge in cases and presumably deaths (although Chinese authorities offer limited information on this front), as well as rising worker absenteeism due to illness4. The latter impact is seizing up supply chains with businesses struggling to source labour consistently. This may trigger shortfalls of some products in export destination countries down the line and have an inflationary impact while also dragging on Chinese growth by lowering productivity.
The Chinese economy remains on an unsure footing with retail sales volumes lagging other economic indicators. There has been sizeable speculation about additional stimulus by the Chinese government although the exact policies remain unclear5. The Chinese experience to date has been far less supportive of consumer spending. It would be a stark surprise to see that change materially. We can instead envisage a scenario where China announces policies that stimulate business investment but do little to generate underlying growth due to weak consumer demand. Its overall impact will also be negatively affected by the slowdown we are seeing in global growth which would reduce demand for Chinese exports. One of the few areas that may benefit, depending on the scale of the stimulus, is resource demand (e.g. iron ore, copper), although we note these sectors have already rallied in anticipation, leading us to question just how much upside remains.
In summary, risks to global growth remain material, having worsened towards quarter-end Central bank mandates to tighten rates appear undaunted in both the US and Europe with consequent negative impacts on growth. Inflation is showing signs of decelerating but from extremely high levels compared to recent history and not yet enough to warrant central bank support. The risk of a global recession continues to climb in our view. China’s emergence from coronavirus restrictions may pose a material tail wind although it is not without its own travails. Overall, we have a negative outlook in the near term and continue to advise caution
4 ‘China races to install hospital beds as surge sparks concern abroad’ , Australian Financial Review, https://www.afr.com/world/asia/china-races-to-install-hospital-beds-as-surge-sparks-concern-abroad-20221220-p5c7vo, (accessed 1 January 2023).
5 ‘FT Live news updates from December 19’ , Financial Times, https://www.ft.com/content/d7e1d328-d24a-4cb4-97a1-68b78f3feb8c, (accessed 1 January 2023).
4
Current as at 1 January 2023 Advisers at Pitcher Partners Sydney Wealth Management are authorised representatives of Pitcher Partners Sydney Wealth Management Pty Ltd, AFSL number 336950.
Economic snapshot
Last reported result Date
2022e 2023e
Growth (GDP) 1.90% Sep-22 1.9% 0.3%
Inflation 7.10% Nov-22 8.0% 4.0%
Interest rates 4.37% Dec-22 4.5% 4.7%
Unemployment rate 3.70% Nov-22 3.7% 4.4%
Composite PMI 44.6 Dec-22
Economic snapshot
Last reported result Date
2022e 2023e
Growth (GDP) 2.30% Sep-22 3.2% -0.1%
Inflation 10.10% Nov-22 8.5% 6.1% Interest rates 2.00% Dec-22 2.5% 3.1%
Unemployment rate 6.50% Oct-22 6.7% 7.1%
Composite PMI 48.8 Dec-22
China
Economic snapshot
Last reported result Date
2022e 2023e
Growth (GDP) 3.90% Sep-22 3.0% 4.8%
Inflation 1.60% Nov-22 2.1% 2.3%
Interest rates 2.36% Dec-22 4.3% 4.3%
Unemployment rate 5.70% Nov-22 4.1% 4.0%
Composite PMI 47 Nov-22
Japan
Economic snapshot
Last reported result Date
2022e 2023e
Growth (GDP) 1.50% Sep-22 1.4% 1.2%
Inflation 3.80% Nov-22 2.4% 1.8% Interest rates -0.10% Dec-22 -0.1% 0.0%
Unemployment rate 2.57% Sep-22 2.6% 2.5%
Composite PMI 50 Dec-22
Source: Bloomberg
Current as at 1 January 2023 Advisers at Pitcher Partners Sydney Wealth Management are authorised representatives of Pitcher Partners Sydney Wealth Management Pty Ltd, AFSL number 336950.
By Cameron Curko, Head of Macroeconomics & Strategy | Pitcher Partners Sydney Wealth Management +61 2 9228 2415 cameron.curko@pitcher.com.au
Until recent months, the Australian economy has confounded persistent reports of an impending economic slowdown. A combination of pent-up demand from months of lockdowns, supply side shortages and elevated savings levels have contributed to historically low unemployment rates that have helped sustain moderate growth. It was thought that high household debt levels would increase the sensitivity to rising interest rates and rapidly curtail growth, although in reality, the impacts have been much slower.
First, the massive fiscal stimulus unleashed during lockdowns helped to provide a savings buffer that has taken time to unwind. Second, asset price growth helped strengthen household balance sheets. Third, the pandemic has made many re-evaluate lifestyle priorities (“life is short”), which has helped sustain strength in hospitality and travel. Fourth, the distribution of home loans is uneven. Around 30% of the population have home loans of which about 40% are locked into fixed rate mortgages to take advantage of the low-rate environment that existed over the last few years. This cohort has yet to feel the impact of rising rates but will progressively do so as these terms mature. It has been estimated that over $370 billion6 of fixed loans will roll off over the next 12 months, at which time many borrowers will face repayments at least 50% higher. Given that savings levels have progressively unwound, and this will only accelerate as fixed loans roll off, a material slowdown in economic activity for 2023 is now inevitable.
Household Savings Ratio7
Source: Bloomberg
This imminent slowdown view is validated by leading indicators including consumer sentiment, which remains near lows reached during the global financial crisis8 and in the NAB Monthly Business Survey, which saw business confidence turning negative for the first time since December 20219 as shown below NAB Monthly Business Survey – Confidence score (Nov-07 to Nov-22)
6 ‘
$370b worth of fixed rate mortgages to end in 2023 causing pain for Aussies’ , News.com.au, https://www.news.com.au/finance/economy/interest-rates/370b-worth-of-fixed-rate-mortgages-to-end-in-2023-causing-pain-foraussies/news-story/ade2d81e71c766c31dae2b19a4129364, (accessed 1 January 2023).
7 ‘Chart Part – Australian Household Sector, Reserve Bank of Australia’ , 7 December 2022, https://www.rba.gov.au/chartpack/household-sector.html, (accessed 1 January 2023).
8 ‘Consumer sentiment bounces off near record lows’ , Westpac-Melbourne Institute of Applied Economic and Social Research, 13 December 2022: https://www.westpac.com.au/content/dam/public/wbc/documents/pdf/aw/economicsresearch/er20221213BullConsumerSentiment.pdf, (accessed 1 January 2023).
9 ‘Monthly Business Survey: November 2022’ , NAB Group Economics, https://business.nab.com.au/monthly-business-survey-november2022-57437/, (accessed 1 January 2023).
6
Current as at 1 January 2023 Advisers at Pitcher Partners Sydney Wealth Management are authorised representatives of Pitcher Partners Sydney Wealth Management Pty Ltd, AFSL number 336950.
This comes at a challenging time as government coffers have been emptied by the generous handouts provided during COVID-19, leaving little room for further stimulus. Indeed, with gross government debt at over 37% 10of GDP and the budget in a structural deficit, the timing could hardly be worse. Interest payments alone on this debt are expected to exceed $18 billion10 this financial year. One of the most basic tenets of managing an economy is to save surplus tax revenues in the good years to provide a buffer for the additional expenses (unemployment benefits) in the bad years. But the good years have largely been squandered by successive governments focused on winning votes by introducing entirely laudable, but expensive social initiatives (e.g. aged care policies, NDIS, paid parental leave, etc) without long term funding solutions, and at the same time cutting taxes.
Australians face hard choices over the next decade as two of our major export earners, coal and natural gas, face intense headwinds as the world tries to limit further fossil fuel emissions. Coal exports this financial year alone are estimated to be worth around $120 billion11, while LNG exports are forecast to be in the order of $90 billion11. Given the increasing frequency of devastating natural disasters in recent years,12 it is not a matter of if, but when, these carbon intensive fuels are phased out. At that time the federal and state governments will face major revenue shortfalls that can only be plugged by either slashing expenditure or raising taxes. Australia currently has one of the highest standards of living in the world, and this will soon be under jeopardy if the government does not come up with a credible plan to address this looming shortfall.
We expect the Australian economy to slow materially in 2023 to well below trend as the potent combination of an ailing global economy, persistent inflation, higher interest rates and falling asset prices (shares and property) conspires to erode purchasing power and crimp consumption. Lower demand, coupled with excess inventories, will make conditions challenging for many businesses leading to a slowdown in production and profits. At that point labour hours will be cut back and some workers will begin to be laid off, resulting in a gradual rise in unemployment.
ASX 30 Day Interbank Cash Rate Futures Implied Yield Curve13
4.00%
3.80%
3.60%
3.40%
3.20%
3.00%
2.80%
2.60%
2.40%
2.20%
2.00%
Jan-23 Apr-23 Jul-23 Oct-23 Jan-24 Apr-24
Source:Bloomberg
Futures-impliedcashrateforecastasat20Dec2022 RBAcashrateasat20Dec22
On the positive side, inflationary pressures are likely to gradually ease as demand cools. We would expect the cash rate to peak at 3.8%13 by May, allowing the RBA to then pause until the end of the 2023 when rates are likely to start coming back down in the face of materially weaker growth
10 ‘Australian Government Debt’ , October 2022-23 Budget Review, Ohttps://www.aph.gov.au/About_Parliament/Parliamentary_departments/Parliamentary_Library/pubs/rp/BudgetReviewOctober202223/A ustralianGovernmentDebt, (accessed 1 January 2023).
11 ‘Australia’s resource and energy exports forecast to reach $450 billion’, Australian Government, Department of Industry, Science and Resources, https://www.industry.gov.au/news/australias-resource-and-energy-exports-forecast-reach-450-billion, (accessed 1 January 2023).
12 ‘Natural disasters and climate risk’ , Tessa Satherley and Dr Daniel May, https://www.aph.gov.au/About_Parliament/Parliamentary_departments/Parliamentary_Library/pubs/BriefingBook47p/NaturalDisastersCli mateRisk, (accessed 1 January 2023).
13 ‘ASX 30 Day Interbank Cash Rate Futures Implied Yield Curve as at market close’ , ASX, https://www.asx.com.au/data/trt/ib_expectation_curve_graph.pdf, (accessed 1 January 2023).
7
Current as at 1 January 2023 Advisers at Pitcher Partners Sydney Wealth Management are authorised representatives of Pitcher Partners Sydney Wealth Management Pty Ltd, AFSL number 336950.
Economic snapshot Last reported result Date
Growth (GDP) 5.90% Sep-22
Inflation 7.30% Sep-22
Interest rates 3.10% Dec-22
Unemployment rate 3.40% Nov-22 Composite PMI 47.3 Dec-22
Economic snapshot 2022e 2023e
Growth (GDP) 3.7% 1.8% Inflation 6.6% 5.1%
Interest rates 3.1% 3.6%
Unemployment rate 3.7% 4.0%
US Dollars per 1 Australian Dollar ($) 0.65 0.70
Source: Bloomberg
Current as at 1 January 2023 Advisers at Pitcher Partners Sydney Wealth Management are authorised representatives of Pitcher Partners Sydney Wealth Management Pty Ltd, AFSL number 336950.
By Martin Fowler, Partner | Pitcher Partners
Sydney Wealth Management Sydney Wealth Management +61 2 8236 7776 martin.fowler@pitcher.com.au
The S&P/ASX 200 Total Return Index returned 9.4% over the three months and -1.1% over the year to 31 December 2022
S&P/ASX 200 Accumulation Index cumulative return (Dec-21 to Dec-22)
-14%
Recommendation: Maintain underweight
Source: S&P, Bloomberg
Australian equities are facing a period of significant uncertainty and a weaker global economic backdrop. While valuations are not necessarily unattractive, we believe there is meaningful scope for earnings downgrades in the months ahead. Current valuations look attractive but in reality, this is more akin to a “calm before the storm” moment with further downgrades still to come in our view. We have already begun to see this with some businesses such as Domain Group downgrading off the back of a slowing property market.
The macro backdrop has worsened materially, especially globally. A weaker global economy and coronavirus challenges in China bodes poorly for resource demand and other cyclical sectors such as industrial businesses. Higher interest rates support bank revenues by raising margins on their loan books, but this can often be more than offset by higher bad debts and weaker credit growth. Consumer sentiment has also fallen sharply, which bodes poorly for the retail sector while business sentiment is also subdued, potentially weighing on investment spending.
In conclusion, risks remain elevated. The international commitment to further rate hikes increases the chance of a global recession with equities tending to fare poorly in that environment. Accordingly, we maintain our underweight recommendation on the Australian sharemarket.
Our outlook for some of the major sectors of the S&P/ASX 200 is as follows: Banks
Recommendation: Maintain underweight
Our outlook for the banking sector rests on four key areas:
1. How are net interest margins (the return earned on bank assets less the cost of funding these) trending?
2. What are the overall prospects for credit growth?
3. Our view on bank underwriting quality i.e. are they going to be writing off loans as bad debts?
4. The trend in bank operating efficiency
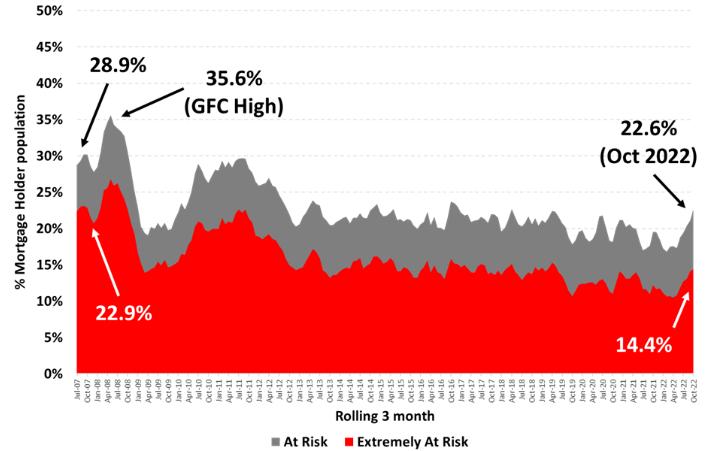
On the positive side of the ledger, bad debts are at extremely low levels with the RBA and major banks reiterating the strength of credit quality at present. This is beginning to shift with mortgage stress beginning to rise from very low levels according to recent Roy Morgan surveys as illustrated in the below chart
9
Current as at 1 January 2023 Advisers at Pitcher Partners Sydney Wealth Management are authorised representatives of Pitcher Partners Sydney Wealth Management Pty Ltd, AFSL number 336950.
The picture for bank operating efficiency matters more outside of turning points where rising credit risk is not a factor as it is today
Net interest margins are also trending higher in the wake of the RBA interest rate hikes. An important drag on margin expansion is the maturity of many fixed-rate loans which are still trending well above historic averages as a share of the market. As borrowers face a material shock in reverting from artificially low fixed rates to much higher rate options, we expect refinancing demand to remain elevated as they look for better deals This will curtail margins as banks compete to maintain market share. In their latest update for October the Australian Bureau of Statistics (ABS) noted that refinancing activity remains at record highs14
Lastly the economic backdrop is softening from admittedly high levels. Annual economic growth of 5.9% in the September quarter is likely to be the peak growth rate we see for some time. Consensus forecasts see economic growth slowing below trend (long term average ~2.7%) for the next two years, a rate consistent with weaker credit growth and also one where loan arrears may rise, reducing profits due to rising losses We believe the downside risks are currently outweighing potential upside factors and we retain an underweight position on the banking sector.
Resources
Recommendation: Maintain underweight
Iron ore prices have spiked dramatically in the December quarter (up 12.5% quarter-to-date) compared to flat performance in broader commodities with the Bloomberg Commodity Index only up 0.7% over the same period15 A key driver of iron ore’s relative outperformance was China exiting its restrictive “Zero Covid” policies with heightened expectation of renewed property and infrastructure investment driving iron ore demand.
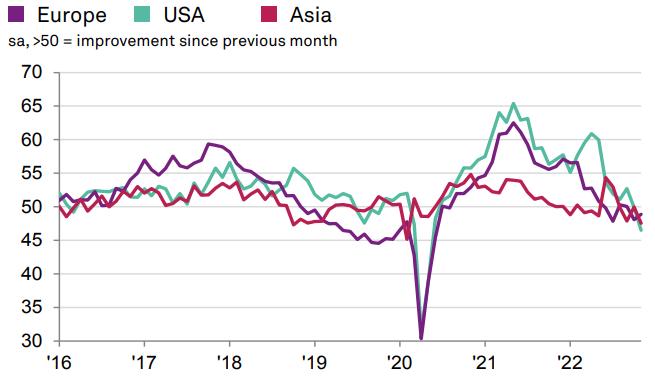
We believe this price speculation is potentially premature with weakness from countries outside China a more pressing concern for us. While China is a major source of commodity consumption it is difficult to have a materially positive view if demand from the rest of the world is contracting. To illustrate, the below chart captures activity by steel using businesses across major regions. Readings below 50, which is the case for all major regions, signal contraction. This will likely detract from resource demand suggesting that the bounce in mining stocks for the quarter may not last.
14 ‘Refinancing remained at record highs in October’ , Australian Bureau of Statistics (ABS), https://www.abs.gov.au/media-centre/mediareleases/refinancing-remained-record-highs-october, (accessed 1 January 2023).
15 Bloomberg, (accessed 1 January 2023).
10
Current as at 1 January 2023 Advisers at Pitcher Partners Sydney Wealth Management are authorised representatives of Pitcher Partners Sydney Wealth Management Pty Ltd, AFSL number 336950.
16
Source: S&P Global
Demand destruction due to rate hikes in the US and elsewhere as well as soaring energy prices in Europe remain an ongoing concern. We can see this depicted below in forecasts of global industrial production with growth over the year expected to be limited in both the US and Eurozone, a decidedly negative prospect for resource demand. The bounce back anticipated for China remains an inadequate offset in our view.
Industrial production – actual and forecast for major countries (2021 to 2024)
Source: Bloomberg
Taken together we believe the material headwinds to global growth will outweigh potential positives from a “China reopening” narrative and maintain our resource sector underweight. We do acknowledge that the sector is notoriously sensitive to China speculation which can trigger spurts of temporary outperformance before prices revert, the final chart is a reminder of this and how far the sector (in blue) can rise or fall relative to Chinese economic fundamentals (in black)
China annual economic growth versus annual growth return for the Resource sector (2007 to 2022)
16 S&P Global Steel Users PMI, S&P Global, 7 December 2022: https://www.pmi.spglobal.com/Public/Home/PressRelease/185545504df2482a83df6ae383f9852e, (accessed 1 January 2023).
11
Current as at 1 January 2023 Advisers at Pitcher Partners Sydney Wealth Management are authorised representatives of Pitcher Partners Sydney Wealth Management Pty Ltd, AFSL number 336950.
Source: Bloomberg
Spending has shifted firmly from goods to services with the former growing 9.4% for the year to October 2022 versus 34% growth for the latter over the same period. These growth rates are distorted by the impact of East Coast lockdowns last year which depressed services spending in particular Both types of consumption appear to have seen growth rates peak with a poorer outlook on the back of weak sentiment.
Annual household spending growth split by goods and services (Jan-20 to Oct-22)
AnnualHouseholdspendinggrowthbygoodsandservices(Jan-20toOct-22)
Consumer sentiment has fallen and a more refined measure of spending intentions (based on credit card data) has also softened markedly The CommBank HSI is correlated with real consumption spending (a measure that strips out price impacts to assess underlying demand). Current levels suggest a material softening during the December quarter. We have arguably begun to see this in two ways;
1. Underlying retail sales only grew 0.2% for the September quarter, a level last seen prior to the coronavirus pandemic when economic growth was subdued; and
2. October retail sales fell 0.2% from September levels
Annual growth in real household spending versus Spending Intentions Index (Sep-18 to Dec-22)
Source: Bloomberg
Lastly household savings were 6.9% for the September quarter, a level last seen prior to the pandemic when economic growth was below trend (long-term average for our economy). In addition, the majority of fixed rate
12
Current as at 1 January 2023 Advisers at Pitcher Partners Sydney Wealth Management are authorised representatives of Pitcher Partners Sydney Wealth Management Pty Ltd, AFSL number 336950.
mortgages taken out during the pandemic will expire in the next 18 months and will act as a drain on household spending.
Overall, we believe meaningful drags on consumer spending are beginning to emerge. This will bode poorly for the retail sector after recent years of above-average profits (boosted by government stimulus programs) with a return to pre-pandemic profitability likely to be accompanied by further share price weakness.
Australian Real Estate Investment Trusts (AREITs)
The AREIT universe outperformed the broader market in the December quarter. Part of this was a rally in response to falling long-term bond yields. AREITs are often treated as bond substitutes due to their high distribution yields. As such, when bond yields fall, we typically see strength in AREIT prices as they become a more attractive alternative and attract investor interest. A-REIT valuations remain below peak levels with most trading at material discounts to their reported book value (property and other asset values minus liabilities such as debt).
This view presumes that the valuations underpinning the book value are reasonable. We think that there is room for doubt with capitalisation (or “cap”) rates still trading at record lows for some sectors, particularly industrial property as shown below
Property capitalisation rates by sector (Oct-12 to Oct-22)
Source: Bloomberg
The above cap rates still fail to capture the lift in market interest rates since the pandemic began with the 10year bond yield rising over 3% from its recent lows in February 2020 This increase in market interest rates means higher financing costs, reducing profits and ultimately distributions. In addition, commercial real estate does not trade in a vacuum. Higher rates have already impacted bond prices, prompting the biggest correction in decades. They have also started to negatively affect residential property prices and a similar effect is anticipated for the commercial property market in our view.
A-REITs enjoyed a bounce in performance since the end of September, but we see this as unlikely to persist in the near-term given the above factors Accordingly, we downgrade our view from neutral to underweight the sector.
By Cameron Curko, Head of Macroeconomics & Strategy | Pitcher Partners
Sydney Wealth Management +61 2 9228 2415 cameron.curko@pitcher.com.au
13
Current as at 1 January 2023 Advisers at Pitcher Partners Sydney Wealth Management are authorised representatives of Pitcher Partners Sydney Wealth Management Pty Ltd, AFSL number 336950.
The MSCI World (excluding Australia) Net Total Return Index (AUD) returned 4.0% over the past three months and -12.5% over the year to 31 December 2022.
MSCI World excluding Australia Net Total Return Index (Dec-21 to Dec-22)
Source: MSCI, Bloomberg
The outlook for international equities remains clouded.
On the positive side of the ledger, valuations are more favourable, particularly outside the US with major markets trading at discounts of over 10% to their long-term average price-earnings multiple. Normally such discounts provide attractive opportunities to accumulate equities.
However, there are several counterarguments that give us pause. First, central banks have shown surprising commitment to combat inflation relative to past hiking cycles. This suggests that rate hikes may continue over the near term until we start to see even larger declines in the annual inflation rate. US inflation has begun decelerating from a recent peak of 9.1% annual growth in July to 7.1% in November. This is well-above the average growth rate prior to the coronavirus pandemic. If the Fed is to be treated credibly there are still more rate hikes in store with a Fed-projected cash rate of 5.1% to 5.4% for 2023 in the US (versus a current range of 4.25% to 4.5%) before declining in 2024. By contrast current market pricing17 is only suggesting a peak rate of only 4.85% suggesting growing scepticism by investors.
When interest rates are rising this raises the relative value of holding cash versus other assets. It typically drives prices of risk assets lower as investors divert capital to safer options such as cash Given that backdrop we think there is meaningful risk of further price falls in the near term.
We also harbour concerns that the outlook for slowing economic growth is not adequately reflected in earnings forecasts The US is still predicted to grow profits approximately 7.5% per annum over the next three years (including 2022). This remains difficult to reconcile with an expected decline in economic growth which typically sees profits fall. If earnings disappoint further, as would seem likely over coming quarters, then the risk of further market weakness in the short term is high
Lastly the geopolitical environment has been incredibly testing this past year. Uncertainty abounds with the ongoing conflict in Ukraine and volatility in energy prices amongst others.
On balance we believe the case for being underweight global equities continues to be justified with meaningful risk of downgrades to future earnings growth and further derating on the back of rising interest rates. Accordingly, we maintain our underweight position in global equities. 17 ‘30 Day Federal Funds Futures – Quotes’ , CME Group, https://www.cmegroup.com/markets/interest-rates/stirs/30-day-federalfund.quotes.html, (accessed 1 January 2023).
14
Current as at 1 January 2023 Advisers at Pitcher Partners Sydney Wealth Management are authorised representatives of Pitcher Partners Sydney Wealth Management Pty Ltd, AFSL number 336950.
In the United States, operating earnings for S&P 500 companies are currently expected to rise by 6.2% in 2022, 6.8% in 2023 and 9.5% in 2024. Assuming conventional long-term multiples, we estimate that the United States sharemarket (as measured by the S&P500) is overvalued by 8.8% in the near-term and undervalued by almost 7% in the medium-term.
2022 calendar year forecast EPS earnings estimates (US$)
S&P 500 fair value estimate
Upside/(downside)
S&P 500 = 3852.4
Consensus 219.5 3512.5 -8.8%
If 10% below 197.6 3161.2 -17.9%
If 10% above 241.5 3863.7 +0.3%
2023 calendar year forecast
EPS earnings estimates (US$)
S&P 500 fair value estimate
Upside/(downside)
S&P 500 = 3852.4
Consensus 234.3 3749.4 -2.7%
If 10% below 210.9 3374.5 -12.4%
If 10% above 257.8 4124.4 +7.1%
2024 calendar year forecast
EPS earnings estimates (US$)
S&P 500 fair value estimate
Upside/(downside)
S&P 500 = 3852.4
Consensus 256.7 4107.0 +6.6%
If 10% below 231.0 3696.3 -4.1%
If 10% above 282.4 4517.7 +17.3%
Source: Bloomberg consensus estimates for 2022, 2023 and 2024 as of 20 December 2022.
Over the quarter we saw a rerating of share prices even as earnings expectations declined. Two factors have been key. First, the deceleration of US inflation and poor macroeconomic data has seen a return to the “bad news is good news” narrative whereby investors are anticipating the Fed to halt or even cut rates sooner than previously anticipated to offset weaker economic growth. Second, the conclusion of China’s “Zero Covid” policy saw a pickup in optimism for emerging markets and resources stocks in anticipation of supportive economic policies and stronger Chinese resource demand consequently.
12-month Forward Price-Earnings Ratios for major markets (Dec-05 to Dec-22)
Source: Bloomberg; Data as at 20 December 2022
Consistent with the above, forward Price-to-Earnings (P/E) multiples for markets around the world are below longer-term averages as follows:
Region Forward PE 15-year Average Forward PE Potential upside/downside
All Country World (ex-US) 12.0x 13.9x +16.0% Australia 14.0x 15.4x +10.4% Europe 12.0x 14.0x +16.6%
Emerging markets 11.5x 12.5x +8.5% Japan 12.5x 17.1x +37.0%
UK 9.5x 13.0x +37.5% China 12.0x 12.2x +1.7%
Source: Bloomberg.
Recommendation: Maintain underweight.
In spite of more attractive valuations, we expect consensus earnings expectations remain overly optimistic and are likely to fall as global growth slows materially given challenges posed by inflation, rising interest rates and coronavirus cases in China. For these reasons we remain underweight.
By Cameron Curko, Head of Macroeconomics & Strategy | Pitcher Partners Sydney Wealth Management +61 2 9228 2415 cameron.curko@pitcher.com.au
Copyright © 2023. Any advice included in this newsletter is general only and has been prepared without taking into account your objectives, financial situations or needs. Before acting on the advice you should consider whether it’s appropriate to you, in light of your objectives, financial situation or needs. You should also obtain a copy of and consider the Product Disclosure Statement for any financial product mentioned before making any decisions. Past performance is not a reliable indicator of future performance. Advisers at Pitcher Partners Sydney Wealth Management are authorised representatives of Pitcher Partners Sydney Wealth Management Pty Ltd, AFSL number 336950