
Dealer comparison Pitcher Partners Motor Industry Services September 2023
Australian Listed

This is the second iteration of the Pitcher Partners Motor Industry Services –Australian Listed Dealer Comparison. We will gain some insight into the three listed motor dealer groups and explore how the operating environment and improved supply chain issues affected them in the 12 months ended 30 June 2023.
The listed groups Eagers Automotive (ASX:APE), Autosport’s Group (ASX:ASG) and Peter Warren Automotive Holdings (ASX:PWR) are all benefitting from the easing supply chain, with stock returning resulting in increased volumes and revenue. However increasing macro-economic-pressures, rising inflation and interest rates have squeezed the group’s net income margins.
New Vehicle sales in the six months to June 2023 were 7.8% higher in comparison to June 2022 per VFacts (excluding heavy commercial vehicles) for the Australian market. This is an increase of 40,548 vehicles year on year. It is evident that the gap between pre and post COVID volume levels is closing, in fact, June 2023 new vehicles sales volumes YTD were 4.6% higher than 2019 (pre-COVID) levels. Pitcher Partners are forecasting the new vehicles market to turn over close to 1.2m units this year (the highest ever).
The increased new car volumes available in the market and strong acquisitions made throughout the period have proven to be a key growth factor for all the listed groups who have all achieved double-digit revenue growth since June 2022.

However, interest rates have been on the rise to curb rising inflation, and the rates are expected to rise even further in the coming year. We have seen all public dealer groups experience increases in their finance costs. Rising inflation and interest rates also effect the consumer, making decisions to reduce discretionary spending which will negatively affect the demand for new cars going forward.
Improvement in the supply chain, with high order banks should result in continued growth of the topline, however, will this be enough to combat increasing inflation, the prevailing macroeconomic environment and interest rates? Dealerships will need to focus on cost management over the coming period, to protect and translate their top line revenue gains to profitability.

58.3
Australian new motor vehicle sales have increased by 7.8% for the first six months of 2023 to 560,206 units when compared to the comparable period in June 2022. This is an increase of 40,548 units. The groups are seeing improvement in new vehicle supply in this 2023 period however issues remain with shipping & port delays, semi-conductor shortages and labour shortages all contributing to the supply chain issues. Despite this, volumes are still 4.6% higher than 2019 (pre-COVID) showing that supply has recovered significantly since the effects of COVID.
Volumes are still expected to increase throughout the rest of the 2023 period, with Pitcher Partners forecasting 2023 volumes hit 1.2m units. Additionally, due to the vehicle shortage’s experienced through COVID-19, there is visible a gap between the supply and demand which needs to be filled over the next few years. We have calculated that If supply outstripped demand by 10% (conservative approach) from now on, it would take until the first quarter of calendar year 2028 for the lost units to be made up.
Dealerships see this excess demand as an opportunity, with Eagers Automotive Groups citing this in their half year report as an opportunity for them to take advantage, despite the new vehicle supply constraints.

When considering the same 6-month period last year, it is evident that units are now being supplied to lower margin customers with Business (+13.3%), Rental (+6.6%) and Government (+4.8%). Interestingly, Retail is only up 2.1% as these customers were the focus when supply was down, and margining was high.
Order banks are still being reported at record breaking levels in all three groups, a tell-tale sign for the demand in the market. However, with macroeconomic issues looming, interest rates increasing and a cost-of-living crisis biting , further analysis of the makeup of these order banks (Government, Fleet, Rental & Retail) should be considered and will consumers start pulling orders?
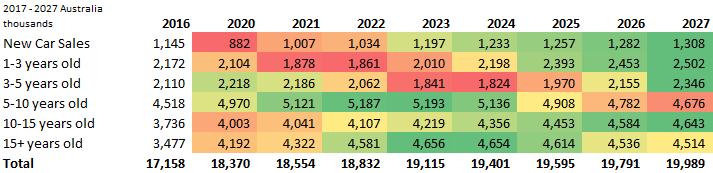
Number of cars in the parc by age cohort, with 2023 to 2027 forecasts2023 results and 2023/24 outlook (continued)
Electric vehicle offerings remain one of the key strategies dealerships are focusing on, each wanting to capitalise on the growth of this market.
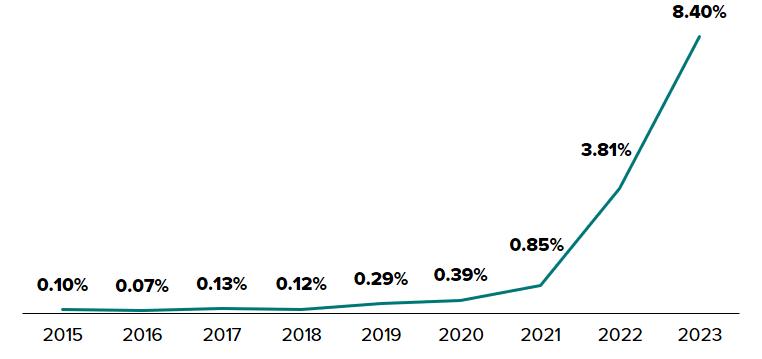
Demand for EVs has taken the world by storm and we have already seen a shift in the Australian sales trends with 8.4% (Including PHEV) of total passenger and light commercial vehicle sales to June 23 consisting of electric vehicles, compared to 2.4% for same 6-month period to June 2022 (excluding all heavy - commercial vehicles).
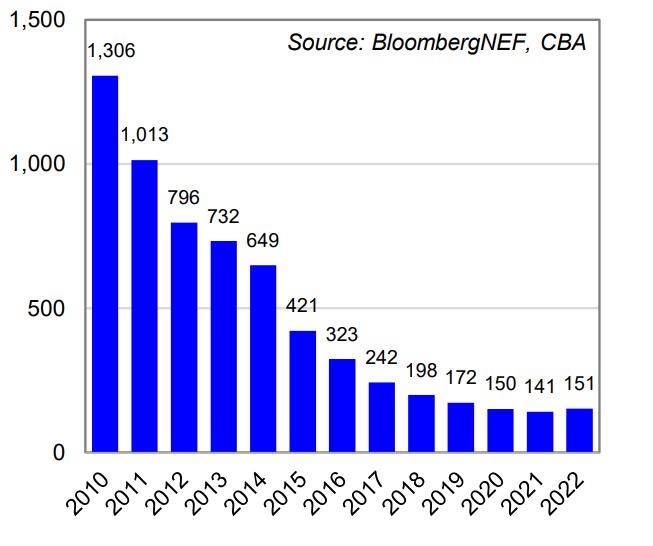
EV’s are still more expensive than their ICE counterparts, however the gap between ICE and EV’s pricing is tightening. The cost associated with batteries has been on a downward trend since 2010 mostly due to economies of scale and technology improvements, making EV’s cheaper for manufacturers to produce.
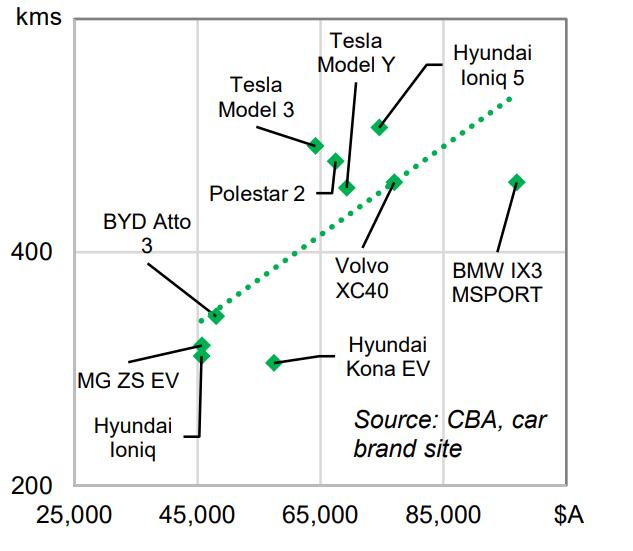
Interestingly, in Australia, there is still a larger demand for SUV EV’s with larger batteries rather than lower priced EV with smaller batteries, which travel shorter distances. The larger SUV’s come at a premium and are more expensive than similar ICE models. SUV EV’s made up 68% of all EV vehicles sold in 2023, with 9.8% of all SUV sales in 2023 (2.1% in June 2022) made up of EV vehicles. Australian’s clearly have a preference for larger cars, as larger cars result in bigger batteries, and therefore vehicles can travel larger distances without the need to be charged. Government infrastructure may change this over time, as the more frequent charging stations are, the less need there is for larger batteries.
With this higher demand for SUV EV’s in Australia, the prices of the most popular EV’s are higher than the prices of similar model ICE vehicles. Regardless, this has not stopped OEM’s importing cheaper EV models.
Government incentives have also been introduced across all Australian states in the form of discounts, rebates, stamp-duty exemptions and more. However, these incentives are mismatched across all states with differences arising at state and federal levels throughout.
EV’s market share has grown 343% when compared to the same 6-month period to June 2022 (2.45% to 8.40%), the markets preference for larger more expensive SUV EV’s, more government incentives available to the consumer, it is no wonder why dealerships are already capitalising on this growing market.
Top 10 EV models
Source: PP Analysis, VFACTS
It is worth noting that EV’s make up 29% of new car sales in China and 21% in the EU meaning there is still plenty of room for growth over the coming years. It will be interesting to see how dealerships take advantage and capitalise on this growth in the coming years.
Already, we see the listed dealership groups have emphasised a focus on EV’s as a key strategy to capitalise revenue in this growing market. Peter Warren plans to increase their new energy vehicle range by 90%, adding 43 new models to the existing model lineup.
Eagers Automotive is currently the largest franchise operator in Australia for EV’s with a 14.3% market share in EV sales in H1 23, with this set to continue. In the first half of 2023 they acquired an additional 31% interest in EV Dealer Group Pty Ltd, the national retail joint venture for electric and new energy vehicle manufacturer BYD. This brings it total ownership of the company to 80%.
Autosports Group, which has a luxury focus, anticipates growth in the EV sector as luxury car manufacturers offer a larger range of electric vehicles. They position themselves as leaders in the luxury EV space due to the high barriers of entry.
Percentage of Passenger / SUV / Light Commercials that are EV's
Source: VFACTS Includes PHEV Vehicles & Excludes Heavy Commercial Vehicles

The key macroeconomic headwinds dealer groups will face in the next 12 months include:
CBA reported an RBA call increase of 25bp increasing the current cash rate to 4.35%. However there have been no further increases since 7 June 2023. The high interest rates put downward pressure on discretionary spending and therefore demand for new vehicles.
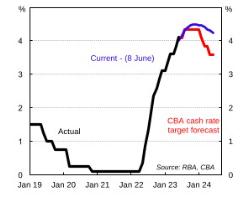
Source: CBA Economic Insights Global economic and markets research (9 June 2023)
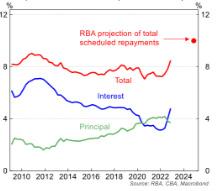
CBA reports a lagged impact to mortgage holders, as rates continue to rise, household consumption will be impacted negatively. Income growth is reported to lift to 3.9% in Q3 23, however this will not be enough to offset the drag on the consumer from rising mortgage repayments. This will negatively affect the purchasing power of the consumer, and many will likely be holding off or unable to afford purchasing a new vehicle.
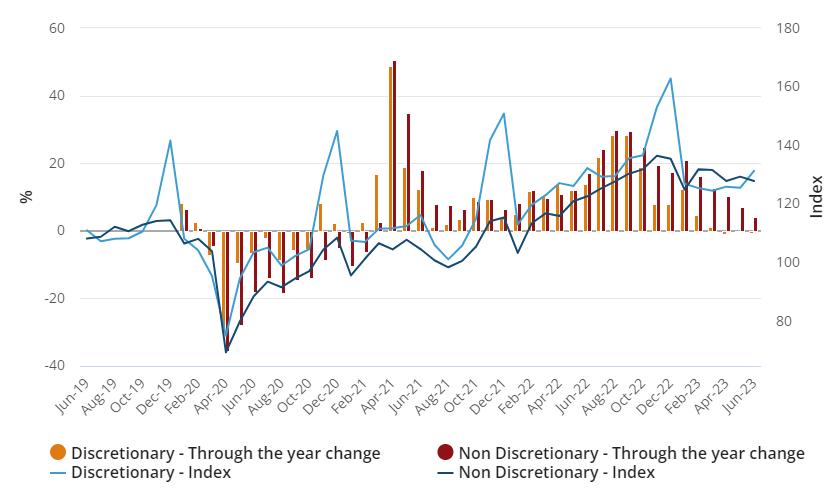
The Australian Bureau of Statistics has reported that non-discretionary spending has rose by 4.2% while discretionary spending has decreased by 0.7% due to inflation. This continued the pressures of the cost of living on consumers and drives down discretionary spend, which may result in consumers delaying the purchase of new vehicles or halt the purchase completely.
Household discretionary and non-discretionary spending, current price, calendar adjusted
Source: ABS
Dealerships may however look to push more used cars throughout the period. CBA is also expecting rate relief to arrive as early as 2024, which should free up cash for mortgage holders and increase discretionary spending.
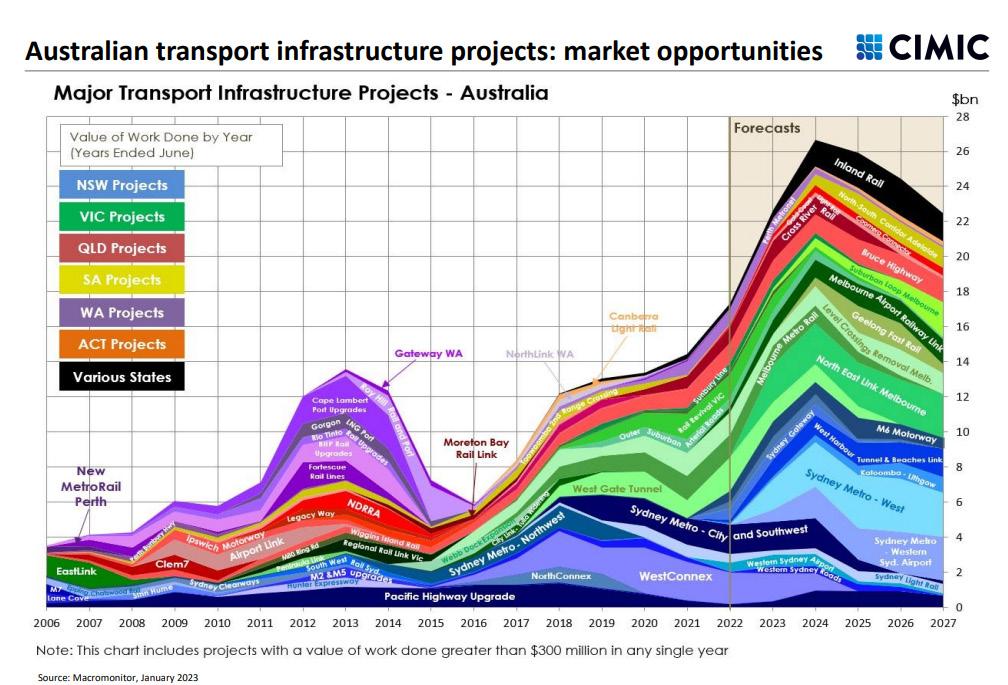
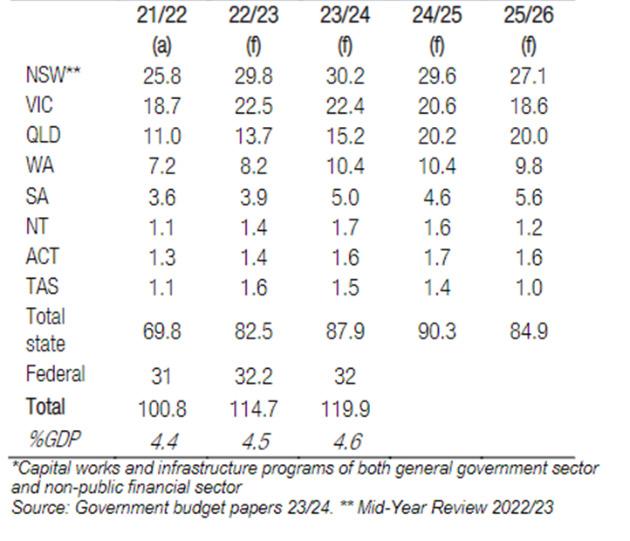
Infrastructure
Federal and State Governments are still committed to large Infrastructure spending. This spending is an insight into the economy and provide a baseline of activity.
The Australian Government has committed to a 90-day independent study into the current General Infrastructure Investment Program which may result in a reallocation of spending. The government have in their most recent budget in May 2023, committed an additional $200m over a 2-year period into land transport projects and a further $84m into net zero authority which aims to reduce emissions across the economy, including infrastructure. These additional funds highlight that these are still key areas in government decisions. Dealerships may be able to negate some of the damage they may experience in decreased consumer spending with fleet and rental customers.
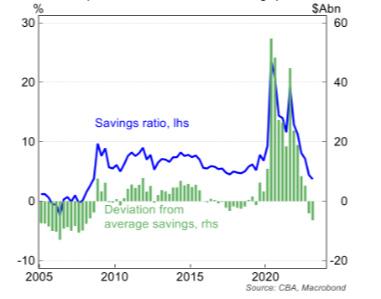
Savings
Whilst savings during COVID 19 increased, CBA do not expect a release of these savings back into the economy any time soon. Saving rates fell below average to 3.7% in Q1 23 and is expected to fall to 2.5% in H2 23. It is unlikely consumers will use any saving they have to purchase any new vehicles, but rather will use their savings to weather any potential economic hardships ahead.
In millions of AUD, except per share items. Source: S&P Capital IQ Pro.
Basis of this presentation: This report is compiled from the public financial statements available on the ASX (Australian Stock Exchange) and obtained from Capital IQ from the following Australian Listed Entities.
A P Eagers Ltd (APE) – APE has a different financial year end to the other listed dealer groups, therefore FY June 2023 was compiled utilizing HY June 2023 accounts adding [FY December 2022 less HY June 2022 accounts] for the P&L and HY June 2023 accounts for the Balance Sheet and notes to the financial statements
Autosports Group (ASG) – FY June 2023 P&L and Balance Sheet and notes to the financial statements
Peter Warren Automotive Holdings (PWR) - FY June 2023 P&L and Balance Sheet and notes to the financial statements
1. Revenue has increased across the board, with dealerships having increased supply and market demand increasing overall in 2023.

2. Parts and Services departments gross margins have improved across all groups over the period.
3. Order banks have continued to grow in all three groups.
4. Strong growth from acquisitions for all three groups.
5. Gross margins remain relatively the same for APE, with a slight increase for ASG, both citing cost management controls and technology as main drivers of this.
1. PWR showed a 0.8% decrease in gross margin and cited commercial effects of agency model, lower used car margins and increased mix revenue from new and used sales for this decrease.
2. Net Income margin has remained the same or decreased across all three groups.
3. The reserve bank has increased interest rates in order to curb inflation resulting in the interest/EBIT (interest cover) ratio to decrease across all groups.
4. Generally, we have seen revenue and repair orders through put volumes reduce in service departments for the industry
5. This will continue until the new vehicles sold in 2022/2023 return to the service departments.
The groups are utilising their strong balance sheet position and large cash pools to take advantage of prevailing market conditions and acquire more businesses. Many of the groups this year have given up some of their leases and purchased property to build their property portfolios.
140+ partners
1,300+ people
6 independent member firms
Pitcher Partners has the resources and depth of expertise of a major firm, but with a boutique firm feel. We give our clients the highest level of personal service and attention. That’s the difference.
Pitcher Partners is an association of accounting and business advisory firms located in Adelaide, Brisbane, Melbourne, Newcastle, Perth and Sydney. We have a strong reputation for providing personal service and quality commercial advice to our clients across a broad range of industries.
We specialise in working with middle market businesses in Australia, including privately owned, foreign controlled, government owned and not-for-profits. Our clients require high technical standards, matched with a personal understanding and involvement in their affairs.
Each Pitcher Partners firm is also an independent member of Baker Tilly International, one of the world’s leading networks of independently owned and managed accountancy and business advisory firms. Our strong relationship with other Baker Tilly International member firms has allowed us to open many doors across borders for our clients.
Financial essentials
Accounting and business advisory services
Audit, risk management and assurance
Internal audit
Recovery, turnarounds and insolvency
Tax advice and compliance
Planning and growth
Business consulting and commercial advice
Business performance improvement
Business structuring
Corporate finance
Corporate governance
Digital and data services
International business advisory
Investment advisory services
Succession planning
Superannuation services
Tax advisory
Valuations
Private wealth services
Estate planning
Family Office Management
Investment advisory services
Philanthropy services
Succession planning
Superannuation strategies
Tax advice and compliance
Insurance
Not-for-Profit
Education
Motor
Industry specialisations
Property and construction
Fintech
Technology
Renewables
Hospitality, food and beverage
Health and aged care
Manufacturing and retail
Government and the public sector
Professional and financial services
Agriculture
Baker Tilly International is one of the world’s leading networks of independently owned and managed accountancy and business advisory firms united by a commitment to provide exceptional client service.
Every day, 41,000+ people in 145 territories share experiences and expertise to help privately held businesses and public interest entities meet challenges and proactively respond to opportunities. International capability and global consistency of service are central to the way we work.
Baker Tilly International global results as at December 2022
41,000+
3,200+ 700+ People Partners Offices
$4.7bn
145 23.5% 2022 worldwide revenue (USD) Territories Female partners
Experts across a wide range of industry and business sectors, each Baker Tilly International member firm combines high quality services and in-depth local knowledge. Sharing knowledge and resources, our business approach brings together the power of the global network to deliver exceptional results to clients globally.
Pitcher Partners
Pitcher Partners is an independent member of Baker Tilly International. Pitcher Partners’ strong relationship with other Baker Tilly International member firms, particularly in Asia Pacific, provides clients with access to international networks, opportunities and expertise to expand globally.
Steven Bragg Partner | Motor Industry Services


m. +61 437 445 200
e. steven.bragg@pitcher.com.au
Martin Booth Partner | Business Advisory and Tax Services


p. +61 2 8236 7887
e. martin.booth@pitcher.com.au
Wayne Pearson Consultant | Motor Industry Services
m. +61 417 226 934
e. wayne.pearson@pitcher.com.au
Scott Hardie Consultant | Motor Industry Services


m. +61 412 285 491
e. scott.hardie@pitcher.com.au
Paul Kennedy
Senior Accountant
m. +61 474 277 680
e. paul.kennedy@pitcher.com.au
Michele Leali Accountant | Business Advisory and Assurance

m. +61 481 387 347
e. michele.leali@pitcher.com.au
Susan Aboulhosn Personal Assistant | Business Advisory and Assurance
p. +61 2 9228 2446
e. susan.aboulhosn@pitcher.com.au
John Gavljak
Partner | Business Advisory and Assurance
m. +61 499 773 881
e. john.gavljak@pitcher.com.au
John Brockhouse Consultant | Motor Industry Services
m. +61 455 755 954
e. john.brockhouse@pitcher.com.au
Aidan Cousin
Senior Manager | Motor Industry Services
m. +61 433 444 338
e. aidan.cousin@pitcher.com.au

Conor Mcellistrim


Supervisor | Business Advisory and Tax Services
m. +61 432 067 880
e. conor.mcellistrim@pitcher.com.au
Cameron Cromme
Senior Accountant | Business Advisory and Assurance
m. +61 416 962 600
e. cameron.cromme@pitcher.com.au
Morgan Irwin
Senior Accountant | Business Advisory and Assurance
m. +61 407 064 850
e. morgan.irwin@pitcher.com.au