
Executive summary June 2025 results
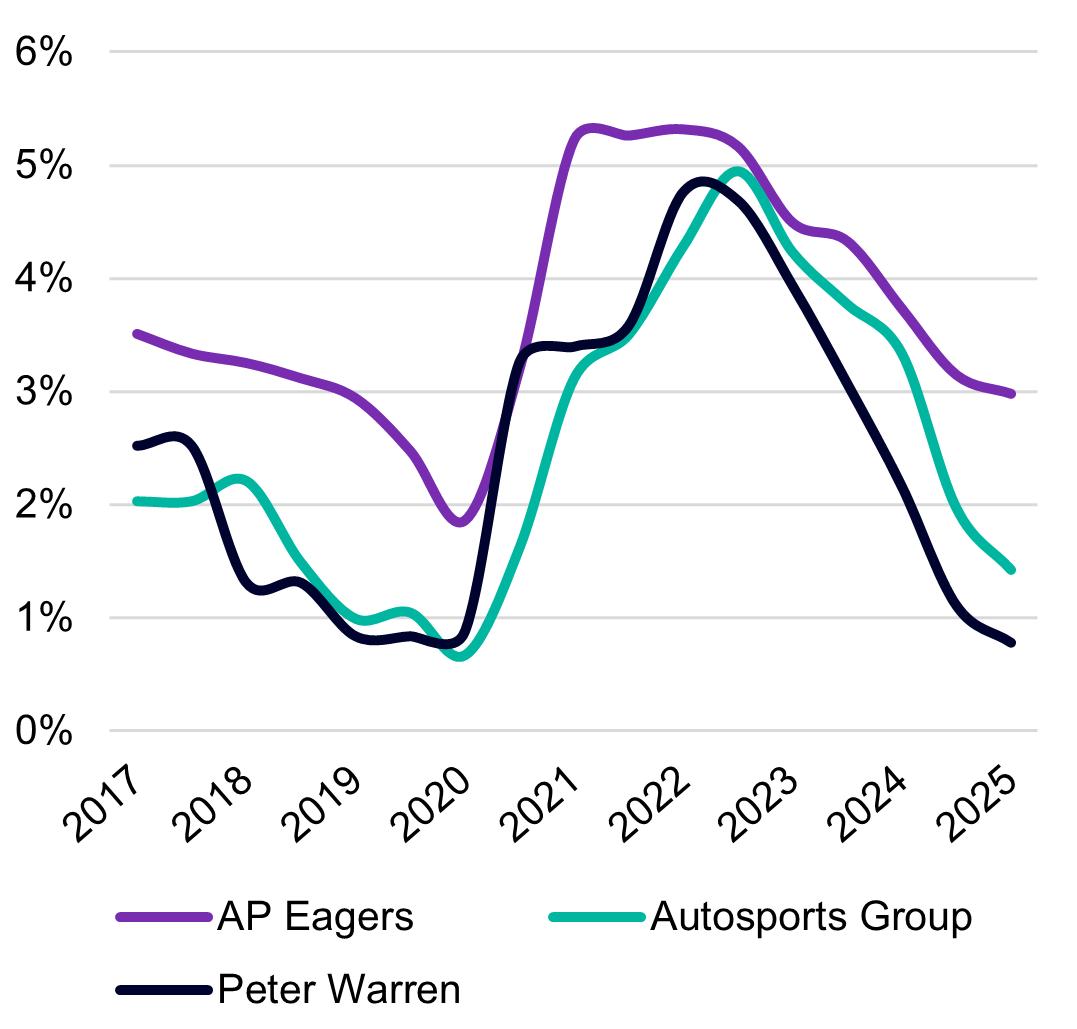
The listed dealership groups: Eagers Automotive (ASX: APE), Autosports Group (ASX: ASG), and Peter Warren Automotive Holdings (ASX: PWR) all saw revenue growth in FY25, up 16.4%, 8.2%, and 0.3% respectively. Average inventory days continued to lengthen, however average new car inventory days decreased across the groups, suggesting an increase in used car and parts inventory. Average inventory days’ supply increased across the board, rising from 63.1 to 70.2 days for APE, 74.1 to 79.0 days for ASG, and 74.6 to 82.2 days for PWR. While revenue growth was experienced across the board, Net Profit Before Tax (“NPBT ”) as a percentage of revenue continued to slide across all groups. APE generated 2.8% (down YOY from 3.7%), ASG recording 1.4% (down YOY from 3.3%), and PWR at 0.8% (down YOY from 2.2%). With inventory turnover slowing further and finance costs remaining elevated despite recent rate cuts, the burden of carrying stock is expected to remain a significant profitability headwind throughout FY26.
FY25 marked a softer year for Australia’s new vehicle market, with total deliveries easing to 1.11 million units for the 12 months to June 2025. This was a 5.9% decline on the pcp, according to VFacts. The year began on a subdued note, with the March quarter posting the sharpest year‑on‑year falls as higher borrowing costs and cautious consumer sentiment weighed on demand. Momentum improved modestly in the June quarter, aided by stronger SUV and EV uptake, but volumes remained below FY24 peaks. While the prestige and electric segments recorded double‑digit growth, mainstream passenger and light commercial sales softened, reflecting a market in transition from post‑pandemic highs to more sustainable, demand‑driven conditions.
The RBA’s cash rate currently sits at 3.60% following its August 2025 cut, the third reduction of 25 bps this year. While earlier in 2025 markets had priced in a steady path lower, stronger than expected GDP growth and a rebound in household spending have tempered expectations of rapid further easing. The RBA has signalled that additional cuts will be dependent on data, and a sustained lift in consumer demand could delay or limit further reductions. The RBA held rates steady at its November meeting, with the potential of cuts now coming later in the later part of the first quarter of 2026, only if inflation can track within the 2 3% targeted by the RBA.
All of this is before any impacts of the current trade and tariff ‘wars’ taking place since the inauguration of President Trump in the USA. Despite the market headwinds, Pitcher Partners maintains its forecast of new vehicle sales of 1.2+ million units in CY25 (after a subdued start), reflecting a decline from 2024 levels as demand normalises following the pandemic era new vehicle sales volume highs. We believe new vehicle sales will continue to set annual records due to population growth alone and driven higher due to intense competition from new entrant brands (primarily the Chinese brands jockeying for market share). Year to date volumes of 624,130 (down slightly from 633,097 last year) keeps the market ahead of Pitcher Partners full year forecast of 1.2m units. Barring an economic shock, we believe the market will continue to grow riding population growth tailwinds.
Results snapshot
Listed Dealer Groups consolidated performance vs PCP
12.5%↑
Revenue increased to $17.6bn across all listed entities. This was driven by acquisitions and sales performances despite economic headwinds, being offset by population growth.
74.6
Cash conversion increased by 6.4 days driven mainly by increased inventory days.
2.3%
NPBT as a % of total revenue decreased by 1.1% YOY on average as revenue growth outpaced gross margin due to margin compression driven by market competition from new brand entrants.
19.4%
77.1 days
Inventory days increased by 9.1% YOY as a result of continued general stock increases despite the focus on reducing new vehicle stock.
2.0x
Interest coverage decreased from 2.9x on the back of increased floorplan costs and declining profitability.
Listed results summary
The good
Revenue growth
Despite sustained challenges resulting from economic headwinds, all three listed dealer groups (PWR, APE, and ASG) reported revenue growth. As a combined group revenue increased $1.95B AUD YOY, moving from $15.62B to $17.58B AUD, or up 12.5%. The revenue growth was driven by acquisitions combined with sales volume tailwinds from population growth. Australia’s population has grown by ~1.6m people in the last three years alone. The long term average ratio of new car sales to population is 4.5%, meaning 45 people per thousand buy a new car every year. With the population in 2025 trending to 27.8m, we can expect 1.25m new vehicles sold excluding any market or economic forces.
Managing the increasing cost base
Pitcher Partners have been reiterating the importance of cost base management since the industry became distracted by the higher than average Covid 19 margins.
Dealerships throughout Australia didn’t prioritise minimising cost base due to the substantial amount of profit being generated, however as this well continues to dry up, dealers have been forced to act. While there is still work to be done it is a significant step in the right direction.
The listed groups have placed a priority on reducing operating costs through efficiency and reductions in headcount while remaining focused on reducing occupancy costs.
• AP Eagers
– OPEX as a % of sales declined to 12.68% from 13.13% in 2024.
– Operationally, achieved $1.48m of revenue per employee (up from $1.36m FY24, $0.91m FY19)
• Autosports Group
– Entered into a new debt facility saving $1.7m interest vs the previous corresponding period
• Peter Warren
– Headcount down 4% YOY
– Half on Half costs reduced 3.3%, or $4.9m of savings per management commentary at investors presentation
Focus on new inventory management
All three groups have reduced new inventory days’ supply, as follows:
• AP Eagers 58 days 1H25 vs 64 days 1H24,
• Autosports 94 days FY25 vs 96 days FY24, and
• Peter Warren 59 days FY25 vs 61 days FY24.
There was clear messaging within each of the investor presentations of the three listed groups, new inventory levels cannot be maintained at this level going forward. The listed groups are focused on maintaining momentum in reducing inventory.
The not so good
Gross profit compression — a return to the mean
With competition intensifying due to the introduction new entrants, discounting has returned to pre‑pandemic norms. OEM incentives, dealer rebates, and sharper retail pricing are squeezing front‑end gross margins, particularly in mainstream passenger and light commercial segments. The pressure is compounded by rising operating costs, making the shift toward higher‑margin revenue streams such as Finance & Insurance, aftermarket, and fixed operations more important than ever.
Inventory management challenges continue
While new vehicle inventory days eased slightly as supply chains normalised, overall stock levels swelled. Average total inventory days’ supply across the listed groups reached 79.5 days in FY25 (FY24: 77.3), driven by slower sales and cautious consumer spending. This imbalance is inflating floorplan interest costs and tying up working capital, with the used segment in particular showing signs of oversupply.
Pressure on used car values
After experiencing years of beneficial upside as a result of Covid 19 constraining new car supply, the used car market is beginning to return to industry norms. As new car supply has returned, the influx of leased and fleet vehicles and lower demand is applying downwards pressure on used car values. Dealers will need to return to strict purchasing approaches to maintain used car department profitability and avoid it contributing to the margin pressure experienced from new cars.
Finance costs remain high
Despite three RBA rate cuts in 2025, the cash rate remains high by recent historical standards at 3.60%, and floorplan interest expenses remain a significant drag on profitability. Across the listed dealer cohort, average interest expense grew 19.4% in FY25, reflecting both higher average stock levels and longer holding periods. This has eroded millions in potential profit and remains a key headwind heading into FY26.
The interesting
Chinese brands are the industry disruptors
FY25 market has proven to be a turning point within the Australian market, Chinese brands have now successfully captured 15.79% of the market, up from 11.20% in June 2024 per VFACTS. For reference, Chinese brands market share was only 2.7% in June 2020. The rapid acceleration in market share acquisition by brands such as BYD, MG, GWM and Chery have not gone unnoticed with both ASG and PWR adding new Chinese brands in FY25. Peter Warren stated on their investor call that Chinese brands will make up 20% of their portfolio in FY26.
Debt management was a focus
All three listed dealer groups made significant changes to debt levels and debt facilities. AP Eagers and Peter Warren reduced their net debt by 41% and 23% respectively, while ASG established a $350m syndicated debt facility. For the listed dealer groups, FY25 was a softer year for acquisitions compared to previous years and combined with actions taken by all three groups to strengthen their balance sheet indicates an active M&A market for FY26.
Results snapshot (cont.)
Eagers Automotive performance vs PCP
16.4%↑
Revenue increased to $12.2bn driven by stronger new and used car sales than expected, growth from the partnership with BYD, and improvements in the EasyAuto123 business.
17.3%
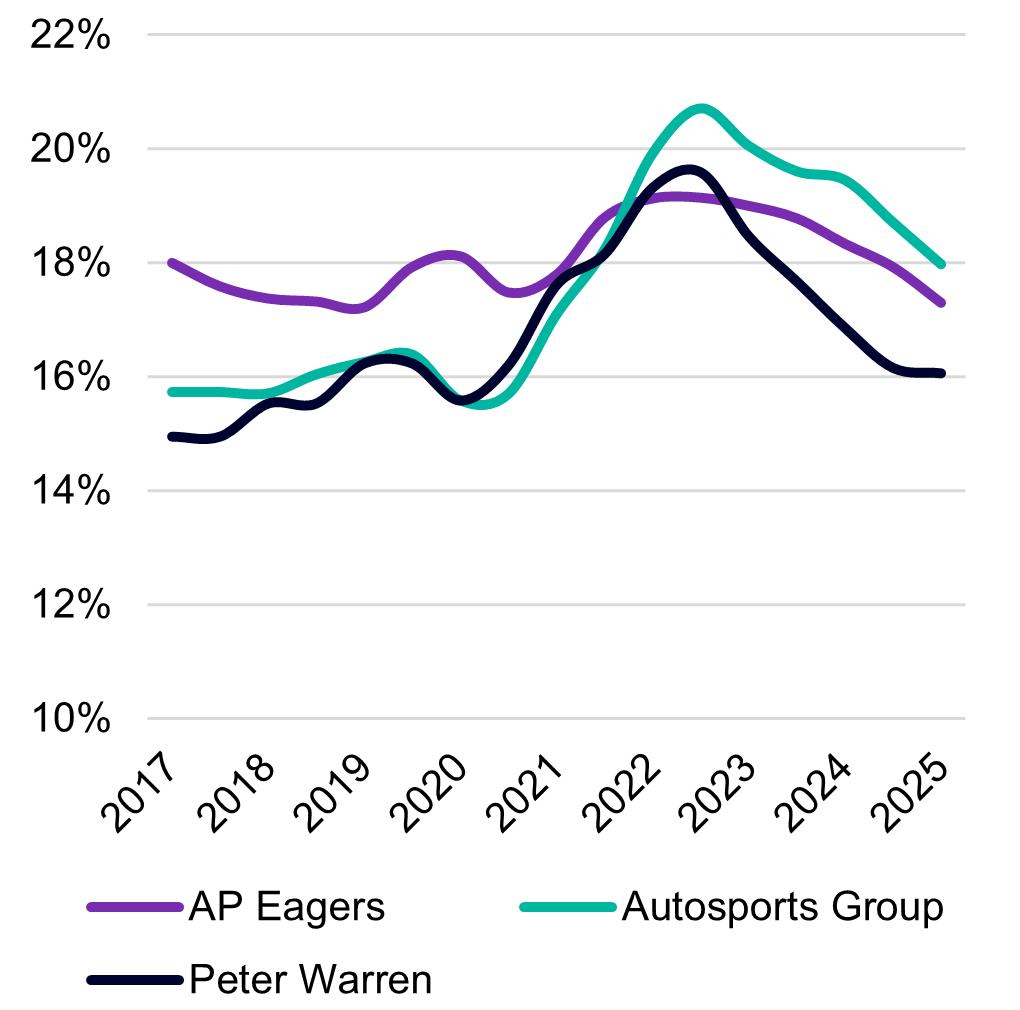
Gross Margin has decreased by 0.9% YOY (18.2% to 17.3%) despite Total Gross Profit increasing by 9.9% YOY to $2.1bn reflecting the continued gross margin pressures within the market.
5.9%
EBITDA increased by $37.8m YOY when EBITDA margin decreased by 0.6% representing the continued gross margin pressures within the market. EBIT margin NPBT as % of total rev Average inventory days
4.6%
EBIT increased by $18.4m and the EBIT margin decreased by 0.6% representing continued margin compression and the impairment of the NZ cash generating unit in 2H24.
56.6days
Cash conversion increased by 3.2 days driven mainly by increasing inventory days.
2.8%
NPBT as a % of Total revenue decreased by 0.9% YOY as revenue growth outpaced gross margin growth.
22.4%
Interest expense increased from $160.1m to $196.0m YOY and Interest expense % of Gross increased from 8.3% to 9.3%.
Return on equity declined by 16.6% YOY, due to a decrease in earnings. 13.5x
EV to EBIT increased to 13.5x compared to 10.3x at June 24 due to a decline in EBIT.
70.1 days
Inventory days increased by 11.1% YOY while New Car Days’ declined from 64 days to 58 days YOY.
2.9x
Interest coverage decreased from 3.4x on the back of increased floorplan costs and declining profitability.
21.7x
The share price to earnings per share (before extraordinary items) is 21.7x compared to 10.5x at June 2024.
Results snapshot (cont.)
Autosports performance vs PCP
8.2%↑
Revenue increased to $2.9bn. The increase was driven by dealership acquisitions and new greenfield dealerships in FY25.
18.1%
Gross margin has decreased by 1.5% YOY (19.5% to 18.0%) and Total Gross Profit increased by 0.01% YOY to $515.0m reflecting the continued gross margin pressures within the market.
6.0%
EBITDA decreased by $34.4m YOY and EBITDA margin decreased by 1.8% representing the continued gross margin pressures within the market and increased operating expenses. EBIT margin
3.7%
EBIT decreased by $41.2m and EBIT margin decreased by 1.9%
as %
1.4%
NPBT as a % of total revenue decreased by 1.9% YOY as revenue growth outpaced gross margin.
Cash conversion increased by 6.8 days driven mainly by increasing inventory days. 16.1% Interest expense increased from $56.8m to $66.0m YOY and Interest Expense % of Gross increased from 11.0% to 12.8%.
6.6% Return on equity declined by 47.9% YOY due to a decline in earnings. 15.0x
to EBIT increased to 15.0x compared to 9.5x at June 24 due to a
79.0 days
Inventory days increased by 6.6% YOY while New Car Days declined from 96 days to 84 days YOY.
1.6x
Interest coverage decreased from 2.6x on the back of increased floorplan costs and declining profitability.
15.1x
The share price to earnings per share (before extraordinary items) is 15.1x compared to 7.2x at June 2024.
Results snapshot (cont.)
Peter Warren performance vs PCP
0.3%↑
Revenue increased to $2.5bn due to dealership acquisitions in FY25.
2.7%
EBIT decreased by $28.3m and EBIT margin decreased by 1.2%.
16.1%
Gross margin has decreased by 0.8% YOY (16.9% to 16.1%) and Total Gross Profit decreased by 4.4% YOY to $398.8m reflecting the continued gross margin pressures within the market.
0.8%
NPBT as a % of total revenue decreased by 1.4% YOY due to continued gross margin compression and increased operating expenses related to the acquisitions.
4.4%
EBITDA decreased by $22.8m YOY and EBITDA margin decreased by 0.9% representing the continued gross margin pressures within the market and increased operating expenses related to the acquisitions.
82.2 days
Inventory days increased by 10.3% YOY and New Car Days declined from 61 days to 59 days YOY.
Cash conversion increased by 9.4 days driven mainly by increasing inventory days. 12.7% Interest expense increased from $43.6m to $49.1m YOY and Interest Expense % of Gross increased from 10.4% to 12.3%.
1.4x
Interest coverage decreased from 2.2x on the back of increased floorplan costs and declining profitability. Return
2.5%
Return on equity declined by 64.8% YOY due to a decline in earnings. 14.4x EV to EBIT increased to 14.4x compared to 11.0x at June 24 due to a decline in EBIT.
20.3x
The share price to earnings per share (before extraordinary items) is 20.3x compared to 8.1x at June 2024.
At a glance
Australia Listed Dealer Groups Comparison
– 12 months to 30 June 2025
At a glance (cont.)
At a glance (cont.)
Australia Listed Dealer Groups Comparison – 12 months to 30 June 2024
Market share VFACTS & EVC National – June 2025
National MTD retail unit sales
FY24 vs FY25 retail unit sales1, 2
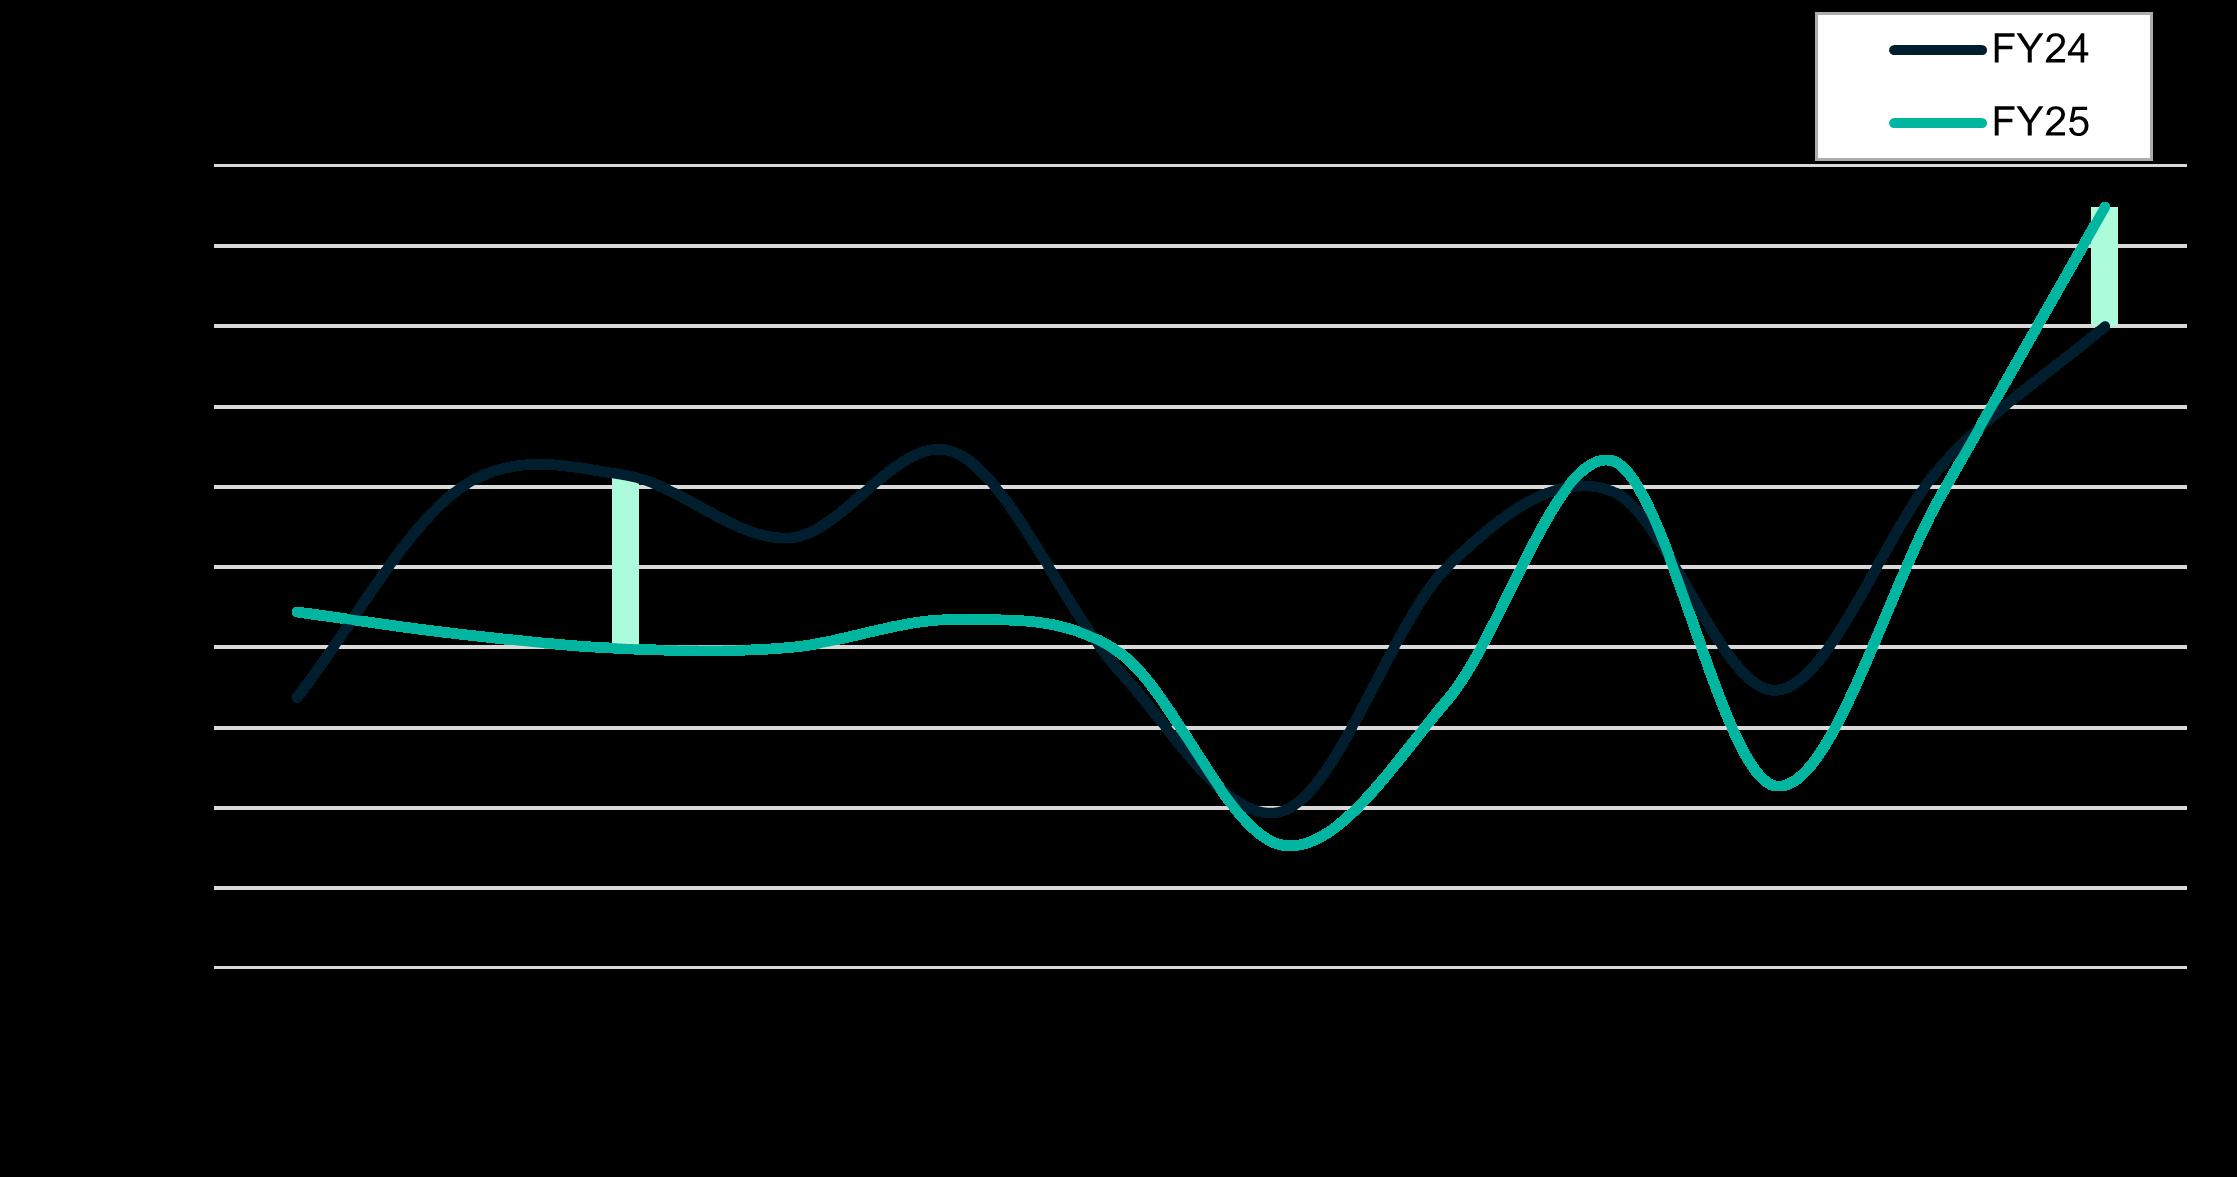
Sources:
1Federal Chamber of Automotive Industries – VFACTS 2023, 2024, 2025 monthly reports.
2Electric Vehicle Council – 2024 & 2025 monthly vehicle sales reports.
Key takeaways for the month of June 2025
June 2025 was the strongest month of the year, with 127,437 new vehicles sold, up 6.2% year on year. The standout result was supported by strong EOFY promotions, increased vehicle availability, and a push in luxury/ near luxury purchases to avoid the higher prices that will result from the upcoming 1 July change to Luxury Car Tax thresholds.
Standout performers included BYD (+367.9% YOY), Chery (+180.3%), CUPRA (+139.1%), and GWM (+30.9%), alongside strong gains from Hyundai (+28.3%), Mercedes Benz (+28.2%), and Lexus (+17.7%).
Value remains the key driver for Australian customers as Chinese brands (BYD, GWM, MG, Chery) continue to expand share in both the volume and electrified segments, with BYD and Chery posting triple‑digit growth YTD.
The growth narrative was largely driven by the emerging Chinese brands, with traditional players largely stable or softening. Despite being flat or slightly down on volume, Ford, Mazda, Toyota, and Kia still held their ground as top five players.
Hybrid vehicle sales surged in FY25, capturing a record share of the market as cost conscious buyers favoured fuel efficiency without the higher upfront cost of full EVs.
Dealer performance
The market is fragmenting faster than ever. Five of the top 15 brands are Chinese or emerging challengers (BYD, GWM, MG, Chery, and Tesla). That reshapes dealership margins, brand strategies, and M&A considerations across the network.
Dealer groups entered June 2025 with cautious optimism and ended the month with a solid uplift in deliveries.
EOFY promotions translated into strong foot traffic, particularly across non passenger and hybrid nameplates.
Improved stock availability allowed many retailers to fulfil long standing orders. Though, inventory management will be a critical profitability driver in the months ahead with average days’ supply continuing to lengthen for most dealers.
The trend toward diversified earnings continued. Dealers are increasingly focused on strengthening aftersales and pre owned operations to offset tighter new vehicle margins.
With rate cuts flowing through, new nameplates arriving, Chinese brands accelerating, and hybrid offerings strengthening, dealers are positioned for a competitive but opportunity rich second half of 2025.
VFACTS analysis
YTD June 2025 new vehicle sales of 624,130 units are just 1.4% behind 2024 of 633,098 units, highlighting the resilience of demand in the face of ongoing cost‑of‑living pressures. New vehicle units for CY2025 are set to exceed our original forecast of 1.1 million units, with the market holding close to last year’s record pace despite a softer economic indicators. This is primarily driven by population growth as noted earlier in the report.
Two RBA interest rate cuts in 2025 have started to lift buyer sentiment and with at least one additional interest rate cut expected by the first quarter of 2026, buyer sentiment will continue to improve and boost demand in the second half of the year.
Consumer preferences are shifting driven mainly by emerging Chinese brands as buyers seek high value options in a cautious spending environment. In June 2025, 21,971 vehicles sold were built in China, which represents 17.2% of all vehicles sold compared to June 2024 when 9.3% of vehicles sold were built in China. The shift is just as pronounced based on YTD numbers where 88,233 vehicles sold were built in China representing 14.1% of the total market (up from 9.5%).
Value remains fundamental for Australian buyers, and Chinese brands are delivering competitive pricing, and improved vehicle quality. The result is a reshaping of the automotive landscape that will continue to challenge traditional OEMs.
2025 has been the year of the hybrid and PHEV, with YTD hybrid sales of 93,746 (+14.9%) and YTD PHEV sales of 25,613 (+210.2%). In contrast, BEVs have softened with YTD sales at 47,145 units ( 6.1%) which includes a steep decline in Tesla sales of 38.8%. This reflects more competition in the EV space and a change in buyer sentiment, particularly as transitional powertrains such as hybrids and PHEVs offer fewer compromises.
Business buyers are driving market strength in 2025 where YTD sales to business customers (excluding heavy commercial) are 242,446 units (+5.1%) and represent 40.3% of the total market compared to 38.0% in 2024. Private buyers have remained cautious with sales down 4.3% YTD though a lift in sentiment is expected as the interest rate cuts work their way through the system. Rental sales remain stable though government sales are notably down ( 18.3% YTD).
Thank you for taking the time to read this report and for your interest in the evolving Australian automotive market. If you would like to discuss any of the insights in greater detail or deep dive into specific topics, please don’t hesitate to reach out. We welcome your questions and look forward to continuing the conversation.
About Pitcher Partners Pitcher
Sydney statistics
35 partners
300+ people
145+ partners
National statistics
1,500+ people 6 independent member firms

We’re ready to help you thrive
Since day one we’ve been helping businesses, families and individuals intelligently frame their goals and make the most of their potential.
Today, we’re one of the largest accounting, audit and business advisory firms in Australia. We work with middle market businesses, from family-run companies to renowned industry leaders and iconic brands. And help families and individuals manage their wealth across generations.
If you’ve got ambition, we’re the team you want on your side.
Local knowledge, national footprint
Pitcher Partners is a national association of six independent accounting, audit and business advisory practices. You’ll find our firms in Adelaide, Brisbane, Melbourne, Newcastle and Hunter, Perth and Sydney. Each firm has a unique character, with a strong connection to the local community. Supported by our combined resources, we deliver Australia’s most personalised and responsive assurance and advisory services.
And if you’re thinking beyond the border, we can support your global operations and ambitions through the Baker Tilly International network.
We’ll always make it personal
At the heart of Pitcher Partners is the idea that business is never just business. We’re known for the dedication we give to building great relationships, and it’s been that way from the start. People first.
Everything we do is grounded in communication and collaboration. We’re here for that frank, refreshing and always informed discussion that leads to new ideas and better decisions. And we’re here for you. Whatever your goals, we can get there together.
Scan to watch our story
Sydney statistics as at 31 October 2025.
National statistics as at June 2025.
Our global reach
Our global reach
We are proud to be a member of the Baker Tilly network, a global network of independent accounting and business advisory firms, whose member firms share our dedication to exceptional client service.
Every day, more than 43,500 people in 143 territories share experiences and expertise to help privately held businesses and public interest entities meet challenges and proactively respond to opportunities. International capability and global consistency of service are central to the way we work.
3,840+ partners
43,500+ experienced professionals
Baker Tilly International
Experts across a wide range of industry and business sectors, each Baker Tilly International member firm combines high-quality services and in-depth local knowledge. Sharing knowledge and resources, our business approach brings together the power of the global network to deliver exceptional results to clients globally.

143 territories
$5.6bn worldwide revenue 2024 (USD)

Pitcher Partners
Pitcher Partners is an independent member of Baker Tilly International. Pitcher Partners’ strong relationship with other Baker Tilly International member firms, particularly in Asia-Pacific, provides clients with access to international networks, opportunities and expertise to expand globally.
Global statistics as at January 2025.


m
m
Disclaimer
This Report (‘Report’) has been produced by Pitcher Partners and has been prepared for informational and discussion purposes only. This information is correct at time of publishing. The information provided in this document is of a general nature and has been prepared without taking into account your objectives, circumstances, financial situation or particular needs. This Report does not constitute personal advice. All financial numbers have been sourced from SP Capital IQ, Pitchers Partners do not provide any assurance with regard to these figures.
This Report has been prepared by us in the ordinary course of our profession. In providing this Report, we are not purporting to act as solicitors or provide legal advice. Appropriate advice should be sought prior to acting on anything contained in this Report or implementing any transaction or arrangement that may be referred to in this Report.
Information contained within this Report is based on the relevant law and its interpretations by relevant authorities as it stands at the time the information is provided. Any changes or modifications to the law and/or its interpretation after this time could affect the information we have provided.
This Report, or any part thereof, must not be distributed, copied, used, or relied on by any person, without our prior written consent. Permission must be sought to reproduce any content via the media enquiry form.
To the maximum extent permitted by law, Pitcher Partners will not be liable for any loss, damage, liability or claim whatsoever suffered or incurred by an person arising directly or indirectly out of the use or reliance on the information contained within this Report.
Any trademarks, logos, and service marks contained herein may be the registered and unregistered trademarks of their respective owners.Nothing contained herein should be construed as granting by implication, or otherwise, any license or right to use any trademark displayed without the written permission of the owner.