City of Jacksonville Non-Motorized User Counts Strategy Report 2025
Executive Summary
This Non-Motorized User Counts Strategy Report outlines a comprehensive plan for the City of Jacksonville to collect, analyze, and utilize bicycle and pedestrian count data to enhance active transportation planning, prioritize safety improvements, and justify infrastructure investments.
The strategy integrates best practices from the National Association of City Transportation Officials' (NACTO) Making Bikes Count, Eco-Counter’s 7 Tips for Effective Pedestrian and Bicycle Count Data Analysis, and the Transportation Research and Education Center's (TREC) Guide to Bicycle & Pedestrian Count Programs. It emphasizes standardized data collection, collaboration with the Florida Department of Transportation’s (FDOT) Statewide Non-Motorized Traffic Monitoring Program, and the use of count data to demonstrate demand for non-motorized infrastructure.
Jacksonville’s partnership with FDOT has led to permanent counters at high-traffic locations like the Fuller Warren Pedestrian Bridge, Baldwin Trail, and S-Line Trail, based on substantial temporary count data, with many of these counters monitored through FDOT's interactive, public-facing Non-motorized User Counts Dashboard, a valuable clearinghouse for data.
The report includes an inventory of current counting hardware and an appendix detailing the hardware installation process. Implementing a strategic non-motorized user count program is critical to demonstrate demand for bicycle and pedestrian facilities, as Jacksonville has historically faced infrastructure funding challenges, contributing to gaps in the bicycle and sidewalk networks on both locally and state-owned routes.
This funding challenge likely plays a role in Jacksonville’s ranking as the 15th most dangerous metropolitan area in the United States for pedestrians and the third most dangerous for cyclists.
1.1
2.1
2.2
2.2.1
2.3 Data
2.4
2.5
3.1 Analysis
3.2
3.3
4.
4.1
4.2
4.3
4.4
1. Introduction
Non-motorized transportation, including walking and bicycling, is vital to Jacksonville’s multimodal transportation system. As the largest metropolitan area by land area in the United States, Jacksonville faces challenges in allocating sufficient funding for non-motorized infrastructure, often resulting in sidewalk gaps on both locally owned/maintained and state-owned routes.
Accurate bicycle and pedestrian count data are essential for understanding usage patterns, evaluating infrastructure performance, and justifying investments in safety and connectivity. These funding challenges likely contribute to the city’s ranking as the 15th most dangerous metropolitan area for pedestrians and the third most dangerous for cyclists (Dangerous by Design, 2022).
A strategic non-motorized user count program is critical to demonstrate demand for bicycle and pedestrian facilities, advocate for expanded infrastructure, and address safety and equity concerns.
The City of Jacksonville collaborates closely with FDOT’s Statewide Non-Motorized Traffic Monitoring Program, which reviews temporary count data and, when warranted, installs permanent counters to support long-term monitoring. Data from many of these permanent counters, which replaced the city’s temporary counters, are accessible through FDOT’s Non-motorized User Counts Dashboard, a valuable clearinghouse for public-facing, interactive data.
• Establish a consistent, scalable non-motorized count program to demonstrate demand.
• Collect high-quality data to inform planning, design, and policy decisions.
• Justify investments in bicycle and pedestrian infrastructure to address historical underinvestment.
• Enhance safety by identifying high-risk areas and prioritizing improvements.
• Promote equity by capturing data on underrepresented user groups.
Recommended Initial Sites (Not Ranked):
Fuller Warren Shared Use Path
Location: San Marco side, at the bicycle-pedestrian bridge along the Fuller Warren Bridge (Interstate 95).
Description: A critical shared-use path connecting Riverside and San Marco to Downtown and beyond.
Connectivity: Core-2-Coast Trail, Emerald Trail (Artist Walk segment).
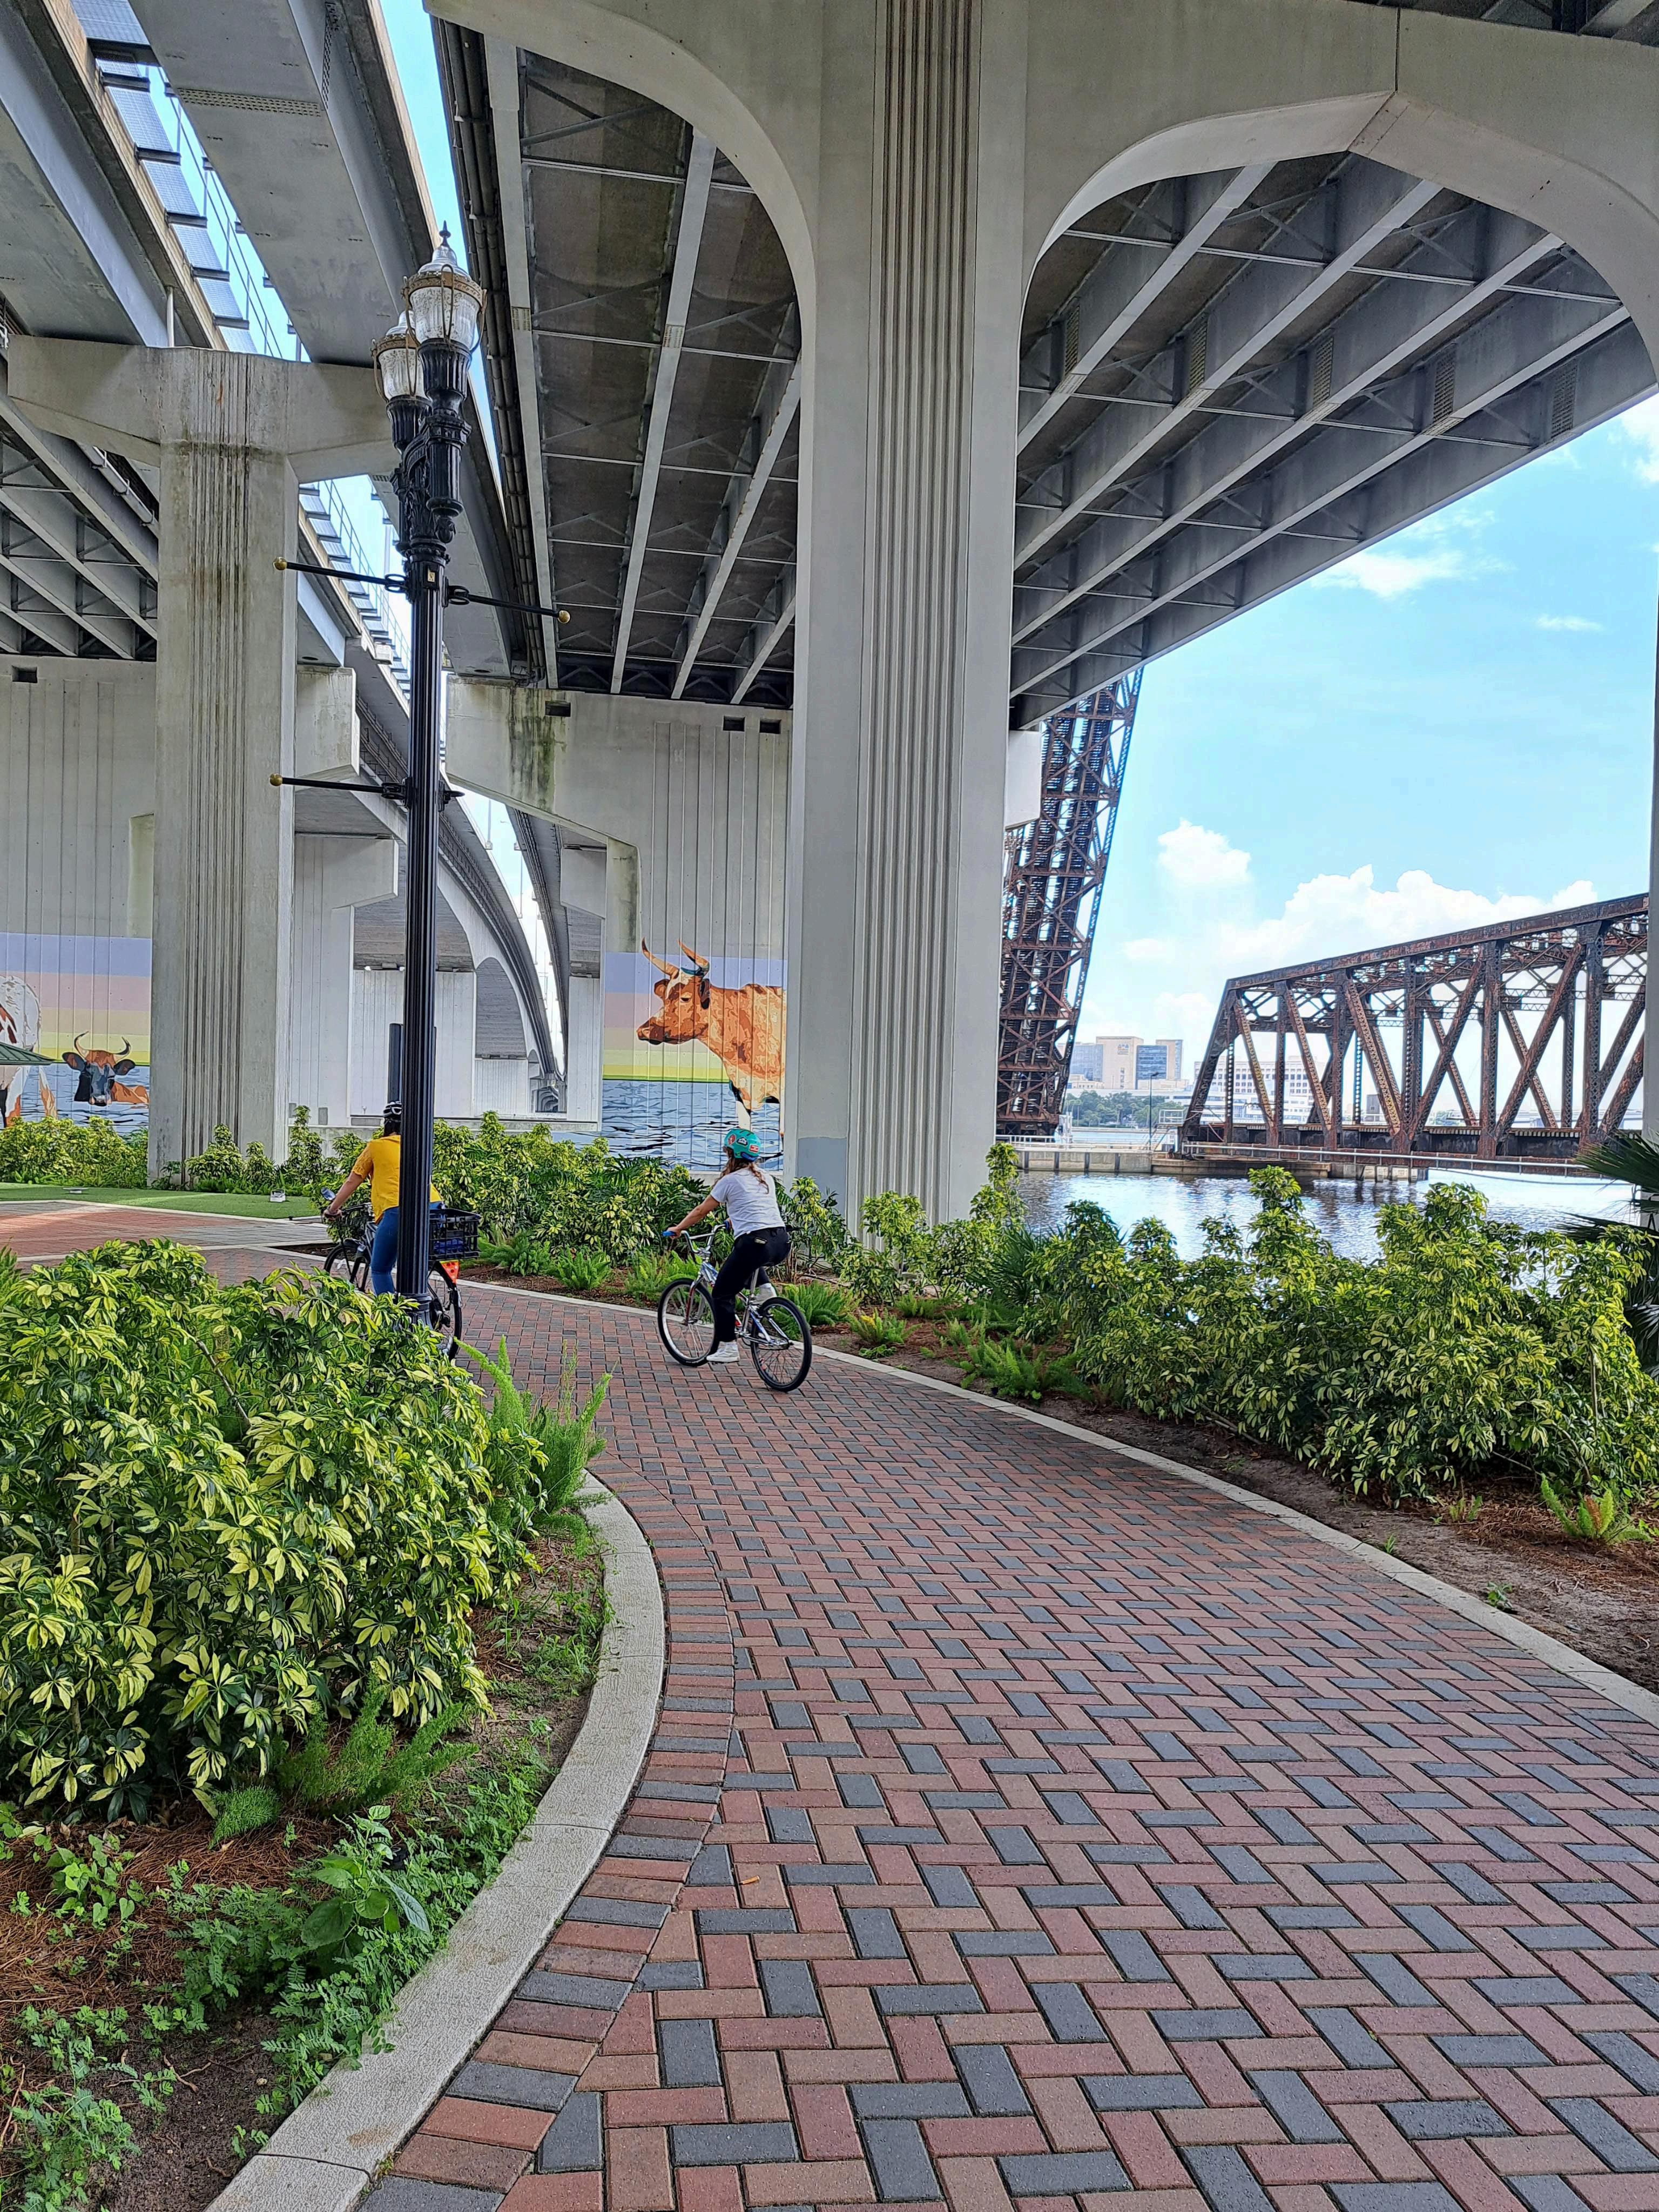
Details: West side is equipped with an FDOT-installed permanent counter, monitored via FDOT’s dashboard. Starting point for the Core-2-Coast Trail, linking Downtown to the Beaches, and part of the Emerald Trail. High usage on west side (83,000 users in first three months) supports investments in safety and connectivity enhancements, such as improved signage or lighting.
S-Line Rail Trail
Location: From Myrtle Avenue near State Street (Springfield) to Norwood Plaza (Brentwood), including a 1.3-mile unfinished segment from 12th Street and Boulevard to East 21st Street.
Description: A 4.8-mile paved multi-use path serving historic neighborhoods.
Connectivity: Emerald Trail.
Details: Integral to the Emerald Trail, connecting Springfield and Durkeeville. Equipped with an FDOT-installed permanent counter, monitored via FDOT’s dashboard. Completion of the unfinished segment will enhance connectivity to Downtown and the Hogan Street Cycle Track, addressing equity and safety needs.
Hogan Street Cycle Track
Location: From Hogans Creek at 1st Street to the Northbank Riverwalk, Downtown Jacksonville.
Description: A planned two-way cycle track to improve cyclist safety and access in Downtown.
Connectivity: Emerald Trail, Vision Zero quick-build project.
Details: Part of the Emerald Trail, transitioning from a shared-use street near Florida State College at Jacksonville (FSCJ) to a protected cycle track. Construction is expected to start in summer 2026, complementing pedestrian improvements on nearby Laura Street and supporting Vision Zero safety goals.
Laura Street
Location: Downtown Jacksonville, a key pedestrian corridor.
Description: A high-traffic pedestrian corridor with incomplete sidewalks and accessibility challenges.
Connectivity: Vision Zero quick-build project, Emerald Trail (via Hogan Street).
Details: Prioritized for Vision Zero quick-build projects, such as temporary crosswalks or pedestrian refuge islands, to enhance safety near the Jacksonville Regional Transportation Center and FSCJ. Temporary counters can justify permanent infrastructure to address sidewalk gaps, aligning with Jacksonville’s pedestrian safety challenges.
St. Nicholas Neighborhood
Location: Southeast of Downtown Jacksonville, near the St. Johns River.
Description: A historic neighborhood with sidewalk gaps and high non-motorized travel demand.
Connectivity: Core-2-Coast Trail.
Details: Part of the Core-2-Coast Trail’s alignment, connecting Downtown to the Beaches. Supports safe access to schools, parks, and transit stops. Temporary FDOT counters can demonstrate demand for sidewalk and bike lane improvements, addressing connectivity and safety needs.
University Boulevard
Location: Arlington, near the University of North Florida (UNF) and Kernan Boulevard.
Description: A major arterial road with frequent pedestrian and cyclist crashes and sidewalk gaps.
Connectivity: Core-2-Coast Trail, SUN Trail, Vision Zero quick-build project.
Details: Aligns with the Core-2-Coast Trail and proposed SUN Trail routes (per FDOT SUN Trail Network: https://www.arcgis.com/apps/Viewer/index.html?appid=0acc2915532d4cd48aec5ad16265f68f ). Prioritized for Vision Zero quick-build projects, such as temporary bike lanes or crosswalks, to enhance safety for students and residents. Data collection is critical for infrastructure upgrades.
2.2 Data Collection Methods
The program uses manual, automated, and crowdsourced methods, with FDOT reviewing temporary counts to assess the need for permanent counters, particularly in areas with high demand and safety risks.
Manual Counts:
• Conducted by trained staff/volunteers during peak (7-9 AM, 4-6 PM) and off-peak (12-2 PM) periods, following National Bicycle and Pedestrian Documentation Project (NBPD) protocols.
• Capture user type, gender, age, helmet use, and direction to highlight demand.
• Minimum 8-hour counts, extended to a week when possible.
Automated Counts:
• Permanent Counters: Installed by FDOT at high-traffic sites (e.g., Fuller Warren Pedestrian Bridge, Baldwin Trail, S-Line Trail) based on substantial temporary count data from city counters. Many of these are monitored through FDOT’s Non-Motorized User Counts Dashboard, providing interactive, public-facing data.
• Portable Counters: Deployed at rotating sites for spatial coverage, utilizing current inventory (see Section 2.5).
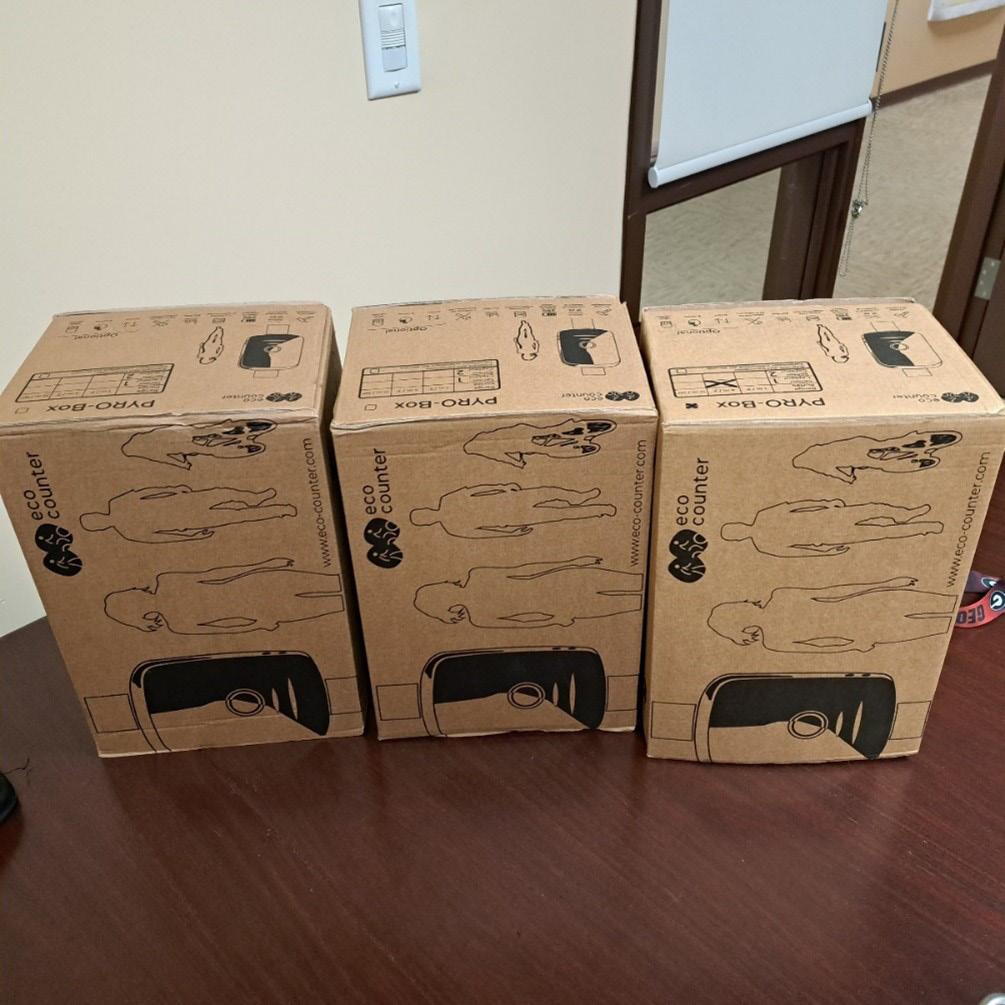
• Technologies (primarily for mobile counters): Pneumatic tubes (98.1% accuracy), pyroelectric sensors (Eco-Counter Pyro-Box Evo), ZELT loops, and CITIX AI Evo for multimodal areas.
• Regular calibration and cross-referencing with manual counts ensure accuracy.
• Crowdsourced Data: Strava data adjusted with TxDOT’s seasonal factors to estimate network-wide patterns, highlighting latent demand in underinvested areas.
2.2.1 Special Use Cases for Temporary Counters
The City’s Public Works Department and Parks Department may request the Planning Department to deploy temporary non-motorized user counters to
document before-and-after conditions for infrastructure projects, ensuring data-driven evaluation of project impacts. Additionally, these counters will be frequently used to support quick-build demonstration projects implemented throughout 2025-2026, funded by the 2024 Safe Streets and Roads for All (SS4A) discretionary grant awarded to Jacksonville to enhance safety and connectivity (USDOT, 2024).
2.3 Data Collection Schedule
• Permanent Counts: Continuous at 5-10 key locations, including FDOT-installed counters accessible via the FDOT dashboard.
• Short-Duration Counts: Quarterly at 20-30 rotating sites, submitted to FDOT Transportation Data and Analytics Office for review.
• Manual Counts: Annual at 50 sites, aligned with recommended NBPD count days.
• Special Project Counts: Before-and-after counts for infrastructure projects to demonstrate impact, including SS4A-funded quick-build projects.
2.4 Equipment and Budget
Estimated Investment (2025-2030):
• 5 additional permanent counters: ~$45,000.
• 10 additional portable counters: ~$15,000.
• Software (Eco-Visio): ~$5,000/year.
• Training/coordination: ~$3,000.
• Total: $88,000 (FY25-30, supplementing current inventory).
Funding Sources: FHWA grants, FDOT Bicycle and Pedestrian Program funds, Jacksonville TPO grants, local budgets, and SS4A grant funds.
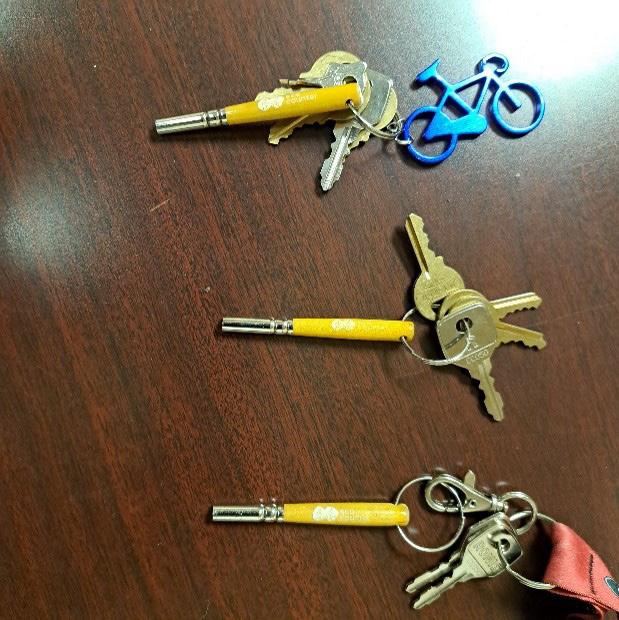
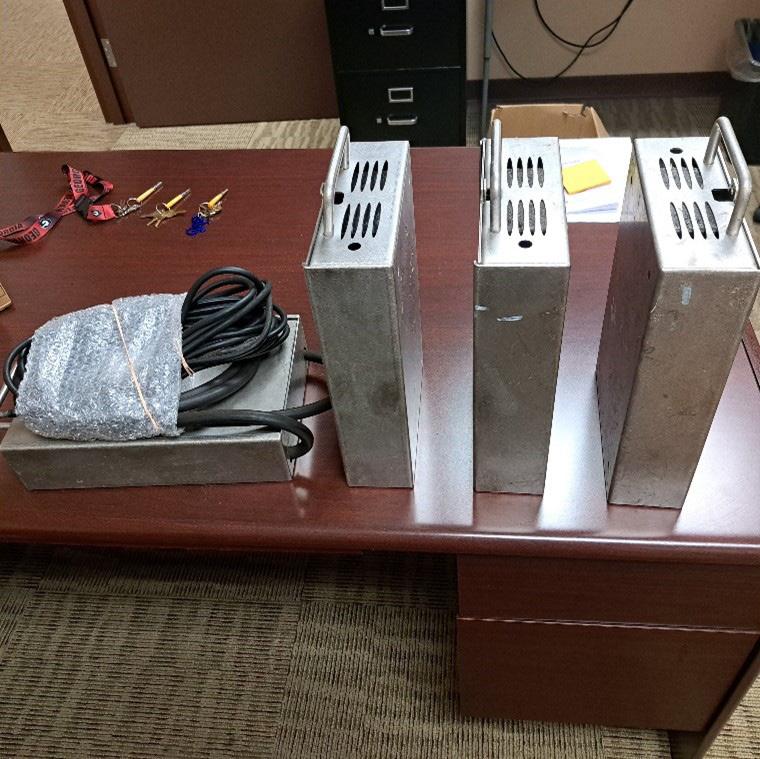
The City of Jacksonville maintains the following equipment* for non-motorized user counts, managed through Eco-Counter systems (and stored internally at T:\Bike-Ped\User Counts).
Data is accessible via the Eco-Visio dashboard (https://www.eco-visio.net/v5/login/#). Additional equipment details at: www.eco-counter.com
• Data Retrieval Keys: 8
• Portable Bike Counters: 4
• Mobile Multi Counters: 4 (Serial Numbers: YSI20093711, YSI20093712, XMH22094134, XMH22094135).
• Eco Display Classic Model: 1 (Serial Number: Y2H23046108; located at Corkscrew Park).
• Band-It Value Straps: 2 new boxes, 3-4 used straps.
• Tubing: 6-8 rolls (full box, various lengths).
• Miscellaneous Tools: 1 box (attaching, locking, and other accessories).
*This inventory supports short-duration counts, including those for SS4A-funded projects, and will be supplemented to meet program goals, ensuring robust data collection to address underinvestment and safety challenges. Installation processes for this hardware are detailed in Appendix A.
3. Data Analysis and Quality Control
Data analysis follows Eco-Counter and TREC guidelines, with FDOT collaboration ensuring alignment with statewide standards to support safety and infrastructure advocacy.
3.1 Analysis Methods
• Temporal Trends: Permanent counter data (e.g., Fuller Warren Bridge, accessible via FDOT dashboard) identify daily, weekly, and seasonal patterns to show demand.
• Spatial Variations: Map short-duration counts (using portable counters) to highlight demand and network gaps, particularly in areas with sidewalk gaps.
• Weather Adjustments: Cross-reference with weather data to isolate impacts.
• Exposure Analysis: Combine counts with crash data to identify high-risk areas, addressing Jacksonville’s dangerous rankings for pedestrians and cyclists.
3.2 Quality Control
• Regular calibration of current inventory (e.g., Mobile Multi Counters, portable bike counters).
• Data stored in Traffic Monitoring Guide (TMG) format for compatibility with FDOT and national databases.
• TREC’s BikePed Portal checks flag outliers.
3.3
Data Storage and Sharing
Central Repository: Jacksonville Bicycle and Pedestrian Count Exchange (TBD), complemented by FDOT’s Non-Motorized User Counts Dashboard as a public-facing clearinghouse.
Public Access: Interactive dashboard (ArcGIS/Eco-Visio) and FDOT dashboard to demonstrate demand.
State and National Integration: Share data with FDOT’s Statewide Non-Motorized Traffic Monitoring Program and NBPD/Bike-Ped PORTAL.
COJ Internal: Data will be archived within Planning Department and as per Florida public records requirements.
• Install permanent counters at 5 sites; conduct short-duration counts at 20 sites using portable counters, prioritizing high-crash and underinvested areas, including SS4A project sites.
• Develop a Non-Motorized Count Exchange and public dashboard, aligning with FDOT’s Non-Motorized User Counts Dashboard.
• Submit data to FDOT and NBPD.
Year 2 (2026-2027):
• Expand to 10 permanent counters (with FDOT review) and 30 short-duration sites.
• Conduct before-and-after counts for 2 projects, including SS4A-funded quick-build projects, using Mobile Multi Counters to evaluate safety and usage impacts.
• Produce demand/safety/equity report for FDOT and TPO, highlighting underinvestment and crash risks, using FDOT dashboard data.
• Apply for additional grants using count data.
Year 3 (2027-2028):
• Scale to 15 permanent counters and 50 short-duration sites.
• Integrate data into Mobility Plan and Vision Zero to address pedestrian and cyclist safety rankings.
• Host public workshop to share findings, including FDOT dashboard visualizations, and gather input on priority projects, including SS4A outcomes.
Year 4 and beyond (2028-2030):
• Ongoing monitoring and investment to support the non-motorized user counts program.
6. Challenges and Mitigation Strategies
Challenge: Limited budget for additional equipment.
Mitigation: Leverage FDOT/FHWA grants, SS4A funds, use current inventory efficiently, partner with universities, and recruit volunteers.
Challenge: Data accuracy with existing hardware.
Mitigation: Calibrate Mobile Multi Counters and portable bike counters regularly, cross-reference with manual counts, implement TREC quality checks.
Challenge: Engaging underserved communities in underinvested areas.
Mitigation: Partner with community organizations for site selection and outreach, especially for SS4A project areas.
Challenge: Scaling data to address citywide gaps.
Mitigation: Use crowdsourced data and FDOT-approved seasonal adjustments.
7. Conclusion
Jacksonville’s Non-Motorized User Counts Strategy, supported by a robust hardware inventory, detailed installation processes (Appendix A), and partnership with FDOT’s Statewide Non-Motorized Traffic Monitoring Program, provides a data-driven framework to enhance active transportation.
By leveraging temporary counts to justify permanent counters (e.g., Fuller Warren Pedestrian Bridge, Baldwin Trail, S-Line Trail), many of which are monitored through FDOT’s Non-motorized User Counts Dashboard—a great clearinghouse for interactive, public-facing data—and aligning with national best practices, Jacksonville can demonstrate demand for bicycle and pedestrian facilities, address historical underinvestment in non-motorized facilities, and improve safety.
The strategy supports citywide initiatives, including SS4A-funded quick-build projects, and is critical to reversing the city’s
8. References
• Eco-Counter. 7 Tips for Effective Pedestrian and Bicycle Count Data Analysis.
• National Bicycle and Pedestrian Documentation Project.
• NACTO. Making Bikes Count: Effective Data Collection, Metrics, & Storytelling.
• TREC. Guide to Bicycle & Pedestrian Count Programs.
• FHWA. Pedestrian and Bicycle Data Collection.
• TxDOT. Bicycle and Pedestrian Count Program.
• Florida Department of Transportation. Statewide Non-Motorized Traffic Monitoring Program.
• Florida Department of Transportation. Nonmotorized User Counts Dashboard. https://www.fdot.gov/planning/statistics/nonmotorized
• Florida Department of Transportation. Traffic Monitoring Handbook (2023). https://fdotwww.blob.core.windows.net/sitefinity/docs/default-source/statistics/docs/tmhandbook.pdf?sfvrsn=e8a9f204_6
• Dangerous by Design. (2022). Pedestrian and Cyclist Safety Rankings for U.S. Metropolitan Areas.
• North Central Texas Council of Governments (NCTCOG). (2017). Bicycle Opinion Survey Report. https://www.nctcog.org/getmedia/725beb55-8bc4-4e1b-a952-8a171dc52175/nctcog-bicycle-opinion-survey-report-201710-25.7aeece.pdf
• U.S. Department of Transportation. (2024). Safe Streets and Roads for All (SS4A) Grant Awards. https://www.transportation.gov/grants/ss4a/2024-awards
9. Appendix A: Hardware Installation Process for Bicycle and Pedestrian User Counters
This appendix outlines the installation process for the City of Jacksonville’s current hardware inventory (as of 02/13/2023), including Portable Bike Counters, Mobile Multi Counters, and the Eco Display Classic Model. The process is based on Eco-Counter guidelines (www.eco-counter.com) and tailored to ensure accurate data collection and equipment security, with data from permanent counters often shared via FDOT’s Non-motorized User Counts Dashboard.
Pre-Installation Preparation
• Site Selection: Confirm the site meets criteria (e.g., high-traffic, high-crash, or underinvested areas, including SS4A project sites). Coordinate with FDOT and Jacksonville TPO for alignment with regional goals and potential inclusion in the FDOT dashboard.
• Equipment Check: Verify inventory availability (4 Portable Bike Counters, 4 Mobile Multi Counters, 1 Eco Display Classic Model). Inspect equipment for damage and ensure batteries are charged.
• Tool Kit: Gather miscellaneous tools (1 box), Band-It Value Straps (2 new boxes, 3-4 used), and tubing (6-8 rolls). Include locking mechanisms for security.
• Permits and Permissions: Obtain necessary permits for installation on public rights-of-way, especially for state-owned routes or SS4A project sites. Notify property owners for private land access.
• Safety Gear: Equip staff with high-visibility vests, gloves, and traffic cones for safe installation.
Installation Process for Portable Bike Counters (Pneumatic Tube-Based)
• Site Setup: Select a flat, stable road surface perpendicular to bicycle traffic (e.g., bike lane or shared-use path, including SS4A quick-build sites). Avoid curves or intersections to ensure accurate counts.
• Tube Installation:
• Lay pneumatic tubing (from 6-8 rolls) across the path, ensuring it is taut and flush with the ground.
• Secure tubing to the road using Band-It Value Straps and nails or adhesive, depending on surface type (asphalt, concrete).
• For one counter with pre-attached tubing, verify tubing integrity before deployment.
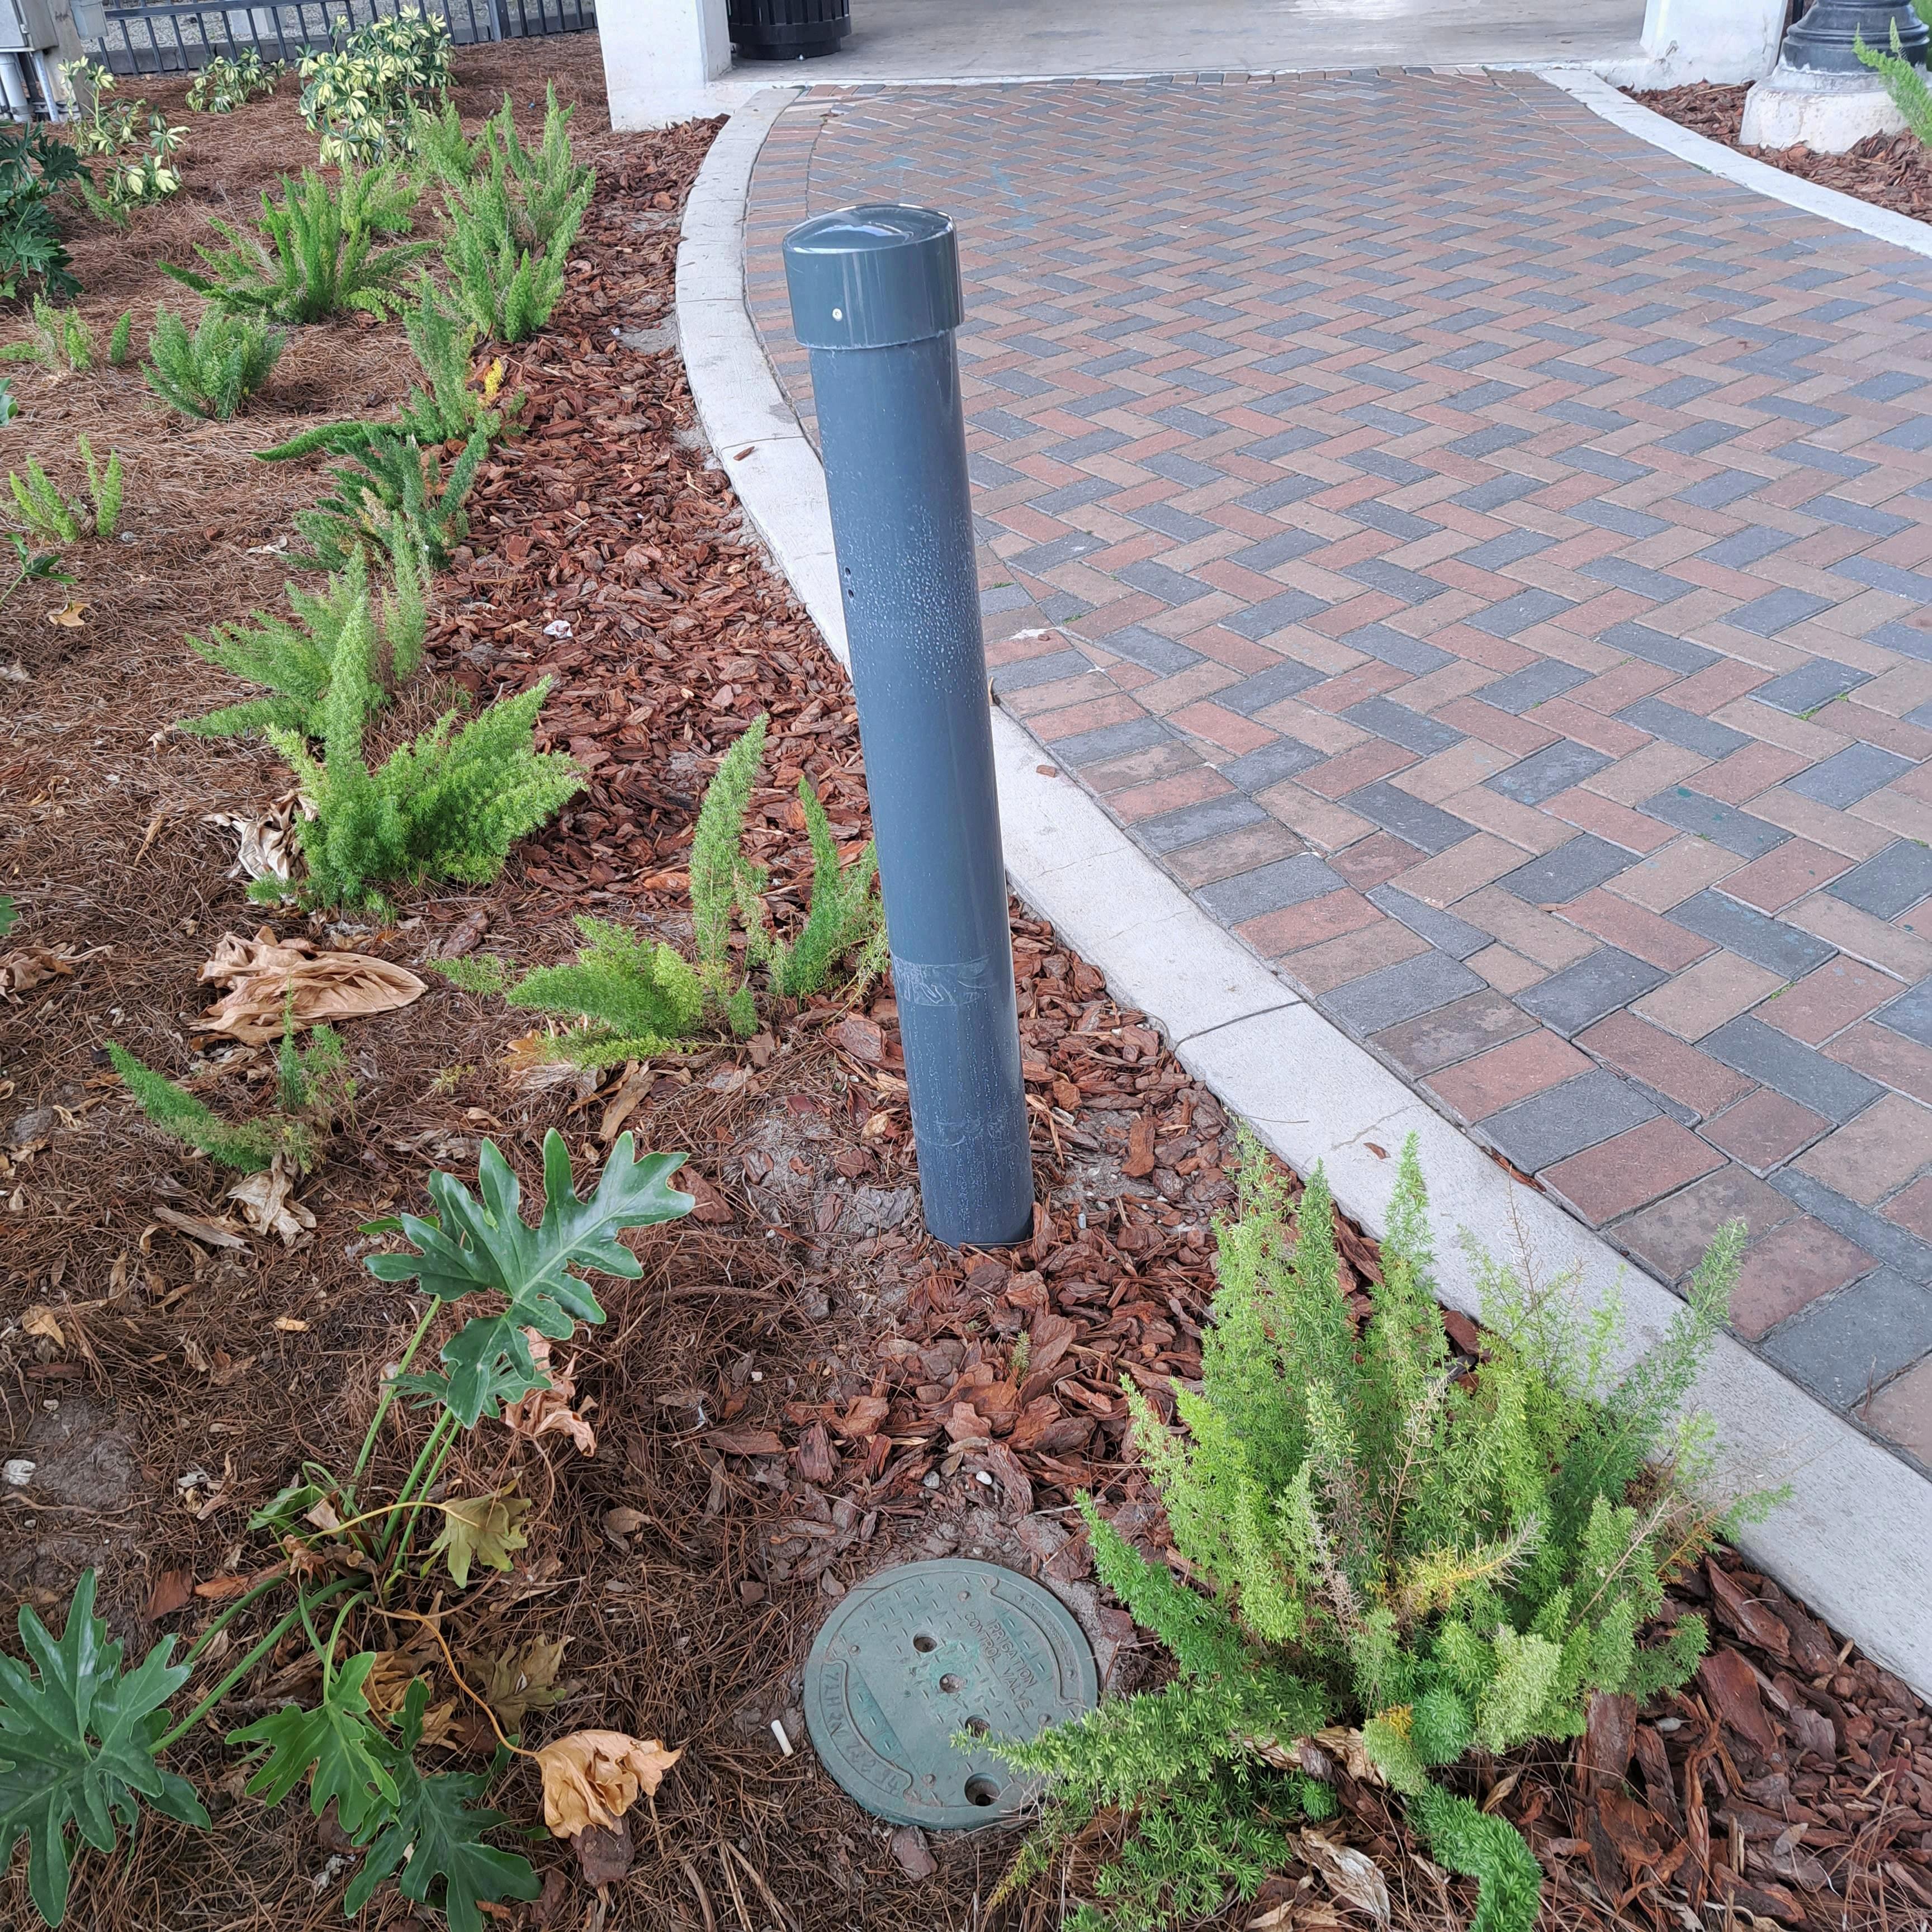
• Counter Placement: Position the Portable Bike Counter (1 of 4) in a secure, weather-resistant location (e.g., locked to a pole or hidden in vegetation). Use locking mechanisms from the tool kit.
• Calibration: Connect the counter to tubing and perform a test count by crossing the tubes. Ensure the counter registers each pass accurately.
• Data Retrieval Setup: Assign a Data Retrieval Key (1 of 4) to the counter for periodic data collection. Record the counter’s serial number and location in the Eco-Visio dashboard.
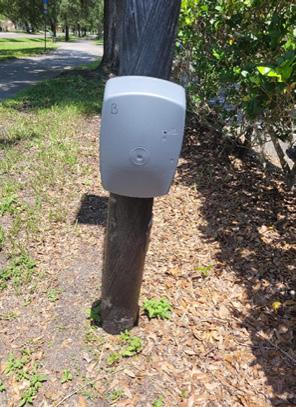
Installation Process for Mobile Multi Counters (Pyroelectric Sensors)
• Site Setup: Choose a location with clear sightlines for pedestrian or multimodal traffic (e.g., sidewalks, shared-use paths, SS4A project areas). Avoid obstructions like trees or signs.
• Mounting:
• Attach the Mobile Multi Counter (1 of 4, e.g., YSI20093711) to a pole, post, or other stable structure using Band-It Value Straps or mounting brackets from the tool kit.
• Position the sensor at a height of 1-1.5 meters to capture pedestrian and cyclist movements accurately.
• For the counter at Emmett Reed Community Center, verify its mounting stability before redeployment.
• Power and Calibration: Ensure the counter’s battery is charged or connect to a power source if available. Conduct a test by walking/cycling past the sensor to confirm detection. Adjust sensor angle if needed.
• Data Retrieval Setup: Pair the counter with a Data Retrieval Key and log its serial number and location in Eco-Visio. Schedule data downloads based on count duration (e.g., weekly for short-term counts).
Installation Process for Eco Display Classic Model
• Site Setup: The Eco Display Classic Model (Y2H23046108) is currently installed at Corkscrew Park. For new or relocated installations, select a high-visibility location on a shared-use path or trail (including SS4A sites) to display real-time counts to users.
• Mounting:
• Secure the display to a sturdy pole or post using Band-It Value Straps or mounting hardware from the tool kit.
• **Position the display at eye level (1.5-2 meters) for readability, facing the primary direction of user traffic.
• Sensor Integration: Connect the display to a nearby counter (e.g., Mobile Multi Counter) via wired or wireless connection, following Eco-Counter specifications. Ensure the counter is installed per Section 3 above.
• Power Supply: Verify the display’s solar panel or battery is functional. Test the display to confirm it shows accurate counts.
• Data Logging: Link the display’s counter to Eco-Visio using a Data Retrieval Key. Record the display’s serial number and location.
Post-Installation Steps
• Quality Check: Conduct manual counts at the site to validate automated counter data, especially for SS4A before-and-after studies. Compare results to flag any discrepancies.
• Security Measures: Lock counters to fixed objects using cables or padlocks from the tool kit. Conceal portable counters to deter theft.
• Maintenance Schedule: Inspect equipment biweekly for damage, debris, or tampering. Clean sensors and tubing as needed. Replace batteries or tubing (from 6-8 rolls) if worn.
• Data Collection: Use Data Retrieval Keys to download data to Eco-Visio at regular intervals (e.g., weekly for portable counters, monthly for permanent). Store data at T:\Bike-Ped\User Counts. For FDOT-installed permanent counters, verify data is uploaded to the Nonmotorized User Counts Dashboard.
• Documentation: Update the Eco-Visio dashboard with installation details, including site coordinates, counter type, and installation date. Share data with FDOT for review and potential inclusion in the FDOT dashboard.
Safety and Environmental Considerations
• Traffic Safety: Install during low-traffic periods and use traffic cones to protect staff, especially for SS4A quick-build sites. Coordinate with Jacksonville’s Public Works for road closures if needed.
• • Weather Protection: Ensure counters are weather-resistant and tubing is secured to withstand rain or wind. Avoid flood-prone areas.
• Community Notification: Inform nearby residents or businesses of installations, particularly for SS4A projects, to minimize disruption and gain support.
De-installation Process (For Portable Counters)
• Removal: Carefully remove tubing, straps, and counters using tools from the tool kit. Store tubing and straps for reuse.
• Site Cleanup: Clear any debris or adhesive residue to restore the site.
• This installation process ensures reliable data collection, equipment security, and alignment with Jacksonville’s non-motorized count program goals, including support for SS4A-funded projects. Staff training on these procedures is included in the Year 1 implementation plan (Section 5).
The following pages contain guidance documents officially published by Eco-Counter (www.eco-counter.com)