Palm Beach Atlantic University
2015-2016 Fact Book
The Palm Beach Atlantic University Fact Book is a collection of current and historical information designed to make frequently requested data readily available to students, faculty, and staff at PBA as well as to others with an interest in the university. More general information about PBA can be found at the University home page.
Published by:
Office of Accreditation, Assessment, and Research
Carolanne M. Brown, Assistant Provost
Phone: (561) 803-2050
Fax: (561) 803-2991
carolanne_brown@pba.edu
Marcus Braziel, Director of Institutional Research
Phone: (561) 803-2055
Fax: (561) 803-2991
marcus_braziel@pba.edu
Korey Schaffer, Research Analyst
oire@pba.edu
Mailing Address: PO Box 24708
West Palm Beach, FL 33416-4708
Street Address: 901 S. Flagler Dr. West Palm Beach, FL 33401
This book is intended as a reference. Although every effort has been made to ensure the accuracy of the information, material, and data contained within this document, absolute accuracy is not guaranteed. Reproduction of complete tables, figures, or text should include a PBA 2015-16 Fact Book notation and page number.
2
2015‐2016 Fact Book Table of Contents PBA Facts 4‐7 Academic Profile 4 Accredita on 4 Enrollment 5 Faculty 5 Financial Data 5 Technology 5 Campus Organiza ons 5 PBA Values 6 American Free Enterprise 6 Guiding Principles 6 Statement of Purpose 6 Workship 7 New Undergraduate Student Sta s cs 8‐12 Enrollment by Gender 8 Enrollment by Ethnicity 8 Freshmen Living on Campus 8 Number in Supper Honors 8 Number of Athletes 9 Enrollment by Religious Affilia on 9 Enrollment by Permanent Residence 9 New UG Day & Transfer Enrollment Trends 10 Gradua on Rate Trends of First‐Time Freshmen by Cohort 10 Average SAT for all Entering Freshmen 11 Na onal Average SAT Compared to Entering Freshmen 11 Average ACT for all Entering Freshmen 12 Na onal Average ACT Compared to Entering Freshmen 12 Overall University Sta s cs 13‐34 Enrollment by Gender 13 Enrollment Ethnicity 13 Enrollment by Division 13 Enrollment by Gender and Division 13 Fall 2015 Undergraduate Day Enrollment by Religious Affilia on 14 Enrollment by Division and Full ‐Time and Part‐Time, and Gender 15 Enrollment Percentage by Gender and Ethnicity 15 Total Headcount Enrollment 16 Headcount of Enrolled UG Day and Evening 16 Headcount of Master’s Enrollment 17 Headcount of Professional Doctorate Enrollment 17 Orlando Campus Enrollment 18 Full‐Time Equivalent Student Trends 18 Fall 2015 Faculty Demographics 19 Full‐Time Faculty Compared to Enrollment 19 Fall 2015 Undergraduate Degree ‐Seeking Fall 2015 Undergraduate Class Size 20 Fall 2015 Undergraduate Student to Faculty Ra o 20 Enrollment by Classifica on and Major 21‐22 Fall 2015 Graduate Degree‐Seeking Enrollment by Major 23 Undergraduate Degree‐Seeking Enrollment by Major in Falls 2011 ‐2015 24‐26 Graduate Degree‐Seeking Enrollment by Majors in Falls 2011 ‐2015 27 Five‐Year Trend of Total Credit Hours Taught by School 28 Permanent Residence of Fall 2015 New Day UG and Transfers in the United States 29 Permanent Residence of Fall 2015 Undergraduate Students in the United States 29 Fall 2015 Tradi onal Day Undergraduates from Florida 30 Fall 2015 Tradi onal Day Undergraduates by State and Country 31 Degrees Conferred by CIP Category 32 PBA Graduates Who Par cipated in Experien al Learning 2012‐13 to 2014‐15 33 Cohort default rate 34 3
PBA Facts
Palm Beach Atlan c University is a comprehensive, interdenomina onal Chris an university founded in 1968. PBA’s main campus is located in downtown West Palm Beach, Florida.

Academic Profile
Academic Programs:
Campuses in West Palm Beach, Orlando, Wellington, and online
48 undergraduate majors
Evening undergraduate degree programs in ministry, organiza onal management, and psychology (on campus and online)
Graduate degree programs in business administra on, counseling (specializa ons in addic on counseling, marriage, couple and family counseling, mental health counseling, school guidance counseling and counseling generalist [non licensure]), divinity, leadership (on campus and online), and nursing
Professional degree programs in nursing prac ce, and pharmacy
Degrees offered: A.A., B.A., BGS, B.S., B.Mus., BSN, D.N.P., M.B.A., M. Div., M. Div./M.B.A., M.S., M.S.N., Pharm.D., and Pharm.D./M.B.A.
288,000+ library volumes (books and audio‐visual material)
Interna onal study available in Argen na, Austria, Belgium, Brazil, China, Chile, Costa Rica, Ecuador, France, Germany, Greece, India, Italy, Japan, Jordan, Mexico, Morocco, New Zealand, South Asia, Spain, Uganda, and the United Kingdom.
Accredita on
Palm Beach Atlan c University is accredited by the Southern Associa on of Colleges and Schools Commission on Colleges (SACSCOC) to award following degrees: associate’s, bachelor’s, master’s, doctor of pharmacy, and doctor of nursing prac ce. For ques ons about the accredita on of Palm Beach Atlan c University, contact the Commission on Colleges at: 1866 Southern Lane, Decatur, GA 30033‐4097 or call (404) 679‐4500. You may also visit www.sacscoc.org Persons wishing to review documents related to the accredita on of Palm Beach Atlan c University should contact the Office of Accredita on, Assessment, and Research at (561) 803‐2050.
Palm Beach Atlan c University has received specialized accredita on, cer fica on, or licensure from the following organiza ons:
Accredita on Council for Pharmacy Educa on (ACPE)
The Palm Beach Atlan c University Lloyd L. Gregory School of Pharmacy Doctor of Pharmacy program is ac‐credited by the Accredita on Council for Pharmacy Educa on (ACPE), 135 S. LaSalle Street, Suite 4100, Chicago, IL 60603‐4810; (312) 664‐3575; FAX (312) 664‐4652, website www.acpe‐accredit.org.
Associa on of Chris an Schools Interna onal (ACSI)
Commission on Accredita on of Athle c Training Educa on (CAATE)
Commission on Collegiate Nursing Educa on (CCNE)
The Bachelor of Nursing at Palm Beach Atlan c University is accredited by the Commission on Collegiate Nursing Educa on (CCNE), One Dupont Circle, NW, Suite 530, Washington, DC 20036; (202) 887‐6791.
Florida Board of Nursing
Florida Department of Educa on (FLDOE)
Interna onal Assembly for Collegiate Business Educa on (IACBE)
Palm Beach Atlan c University has received specialized accredita on for its business programs through the Interna onal Assembly for Collegiate Business Educa on (IACBE), 11374 Strang Line Road in Lenexa, Kansas, USA. The business programs in the following degrees are accredited by the IACBE: Master of Business Admin‐istra on and Bachelor of Science in: Accoun ng, Finance, Interna onal Business, Management, and Marke ng.
Na onal Associa on of Schools of Music (NASM)

4
Palm Beach Atlan c University is an accredited ins tu onal member of the Na onal Associa on of Schools of Music located at 11250 Roger Bacon Drive, Suite 21, Reston, Virginia 20190‐5248. Telephone: (703) 437‐0700, Facsimile: (703) 437‐6312.
Na onal Strength and Condi oning Associa on (NSCA)
Enrollment ‐ Fall 2015
Total 3,918:
2,226 tradi onal day (West Palm Beach)
372 evening adult (West Palm Beach, Wellington, Orlando and online)
520 master’s (West Palm Beach, Wellington, Orlando and online)
293 full‐ me and 21 part‐ me (300 FTE) professional in pharmacy
43 professional in nursing prac ce
443 dual‐enrolled students
1,250 residen al students
15,000+ alumni
Faculty
Undergraduate student‐faculty ra o: 13 to 1
Average class size for the undergraduate day program: 18
89% of undergraduate classes have fewer than 30 students
82% of full‐ me teaching faculty hold the highest degree in their field
174 full‐ me faculty
Financial Data
Undergraduate annual tui on: $26,750
Evening undergraduate tui on: $410‐$460 per credit hour
Graduate tui on: $525‐$565 per credit hour
Doctor of nursing prac ce tui on: $750 per credit hour
Pharmacy annual tui on: $35,010
98% of all degree‐seeking students receive some form of financial aid or 99% of all undergraduate day students
$94 million opera ng budget
$80.1 million endowment
$371 million local economic impact
Technology
Wireless access in all residence hall rooms
Computer labs in classroom buildings, residence halls, and library
State‐of‐the‐art computer labs on Wellington and Orlando campuses
Sailfish TV campus cable system and digital signage network
Campus Organiza ons
Member of the Na onal Collegiate Athle c Associa on (NCAA) Division II
School Colors: blue and white; School Mascot: Sailfish
Five men’s intercollegiate sports: Baseball, Basketball, Golf, Soccer, and Tennis
Seven women’s intercollegiate sports: Basketball, Cross Country, Golf, Soccer, So ball, Tennis, and Volleyball
Vibrant intramural program
70+ student music and theatre performances annually
Student newspaper (The Beacon)
Opportuni es for involvement and leadership in 60+ social, professional, and religious clubs and organiza ons
5
PBA Values: Accountability, Excellence, Integrity, Love, Respect, Unity
2015‐2016 PBA Theme: Press On to the Goal
“I press on toward the goal to win the prize for which God has called me heavenward in Christ Jesus.
American Free Enterprise
‐Philippians 3:14
Palm Beach Atlan c University confidently affirms the values and ins tu ons that historically have informed American society— religious liberty; tradi onal Judeo‐Chris an morality; limited, cons tu onal government; the Rule of Law; personal and poli cal accountability; and capitalism—the system of free enterprise. We believe that America is truly an excep onal na on, which was founded and has flourished under the guiding providen al hand of God. We aim to develop in each of our students an apprecia on for the unique American achievement in its many dimensions—social, poli cal, economic, moral, legal, and religious.
Our general educa on curriculum, required of all students, includes a course en tled “Freedom in American Society,” which examines the meaning and significance of freedom in the American experience. Students explore such topics as the historical roots of American liberty, with special emphasis on the close link between liberty and Chris anity, and the nature of freedom as understood by the chief architects of the American poli cal order. They examine the interdependence between poli cal and economic freedom, in par cular, the signifi‐cance of free‐enterprise capitalism for the preserva on of liberty. They learn about the structure of American cons tu onal democracy and the tradi onal meaning of jus ce and the Rule of Law.
These studies help students recognize the various threats to individual freedom, religious liberty, and other tradi onal American rights and values that have emerged over the past several centuries, as well as contemporary challenges to their preserva on.
Cicero remarked of the declining Republic of his era: “Our age . . . inherited the Republic like some beau ful pain ng of bygone days, its colors already fading through great age; and not only has our me neglected to freshen the colors of the picture, but we have failed to preserve its form and outlines.” Palm Beach Atlan c University strives to ensure that a similar fate does not befall the noble American experiment in ordered liberty. We regard the transmission of the American cultural heritage to the rising gen‐era on as not only a profound joy, but also a profound duty.
Guiding Principles
(These principles were adopted by the University’s founders and they serve as the preamble to the PBA bylaws.)
Palm Beach Atlan c University is a comprehensive Chris an university with a core emphasis in the liberal arts. Its purpose is to offer a curriculum of studies and a program of student ac vi es dedicated to the development of moral character, the enrichment of spiritual lives, and the perpetua on of growth in Chris an ideals.
Founded under the providence of God with the conviction that there is a need for a university in this community that will expand the minds, develop the moral character, and enrich the spiritual lives of all the people who may come within the orbit of its influ‐ence, Palm Beach Atlantic University shall stand as a witness for Jesus Christ, expressed directly through its administration, facul‐ty, and students.
To assure the perpetuation of these basic concepts of its founders, it is resolved that all those who become associated with Palm Beach Atlantic as trustees, officers, and members of the faculty or of the staff must believe in the divine inspiration of the Bible, both the Old and New Testaments, that man was directly created by God; that Jesus Christ was born of a virgin; that He is the Son of God, our Lord and Savior; that He died for the sins of all men and thereafter arose from the grave; that by repentance and the acceptance of and belief in Him, by the grace of God, the individual is saved from eternal damnation and receives eternal life in the presence of God; and it is further resolved that the ultimate teachings in the University shall always be consistent with these principles.
Statement of Purpose
PBA is a Chris an university which equips students to lead fulfilling lives through learning, leadership, and service.
Vision
The vision for Palm Beach Atlan c University is to be a premier Chris an university whose graduates are intellectually pre‐pared, possess high moral character, demonstrate outstanding ci zenship and are servant leaders in their communi es, the na on, and the world.
6
Mission
The mission of Palm Beach Atlan c University is to prepare students for lifelong learning and leadership by offering excel‐lent undergraduate, graduate, and professional programs of study in Arts, Humani es, Sciences, and selected professions.
Palm Beach Atlan c University is a private, independent university dedicated to the inten onal integra on of Chris an principles. As a community of learners, the university provides students with a rigorous educa onal environment that leads to intellectual, spiritual, and personal character development.
Workship: A Tradi on of Service
Workship is a dis nc ve community service program that responds to the human needs with Christ‐like ac on in the community and the world. Through community service, students can discern their voca on and develop life‐long habit of servant leadership. To date, Palm Beach Atlan c students have volunteered more than 2.9 million hours. Ins tuted when PBA was founded in 1968, each tradi onal undergraduate student contributes at least 45 hours of community service annually at more than 350 nonprofit agencies, schools and churches.
Contact us:
Palm Beach Atlan c University
901 S. Flagler Drive
P.O. Box 24708
West Palm Beach, Florida 33416‐4708
Telephone: (561) 803‐2000
www.pba.edu
Admissions Contact Informa on:
Telephone: (561) 803‐2100
Toll‐Free Telephone: (888) 468‐6722
Facsimile: (561) 803‐2115
admit@pba.edu
Online applica on link: h ps://www.pba.edu/apply‐online
7
First-Time, Full-Time Freshmen Statistics 2015-16
Enrollment by Gender Enrollment by Ethnicity Percent Distribution by Gender in Fall 2015 Percent Distribution by Ethnicity in Fall 2015 Freshmen Living on Campus Number in Supper Honors
Female 65% (354) Male 35% (193) Female Male 547 Enrolled First-Time, Full-Time Freshmen 69.10% (378) 15.72% (86) 4.75% (26) 3.47% (19) 3.47% (19) 2.01% (11) 0.91% (5) 0.37% (2) 0.18% (1) White Hispanics of any race Black or African American Nonresident Alien Two or more races Asian American Indian or Alaska Native Race and Ethnicity unknown Native Hawaiian or Other Pacific Islander 26 28 35 34 72 50 34 09-10 10-11 11-12 12-13 13-14 14-15 15-16 Baxter Hall 31% (139) Oceanview Hall 30% (136) Johnson Hall 18% (79) Rinker Hall 17% (75) Weyenberg Hall 4% (19) 8
First-Time, Full-Time Freshmen Statistics 2015-16
Number of Athletes Enrollment by Religious Affiliation *This category includes all responses with fewer than five in a group along with the students who have chosen the religion "other."
Enrollment by State of Permanent Residence 58 46 48 43 52 53 52 09-10 10-11 11-12 12-13 13-14 14-15 15-16 Non-Denominational 177 Baptist 114 Catholic 63 Other* 33 Presbyterian 25 Methodist 19 Evangelical Free Church 18 Lutheran 15 Christian Reformed 12 Christian Missionary Alliance 11 Church of Christ 11 Protestant 11 Church of God 10 Pentecostal 9 Assemblies of God 8 Unknown 6 Wesleyan 5 547 Florida 289 New Jersey 26 International 20 Minnesota 15 Illinois 14 Pennsylvania 14 Maryland 14 Michigan 14 New York 13 North Carolina 12 Indiania 11 Connecticut 11 Georgia 10 Ohio 10 Texas 7 Massachusetts 7 Delaware 7 Wisconsin 6 Colorado 5 California 4 Rhode Island 4 Missouri 4 Iowa 4 Virginia 3 Kentucky 3 Maine 3 South Carolina 3 Kansas 2 Washington 2 Arizona 2 Tennessee 2 New Hampshire 2 Nevada 1 Alabama 1 Oregon 1 Vermont 1 547 9
First-Time, Full-Time Freshmen Statistics
Trends on New Undergraduate Day and Transfer Enrollment
Graduation Rate Trends of First-Time Freshmen by Cohort
393 452 424 422 445 476 439 578 523 547 224 220 183 235 227 211 205 205 209 200 70% 69% 69% 64% 72% 68% 73% 74% 75% 0% 10% 20% 30% 40% 50% 60% 70% 80% 0 100 200 300 400 500 600 700 800 900 2006 = 617 2007 = 672 2008 = 607 2009 = 657 2010 = 672 2011 = 687 2012 = 644 2013 = 783 2014 = 732 2015 = 747 First-Time, Full-Time Freshmen New Undergraduate Day Transfers Freshman to Sophomore Retention Rate 52% 51% 54% 58% 51% 48% 55% 44% 52% 55% 52% 59% 51% 47% 55% 2002 2003 2004 2005 2006 2007 2008 2009 C o h o r t Bachelor's Degree Seeking Grad Rate Overall Grad Rate 10
SAT - PBA and National Averages Average SAT for all Entering Freshmen Trend of National Average SAT Scores Compared to Average Scores for All Entering Freshmen at PBA 1087 1090 1079 1036 1047 1039 1054 1058 1041 1061 2006-07 2007-08 2008-09 2009-10 2010-11 2011-12 2012-13 2013-14 2014-15 2015-16 1021 1006 1087 1061 960 980 1000 1020 1040 1060 1080 1100 2006 2007 2008 2009 2010 2011 2012 2013 2014 2015 SAT National Avg (Verbal & Math) PBA Average (Verbal & Math) 11
ACT - PBA and National Averages Average ACT for all Entering Freshmen Trend of National Average ACT Scores Compared to Average Scores for All Entering Freshmen at PBA 23 23 23 22 23 23 23 24 24 24 2006-07 2007-08 2008-09 2009-10 2010-11 2011-12 2012-13 2013-14 2014-15 2015-16 21 21 23 24 18 19 20 21 22 23 24 25 2006 2007 2008 2009 2010 2011 2012 2013 2014 2015 ACT National Composite PBA Average Composite 12
Fall 2015 University Enrollment Statistics
University Enrollment by Gender University Enrollment by Ethnicity University Enrollment by Division University Enrollment by Gender and Division Gregory School of Pharmacy enrolled 293 full-time and 21 part-time (300 FTE) students in pharmacy. The Doctor of Nursing Practice enrolled 37 females and six males in fall 2015-16. Pharmacy has 300 FTE enrolled.
Male, 1421, 36% Female, 2497, 64% Male Female UG Traditional, 2226, 64.06% Master's, 408, 11.74% Pharmacy, 314, 9.04% UG Evening, 267, 7.68% Orlando, 217, 6.24% DNP, 43, 1.24% 2317, 59.1% 676, 17.3% 493, 12.6% 153, 3.9% 2.8% 2.9% 0.8% 0.4% 0.3% White Hispanics of any race Black or African American Nonresident Alien Asian Two or more races Race and Ethnicity unknown American Indian or Alaska Native 3,918 Enrolled Students 785 141 133 96 58 6 1441 267 181 171 159 37 UG Traditional Master's Pharmacy UG Evening Orlando Doctor of Nursing Practice Male Female 13
Fall 2015 University Enrollment Statistics
Men Women Men Women Degree-seeking, first-time freshmen 193 354 2 2 Other first-year, degree-seeking 93 177 14 10 All other degree-seeking 552 1,049 55 87 Total degree-seeking 838 1,580 71 99 All other undergraduates enrolled in credit courses 0 0 207 244 Total undergraduates 838 1,580 278 343 Degree-seeking, first-time 75 152 7 7 All other degree-seeking 203 358 19 50 All other graduates enrolled in credit courses 0 2 1 5 Total graduate 278 512 27 62 3,039 879 GRAND TOTAL 3,918 Enrollment Percentage by Gender and Ethnicity
Total all graduate FULL-TIME PART-TIME Undergraduates Graduates Total all undergraduates 59 19 13 3 3 2 1 0 0 60 15 11 5 3 3 1 1 1 80 60 40 20 0 20 40 60 80 100 White Hispanics of any race Black or African-American Nonresident Alien Two or more races Asian Race and Ethnicity unknown American Indian or Alaska Native Native Hawaiian or Other Pacific Islander Percent
14
% Male % Female
Fall 2015 Traditional Undergraduate Day Enrollment by Religious Affiliation
Religion Count Religion Count Religion Count African Methodist Episcopal 1 Islam 5 Reformed 19 Anglican 6 Jewish 3 Salvation Army 1 Brethren 7 Church of God 44 Seventh Day Adventist 8 Buddhist 1 Lutheran Brethren 4 United Church of Christ 1 Christian Missionary Alliance 32 Mennonite 2 Unknown 35 Christian Science 2 Messianic Judaism 3 Wesleyan 10 Congregational 7 Muslim 2 Grand Count 277 Disciples of Christ 5 Nazarene 6 Episcopalian 17 No Religion 17 Four Square 2 Other 33 Hindu 3 Quaker 1
Affiliations Comprising the
Category 689 440 293 277 92 71 58 54 54 54 51 48 45 Non-Denominational Baptist Catholic Other* Presbyterian Methodist Evangelical Free Church Assembly of God Pentecostal Christian Reformed Church Church of Christ Lutheran Protestant 15
*Religious
"Other"
Institutional Enrollment Trends
Total Headcount Enrollment Main Campus Day and Evening Undergraduate Headcount Enrollment 1,965 1,947 1,892 1,869 1,889 1,921 1,917 2,094 2,170 2,226 483 501 443 475 429 361 333 310 324 267 06-07 07-08 08-09 09-10 10-11 11-12 12-13 13-14 14-15 15-16 Day UG Evening UG 3264 3291 3211 3260 3659 3663 3579 3764 3865 3918 06-07 07-08 08-09 09-10 10-11 11-12 12-13 13-14 14-15 15-16 16
Institutional Enrollment Trends Doctoral Programs Headcount Enrollment 321 337 361 396 385 390 381 431 410 408 06-07 07-08 08-09 09-10 10-11 11-12 12-13 13-14 14-15 15-16 319 300 303 311 301 310 308 315 310 343 06-07 07-08 08-09 09-10 10-11 11-12 12-13 13-14 14-15 15-16 17
Masters Programs Headcount Enrollment
Institutional Enrollment Trends
Orlando Campus Undergraduate and Graduate Headcount Enrollment
Full-time Equivalent (FTE) Students
100 146 138 119 132 127 139 131 124 113 76 60 74 90 108 103 102 105 99 104 06-07 07-08 08-09 09-10 10-11 11-12 12-13 13-14 14-15 15-16 Orlando GR Orlando UG 2,991 2,967 2,897 2,960 3,128 3,099 3,054 3,247 3,316 3,444 06-07 07-08 08-09 09-10 10-11 11-12 12-13 13-14 14-15 15-16 18
Fall 2015 Faculty Demographics
Total number of instructional faculty
Total number who are members of minority groups
Total number who are women
Total number who are men
Total number who are nonresident aliens (international)
Total number with doctorate, or other terminal degree
Total number whose highest degree is a master's degree but not a terminal master's degree
Total number whose highest degree is a bachelor's
Total number whose highest degree is unknown or other (Note: Items f, g, h, and i must sum up to item a.)
Total number in stand-alone graduate/ professional programs in which faculty teach virtually only graduate-level students
Full-Time Faculty Compared to Degree-Seeking Enrollment
Full-Time Part-Time Total 174 191 365 23 35 58 81 96 177 93 95 188 7 3 10 142 89 231 30 88 118 2 11 13 0 3 3 35 22 57
159 167 155 159 155 156 165 162 163 174 3264 3291 3211 3260 3244 3212 3180 3386 3437 3475 2000 2200 2400 2600 2800 3000 3200 3400 3600 90 100 110 120 130 140 150 160 170 180 06-07 07-08 08-09 09-10 10-11 11-12 12-13 13-14 14-15 15-16 Full-Time Faculty Total Degree-Seeking Enrollment 19
Fall 2015 Undergraduate Class Size
Class Sections
Class Subsections
Average Class Size
Student to Faculty Ratio
Class Sections: A class section is an organized course offered for credit, identified by discipline and number, meeting at a stated time or times in a classroom or similar setting, and not a subsection such as a laboratory or discussion session. Undergraduate class sections are defined as any sections in which at least one degreeseeking undergraduate student is enrolled for credit. Exclude distance learning classes and noncredit classes and individual instruction such as dissertation or thesis research, music instruction, or one-to-one readings. Exclude students in independent study, co-operative programs, internships, foreign language taped tutor sessions, practicums, and all students in one-on-one classes. Each class section should be counted only once and should not be duplicated because of course catalog cross-listings.
Class Subsections: A class subsection includes any subsection of a course, such as laboratory, recitation, and discussion subsections that are supplementary in nature and are scheduled to meet separately from the lecture portion of the course. Undergraduate subsections are defined as any subsections of courses in which degreeseeking undergraduate students enrolled for credit. As above, exclude noncredit classes and individual instruction such as dissertation or thesis research, music instruction, or one-to-one readings. Each class subsection should be counted only once and should not be duplicated because of cross-listings.
2-9 10-19 20-29 30-39 40-49 50-99 100+ Total 126 283 178 58 12 12 0 669 26 44 21 0 0 0 0 91 760 18 13 to 1 Grand Total
20
Fall 2015 Undergraduate Degree-Seeking Enrollment by Classification and Major
FR SO JR SR School of Arts and Sciences BIE Biology/Secondary Education 13.1322 0 0 0 1 1 BIO Biology 26.0101 82 59 47 41 229 CMR Computer Science 11.0701 12 9 6 6 33 ENG English 23.0101 8 10 8 4 30 ESE English/Secondary Education 13.1305 4 4 4 3 15 EXP Exploratory 47 6 1 0 54 FOR Forensic Science 40.0510 11 4 1 4 20 HIS History 54.0101 6 2 4 12 24 IDS Interdisciplinary Studies 30.9999 0 0 0 1 1 MAT Mathematics 27.0101 6 3 5 4 18 MBC Medicinal and Biological Chemistry 40.0599 34 16 19 24 93 MCMR Mathematics and Computer Science Dual Major 30.0801 1 0 0 2 3 MSE Mathematics/Secondary Education 13.1311 2 0 1 0 3 PEN Pre-Engineering 14.0101 1 0 1 0 2 PHL Philosophy 38.0101 1 1 2 1 5 PLS Political Science 45.1001 5 3 3 6 17 PLW Pre-Law 22.0001 13 7 4 2 26 Total 233 124 106 111 574 Rinker School of Business ACG Accounting 52.0301 8 18 17 14 57 BUI International Business 52.1101 26 17 13 17 73 BUM Management 52.0201 56 32 40 31 159 BUR Marketing 52.1401 23 21 13 18 75 FIN Finance 52.0801 19 11 13 14 57 Total 132 99 96 94 421 School of Communication and Media CNTV Cinema Television 50.0602 10 10 5 10 35 COM Communication 09.0101 21 30 22 20 93 CPR Public Relations 09.0902 4 17 7 8 36 JRN Journalism 09.0401 11 4 4 4 23 THE Theatre Arts 50.0501 17 9 6 9 41 Total 63 70 44 51 228 School of Education and Behavioral Studies AXT Athletic Training/Concentration in Exercise Science 51.0913 29 7 7 5 48 BGS General Studies 24.0102 0 1 5 7 13 ELE Elementary Education 13.1202 43 28 18 38 127 EXS Exercise Science 31.0505 22 16 16 9 63 HPS Human Performance and Sport 36.0108 6 10 8 12 36 PHE Physical Education Teaching (K-12) 13.1314 3 2 3 6 14 PSY Psychology 42.0101 54 32 44 36 166 Total 157 96 101 113 467 Major Code Description CIP Code Total UG Undergraduate 21
Fall 2015 Undergraduate Degree-Seeking Enrollment by Classification and Major
FR SO JR SR Major Code Description CIP Code Total UG Undergraduate School of Music and Fine Arts AED Art Education (K-12) 13.1302 0 1 2 2 5 ART Art 50.0702 0 1 0 3 4 DAN Dance 50.0301 7 3 3 3 16 EDM Music Education (K-12) 13.1312 5 1 6 8 20 GDS Graphic Arts 50.0409 9 8 4 13 34 MCP Music Composition 50.0904 1 1 4 2 8 MIP Music Instrument Performance 50.0903 1 0 1 0 2 MKP Music Keyboard Performance 50.0907 0 0 1 0 1 MUS Music 50.0901 3 8 3 5 19 MVP Music Voice Performance 50.0908 2 1 3 2 8 POP Popular Music 50.0999 3 5 5 8 21 Total 31 29 32 46 138 MacArthur School of Leadership ORM Organizational Management 52.1003 19 21 33 47 120 PSY Psychology 42.0101 11 12 24 39 86 Total 30 33 57 86 206 School of Ministry BIB Biblical and Theological Studies 39.0201 12 8 11 7 38 CCS Cross-Cultural Studies 39.0301 11 16 13 11 51 MIND Ministry - Day UG 39.0601 21 20 17 18 76 MIN Ministry - Evening UG 39.0601 17 8 10 23 58 Total 61 52 51 59 223 School of Nursing NUR Nursing 51.3801 8 6 35 67 116 PRN Pre-Nursing 51.1601 59 41 10 1 111 Total 67 47 45 68 227 Orlando Campus MIN Ministry 39.0601 7 1 2 4 14 ORM Organizational Management 52.1003 12 10 9 19 50 PSY Psychology 42.0101 13 4 8 14 39 Total 32 15 19 37 103 PBA GRAND TOTAL 806 565 551 665 2587 22
Fall 2015 Graduate Degree-Seeking Enrollment by Major
Rinker School of Business BUS Business Administration 52.0201 99 Total 99 School of Education and Behavioral Studies CPY Graduate Counseling 51.1501 198 Total 198 MacArthur School of Leadership LDR Leadership 52.0213 67 Total 67 School of Ministry MDIV Master of Divinity 39.0601 37 Total 37 School of Nursing DNP Doctor of Nursing Practice 51.3818 43 Total 43 Orlando Campus CPY Graduate Counseling 51.1501 98 LDR Leadership 52.0213 14 Total 112 Gregory School of Pharmacy PHR Pharmacy 51.2001 300* PHMBA Pharmacy/MBA 51.2099 3 Total 303 PBA GRAND TOTAL 859
Major Code Description CIP Code GR 23
* This number indicates FTE students
Undergraduate Degree-Seeking Enrollments
by Classification and Major from Falls 2011 through 2015
2011 2012 2013 2014 2015 School of Arts and Sciences BIE Biology/Secondary Education 13.1322 3 2 5 4 1 BIO Biology 26.0101 138 166 182 227 229 CMR Computer Science 11.0701 16 22 23 29 33 ENG English 23.0101 28 27 26 21 30 ESE English/Secondary Education 13.1305 13 10 11 14 15 EXP Exploratory 56 53 54 FOR Forensic Science 40.0510 3 5 14 15 20 HIS History 54.0101 16 22 28 25 24 IDS Interdisciplinary Studies 30.9999 3 0 1 1 1 MAT Mathematics 27.0101 12 14 17 13 18 MBC Medicinal and Biological Chemistry 40.0599 121 117 118 109 93 MCS Mathematics and Computer Science Dual Major 30.0801 1 3 MSE Mathematics/Secondary Education 13.1311 6 1 5 3 3 PEN Pre-Engineering 14.0101 5 4 5 3 2 PHL Philosophy 38.0101 9 9 10 8 5 PLS Political Science 45.1001 32 21 18 15 17 PLW Pre-Law 22.0001 24 18 27 22 26 Total 429 438 445 563 574 Rinker School of Business ACG Accounting 52.0301 31 37 42 47 57 BUI International Business 52.1101 54 47 57 75 73 BUM Management 52.0201 127 123 164 148 159 BUR Marketing 52.1401 60 57 57 68 75 FIN Finance 52.0801 25 27 33 47 57 Total 297 291 353 385 421 School of Communication and Media CINF Film Production 50.0602 1 COM Communication 09.0101 75 63 72 97 93 CPR Public Relations 09.0902 9 16 38 36 CTV Cinema Television 50.0602 40 36 37 44 35 JRN Journalism 09.0401 37 25 20 26 23 MUT Musical Theatre 50.0599 1 SPC Communication-Speech 09.0101 0 1 THE Theatre Arts 50.0501 52 46 44 41 41 Total 206 180 189 246 228 Major Code Description CIP Code Fall Semester Enrollment Counts 24
Undergraduate Degree-Seeking Enrollments by Classification and Major from Falls 2011 through 2015
2011 2012 2013 2014 2015 Major Code Description CIP Code Fall Semester Enrollment Counts School of Education and Behavioral Studies AXT Athletic Training/Concentration in Exercise Science 51.0913 42 43 54 56 48 BGS General Studies 24.0102 1 7 8 13 ELE Elementary Education 13.1202 107 115 111 127 127 EXS Exercise Science 31.0505 14 63 HPS Human Performance and Sport 36.0108 11 36 PHE Physical Education Teaching (K-12) 13.1314 44 52 65 38 14 PSY Psychology 42.0101 186 163 171 169 166 Total 379 374 408 423 467 School of Music and Fine Arts AED Art Education (K-12) 13.1302 8 8 10 6 5 ART Art 50.0702 4 7 14 7 4 DAN Dance 50.0301 29 35 23 25 16 EDM Music Education (K-12) 13.1312 21 17 25 24 20 GDS Graphic Arts 50.0409 60 44 39 37 34 MCM Church Music 39.0501 0 3 1 MCP Music Composition 50.0904 6 5 10 8 8 MIP Music Instrument Performance 50.0903 5 3 2 1 2 MKP Music Keyboard Performance 50.0907 1 2 1 2 1 MUS Music 50.0901 22 17 21 19 19 MVP Music Voice Performance 50.0908 11 15 15 11 8 POP Popular Music 50.0999 17 21 26 18 21 Total 184 177 187 158 138 MacArthur School of Leadership ORM Organizational Management 52.1003 299 229 178 171 120 PSY Psychology 42.0101 23 51 83 86 Total 299 252 229 254 206 School of Ministry BIB Biblical and Theological Studies 39.0201 43 43 36 36 38 CCS Cross-Cultural Studies 39.0301 42 32 42 40 51 CSM Christian Social Ministry 39.0301 9 4 5 1 MIND Ministry - Day UG 39.0601 29 61 73 79 76 MIN Ministry - Evening UG 39.0601 57 77 76 67 58 MLS Ministry Leadership Studies 39.0601 17 8 3 Total 197 225 235 223 223 School of Nursing NUR Nursing 51.3801 96 104 108 108 116 PRN Lower Division Nursing 51.1601 96 100 141 125 111 Total 192 204 249 233 227 25
Undergraduate
Degree-Seeking Enrollments by Classification and Major from Falls 2011 through 2015
2011 2012 2013 2014 2015 Major Code Description CIP Code Fall Semester Enrollment Counts Orlando Campus MIN Ministry 39.0601 30 33 30 22 14 ORM Organizational Management 52.1003 52 39 37 36 50 PSY Psychology 42.0101 21 30 38 41 39 Total 103 102 105 99 103 PBA GRAND TOTAL 2286 2243 2400 2584 2587 26
Graduate Degree-Seeking
Enrollments by Classification and Major from Falls 2011 through 2015
2011 2012 2013 2014 2015 Rinker School of Business BUS Business Administration 52.0201 125 125 105 106 99 Total 125 125 105 106 99 School of Education and Behavioral Studies CADD Addictions Counseling 51.0913 6 5 1 3 2 CGCS General Counseling Studies 24.0102 N/A 7 10 9 6 CMF Marriage and Family Counseling 13.1202 13 6 4 5 3 CMH Mental Health Counseling 31.0505 153 160 182 173 166 CSC School Counseling 36.0108 28 24 21 18 21 Total 200 202 218 208 198 MacArthur School of Leadership LDR Leadership 52.0213 63 47 80 61 67 Total 63 47 80 61 67 School of Nursing DNP Doctor of Nursing Practice 51.3818 43 Total 43 School of Ministry MDIV Master's of Divinity 39.0601 19 29 37 Total 19 29 37 Orlando Campus CGCS General Counseling Studies 39.0601 3 1 3 LDR Leadership 52.0213 21 26 19 14 14 CMF Marriage and Family Counseling 13.1202 19 34 24 23 22 CMH Mental Health Counseling 52.1003 76 75 72 73 61 CSC School Counseling 42.0101 8 4 11 11 12 Total 124 139 129 122 112 Gregory School of Pharmacy PHR Pharmacy 51.2001 308 307 311 307 300 PHMBA Pharmacy/MBA 51.2099 2 1 4 3 3 Total 310 308 315 310 303 PBA GRAND TOTAL 822 821 866 836 859 Major Code Description CIP Code Fall Semester Enrollment Counts 27
Five Year Trend of Total Credit Hours Taught (Fall Semester)
School of Arts and Sciences 11,494 11,653 12,961 13,638 13,894 21% Rinker School of Business 3,574 3,774 3,881 4,382 4,677 31% School of Communication and Media 3,092 2,759 2,776 3,247 3,190 3% School of Education and Behavioral Studies 5,990 6,179 6,662 6,237 6,544 9% School of Ministry 3,369 3,103 4,077 4,049 4,119 22% School of Music and Fine Arts 2,777 2,381 2,444 2,187 1,974 -29% School of Nursing 1,414 1,520 1,559 1,501 2,034 44% MacArthur School of Leadership 4,879 4,118 3,937 3,969 3,315 -32% Orlando Campus 2,277 2,297 2,263 2,091 2,001 -12% Gregory School of Pharmacy 5,446 5,353 5,457 5,286 5,179 -5% Student Development 487 491 576 547 562 15% Total 44,799 43,628 46,593 47,134 47,489 6% School of Arts and Sciences 26% 27% 28% 29% 29% Rinker School of Business 8% 9% 8% 9% 10% School of Communication and Media 7% 6% 6% 7% 7% School of Education and Behavioral Studies 13% 14% 14% 13% 14% School of Ministry 8% 7% 9% 9% 9% School of Music and Fine Arts 6% 5% 5% 5% 4% School of Nursing 3% 3% 3% 3% 4% MacArthur School of Leadership 11% 9% 8% 8% 7% Orlando Campus 5% 5% 5% 4% 4% Gregory School of Pharmacy 12% 12% 12% 11% 11% Student Development 1% 1% 1% 1% 1%
Credit Hours Taught by School School 2011 2012 2013 2014 2015 5-Year Change Percentage of Credit Hours Taught by School School 2011 2012 2013 2014 2015 28
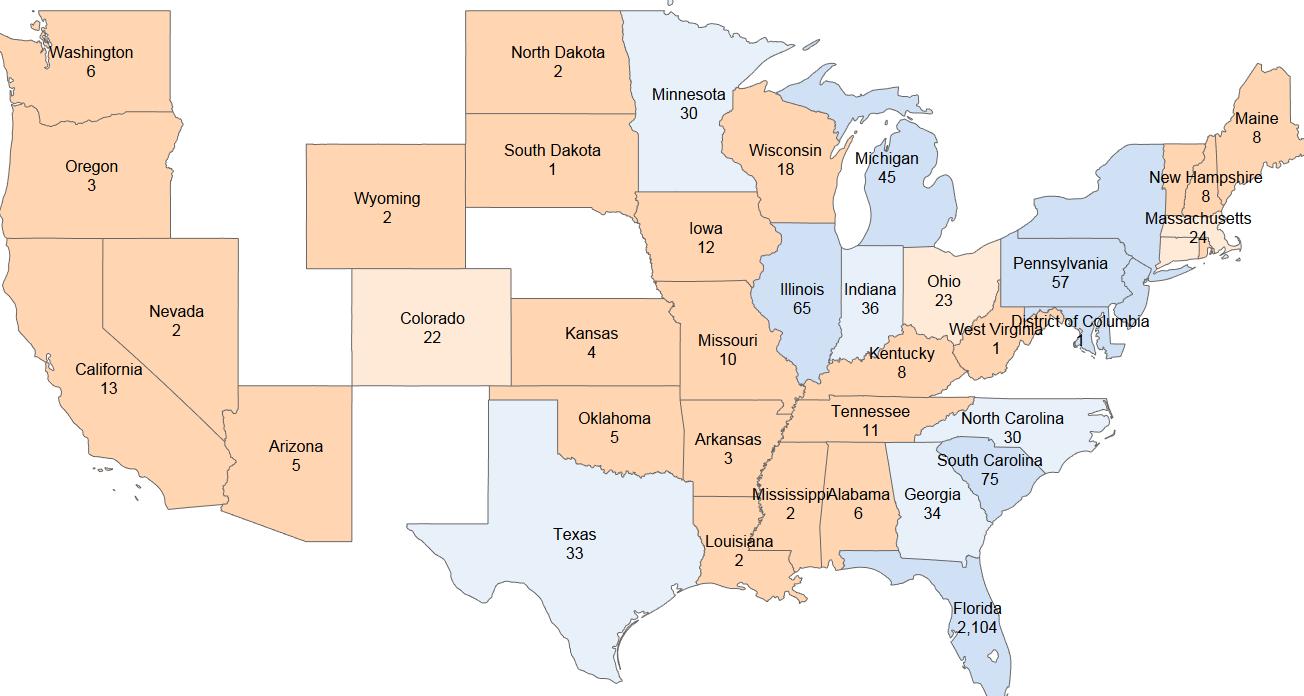
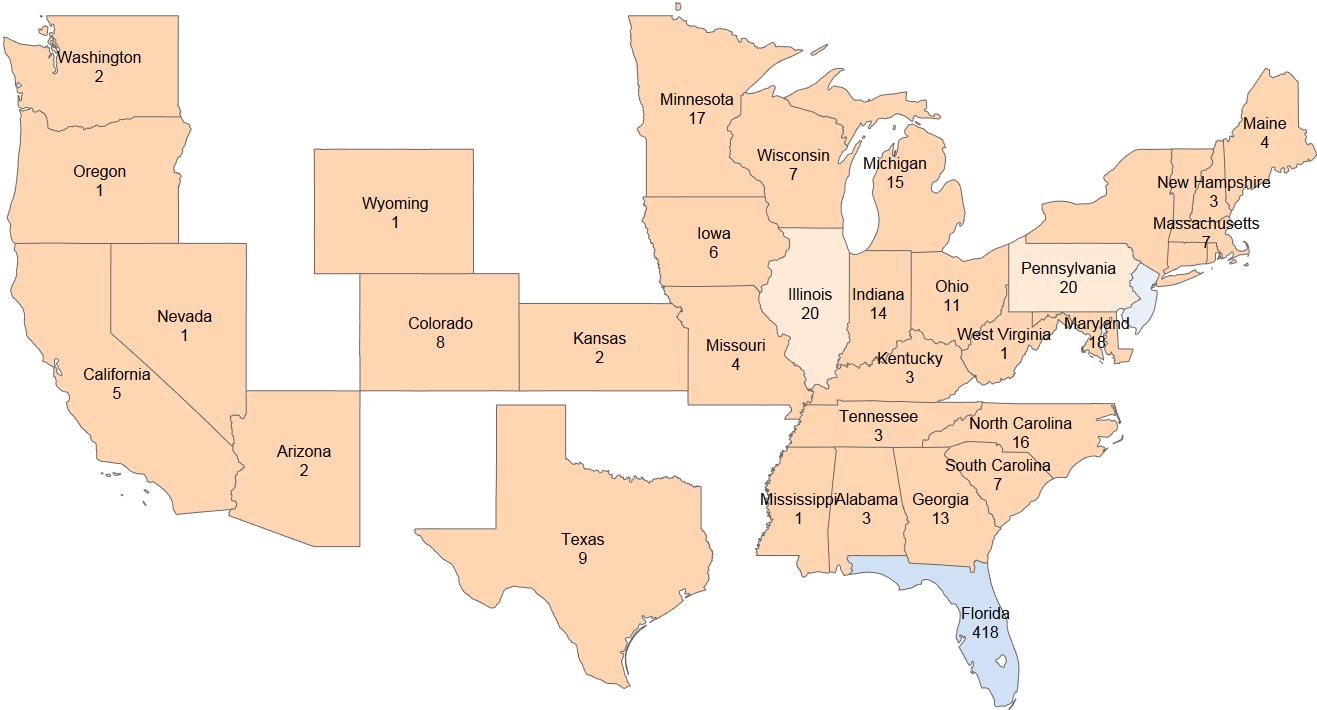

Permanent U.S. Residence of Fall 2015 New UG Day and Transfer Students Permanent U.S. Residence of All Fall 2015 Undergraduate Students >50 <10 >50 <10 29
Fall 2015 All Tradi onal Undergraduate Students from Florida
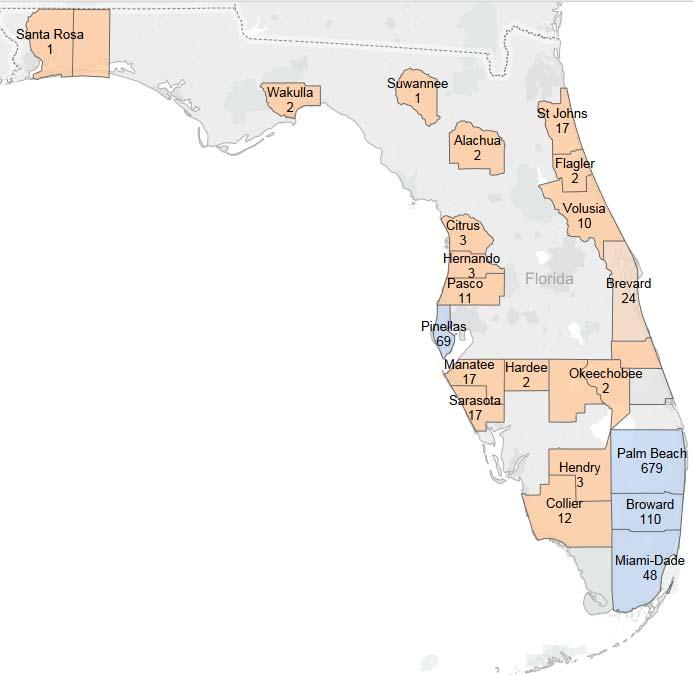
>50 <10 30
Fall 2015 Traditional Undergraduate Day Students by State including International Residence
International undergraduate day students represent approximately 5% of the total undergraduate day population.
*Students from U.S. Territories and Washington D.C.
State Count State Count Florida 1336 Missouri 10 International 104 Rhode Island 9 New York 68 Maine 8 New Jersey 65 New Hampshire 8 Illinois 64 Kentucky 8 Pennsylvania 56 Alabama 6 Maryland 44 Washington 6 Albania Michigan 43 Vermont 5 Argentina Indiana 35 Arizona 5 Bahamas Georgia 32 Oklahoma 5 Barbados Texas 30 Kansas 4 Bermuda Minnesota 30 Oregon 3 North Carolina 30 Arkansas 3 Connecticut 28 Other* 2 Massachusetts 24 Wyoming 2 Ohio 23 North Dakota 2 Colorado 22 Nevada 2 Virginia 19 Louisiana 1 Wisconsin 18 Mississippi 1 South Carolina 15 West Virginia 1 Delaware 14 South Dakota 1 Iowa 12 Hawaii 1 California 11 Total 2226 Tennessee 10
Brazil Canada Cayman Islands Chile China Colombia Costa Rica Croatia Czech Republic Dominican Republic Ecuador Ethiopia France Germany Guatemala Guyana Honduras Hong Kong
Countries
India Indonesia Italy Kenya Malaysia Mexico Mozambique New Zealand Peru Russia Saudi Arabia Slovakia South Africa Spain Sweden Syria Taiwan Uganda United Kingdom Venezuela Vietnam Zimbabwe 31
Represented (44)
Degrees Conferred between July 1, 2014 and June 30, 2015
Grand Total by Major
Award Level Nonresident alien Black or African American American Indian or Alaska Native Asian Native Hawaiian or Other Pacific Islander Hispanic Latino White Two or more Races Race/ethnicity unknown Total Associate's degree Men 0 0 0 0 0 0 0 0 0 0 Women 0 0 0 0 0 0 0 0 0 0 Total 0 0 0 0 0 0 0 0 0 0 Bachelor's degree Men 7 15 0 2 1 21 91 2 3 142 Women 16 48 0 4 1 55 217 6 6 353 Total 23 63 0 6 2 76 308 8 9 495 Master's degree Men 3 8 0 2 0 10 34 2 0 59 Women 6 32 0 2 1 29 49 4 1 124 Total 9 40 0 4 1 39 83 6 1 183 Doctor's degree- professional practice Men 0 3 0 4 1 5 9 0 1 23 Women 1 2 0 6 0 13 21 0 1 44 Total 1 5 0 10 1 18 30 0 2 67 2014-15 Grand Total Men 10 26 0 8 2 36 134 4 4 224 Grand Total Women23 82 0 12 2 97 287 10 8 521 Grand Total 33 108 0 20 4 133 421 14 12 745 Prior Year (2013-14) Grand Total Men 261 Grand Total Women 487 Grand Total 748
32
Student Participation in Experiential Learning Courses 2012-2015
Internships include any PBA course containing significant experiential learning: internship, field experience, nursing clinical, practicum, pharmacy rotation, and student teaching.
Schools and Division # % # % # % # % Arts and Sciences 13 19% 54 81% 67 10% 12 16% 62 83% 75 10% Rinker School of Business 51 51% 49 49% 100 14% 64 66% 33 34% 97 13% Graduate 0 0% 49 100% 49 49% 0 0% 33 100% 33 34% Undergraduate 51 100% 0 0% 51 51% 64 100% 0 0% 64 66% Communication and Media 28 64% 16 36% 44 6% 22 59% 15 41% 37 5% Education and Behavioral Studies 176 94% 12 6% 188 27% 159 86% 26 14% 184 25% Graduate 101 90% 11 10% 112 60% 84 86% 14 14% 98 53% Undergraduate 75 99% 1 1% 76 40% 75 87% 12 14% 86 47% Music and Fine Arts 12 36% 21 64% 33 5% 15 41% 22 59% 37 5% MacArthur School of Leadership 0 0% 111 100% 111 16% 0 0% 124 100% 124 17% Graduate 0 0% 30 100% 30 27% 0 0% 37 100% 37 30% Undergraduate 0 0% 81 100% 81 73% 0 0% 87 100% 87 70% Ministry 23 48% 25 52% 48 7% 27 52% 25 48% 52 7% Nursing 42 100% 0 0% 42 6% 49 100% 0 0% 49 7% Pharmacy 69 100% 0 0% 69 10% 77 100% 0 0% 77 11% Subtotal: Undergraduate Division 244 59% 198 69% 442 63% 264 62% 223 73% 487 67% Subtotal: Graduate Division 170 41% 90 31% 260 37% 161 38% 84 27% 245 33% Grand Total 414 59% 288 41% 702 32% 425 58% 307 42% 732 34% Schools and Division # % # % Arts and Sciences 19 26% 54 74% 73 10% 215 10% Rinker School of Business 63 61% 40 39% 103 14% 300 14% Graduate 0 0% 40 100% 40 39% 122 41% Undergraduate 63 100% 0 0% 63 61% 178 59% Communication and Media 41 85% 7 15% 48 6% 129 6% Education and Behavioral Studies 176 81% 40 19% 216 29% 588 27% Graduate 99 93% 8 7% 107 50% 317 54% Undergraduate 77 71% 32 29% 109 50% 271 46% Music and Fine Arts 7 25% 21 75% 28 4% 98 4% MacArthur School of Leadership 20 17% 96 83% 116 16% 351 16% Graduate 0 0% 36 100% 36 31% 103 29% Undergraduate 20 25% 60 75% 80 69% 248 71% Ministry 32 57% 24 43% 56 7% 156 7% Nursing 41 100% 0 0% 41 5% 132 6% Pharmacy 62 93% 5 7% 67 9% 213 10% Subtotal: Undergraduate Division 300 65% 198 69% 498 67% 1427 65% Subtotal: Graduate Division 161 35% 89 31% 250 33% 755 35% Grand Total 461 62% 287 38% 748 34% 2182 60% 2013-14 2014-15 Grand Total # Grand Total % Subtotal %
No Internship Subtotal # Subtotal % Internship No Internship Subtotal # Internship No Internship Subtotal # Subtotal % Internship 2012-13 33
Cohort Default Rate Comparison
* Source: U.S. Department of Education
The Financial Aid Office continues to see success in the use of the American Student Assistance $ALT program. This financial literacy program aids current students and alumni in various ways, from finding scholarships to loan repayment options. In combination with the efforts of the Financial Aid Office and trusted partner $ALT, PBA continues to lower its student loan default rate. The most recent release of the PBA 3-year Cohort Default Rate returned at 5.6%. This is down from 6% in the previous year.
12.0% 9.1% 6.0% 5.6% 13.4% 14.7% 13.7% 11.8% 7.5% 8.2% 7.0% 6.8% 2009 2010 2011 2012 PBA 3 YR Cohort Default Rate National (All) 3 YR Default Rate* National (Private) 3 YR default Rate* 34

901 S. Flagler Drive P.O. Box 24708 West Palm Beach, FL 33416-4708 561-803-2000 www.pba.edu
